Author Contributions
Conceptualization, R.G.-S.; methodology, R.G.-S. and F.G.-C.; validation, F.G.-C., N.M.-G. and F.K.; formal analysis, R.G.-S.; investigation, R.G.-S., F.G.-C., N.M.-G., I.R., A.L., I.M. and J.I.; data curation, N.M.-G., F.K. and J.I.; writing—original draft preparation, R.G.-S.; writing—review and editing, R.G.-S., F.G.-C., C.P.-V. and M.V.; visualization, J.I., F.K., C.P.-V. and A.T.; supervision, R.G.-S.; project administration, R.G.-S.; funding acquisition, R.G.-S. All authors have read and agreed to the published version of the manuscript.
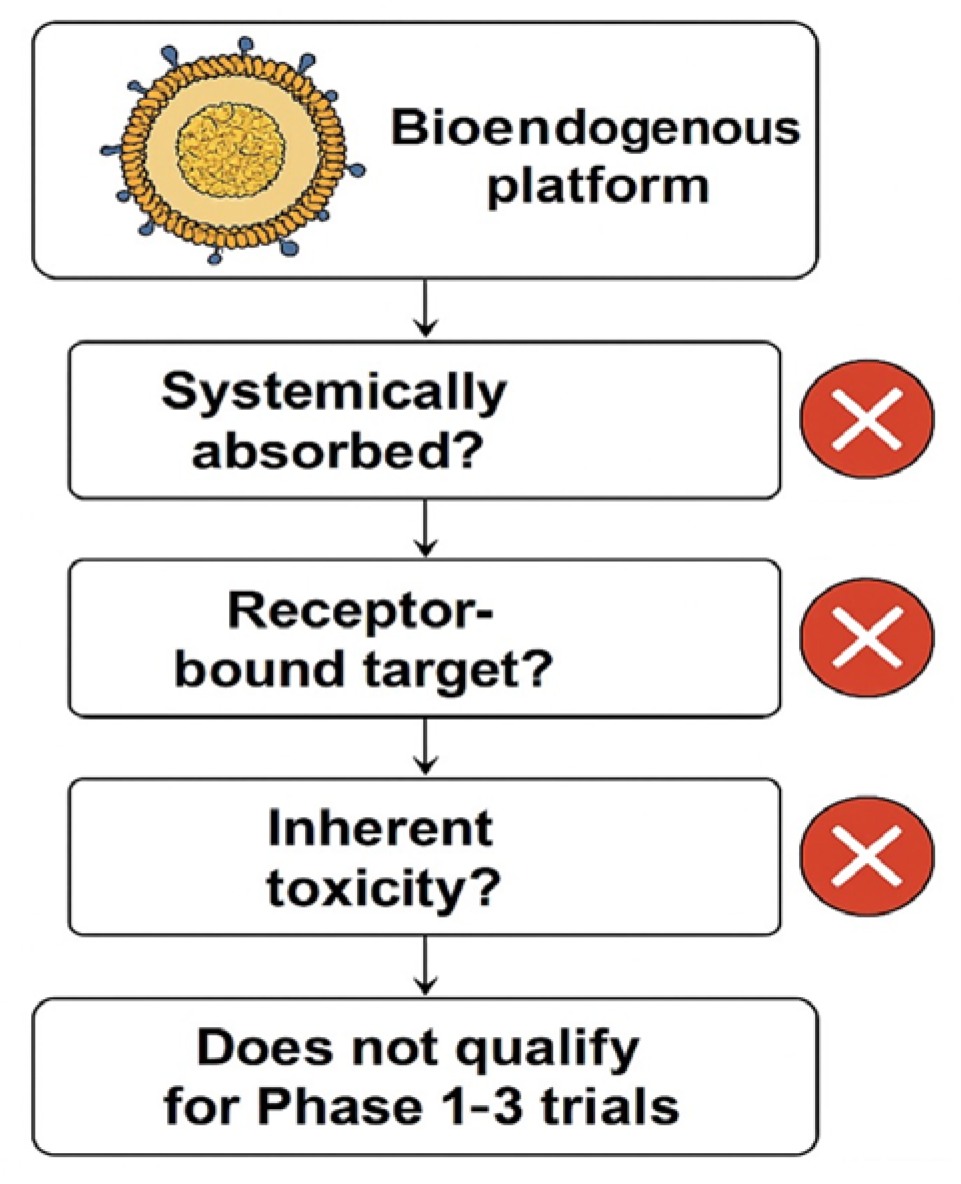
Figure 1.
This exclusion logic flowchart demonstrates why the evaluated bioendogenous platform does not qualify for Phase 1–3 clinical trials. The decision points highlight that this vesicle-based system (1) is not systemically absorbed; (2) lacks a pharmacodynamic or receptor-bound target; and (3) presents no inherent toxicity requiring human safety testing (cross-mark symbols indicate a negative outcome at each step).
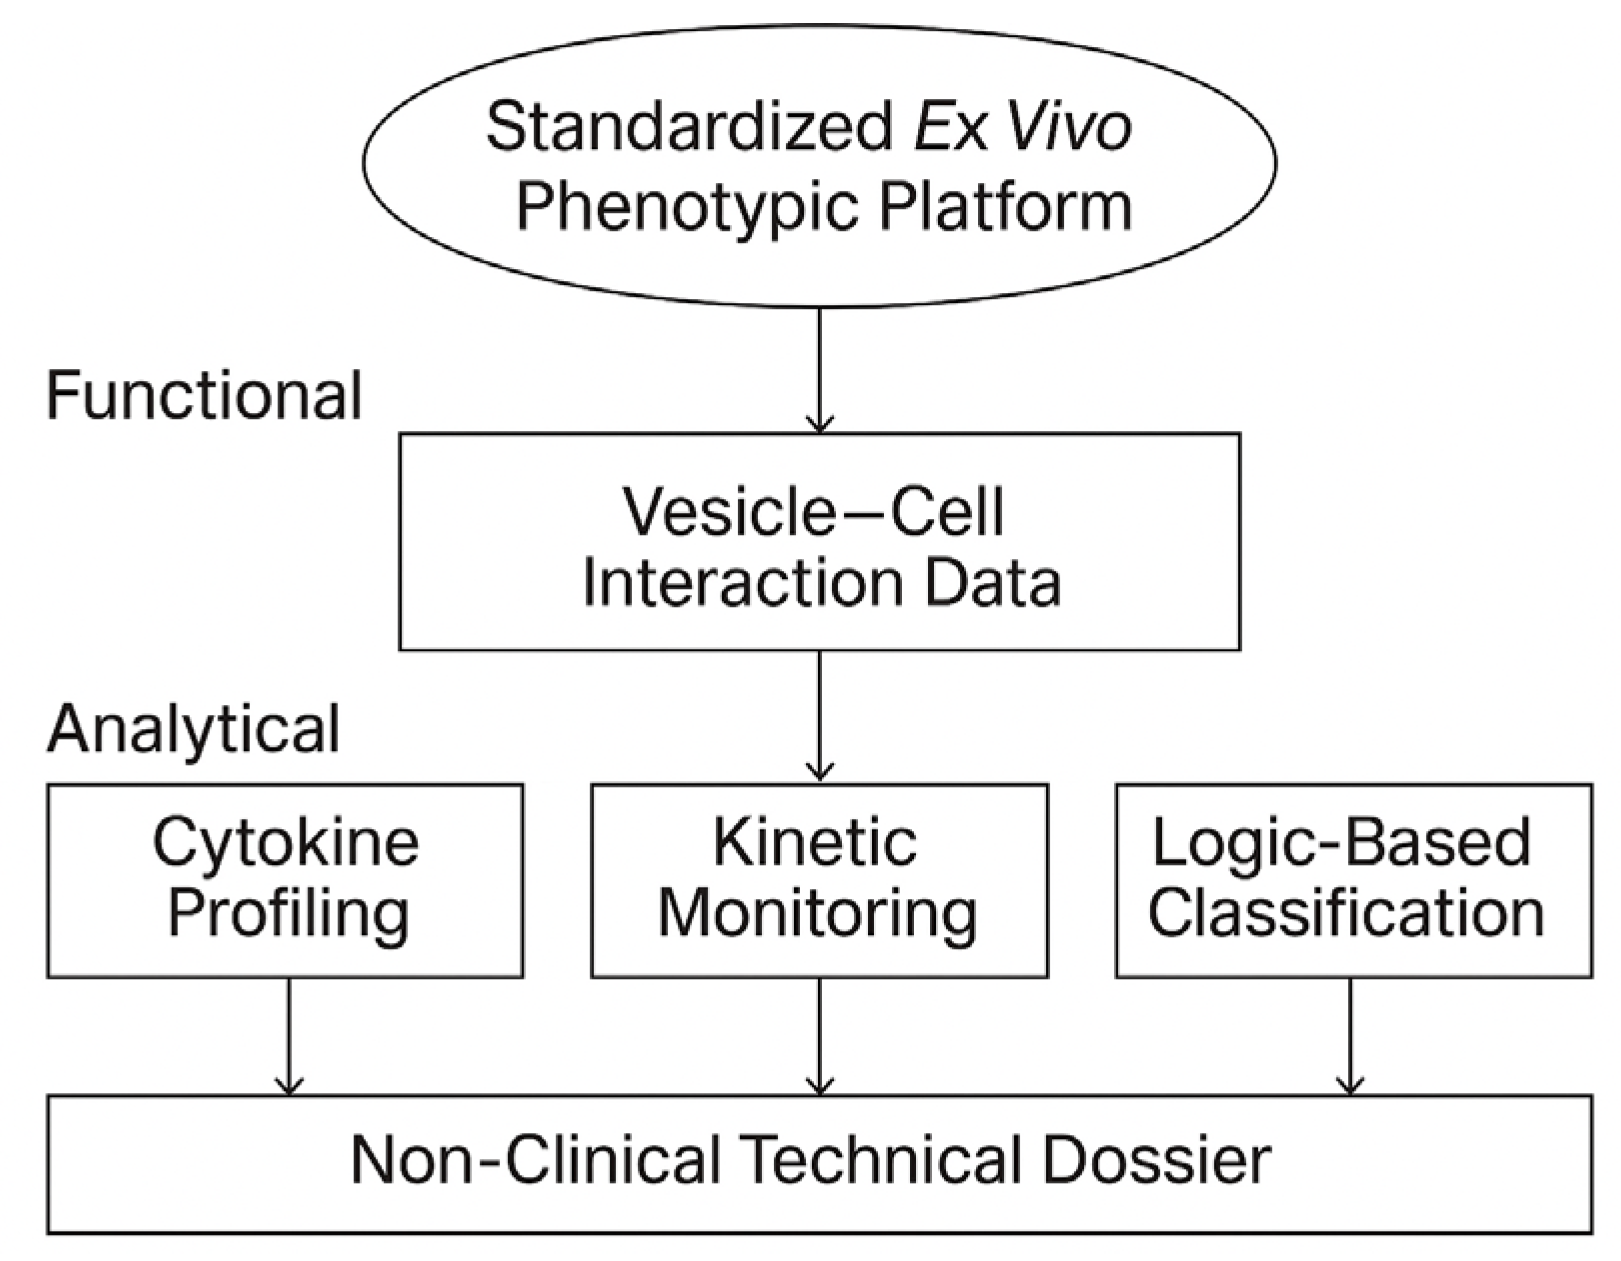
Figure 2.
Scope and technical layers of the STIP platform. The STIP system integrates phenotypic readouts, cytokine analysis, and kinetic profiling into a logic-based classification model, generating non-clinical technical dossiers compatible with regulatory frameworks such as CTD Module 5.3 and SAP. This visual summarizes the platform’s three operational layers—functional, analytical, and regulatory—and illustrates STIP’s role as a non-pharmacodynamic documentation system.
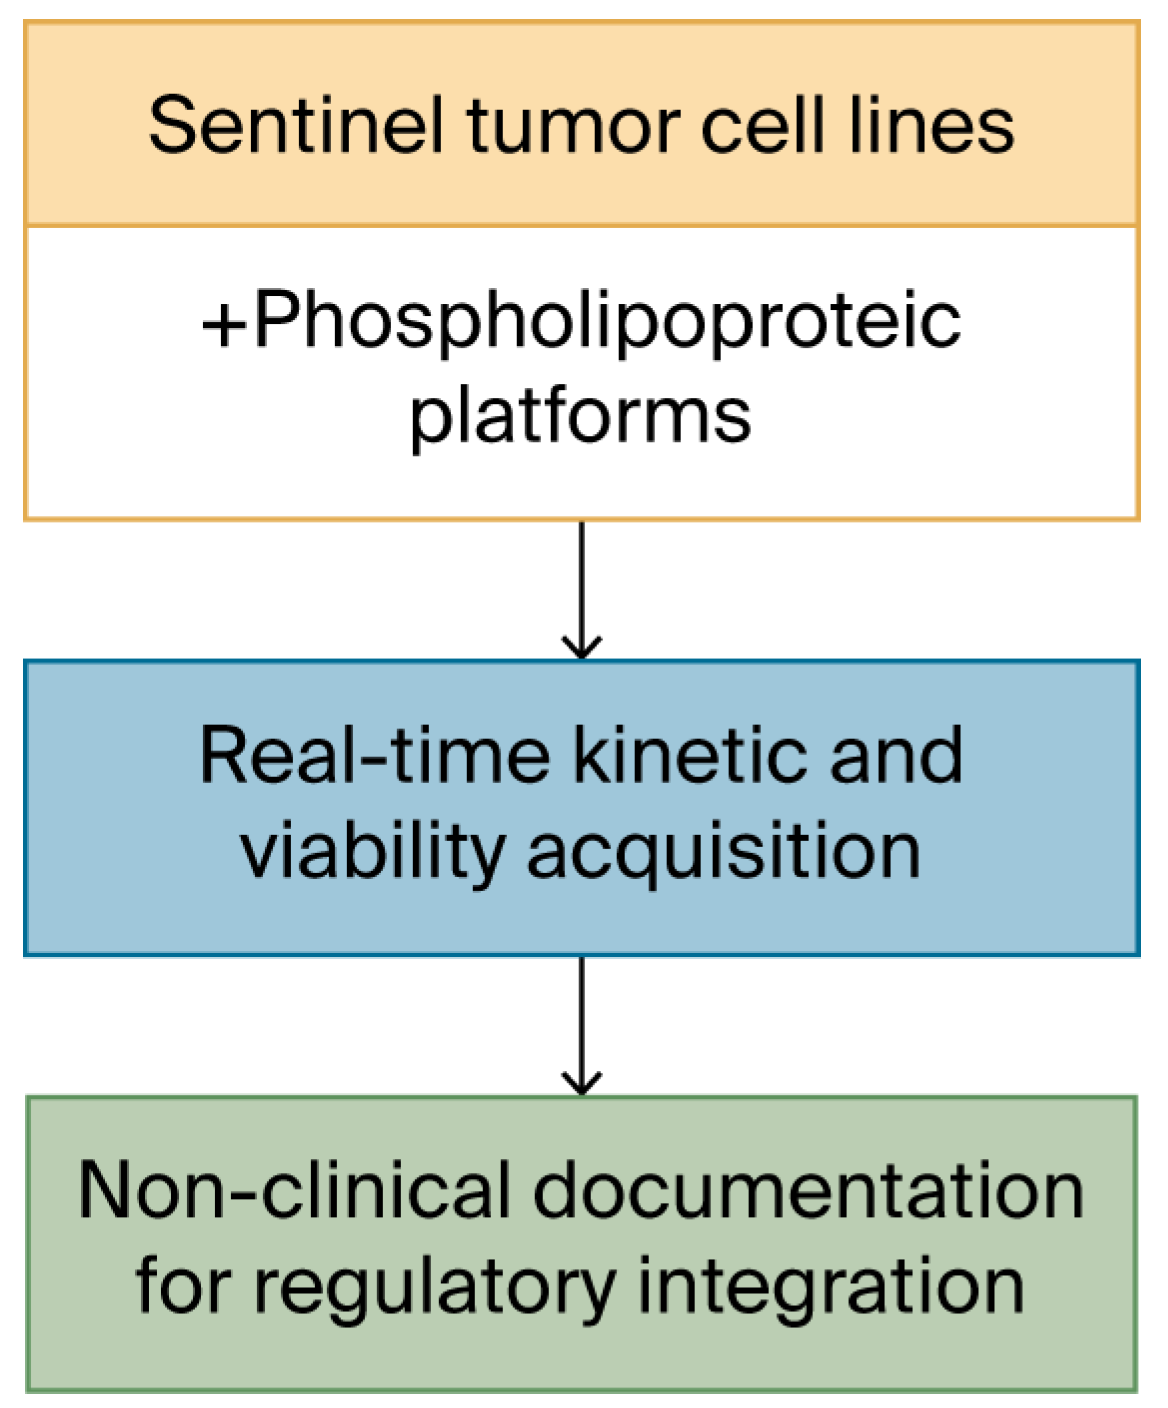
Figure 3.
Schematic workflow of the kinetic acquisition protocol. Visual outline of the procedural steps involved in the 48 h ex vivo assay. Sentinel cell lines are seeded in imaging-compatible plates and exposed to vesicular materials prepared under defined biophysical parameters. Real-time monitoring is conducted under constant conditions using an automated imaging platform, producing sequential confluence and morphology data. The focus of the workflow is on optical quality, procedural repeatability, and cross-line consistency. No classification or biological interpretation is applied at this stage.
Figure 4.
Fluorescence-based viability monitoring under ex vivo imaging conditions. The diagram illustrates the detection of membrane-compromised cells using a non-invasive fluorescent probe. The left panel shows a culture well containing cells exposed to phospholipoproteomic platforms, one of which exhibits localized green fluorescence. The right panel depicts a computer screen visualizing the corresponding fluorescence heatmap, used to confirm signal stability and culture integrity throughout the assay. Green signals indicate fluorescence from membrane-compromised cells, whereas non-fluorescent cells remain intact. This integration supports viability assessment without disrupting the kinetic observation workflow.
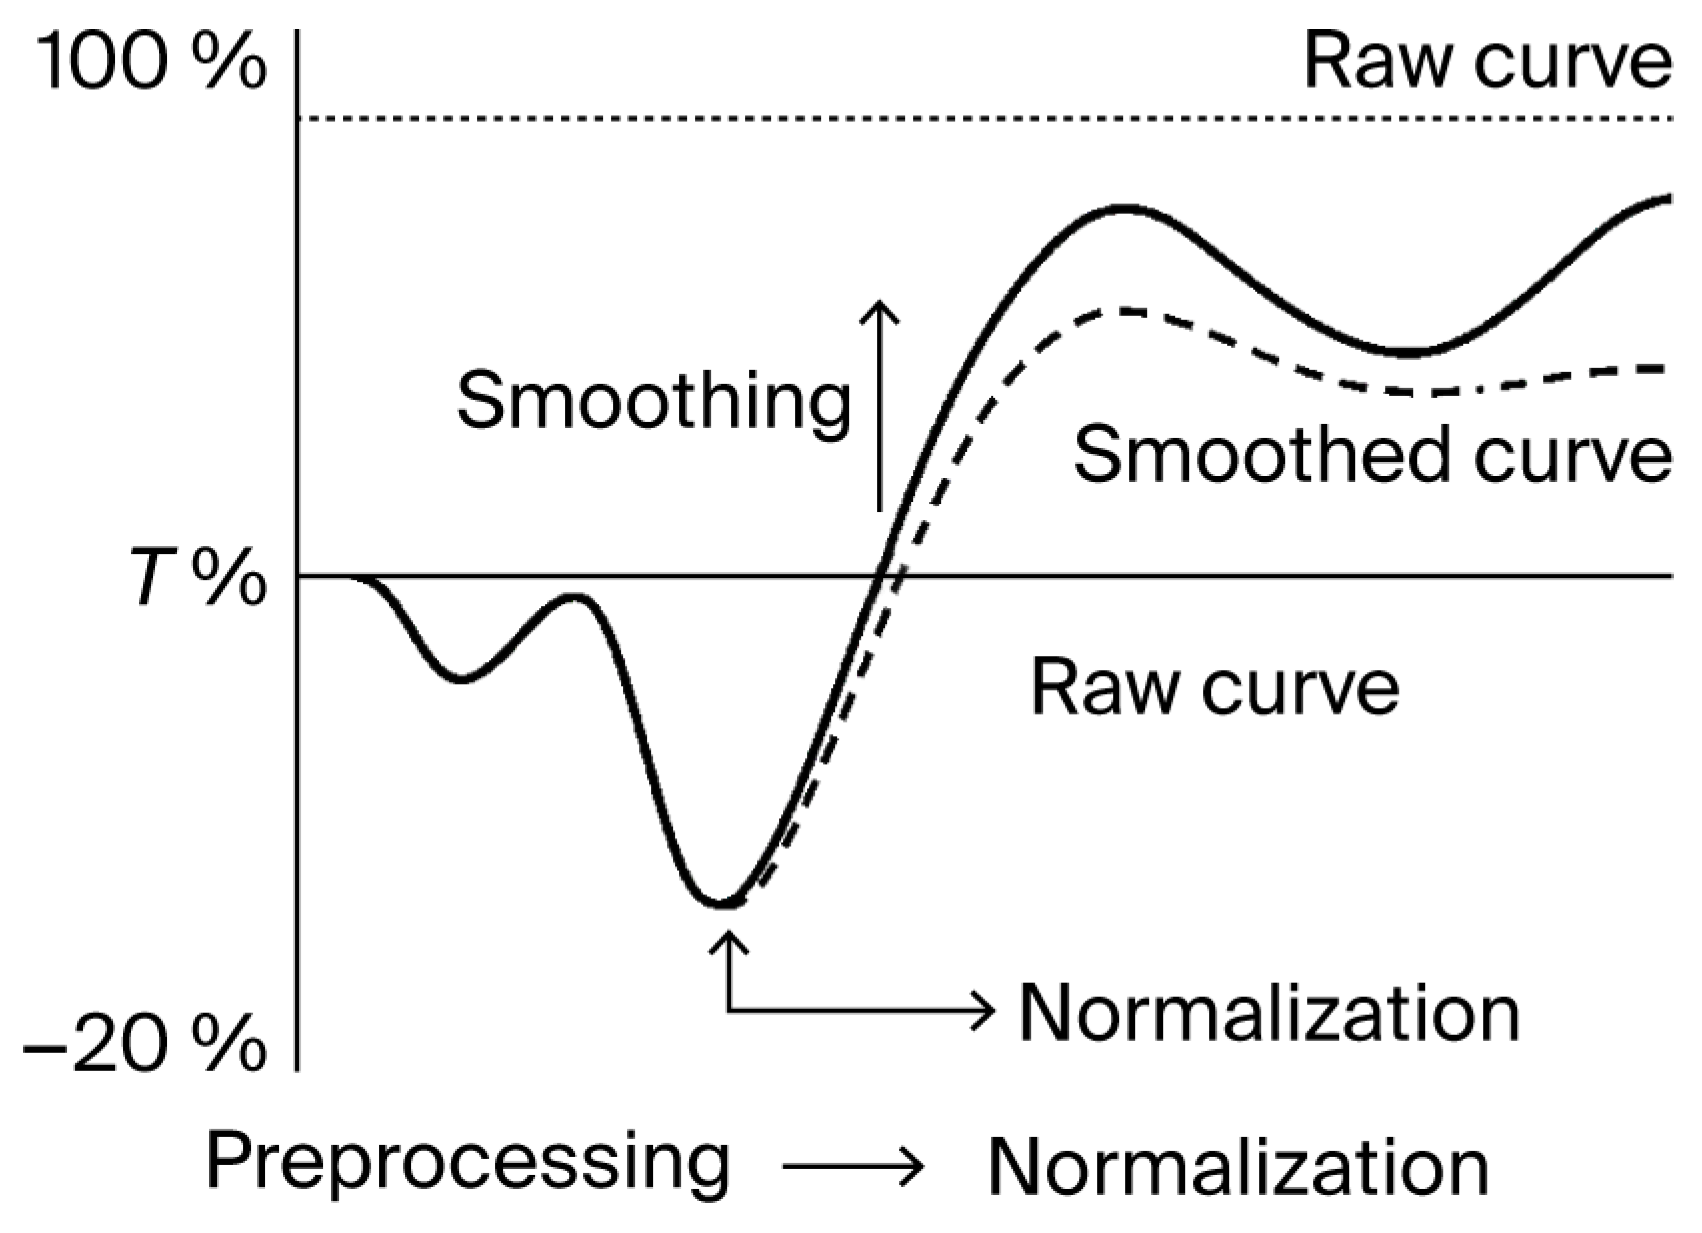
Figure 5.
Normalization and smoothing of kinetic confluence data. Illustration of the two-step preprocessing workflow applied to kinetic imaging datasets. Raw curves are normalized to the initial baseline (T0), followed by smoothing using a moving average function. This procedure reduces noise without distorting the overall trajectory, supporting consistent signal tracking across replicates. The solid line represents the raw curve, while the dashed line represents the smoothed curve.
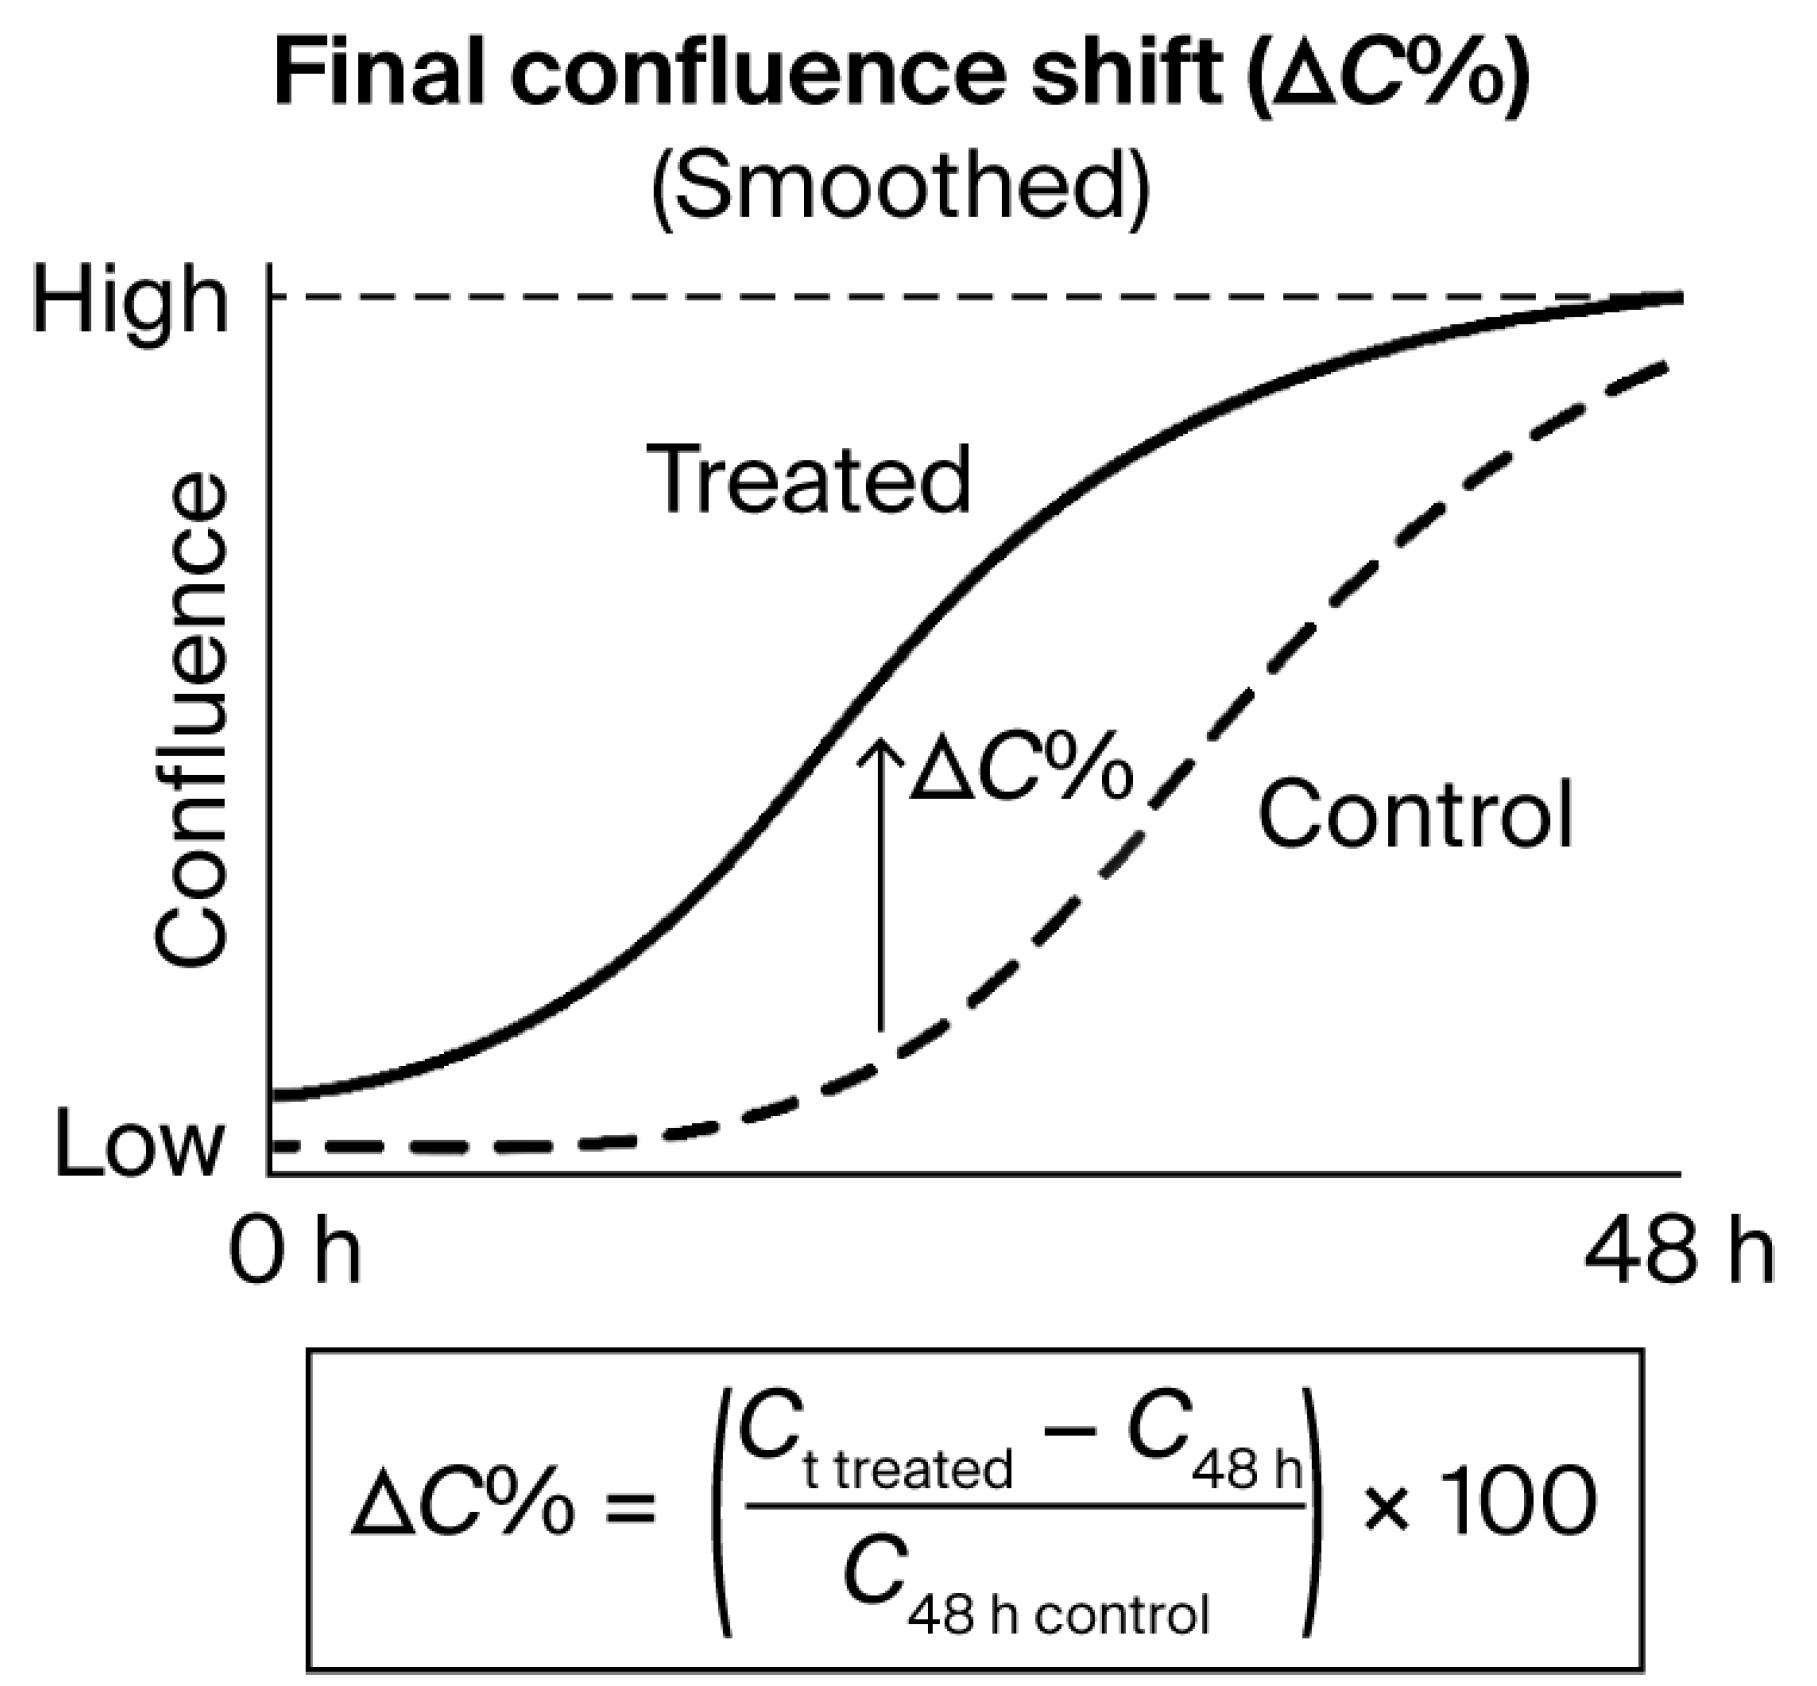
Figure 6.
Final confluence shift (ΔC%) as a quantitative metric derived from time-lapse curves. Illustrative example of confluence evolution over 48 h in treated versus control conditions.
Figure 6.
Final confluence shift (ΔC%) as a quantitative metric derived from time-lapse curves. Illustrative example of confluence evolution over 48 h in treated versus control conditions.
Figure 7.
Batch-level multimetric registry for vesicle–cell assays. Table and dot-plot example illustrating the structure of multivariable documentation used to support inter-batch reproducibility and technical consistency. Metrics such as ΔC%, AUC, log-phase slope, cumulative viability signal, and secretomic levels are reported in raw values and stored without aggregation or scoring. No interpretative logic or classification thresholds are applied.
Figure 8.
Immunophenotypic decision tree for functional classification. Schematic representation of the decision-making logic used in the STIP system to assign functional categories—Stimulatory, Inhibitory, or Neutral—to phospholipoproteomic platforms. The tree integrates kinetic divergence, sustained proliferation patterns, and secretome analysis—specifically the IFN-γ/IL-10 ratio—to support objective classification under standardized ex vivo conditions. Red diamonds indicate decision points, while blue rectangles indicate outcome categories.
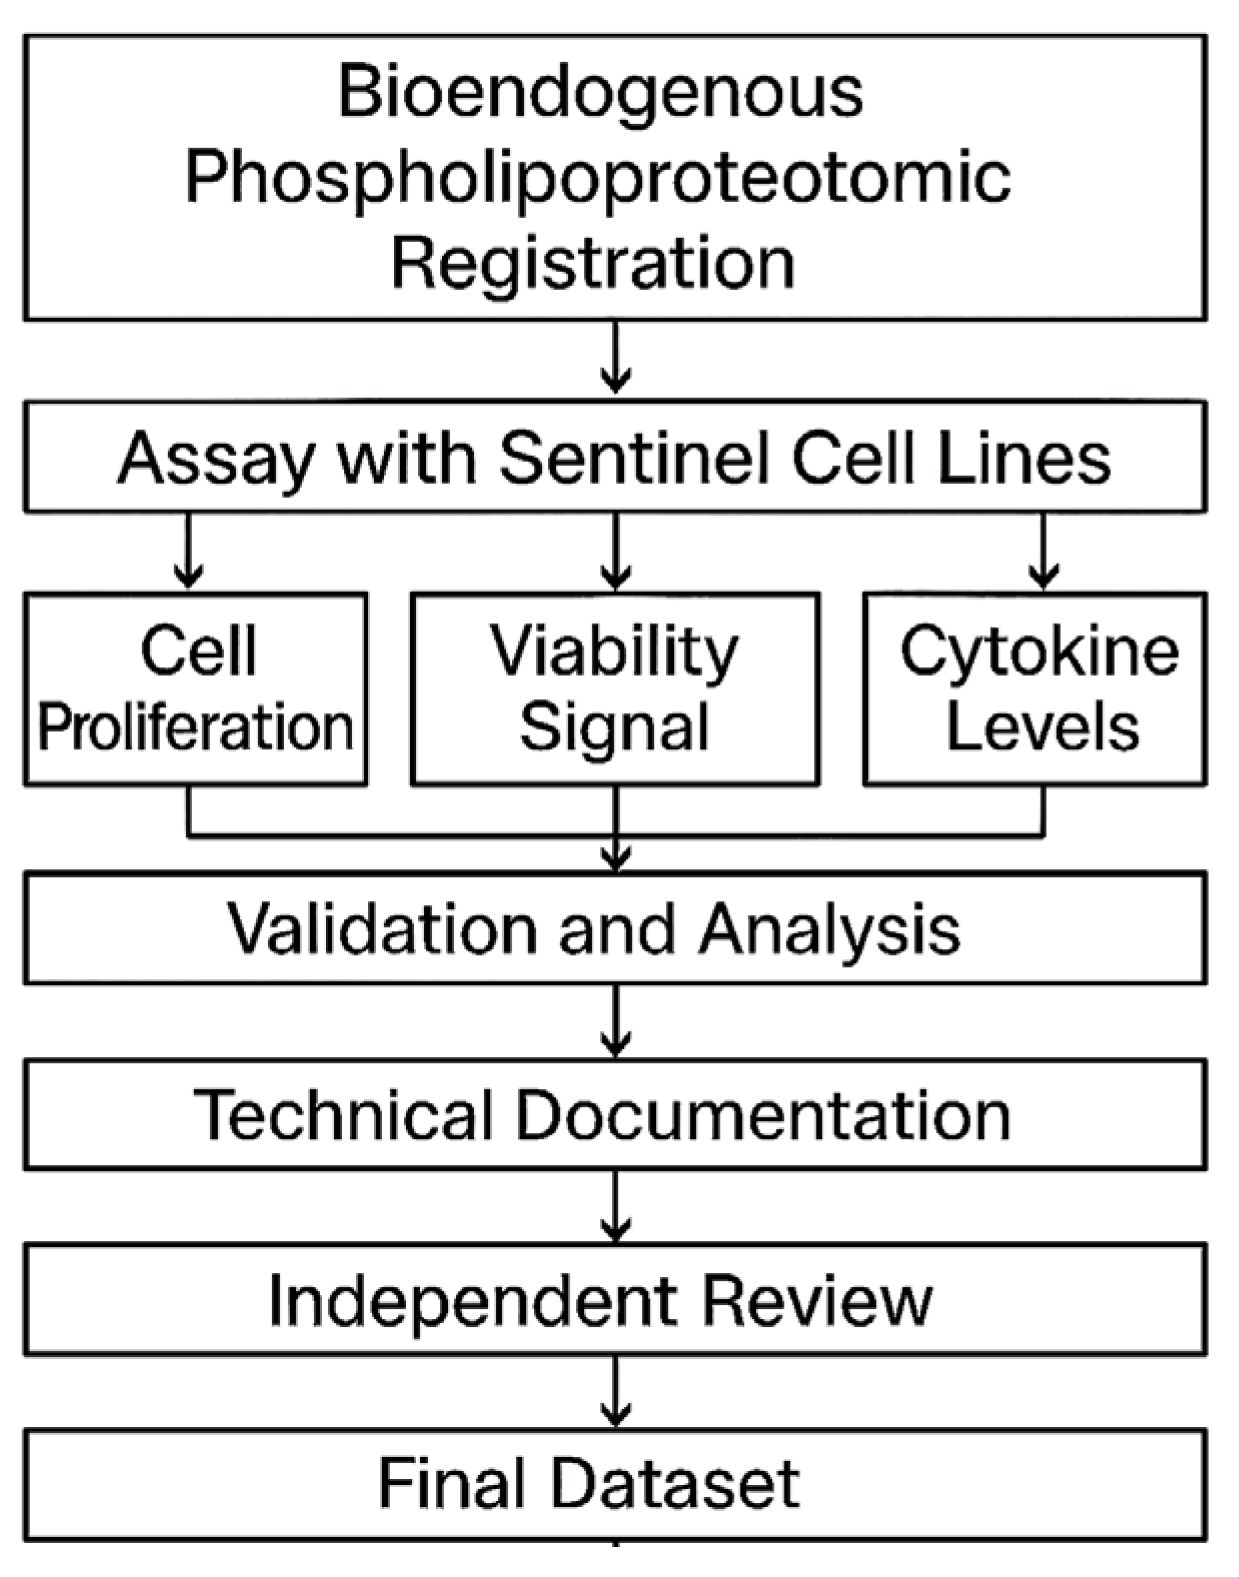
Figure 9.
Workflow diagram for STIP-based evaluation and documentation. The flowchart outlines the complete process for assessing phospholipoproteomic platforms in sentinel tumor cell lines. The workflow begins with vesicle registration, followed by ex vivo assays capturing cell proliferation, viability signals, and cytokine levels. Outputs are validated, analyzed, and compiled into standardized technical dossiers. Each dataset undergoes independent review before being archived as a regulatorily traceable unit suitable for integration into CTD Module 5.3, SAP frameworks, or institutional documentation pipelines.
Figure 10.
Progressive morphological evolution of A375 cells exposed to the phospholipoproteomic platform. Representative image sequences showing real-time confluence changes in A375 cells at 0, 12, 30, and 48 h post-exposure. Images were acquired at 10× magnification (scale bar = 100 µm). Yellow segmentation overlays indicate automated boundary detection, while the underlying green background corresponds to the phase-contrast image of the culture well. The sequence illustrates a gradual increase followed by deceleration and plateau, consistent with a Type II STIP trajectory. No cytotoxicity or detachment was observed. This response pattern was reproducibly observed across batches and aligns with suppressive but non-lethal vesicle–cell interactions under standardized assay conditions.
Figure 11.
This comparative flowchart illustrates two validated regulatory pathways leading to product commercialization. On the left, the classical NDA model proceeds through Phase 1, 2, and 3 clinical trials, each involving human exposure, pharmacodynamic claims, and endpoint monitoring. On the right, the bioendogenous platform follows a non-clinical route through STIP—Structured Traceability and Immunophenotypic Platform—where functional behavior is documented using ΔC%, viability, and cytokine-based metrics under ex vivo conditions. Both routes converge at the same regulatory goal: commercialization. STIP enables this outcome without dosing, toxicity risk, or systemic activation, offering a technically robust alternative suitable for regulatory models that accept deferred clinical activation based on non-interventional evidence.
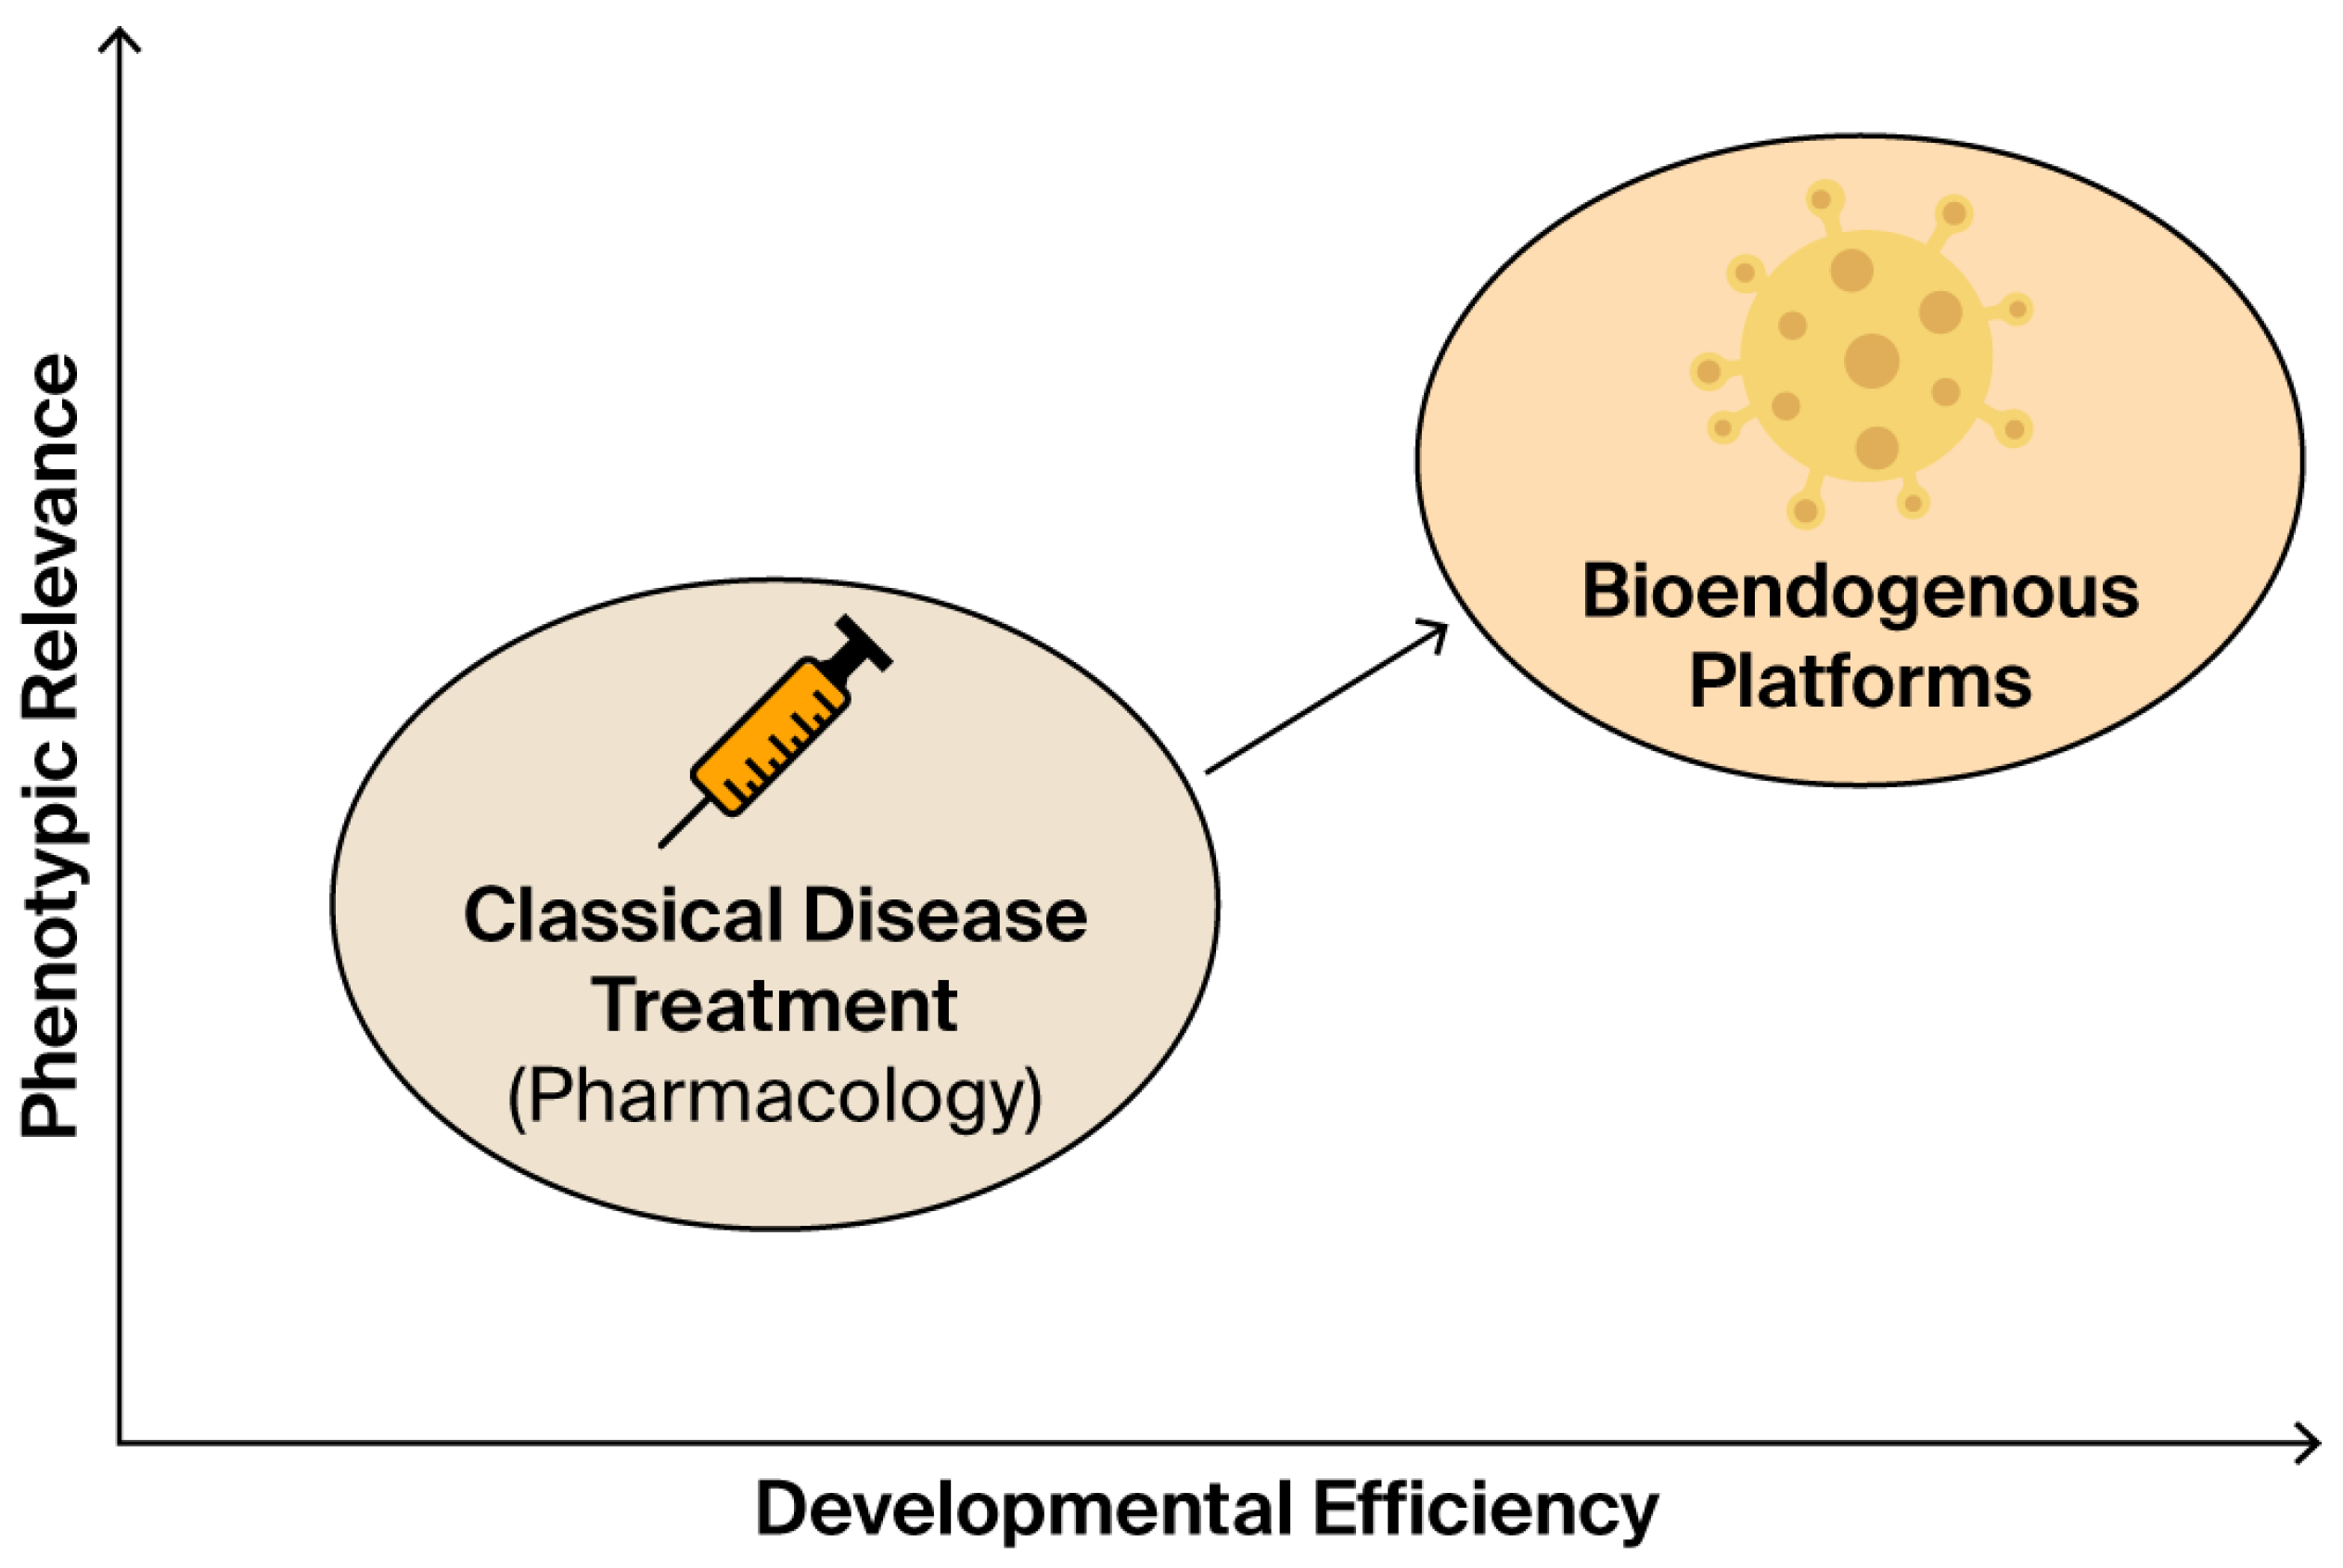
Figure 12.
This conceptual diagram contrasts classical pharmacological treatment with emerging bioendogenous platforms in terms of developmental efficiency (x-axis) and phenotypic relevance (y-axis). Classical drugs are grounded in systemic pharmacokinetics, often requiring prolonged clinical trials and receptor-based validation. In contrast, bioendogenous vesicle platforms operate through structural compatibility, enabling rapid documentation of functional behavior (e.g., ΔC%, viability, cytokines) without systemic burden. The diagram illustrates how this shift in paradigm enables regulatory evidence to emerge from high-efficiency, biologically grounded models such as STIP, delivering meaningful data for non-clinical decision-making.
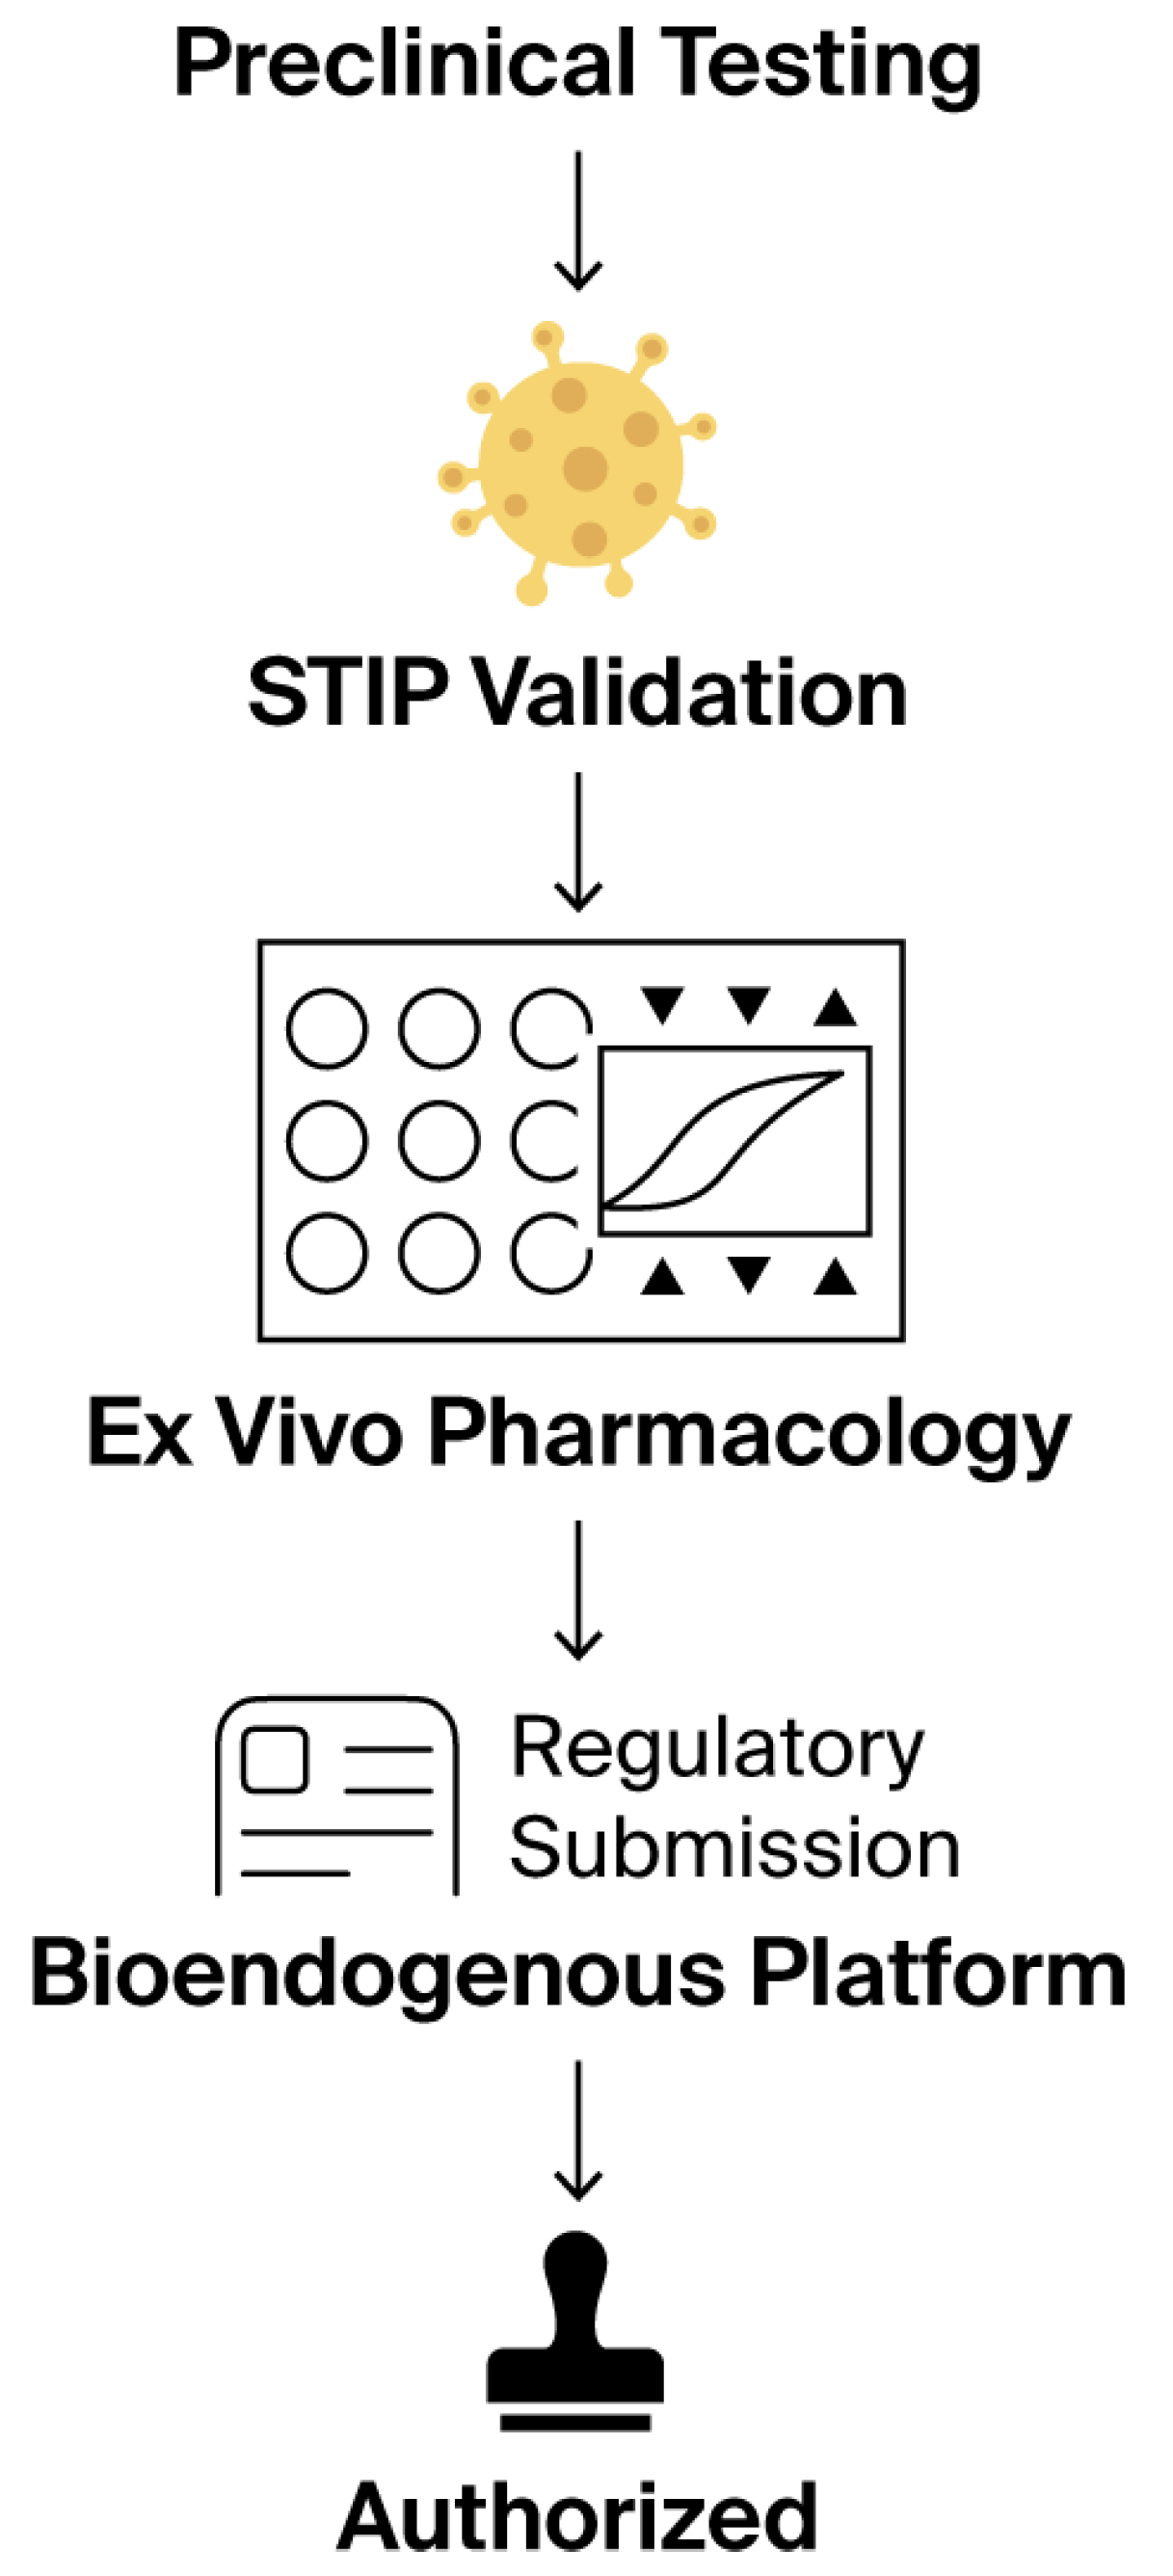
Figure 13.
This stepwise regulatory flowchart outlines the non-clinical validation journey of a bioendogenous platform under the ICT-EP framework. The process begins with standard preclinical testing, transitions through STIP validation—where ex vivo phenotypic metrics, such as ΔC% and viability, are captured—then passes through ex vivo pharmacology using standardized, non-destructive assays. This structured evidence is compiled into a regulatory submission package that explicitly recognizes the product’s non-pharmacodynamic nature. The pathway concludes with authorization, emphasizing that approval is possible without systemic exposure, clinical endpoints, or human trials, when proportionate documentation is supplied through harmonized, reproducible non-clinical platforms. Symbols within the Ex Vivo Pharmacology panel represent assay wells (circles), experimental endpoints (triangles), and a representative response curve (center).
Table 1.
Batch-level metrics summary.
Table 1.
Batch-level metrics summary.
| Batch | ΔC% | AUC | Log-Phase Slope | Cumulative Viability | Secretomic Level (pg/mL) |
|---|
| FV-001 | +6.8 | 3.25 | 0.024 | 6.4% | 20.7 |
| FV-002 | +3.9 | 8.63 | 0.028 | 12.7% | 135.2 |
| FV-003 | +3.2 | 10.12 | 0.072 | 16.7% | 8.8 |
| FV-004 | +19.7 | 3.56 | 0.067 | 21.7% | 18.4 |
| FV-005 | +22.7 | 6.48 | 0.072 | 6.4% | 29.7 |
Table 2.
Vesicle–cell interaction map (representative output view). Grid representation of vesicle–cell interaction outcomes in the kinetic profiling platform. Each entry denotes a single assay performed according to a standardized ex vivo protocol. Symbols correspond to generalized documentation categories applied during internal quality recording: ▲ indicates increased kinetic output, ▼ indicates decreased output, and — indicates no significant shift. These symbols are used exclusively as internal documentation markers and do not represent functional classification or therapeutic effect. No therapeutic inference or biological interpretation is assigned.
| Vesicle | BEWO | A375 | BEWO (rep) |
|---|
| FV-001 | ▲ | ▼ | ▼ |
| FV-002 | ▼ | — | ▼ |
| FV-003 | — | ▼ | ▼ |
| FV-004 | ▲ | ▼ | — |
| FV-005 | ▼ | — | ▼ |
Table 3.
Multimetric output per vesicle–cell assay unit. Values are reported independently and not aggregated. The “Notes” column reflects procedural flags used internally, without interpretive weight.
Table 3.
Multimetric output per vesicle–cell assay unit. Values are reported independently and not aggregated. The “Notes” column reflects procedural flags used internally, without interpretive weight.
| Vesicle Fraction | Cell Line | Δ Confluence (%) | ΔT (h) | Death Signal (%) | IFN-γ/IL-10 Ratio | Notes |
|---|
| FV-001 | BEWO | +34.1 | 10.2 | 1.1 | 2.1 | Stable |
| FV-002 | A375 | −28.7 | 12.4 | 2.8 | 5.9 | Stable |
| FV-003 | MCF-7 | +1.6 | — | 0.9 | 1.0 | Low shift |
| FV-004 | BEWO | +31.8 | 11.0 | 1.4 | 2.5 | Stable |
| FV-005 | A375 | −29.5 | 13.1 | 2.6 | 6.1 | Stable |
Table 4.
Cross-condition metric summary for internal documentation.
Table 4.
Cross-condition metric summary for internal documentation.
| Metric | Range Observed | Inter-Batch CV% | Internal QC Threshold |
|---|
| Δ Confluence (%) | −29.5% to +34.1% | <12% | ±5% |
| Divergence (ΔT, h) | 10.2 to 13.1 | <10% | 2 h |
| Death Signal (%) | 0.9% to 2.8% | <15% | 3% |
| IFN-γ/IL-10 Ratio | 1.0 to 6.1 | <14% | n/a |
Table 5.
Comparison between clinical trial models and ex vivo functional protocols.
Table 5.
Comparison between clinical trial models and ex vivo functional protocols.
| Criterion | Classical Clinical Trial | Ex Vivo Functional Protocol |
|---|
| Systemic absorption required? | Yes | No |
| Defined pharmacological dose? | Yes (e.g., Cmax, ED50) | No (non-systemic) |
| Therapeutic intent? | Yes | Not applicable |
| Generates adverse events? | Yes (monitored) | No (no systemic exposure) |
| Requires patient recruitment? | Yes | No (cell models only) |
| Uses placebo/randomization? | Yes | No |
| Provides functional evidence directly? | Indirect or endpoint-dependent | Yes (real-time metrics) |
| Document compatibility? | No (efficacy-based) | Yes (structure-function compatibility) |
| Allows batch comparability? | Indirect via PK/PD | Direct via reproducible metrics |
| CTD Module 5.3 integrable? | Only with human trial data | Yes (non-clinical documentation) |
| Reproducible without human subjects? | No | Yes |
Table 6.
Technical comparison: clinical trial vs. ex vivo functional documentation.
Table 6.
Technical comparison: clinical trial vs. ex vivo functional documentation.
| Criterion | Classical Clinical Trial | Ex Vivo Functional Protocol |
|---|
| Requires systemic absorption? | Yes | No |
| Defines pharmacological dose? | Yes (ED50, Cmax, LD50) | No (non-absorptive) |
| Seeks therapeutic effect? | Yes | No |
| Evaluates adverse events? | Yes | Not applicable |
| Requires human recruitment? | Yes (patients) | No (cell-based) |
| Uses randomization/placebo? | Yes | No |
| Provides real-time functional data? | Often indirect | Yes (curve, viability, cytokines) |
| Measures structural compatibility? | No | Yes |
| Enables batch comparability? | Indirect (via PK/PD) | Yes (technical replicates) |
| Compatible with CTD Module 5.3? | Only if trial is conducted | Yes (non-clinical evidence) |
| Reproducible without patients? | No | Yes |
Table 7.
Functional equivalence of evidence: drug trials vs. structural formulations.
Table 7.
Functional equivalence of evidence: drug trials vs. structural formulations.
| Expectation | Clinical Trial (Drug) | Functional Documentation (Non-Drug) |
|---|
| Confirms batch consistency | Pharmacokinetics, patient arms | Cross-line kinetic and cytokine reproducibility |
| Documents product identity | Labeling, source control | Structural profiling, proteomic fingerprinting |
| Demonstrates mechanism of effect | Dose–response, receptor binding | Indirect through reproducible behavior |
| Validates safety | Adverse events, Phase I/II | Absence of toxicity, viability signal |
| Supports regulatory review | CTD Modules 2–5 | CTD 5.3 (non-clinical, functional evidence) |
| Reproducibility across production cycles | Requires clinical lot tracking | Demonstrated via laboratory replicates |
Table 8.
Comparative documentation: clinical trials vs. functional phenotypic protocol.
Table 8.
Comparative documentation: clinical trials vs. functional phenotypic protocol.
| Key Question | Clinical Trial (Drug) | Ex Vivo Documentation (Structural Platform) |
|---|
| How is safety confirmed? | Toxicity studies, maximum tolerated dose | Absence of cytotoxicity, viability signal consistency |
| How are off-target effects ruled out? | Adverse events in patients | Full phenotypic behavior tracked under standard protocol |
| How is batch consistency demonstrated? | Bioequivalence, therapeutic response | Reproducible kinetic and cytokine metrics across batches |
| How is reliability ensured? | Pharmacokinetics and efficacy over time | Divergence pattern stability and inter-batch reproducibility |
| Is it a new chemical entity (NCE)? | Assessed by toxicology and molecular profiling | Non-NCE with traceable proteomic identity |
| Is it appropriate for use in humans? | Confirmed by clinical outcomes | Technically stable and biologically neutral in cell models |
| Is it recognized by regulators? | Via NDA or similar programs | Acceptable under non-clinical documentation modules |
Table 9.
Functional mapping of CTD sections in non-pharmacodynamic products.
Table 9.
Functional mapping of CTD sections in non-pharmacodynamic products.
| CTD Module or Section | Clinical Trial Contribution | Ex Vivo Functional Contribution |
|---|
| Module 5.3—Functional studies | Phases I–III, PK/PD, safety endpoints | Kinetics, viability, cytokine behavior, batch replication |
| 2.7.3—Efficacy summary | Clinical effect, responder rate | Stability and divergence over time in cell models |
| 2.7.4—Safety summary | Adverse events, side effects | No cytolysis or toxicity under test conditions |
| 2.6—Non-clinical pharmacology | Animal models, systemic absorption | Localized compatibility, proteic profile stability |
| Module 3—Quality information | Analytical validation, identity, impurities | FTIR, DLS, document-linked traceability |
| 1.12—Regulatory path justification | Rationale for omission or modification | Functional non-clinical file with supporting metrics |
Table 10.
Functional equivalence summary: clinical trials vs. ex vivo documentation models.
Table 10.
Functional equivalence summary: clinical trials vs. ex vivo documentation models.
| Regulatory Objective | Clinical Trial (Pharmacodynamic Drug) | Ex Vivo Functional Protocol (Non-Pharmacodynamic Formulation) |
|---|
| Demonstrates safety? | Yes, via adverse event tracking and toxicology | Yes, via absence of cytotoxicity, inflammatory signals, and death markers |
| Supports batch consistency? | Yes, through repeated trial arms and PK/PD trends | Yes, through kinetic, viability, and cytokine reproducibility |
| Provides functional data? | Yes, usually endpoint-based or indirect | Yes, with real-time kinetic curves and secretome response |
| Enables pre-use batch validation? | No, relies on post-release response | Yes, via standardized cell-line interaction profiles |
| Reproducible without patient data? | No, requires clinical enrollment | Yes, using validated sentinel lines under controlled conditions |
| Compatible with CTD Module 5.3? | Yes, as part of clinical data | Yes, under non-clinical functional documentation |
| Enables structural compatibility assessment? | Not as a primary endpoint | Yes, captured directly through ex vivo interaction |
| Recognized by regulators? | Yes, in standard therapeutic routes | Yes, in exempt or proportional documentation pathways |
