Abstract
Background and Aims: Multiple genetic variants have been associated with disease prevalence and outcomes in middle-aged people with metabolic dysfunction-associated fatty liver disease (MAFLD). However, genetic studies in older adults have been lacking. We aimed to understand their clinical relevance in healthy older persons. Methods: A secondary analysis of the ASPREE (ASPirin in Reducing Events in the Elderly) randomized trial involving community-dwelling older adults ≥ 70 years without prior cardiovascular disease events or life-limiting illness at enrolment. The Fatty Liver Index (FLI) was used to identify MAFLD at baseline. We assessed the associations between six previously reported MAFLD-associated genetic variants with prevalent MAFLD at baseline, and the associations of these variants with cardiovascular disease events and all-cause mortality. Results: A total of 8756 participants with genetic data were stratified according to the FLI, with 3310 having MAFLD at baseline. The follow-up was for a median of 8.4 (IQR 7.3–9.5) years. Variants in two genes (GCKR and HSD17B13) were associated with prevalent MAFLD (p < 0.05); PNPLA3, TM6SF2, LYPLAL1, and MBOAT7 were not. PNPLA3, TM6SF2, HSD17B13, GCKR, and LYPLAL1 were not associated with major adverse cardiovascular events (MACEs) or mortality in the overall cohort or in participants with MAFLD during the follow-up (all p > 0.05). Within the MAFLD group, homozygosity for the rs641738 C > T variant in the MBOAT7 gene was associated with a reduced risk of MACEs (HR 0.68 [95% CI 0.48–0.97]), but not all-cause mortality (HR 1.14 [95% CI 0.89–1.47]). This protective association remained significant after adjusting for multiple key covariates (aHR 0.64 [95% CI 0.44–0.92]). The results were similar when using the metabolic dysfunction-associated steatotic liver disease definition rather than MAFLD. Conclusions: The rs641738 C > T variant in MBOAT7 may confer protection against MACEs in older adults with MAFLD, independent of other clinical risk factors. Further validation using external cohorts is needed.
1. Introduction
Metabolic dysfunction-associated fatty liver disease (MAFLD) is characterized by ≥5% of hepatocytes containing fat alongside one or more of diabetes mellitus (T2DM), overweight/obesity, and/or ≥2 cardiometabolic comorbidities [1]. Previous work from our group and others has linked MAFLD with atherosclerotic cardiovascular disease (CVD) [2,3,4], liver cancer [5], and, in some studies, all-cause mortality [3,6]. These findings are of interest due to the growing prevalence of MAFLD globally [7]. However, there are discrepant findings regarding the outcomes in older adults, with some suggestions that the risks of MAFLD are attenuated in those over 70 years of age [8,9], perhaps due to survival bias.
Given the significant prevalence of MAFLD in middle-aged and older adults (30–40%) [3,10], driven in part by the rising prevalence of overweight/obesity [11] and T2DM [12], there is an increasing focus on risk-stratifying adults with MAFLD, in terms of those at greater risk of adverse health outcomes, to assist with focusing medical interventions on those most likely to benefit [13]. One proposed component of personalized risk assessment includes the evaluation of genetic variants that may predispose individuals to MAFLD [13]. While MAFLD is a polygenic disease, a multitude of individual genetic variants have been associated with the risk of MAFLD or varied related outcomes in those living with MAFLD. These variants include patatin-like phospholipase domain-containing 3 (PNPLA3) rs738409 C > G, Transmembrane 6 Superfamily Member 2 (TM6SF2) rs58542926 C > T, 17β-hydroxysteroid dehydrogenase type 13 (HSD17B13) rs72613567 T > TA, Glucokinase Regulatory Protein (GCKR) rs1260326 C > T, Lysophospholipase-Like 1 (LYPLAL1) rs12137855 C > T, and Membrane-Bound O-Acyltransferase Domain-Containing 7 (MBOAT7) rs641738 C > T [13,14,15]. Interestingly, while PNPLA3 and TM6SF2 have been associated with an increased risk of hepatic steatosis and steatohepatitis, they have also been previously associated with a reduced risk of CVD in adults [13]. However, the implications of having one of these genetic variants on outcomes in later life is understudied. It is unknown whether healthy older persons are resistant to the phenotypic impacts of these variants (i.e., an altered risk of having MAFLD), as well as whether these variants impact major clinical outcomes in older persons with MAFLD.
As such, our present study sought to examine the associations between known MAFLD-associated genetic variants and both prevalent MAFLD and key outcomes in older people. The objective of our study was to examine whether there may be a role for genetic risk stratification in predicting MAFLD development and MAFLD-related outcomes later in life. Specifically, we aimed to evaluate the prevalence and impact of previously described fatty liver disease-related genetic variants on mortality and CVD in older adults with MAFLD. Additionally, while recent Australian [16,17] and Asia–Pacific [18] guidelines use the MAFLD definition, the more recent metabolic dysfunction-associated steatotic liver disease (MASLD) [19] is used more commonly in Europe and the USA. As such, we additionally performed the same analyses for the ASPREE participants with MASLD.
2. Methods
2.1. Study Population
The study design and findings from the main ASPirin in Reducing Events in the Elderly (ASPREE) trial have been previously reported in detail [20,21,22]. We performed an analysis of the Australian participants who provided serum [23] to allow for calculation of the Fatty Liver Index (FLI) [24]. The participants from the USA were unable to be analyzed as they did not provide serum for a baseline steatotic liver disease case identification. In summary, between 2010 and 2014, ASPREE recruited 16,703 Australian participants via primary care who were aged ≥ 70 years without dementia, prior cardiovascular disease events, or a life expectancy of less than five years. The participants were randomly assigned 1:1 to 100 mg of enteric-coated aspirin or matched placebo with an annual follow-up and medical records review (Figure 1).
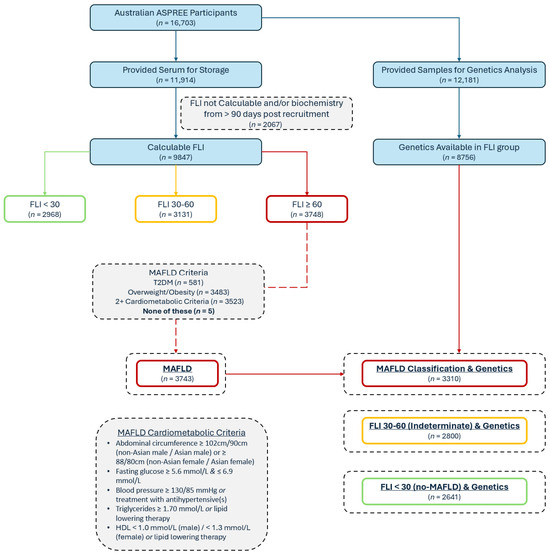
Figure 1.
Baseline participant classification flow diagram; FLI = Fatty Liver Index; MAFLD = metabolic dysfunction-associated fatty liver disease.
The primary outcome of the ASPREE trial was disability-free survival. Major adverse cardiovascular events (MACEs), a composite of fatal coronary heart disease, nonfatal myocardial infarction, and fatal or nonfatal stroke, were among the adjudicated endpoints. The observational follow-up continued post-ASPREE with the ASPREE-eXTension (ASPREE-XT) cohort study [25]. This study used the data from up to the XT04 timepoint (approximately 4–5 years of ASPREE-XT follow-up).
The initial ASPREE trial was approved by the Monash University Human Research Ethics Committee (MUHREC) (IRB00002519; ethics #2006/745MC) and other allied institutions’ ethics committees. In Australia, the Alfred Hospital Ethics Committee (ethics #HREC/17/Alfred/198) oversees the ASPREE-XT project as the primary site approver. The ASPREE trial and ASPREE-XT cohort study are registered with ClinicalTrials.gov (NCT01038583) and the International Standard Randomised Controlled Trial Number Registry (ISRCTN83772183), and have been conducted in accordance with the Declaration of Helsinki.
2.2. Participant Assessment and Laboratory Data
At baseline and during the follow-up, in-person/phone call interviews and assessments by trained research staff, blinded to the randomized trial medication allocation, collected the following data: (a) self-reported information on medical history and lifestyle (including alcohol use); (b) anthropometry and markers of physical function (including BMI, abdominal circumference, blood pressure, and pulse rate); and (c) laboratory parameters via local pathology collection centers. The specific questionnaires included the Modified Mini-Mental State Examination (3MS) [26] (repeated every two years) and the Center for Epidemiologic Studies Depression Scale (CES-D-10) [27,28].
The initial baseline data included fasting triglycerides and other lipids, creatinine, and fasting glucose, which were repeated annually. In addition, as part of the ASPREE Healthy Ageing Biobank sub-study, 11,914 Australian participants provided blood samples for storage and later analysis. These samples were collected, stored, and subsequently used for biochemical analysis to determine the gamma-glutamyltransferase (GGT), amongst other measures. The analysis of the Healthy Ageing Biobank serum was performed centrally at Alfred Health Pathology using an Abbott Alinity ci analyzer and Abbott reagents (Abbott Diagnostics, Macquarie Park, NSW, Australia).
2.3. Identifying MAFLD
As previously described, the FLI [24] was calculated for the ASPREE cohort [9,29,30] using the BMI, abdominal circumference, triglycerides, and GGT in the participants for whom complete data were available and who had blood collected within 90 days of their baseline visit. Although the FLI was originally used and validated for identifying non-alcoholic fatty liver disease, it has also been subsequently validated and used in MAFLD [4,31] and in older adults [32]. The possible FLI scores range from 0 to 100; a score of ≥60 represents hepatic steatosis [24]. To identify a MAFLD subgroup, the participants with an FLI ≥ 60 were classified as having MAFLD if they had the following: DM, overweight/obesity, and/or two or more requisite cardiometabolic comorbidities irrespective of alcohol or medication consumption [1]. Individuals with an FLI of <30 were considered no-MAFLD comparators (Figure 1). To identify those with MASLD, an FLI ≥ 60 and the usual criteria were applied, as previously performed in the ASPREE cohort [9,30,33,34], including the exclusion of steatogenic medications and/or excess alcohol (14 or more drinks per week for women, 21 or more drinks per week for males). These exclusions are the most clinically important differences between the MASLD and MAFLD definitions.
2.4. Baseline Characteristics and Cardiometabolic Comorbidities
Obesity was defined as ≥30 kg/m2 [1]. An elevated abdominal circumference [35] was defined as ≥102 cm for males, and ≥88 cm for females. Hypertension was defined as a systolic blood pressure ≥ 140 mmHg, a diastolic blood pressure ≥ 90 mmHg, and/or the use of antihypertensive medication(s) [36]. DM was defined as one or more of self- or physician-reported DM, a fasting glucose ≥ 7.0 mmol/L, and/or the prescription of hypoglycemic medication(s) [37]. The HbA1c data was not available in ASPREE. Dyslipidemia was defined as one or more of the following: total cholesterol ≥ 6.2 mmol/L, LDL cholesterol ≥ 4.1 mmol/L, HDL cholesterol < 1.0 mmol/L, triglycerides > 2.3 mmol/L, and/or use of an HMG-CoA reductase inhibitor or a fibrate. The cardiometabolic abnormalities required for a diagnosis of MAFLD have been previously published, and included a BMI ≥ 25 kg/m2 (or BMI ≥ 23 kg/m2 in Asians); self-described DM, or a fasting blood glucose ≥ 7.0 mmol/L, or drug treatment for DM; or two or more of elevated abdominal circumference, fasting blood glucose ≥ 5.6 mmol/L, blood pressure ≥ 130/85 mmHg or treatment with an antihypertensive agent, triglycerides ≥ 1.70 mmol/L or lipid-lowering therapy, and low HDL cholesterol (≤1.0 mmol/L in males, ≤1.3 mmol/L in females) or lipid-lowering therapy [19]. Similarly, the criteria for MASLD were used as previously published, including a BMI ≥ 25 kg/m2 (or BMI ≥ 23 kg/m2 in Asians); elevated abdominal circumference (with sex- and ethnicity-specific cut-offs); self-described DM, or a fasting blood glucose ≥ 5.6 mmol/L, or drug treatment for DM; blood pressure ≥ 130/85 mmHg or treatment with an antihypertensive agent; and triglycerides ≥ 1.70 mmol/L, or low HDL cholesterol (≤1.0 mmol/L in males, ≤1.3 mmol/L in females), or lipid-lowering therapy [19]. As noted above, the HbA1c data is not available in ASPREE.
2.5. Genetics
The DNA samples provided by the ASPREE participants were genotyped using an Axiom 2.0 Precision Medicine Diversity Array (Thermo Fisher Scientific, Fresno, CA, USA), covering >850,000 markers selected for high genomic coverage based on the 1000 Genomes Project Phase III. Variant calling was performed using a custom pipeline aligned to the GRCh38 reference genome. Genotype imputation was conducted using the TOPMed Imputation Server with the TOPMed-r2 reference panel [38,39]. Variants with a low imputation quality (R2 < 0.3) were excluded, in line with our previous studies [40,41]. In this study, we focused on six variants previously associated with MAFLD [42,43,44]: PNPLA3 rs738409 C > G, TM6SF2 rs58542926 C > T, HSD17B13 rs72613567 T > TA, GCKR rs1260326 C > T, LYPLAL1 rs12137855 C > T, and MBOAT7 rs641738 C > T. Heterozygote and homozygote carriers were considered separately for the primary analysis, and grouped for the supplementary analyses. All the participants in this study were of European ancestry based on their genotype data.
2.6. Defining Outcomes
The study adjudication process for validating MACEs, death, and cause of death in the overall ASPREE study was previously described [45]. Briefly, each case was independently reviewed by two clinical experts with a third adjudicator resolving discordance. Per the original ASPREE publication [22] based on the World Health Organization criteria, MACE was defined as a composite of fatal coronary heart disease (excluding death from heart failure), nonfatal acute myocardial infarction (AMI), or fatal/nonfatal ischemic stroke [22]. Similarly, the ascertainment and adjudication of the death data in ASPREE was previously described [21]. A death was usually identified either during a routine trial activity or through a relative/next-of-kin notifying the researchers. All deaths required confirmation from two independent sources. The staff also performed Ryerson Index linkages, a community-maintained volunteer-compiled register based on death notices and obituaries. Once a death was confirmed, the clinical details were sought from the relevant facilities and practitioners. Adjudication occurred via collated case presentations to at least two adjudicators (one USA based and one Australia based); discordance was resolved via consensus. The follow-up and adjudication of these endpoints has continued following the cessation of the randomized interventional trial.
2.7. Statistical Analysis
The baseline data were compared using a one-way ANOVA or two-tailed Student’s t-test (for continuous variables) or a chi-squared test (for categorical variables) for the MAFLD vs. no-MAFLD group, and carrier status for the various genetic variants was evaluated within the MAFLD sub-group. The co-primary outcomes were whether previously described genetic variants increased the hazard of MACE or all-cause mortality in older adults with MAFLD. An exploratory analysis evaluated the associations between these genetic variants with MACE and all-cause mortality in those without definite MAFLD (FLI < 60). Additionally, the analyses were repeated using the MASLD definition.
In the initial analysis, Cox proportional hazards regression models were used to evaluate the outcomes, adjusting first for the top 20 genetic principal components to account for population structure, followed by further adjustments for age and sex. Finally, the model evaluating the risk of MACE was subsequently also adjusted for the variables known to be associated with atherosclerotic cardiovascular disease in the overall ASPREE cohort [46] as well as randomization to aspirin/placebo. These variables included age, sex, serum creatinine, HDL and non-HDL cholesterol, systolic blood pressure, the prescription of an antihypertensive(s), DM, and being a current smoker. The final model evaluating the risk of all-cause mortality was adjusted for the variables known to be associated with reduced disability-free survival in the ASPREE cohort [47], including age, sex, markers of depression (CES-D-10 ≥ 8) and cognitive function (3MS), gait speed, grip strength, DM, current smoking status, and eGFR. No models included BMI or triglycerides due to their inclusion in the FLI. A two-tailed p-value of < 0.05 was considered statistically significant. Statistical analyses were performed using Stata software v17.0 (StataCorp LLC, College Station, TX, USA). Neither the participants nor the public were involved in the study design or reporting of this research.
3. Results
3.1. Study Population and Genetic Variant Prevalence
Of the 16,703 Australian participants enrolled in ASPREE, 11,914 provided blood for the biobank, and 9847 participants had a calculable FLI using the laboratory results from the blood samples taken within 90 days post-recruitment (Figure 1). Of the group with a calculable FLI, 3748 (38.1%) had an FLI ≥ 60, and of these, 3743 met the criteria for MAFLD. For the genetic analysis, 12,181 of the 16,703 participants had genetic data available (72.9%), including 8751 of those with a calculable FLI, leaving 3310 (88.4%) of the MAFLD patients with known allele carrier status (Figure 1). Of the included 8751 participants, the mean age was 75.0 ± 4.2 years and 53.5% were female. Their mean BMI (± SD) was 28.0 ± 4.5 kg/m2. In total, 37.8% had a diagnosis of MAFLD. The general characteristics of the participants stratified by their FLI are shown in Table 1 (comparing no-MAFLD [FLI < 30], an indeterminate FLI [30–60], and MAFLD [FLI ≥ 60]). The follow-up for these participants comprised the trial duration (median of 4.7 years) and the ASPREE-XT continuation, for a total follow-up of a median of 8.4 (IQR 7.3–9.5) years.

Table 1.
Baseline characteristics of Australian ASPREE participants classified by FLI and with genetics data.
There was no significant difference in the carrier frequency of the genetic variants investigated between the FLI categories for wildtype PNPLA3, wildtype MBOAT7, wildtype TM6SF2, and wildtype LYPLAL1 (all p > 0.05) (Table 1). There were statistically significant differences in the HSD17B13 rs72613567 T > TA homozygotes (6.8% MAFLD, 7.9% FLI 30–60, and 7.4% no-MAFLD; p = 0.010) and the GCKR rs1260326 C > T homozygotes (17.6% MAFLD, 15.4% FLI 30–60, and 14.6% no-MAFLD; p = 0.005) (Table 1). There were no significant differences in the variant frequencies between the sexes (Table 2).
Table 2.
Associations between sex and MAFLD-related genetic variants (homozygotes and heterozygotes grouped).
3.2. Major Adverse Cardiovascular Events
There were 283 cases of MACE in the MAFLD group (8.5%) over a median (IQR) follow-up period of 8.3 (7.3–9.4) years, corresponding to an event rate of 10.8 per 1000 person-years (Table 3).
Table 3.
Relationship between baseline characteristics and MACE and all-cause mortality in Australian ASPREE participants with MAFLD.
None of the individual MAFLD-associated genetic variants was associated with an increased risk of MACE based on a univariate or adjusted analysis (Table 4). PNPLA3 (rs738409 C > G), TM6SF2 (rs58542926 C > T), HSD17B13 (rs72613567 T > TA), GCKR (rs1260326 C > T), and LYPLAL1 (rs12137855 C > T) were not protective of MACE (Table 4).
Table 4.
Association between MAFLD-related variants stratified by homo- and heterozygosity with MACE in Australian ASPREE participants with MAFLD.
A total of 44 of the 641 (6.9%) persons with MBOAT7 rs641738 C > T homozygosity reached the MACE endpoint compared with 104 of the 929 (11.2%) rs641738 wildtype participants. MBOAT7 rs641738 C > T homozygosity was associated with a reduced risk of MACE in MAFLD (HR 0.78 [95% CI 0.61–0.99]). These findings held true after adjusting for multiple known cardiovascular disease risk factors in this population [46] (aHR 0.64 [95% CI 0.44–0.92]) (Table 4). Additionally, MBOAT7 rs641738 C > T heterozygosity was non-significantly associated with a reduced risk of MACE (aHR 0.81 [95% CI 0.62–1.05]).
The above results were unchanged by an exploratory analysis of the homozygous and heterozygous individuals grouped together. There were no significant associations between the grouped homozygous or heterozygous individuals in any of PNPLA3, TM6SF2, HSD17B13, GCKR, or LYPLAL1 (all p > 0.05) (Table 5). At least one MBOAT7 rs641738 C > T variant was associated with a reduced risk of MACE (aHR 0.76 [95% CI 0.59–0.97]) (Table 5).
Table 5.
Association between MAFLD-related genetic variants and MACE in Australian ASPREE participants with MAFLD. Homozygotes and heterozygotes grouped.
3.3. All-Cause Mortality
In the subgroup of 3310 participants with MAFLD, there were 497 deaths (18.2 per 1000 person-years) (Table 3). From both the unadjusted and adjusted analysis, none of the individual variants in PNPLA3, MBOAT7, TM6SF2, HSD17B13, GCKR, or LYPLAL1 were associated with the all-cause mortality (Table 6).
Table 6.
Association between MAFLD-related genetic variants stratified by homo- and heterozygosity with all-cause mortality in Australian ASPREE participants with MAFLD.
This held true in our exploratory analysis when evaluating heterozygous and homozygous status together (Table 7).
Table 7.
Association between MAFLD-related genetic variants and mortality in Australian ASPREE participants with MAFLD. Homozygotes and heterozygotes grouped.
3.4. Genetic Variant Associations in Older Individuals Without MAFLD
Of the 5441 participants without MAFLD (FLI < 60), 380 (7.0%) reached a MACE endpoint during the median follow-up of 8.4 years (IQR 7.3–9.5 years). None of the previously identified genetic variants were either positively or negatively associated with MACE on the adjusted or unadjusted analysis of the non-MAFLD group, including MBOAT7 (rs641738 C > T) homozygosity (aHR 0.92 [95% CI 0.68–1.25]) (Table 8). Similarly, of the 775 deaths over the median follow-up of 8.6 years (7.4–9.6 years), none of the six examined genetic variants had any significant association with mortality (Table 8).
Table 8.
Genetic variants and their associations with MACE and all-cause mortality in those without definite MAFLD (FLI < 60).
3.5. Outcomes in the MASLD Group
There were 2624 individuals classified as MASLD (FLI ≥ 60 and the requisite cardiometabolic criteria) with available genetic data. Within this group, there were no meaningful differences in outcomes compared with the larger MAFLD group (Table 9). While TM6SF2 (rs58542926 C > T) heterozygosity was associated with death in the MASLD group (HR 1.42 [95% CI 1.09–1.84]), this was not true when fully adjusted (aHR 1.31 [95% CI 0.99–1.71]) or in the homozygous group (aHR 0.91 [95% CI 0.22–3.71]). No other genetic variants were associated with death in the MASLD group (Table 9).
Table 9.
Genetic variants and their associations with MACE and all-cause mortality in those with MASLD.
Similar to the MAFLD subgroup, MBOAT7 (rs641738 C > T) homozygosity was again associated with a reduced risk of MACE on both the unadjusted (HR 0.66 [95% CI 0.44–0.99]) and fully adjusted (aHR 0.59 [95% CI 0.38–0.90]) analyses. No other genetic variants were associated with either an increased or decreased risk of MACE.
4. Discussion
The impact of MAFLD on morbidity, mortality, and MACE in older adults is unclear, with divergent results across multiple studies [8,48,49,50]. Given these discrepancies in the literature, and that many guidelines discuss or recommend screening for MAFLD in at-risk adults [51,52,53], this study aimed to identify whether there were any significant relationships between six well-recognized MAFLD-related genetic variants with all-cause mortality or MACE in older adults. The main findings of our study are that, in older adults, MBOAT7 (rs641738 C > T) homozygosity is associated with a reduced risk of MACE in older adults with MAFLD (but not in a population of older adults without MAFLD), but is not associated with mortality. Additionally, there are no apparent associations of the variants PNPLA3 (rs738409 C > G), TM6SF2 (rs58542926 C > T), HSD17B13 (rs72613567 T > TA), GCKR (rs1260326 C > T), or LYPLAL1 (rs12137855 C > T) with death or MACE in older adults with or without MAFLD. These results are similar to those when using the MASLD definition. Our findings have important implications for considering—or not considering—the use of genetic risk stratification for MAFLD or MASLD in older adults.
Multiple studies have evaluated the impact of various single-nucleotide polymorphisms and genetic variants on MAFLD prevalence and outcomes in middle-aged adults [13,14,15]. These studies have shown different relationships between genetic variants and MAFLD, including associations with not only the likelihood but also the severity of disease (including histological markers of severity, such as fibrosis and steatohepatitis) [54]. However, in our study, none of the four gene variants previously shown to be associated with prevalent MAFLD in middle age (candidate variants in the PNPLA3, TM6SF2, LYPLAL1, and MBOAT7 genes) was associated with a meaningfully increased risk of prevalent MAFLD. While previous data has shown that HSD17B13 (rs72613567 T > TA) is associated with a reduced risk of MAFLD, this was of only marginal significance in our cohort (Table 1). The sixth variant evaluated (GCKR rs1260326 C > T) was associated with a marginally increased risk of prevalent MAFLD (Table 1).
Additionally, none of the six evaluated gene variants showed an increased risk of all-cause mortality in older adults with MAFLD, nor were they associated with an altered risk of mortality in the no-MAFLD population. This could possibly be due to the age and general health of the ASPREE participants, who were all over 70 years and free from known life-limiting illnesses, pre-existing atherosclerotic cardiovascular disease, and dementia. Additionally, cancer was the predominant cause of death in this population, perhaps limiting the predictive utility of these gene variants. Regardless, it is possible that the deleterious effects of these genotypes are seen in middle age, and our cohort exhibited a survival bias or resilience to adverse genotypes. Furthermore, the mechanisms of these genetic variants in MAFLD development and progression tend to be related to lipid droplet metabolism, very-low-density lipoprotein metabolism, and de novo lipogenesis [54]. It is possible that participants engaged enough in their health to enroll in a primary prevention study were more actively involved in health prevention in their middle years leading to a healthy survivorship bias, which may partly attenuate the risk conferred by these alleles. Interestingly, the putative protective effect of HSD17B13 (rs72613567 T > TA) [54] on steatohepatitis and progressive liver disease was also not evident in the altered mortality rates in either the MAFLD or no-MAFLD group. This may be because of the attenuated risk between MAFLD and mortality in older adults [9,49], such that a reduced risk of MAFLD development has no mechanism by which to have an impact on rates of liver- or non-liver-related death.
Despite the previously identified associations between MAFLD and steatohepatitis with atherosclerotic cardiovascular disease, none of the examined variants in PNPLA3 (rs738409 C > G), TM6SF2 (rs58542926 C > T), GCKR (rs1260326 C > T), LYPLAL1 (rs12137855 C > T), or HSD17B13 (rs72613567 T > TA) was associated with either an increased or decreased risk of MACE. This was the case in both the MAFLD and no-MAFLD groups, as well as the MASLD group. These findings are largely in keeping with other research in younger populations, where PNPLA3 (rs738409 C > G) (despite having been previously associated with increased liver-related disease) is protective against cardiovascular disease. Interestingly, MBOAT7 (rs641738 C > T) was inversely associated with MACE—even when adjusting for a multitude of risk factors—in both the MAFLD and MASLD cohorts, but not in the no-MAFLD cohort. Previous work has suggested that MBOAT7 rs641738 C > T has a relatively minor impact on cardiovascular disease [55], in spite of its known mechanistic association with an increased accumulation of free arachidonic acid (a precursor of proinflammatory lipid mediators) [55]. However, in a smaller study of older Chinese persons, a trend towards MBOAT7 (rs641738 C > T) homozygosity being protective for atherosclerotic CVD in NAFLD was also seen, though in that study this effect was also seen in the no-NAFLD group [56]. The mechanism of protection seen in our study is uncertain and merits further exploration, as it may yield novel therapeutic targets to reduce the risk of MACE in older adults with MAFLD. However, this may also be a chance finding and requires replication in larger cohorts.
Strengths and Weaknesses
Our study has several strengths, including its size, the rigorous protocol-driven prospective data capture at enrolment and during follow-up, and the robust ascertainment and adjudication of the key endpoints. However, some limitations should be discussed. The FLI was used to determine MAFLD, rather than a liver biopsy or imaging. While the FLI has been previously validated as a population-based marker of hepatic steatosis when compared to abdominal ultrasound-diagnosed fatty liver disease in a similar population to ours [32], an abdominal ultrasound itself is not the most sensitive modality for diagnosing hepatic steatosis. While there is a lack of data directly correlating the FLI to biopsy-proven MAFLD, these results broadly support our categorization of MAFLD vs. no-MAFLD. The FLI is also endorsed by the Gastroenterological Society of Australia MAFLD guidelines for use in epidemiological studies [17]. Additionally, the FLI may misclassify lean MAFLD, reducing the ability to extrapolate our findings to that group (or requiring alternative FLI cut-offs [57,58]). When considering the requisite cardiometabolic criteria for classifying individuals as MAFLD (or MASLD), ASPREE does not include HbA1c data, potentially impacting the ability to accurately apply these classification schemas. However, very few of the FLI ≥ 60 (steatotic) ASPREE participants did not meet the MAFLD criteria (5/3748, 0.13%), implying that the vast majority met the other cardiometabolic criteria. Additionally, the ASPREE population was a relatively healthy community-dwelling cohort and care should therefore be taken in extrapolating this data to wider older adult populations. However, because of this, our study population has a presumed longer life expectancy, such that risk stratifying those with MAFLD could be considered worthwhile despite their biological age, and that understanding the utility of personalized genetic testing is important for determining age-appropriate recommendations in clinically relevant populations. We did not adjust for multiple comparisons, though this is in keeping with the modern literature [59] on the topic, and our results became marginally more significant with adjustments for multiple confounders, perhaps increasing the possibility of an independent association. Importantly, our study population was not ethnically diverse, thereby limiting the capacity to generalize the findings to other non-European ethnicities in terms of both the overall relationship (or lack thereof), as well as the effect sizes. The confirmation of these findings using other large datasets would be valuable. Finally, as previously mentioned, MAFLD is a polygenic disease—the development of a polygenic risk score may improve risk stratification in the future.
5. Conclusions
In this sub-study of a very large randomized–controlled trial involving relatively healthy community-dwelling adults aged ≥ 70 years, there were only minor associations between two candidate variants (GCKR rs1260326 C > T and HSD17B13 rs72613567 T > TA) and prevalent MAFLD, and no association with four others (PNPLA3, TM6SF2, LYPLAL1, and MBOAT7). Additionally, there was no association between these candidate variants in the PNPLA3, TM6SF2, HSD17B13, GCKR, LYPLAL1, and MBOAT7 genes with all-cause mortality in those with or without MAFLD. There was an association between MBOAT7 (rs641738 C > T) homozygosity and a reduced risk of major adverse cardiovascular events—even when adjusting for age, sex, and multiple cardiovascular risk factors—in those with MAFLD or MASLD, but not in those without MAFLD. While these findings require replication in other cohorts, they may help inform the consideration of personalized risk stratification using genomics for older adults with MAFLD.
Author Contributions
D.C.-C.: Conceptualization, formal analysis, investigation, writing (original draft), and writing (review and editing). A.M.: Conceptualization and writing (review and editing). W.W.K.: Conceptualization and writing (review and editing). C.Y.: Conceptualization, formal analysis, writing (review and editing), and investigation. P.W.L.: Writing (review and editing). J.A.F.: Writing (review and editing). R.L.W.: Conceptualization, writing (review and editing), funding acquisition, investigation, and project administration. A.M.T.: Writing (review and editing), funding acquisition, and investigation. M.R.N.: Writing (review and editing), funding acquisition, investigation, and project administration. A.T.C.: Writing (review and editing), investigation, funding acquisition, and project administration. J.R.: Writing (review and editing), funding acquisition, and investigation. A.D.H.: Writing (review and editing). J.S.L.: Writing (review and editing). H.G.S.: Writing (review and editing), funding acquisition, and investigation. J.J.M.: Writing (review and editing), investigation, funding acquisition, and project administration. S.K.R.: Writing (original draft), writing (review and editing), and supervision. All authors have read and agreed to the published version of the manuscript.
Funding
The ASPREE clinical trial was supported by the National Institute on Aging and the National Cancer Institute at the National Institutes of Health (U01AG029824, U19AG062682); the NHMRC (334047, 1127060); Monash University; and the Victorian Cancer Agency. The ASPREE Biobank was supported by research grants from the Australian Government’s CSIRO (Commonwealth Scientific and Industrial Research Organisation; Preventative Health Flagship 2009) and the National Cancer Institute/National Institutes of Health (5U01AG029824-02). Abbott Diagnostics provided a grant for the measurement of the laboratory parameters. D.C.-C. is supported by an Australian RTP Scholarship. A.T.C. is an American Cancer Society Research Professor. No funding sources were involved in the design or conduction of the study; collection, management, or analysis of the data; interpretation of the results; preparation, review, or approval of the manuscript; or decision to submit it for publication.
Institutional Review Board Statement
The ASPREE trial was approved by both the Monash University Human Research Ethics Committee (MUHREC #2006/745MC) on 26th September 2006 and US IRB00002519 on 20th of January 2010, along with other allied institutions’ ethics committees. It was conducted in accordance with the Declaration of Helsinki.
Informed Consent Statement
Written and informed consent was provided by all the participants in the ASPREE trial.
Data Availability Statement
The datasets used and/or analyzed for this publication are available via the ASPREE Principal Investigators. Requests for data access can be directed to aspree.ams@monash.edu.
Acknowledgments
We thank the ASPREE and ASPREE-XT participants and staff for their time and provision of samples for the Healthy Ageing Biobank, as well as the general practitioners and medical clinics who supported the participants in the ASPREE study.
Conflicts of Interest
Daniel Clayton-Chubb, Ammar Majeed, William W. Kemp, Chenglong Yu, Peter W. Lange, Jessica Fitzpatrick, Robyn L. Woods, Andrew M. Tonkin, Mark R. Nelson, Andrew T. Chan, Joanne Ryan, Alexander Hodge, John S. Lubel, Hans G. Schneider, John J. McNeil, and Stuart K. Roberts have no conflicts of interest relevant to this manuscript to declare.
References
- Eslam, M.; Newsome, P.N.; Sarin, S.K.; Anstee, Q.M.; Targher, G.; Romero-Gomez, M.; Zelber-Sagi, S.; Wai-Sun Wong, V.; Dufour, J.F.; Schattenberg, J.M.; et al. A new definition for metabolic dysfunction-associated fatty liver disease: An international expert consensus statement. J. Hepatol. 2020, 73, 202–209. [Google Scholar] [CrossRef] [PubMed]
- Driessen, S.; Francque, S.M.; Anker, S.D.; Castro Cabezas, M.; Grobbee, D.E.; Tushuizen, M.E.; Holleboom, A.G. Metabolic dysfunction-associated steatotic liver disease and the heart. Hepatology 2023, 82, 487–503. [Google Scholar] [CrossRef]
- Vaz, K.; Clayton-Chubb, D.; Majeed, A.; Lubel, J.; Simmons, D.; Kemp, W.; Roberts, S.K. Current understanding and future perspectives on the impact of changing NAFLD to MAFLD on global epidemiology and clinical outcomes. Hepatol. Int. 2023, 17, 1082–1097. [Google Scholar] [CrossRef]
- Vaz, K.; Kemp, W.; Majeed, A.; Lubel, J.; Magliano, D.J.; Glenister, K.M.; Bourke, L.; Simmons, D.; Roberts, S.K. NAFLD and MAFLD independently increase the risk of major adverse cardiovascular events (MACE): A 20-year longitudinal follow-up study from regional Australia. Hepatol. Int. 2024, 18, 1135–1143. [Google Scholar] [CrossRef]
- Bianco, C.; Jamialahmadi, O.; Pelusi, S.; Baselli, G.; Dongiovanni, P.; Zanoni, I.; Santoro, L.; Maier, S.; Liguori, A.; Meroni, M.; et al. Non-invasive stratification of hepatocellular carcinoma risk in non-alcoholic fatty liver using polygenic risk scores. J. Hepatol. 2021, 74, 775–782. [Google Scholar] [CrossRef]
- Liu, Y.; Zhong, G.C.; Tan, H.Y.; Hao, F.B.; Hu, J.J. Nonalcoholic fatty liver disease and mortality from all causes, cardiovascular disease, and cancer: A meta-analysis. Sci. Rep. 2019, 9, 11124. [Google Scholar] [CrossRef] [PubMed]
- Estes, C.; Razavi, H.; Loomba, R.; Younossi, Z.; Sanyal, A.J. Modeling the epidemic of nonalcoholic fatty liver disease demonstrates an exponential increase in burden of disease. Hepatology 2018, 67, 123–133. [Google Scholar] [CrossRef]
- Golabi, P.; Paik, J.; Reddy, R.; Bugianesi, E.; Trimble, G.; Younossi, Z.M. Prevalence and long-term outcomes of non-alcoholic fatty liver disease among elderly individuals from the United States. BMC Gastroenterol. 2019, 19, 56. [Google Scholar] [CrossRef]
- Clayton-Chubb, D.; Majeed, A.; Commins, I.; Woods, R.L.; Chan, A.T.; Ryan, J.; Neumann, J.T.; Schneider, H.G.; Tonkin, A.M.; Nelson, M.R.; et al. Prevalence and outcomes of steatotic liver disease subtypes in older adults. Hepatol. Commun. 2025, 9, e0756. [Google Scholar] [CrossRef] [PubMed]
- Younossi, Z.M.; Golabi, P.; Paik, J.M.; Henry, A.; Van Dongen, C.; Henry, L. The global epidemiology of nonalcoholic fatty liver disease (NAFLD) and nonalcoholic steatohepatitis (NASH): A systematic review. Hepatology 2023, 77, 1335–1347. [Google Scholar] [CrossRef] [PubMed]
- Bluher, M. Obesity: Global epidemiology and pathogenesis. Nat. Rev. Endocrinol. 2019, 15, 288–298. [Google Scholar] [CrossRef]
- Khan, M.A.B.; Hashim, M.J.; King, J.K.; Govender, R.D.; Mustafa, H.; Al Kaabi, J. Epidemiology of Type 2 Diabetes—Global Burden of Disease and Forecasted Trends. J. Epidemiol. Glob. Health 2020, 10, 107–111. [Google Scholar] [CrossRef] [PubMed]
- Lonardo, A.; Arab, J.P.; Arrese, M. Perspectives on Precision Medicine Approaches to NAFLD Diagnosis and Management. Adv. Ther. 2021, 38, 2130–2158. [Google Scholar] [CrossRef]
- Di Costanzo, A.; Belardinilli, F.; Bailetti, D.; Sponziello, M.; D’Erasmo, L.; Polimeni, L.; Baratta, F.; Pastori, D.; Ceci, F.; Montali, A.; et al. Evaluation of Polygenic Determinants of Non-Alcoholic Fatty Liver Disease (NAFLD) By a Candidate Genes Resequencing Strategy. Sci. Rep. 2018, 8, 3702. [Google Scholar] [CrossRef] [PubMed]
- Jonas, W.; Schurmann, A. Genetic and epigenetic factors determining NAFLD risk. Mol. Metab. 2021, 50, 101111. [Google Scholar] [CrossRef] [PubMed]
- Adams, L.A.; Kemp, W.W.; Muller, K.R.; Powell, E.E.; Roberts, S.K.; Bertot, L.C.; Best, S.; Deed, G.; Emery, J.D.; Hocking, S.L.; et al. Assessment of metabolic dysfunction-associated fatty liver disease in primary care: A consensus statement summary. Med. J. Aust. 2025. [Google Scholar] [CrossRef]
- MAFLD Consensus Statement Working Group. Recommendations for the Assessment of Metabolic Dysfunction-Associated Fatty Liver Disease (MAFLD) in Primary Care: A Consensus Statement; Gastroenterological Society of Australia: Melbourne, Australia, 2024; Available online: https://www.gesa.org.au/public/13/files/Education%20%26%20Resources/Clinical%20Practice%20Resources/MAFLD/MAFLD%20consensus%20statement%202024.pdf (accessed on 6 August 2024).
- Eslam, M.; Fan, J.G.; Yu, M.L.; Wong, V.W.; Cua, I.H.; Liu, C.J.; Tanwandee, T.; Gani, R.; Seto, W.K.; Alam, S.; et al. The Asian Pacific association for the study of the liver clinical practice guidelines for the diagnosis and management of metabolic dysfunction-associated fatty liver disease. Hepatol. Int. 2025, 19, 261–301. [Google Scholar] [CrossRef]
- Rinella, M.E.; Lazarus, J.V.; Ratziu, V.; Francque, S.M.; Sanyal, A.J.; Kanwal, F.; Romero, D.; Abdelmalek, M.F.; Anstee, Q.M.; Arab, J.P.; et al. A multi-society Delphi consensus statement on new fatty liver disease nomenclature. J. Hepatol. 2023, 79, 1542–1556. [Google Scholar] [CrossRef]
- McNeil, J.J.; Woods, R.L.; Nelson, M.R.; Murray, A.M.; Reid, C.M.; Kirpach, B.; Storey, E.; Shah, R.C.; Wolfe, R.S.; Tonkin, A.M.; et al. Baseline Characteristics of Participants in the ASPREE (ASPirin in Reducing Events in the Elderly) Study. J. Gerontol. A Biol. Sci. Med. Sci. 2017, 72, 1586–1593. [Google Scholar] [CrossRef]
- McNeil, J.J.; Nelson, M.R.; Woods, R.L.; Lockery, J.E.; Wolfe, R.; Reid, C.M.; Kirpach, B.; Shah, R.C.; Ives, D.G.; Storey, E.; et al. Effect of Aspirin on All-Cause Mortality in the Healthy Elderly. N. Engl. J. Med. 2018, 379, 1519–1528. [Google Scholar] [CrossRef]
- McNeil, J.J.; Wolfe, R.; Woods, R.L.; Tonkin, A.M.; Donnan, G.A.; Nelson, M.R.; Reid, C.M.; Lockery, J.E.; Kirpach, B.; Storey, E.; et al. Effect of Aspirin on Cardiovascular Events and Bleeding in the Healthy Elderly. N. Engl. J. Med. 2018, 379, 1509–1518. [Google Scholar] [CrossRef]
- Parker, E.J.; Orchard, S.G.; Gilbert, T.J.; Phung, J.J.; Owen, A.J.; Lockett, T.; Nelson, M.R.; Reid, C.M.; Tonkin, A.M.; Abhayaratna, W.P.; et al. The ASPREE Healthy Ageing Biobank: Methodology and participant characteristics. PLoS ONE 2024, 19, e0294743. [Google Scholar] [CrossRef]
- Bedogni, G.; Bellentani, S.; Miglioli, L.; Masutti, F.; Passalacqua, M.; Castiglione, A.; Tiribelli, C. The Fatty Liver Index: A simple and accurate predictor of hepatic steatosis in the general population. BMC Gastroenterol. 2006, 6, 33. [Google Scholar] [CrossRef]
- Ernst, M.E.; Broder, J.C.; Wolfe, R.; Woods, R.L.; Nelson, M.R.; Ryan, J.; Shah, R.C.; Orchard, S.G.; Chan, A.T.; Espinoza, S.E.; et al. Health Characteristics and Aspirin Use in Participants at the Baseline of the ASPirin in Reducing Events in the Elderly—eXTension (ASPREE-XT) Observational Study. Contemp. Clin. Trials 2023, 130, 107231. [Google Scholar] [CrossRef] [PubMed]
- Teng, E.L.; Chui, H.C. The Modified Mini-Mental State (3MS) examination. J. Clin. Psychiatry 1987, 48, 314–318. [Google Scholar]
- Andresen, E.M.; Malmgren, J.A.; Carter, W.B.; Patrick, D.L. Screening for depression in well older adults: Evaluation of a short form of the CES-D (Center for Epidemiologic Studies Depression Scale). Am. J. Prev. Med. 1994, 10, 77–84. [Google Scholar] [CrossRef]
- Radloff, L.S. The CES-D Scale:A Self-Report Depression Scale for Research in the General Population. Appl. Psychol. Meas. 1977, 1, 385–401. [Google Scholar] [CrossRef]
- Clayton-Chubb, D.; Kemp, W.W.; Majeed, A.; Lubel, J.S.; Woods, R.L.; Tran, C.; Ryan, J.; Hodge, A.; Schneider, H.G.; McNeil, J.J.; et al. Metabolic dysfunction-associated steatotic liver disease in older adults is associated with frailty and social disadvantage. Liver Int. 2024, 44, 39–51. [Google Scholar] [CrossRef] [PubMed]
- Clayton-Chubb, D.; Roberts, S.K.; Majeed, A.; Woods, R.L.; Tonkin, A.M.; Nelson, M.R.; Chan, A.T.; Ryan, J.; Tran, C.; Hodge, A.; et al. Associations between MASLD, atrial fibrillation, cardiovascular events, mortality and aspirin use in older adults. Geroscience 2024, 47, 1303–1318. [Google Scholar] [CrossRef] [PubMed]
- Liu, Y.; Liu, S.; Huang, J.; Zhu, Y.; Lin, S. Validation of five hepatic steatosis algorithms in metabolic-associated fatty liver disease: A population based study. J. Gastroenterol. Hepatol. 2022, 37, 938–945. [Google Scholar] [CrossRef]
- Koehler, E.M.; Schouten, J.N.; Hansen, B.E.; Hofman, A.; Stricker, B.H.; Janssen, H.L. External validation of the fatty liver index for identifying nonalcoholic fatty liver disease in a population-based study. Clin. Gastroenterol. Hepatol. 2013, 11, 1201–1204. [Google Scholar] [CrossRef]
- Clayton-Chubb, D.; Kemp, W.W.; Majeed, A.; Woods, R.L.; Ryan, J.; Murray, A.M.; Chong, T.T.J.; Lubel, J.S.; Tran, C.; Hodge, A.D.; et al. Late-Life Metabolic Dysfunction-Associated Steatotic Liver Disease and its Association With Physical Disability and Dementia. J. Gerontol. A Biol. Sci. Med. Sci. 2024, 79, glae011. [Google Scholar] [CrossRef]
- Commins, I.; Clayton-Chubb, D.; Fitzpatrick, J.A.; George, E.S.; Schneider, H.G.; Phyo, A.Z.Z.; Majeed, A.; Janko, N.; Vaughan, N.; Woods, R.L.; et al. Associations Between MASLD, Ultra-Processed Food and a Mediterranean Dietary Pattern in Older Adults. Nutrients 2025, 17, 1415. [Google Scholar] [CrossRef]
- Alberti, K.G.; Zimmet, P.; Shaw, J. Metabolic syndrome--a new world-wide definition. A Consensus Statement from the International Diabetes Federation. Diabet. Med. 2006, 23, 469–480. [Google Scholar] [CrossRef]
- Williams, B.; Mancia, G.; Spiering, W.; Agabiti Rosei, E.; Azizi, M.; Burnier, M.; Clement, D.L.; Coca, A.; de Simone, G.; Dominiczak, A.; et al. 2018 ESC/ESH Guidelines for the management of arterial hypertension. Eur. Heart J. 2018, 39, 3021–3104. [Google Scholar] [CrossRef]
- U. S. Preventive Services Task Force; Davidson, K.W.; Barry, M.J.; Mangione, C.M.; Cabana, M.; Caughey, A.B.; Davis, E.M.; Donahue, K.E.; Doubeni, C.A.; Krist, A.H.; et al. Screening for Prediabetes and Type 2 Diabetes: US Preventive Services Task Force Recommendation Statement. JAMA 2021, 326, 736–743. [Google Scholar] [CrossRef]
- Das, S.; Forer, L.; Schonherr, S.; Sidore, C.; Locke, A.E.; Kwong, A.; Vrieze, S.I.; Chew, E.Y.; Levy, S.; McGue, M.; et al. Next-generation genotype imputation service and methods. Nat. Genet. 2016, 48, 1284–1287. [Google Scholar] [CrossRef] [PubMed]
- Taliun, D.; Harris, D.N.; Kessler, M.D.; Carlson, J.; Szpiech, Z.A.; Torres, R.; Taliun, S.A.G.; Corvelo, A.; Gogarten, S.M.; Kang, H.M.; et al. Sequencing of 53,831 diverse genomes from the NHLBI TOPMed Program. Nature 2021, 590, 290–299. [Google Scholar] [CrossRef] [PubMed]
- Yu, C.; Bakshi, A.; Watts, G.F.; Renton, A.E.; Fulton-Howard, B.; Goate, A.M.; Natarajan, P.; Chasman, D.I.; Robman, L.; Woods, R.L.; et al. Genome-Wide Association Study of Cardiovascular Resilience Identifies Protective Variation in the CETP Gene. J. Am. Heart Assoc. 2023, 12, e031459. [Google Scholar] [CrossRef]
- Yu, C.; Ryan, J.; Orchard, S.G.; Robb, C.; Woods, R.L.; Wolfe, R.; Renton, A.E.; Goate, A.M.; Brodtmann, A.; Shah, R.C.; et al. Validation of newly derived polygenic risk scores for dementia in a prospective study of older individuals. Alzheimers Dement. 2023, 19, 5333–5342. [Google Scholar] [CrossRef] [PubMed]
- Sookoian, S.; Pirola, C.J. Genetic predisposition in nonalcoholic fatty liver disease. Clin. Mol. Hepatol. 2017, 23, 1. [Google Scholar] [CrossRef] [PubMed]
- Trepo, E.; Valenti, L. Update on NAFLD genetics: From new variants to the clinic. J. Hepatol. 2020, 72, 1196–1209. [Google Scholar] [CrossRef] [PubMed]
- Browning, J.D. Common genetic variants and nonalcoholic fatty liver disease. Clin. Gastroenterol. Hepatol. 2013, 11, 1191–1193. [Google Scholar] [CrossRef]
- Aspree Investigator Group. Study design of ASPirin in Reducing Events in the Elderly (ASPREE): A randomized, controlled trial. Contemp. Clin. Trials 2013, 36, 555–564. [Google Scholar] [CrossRef]
- Neumann, J.T.; Thao, L.T.P.; Callander, E.; Chowdhury, E.; Williamson, J.D.; Nelson, M.R.; Donnan, G.; Woods, R.L.; Reid, C.M.; Poppe, K.K.; et al. Cardiovascular risk prediction in healthy older people. Geroscience 2022, 44, 403–413. [Google Scholar] [CrossRef]
- Neumann, J.T.; Thao, L.T.P.; Murray, A.M.; Callander, E.; Carr, P.R.; Nelson, M.R.; Wolfe, R.; Woods, R.L.; Reid, C.M.; Shah, R.C.; et al. Prediction of disability-free survival in healthy older people. Geroscience 2022, 44, 1641–1655. [Google Scholar] [CrossRef]
- Younossi, Z.M.; Koenig, A.B.; Abdelatif, D.; Fazel, Y.; Henry, L.; Wymer, M. Global epidemiology of nonalcoholic fatty liver disease-Meta-analytic assessment of prevalence, incidence, and outcomes. Hepatology 2016, 64, 73–84. [Google Scholar] [CrossRef] [PubMed]
- van Kleef, L.A.; Sonneveld, M.J.; Kavousi, M.; Ikram, M.A.; de Man, R.A.; de Knegt, R.J. Fatty liver disease is not associated with increased mortality in the elderly: A prospective cohort study. Hepatology 2023, 77, 585–593. [Google Scholar] [CrossRef]
- Shang, Y.; Nasr, P.; Widman, L.; Hagstrom, H. Risk of cardiovascular disease and loss in life expectancy in NAFLD. Hepatology 2022, 76, 1495–1505. [Google Scholar] [CrossRef]
- Duell, P.B.; Welty, F.K.; Miller, M.; Chait, A.; Hammond, G.; Ahmad, Z.; Cohen, D.E.; Horton, J.D.; Pressman, G.S.; Toth, P.P.; et al. Nonalcoholic Fatty Liver Disease and Cardiovascular Risk: A Scientific Statement From the American Heart Association. Arterioscler. Thromb. Vasc. Biol. 2022, 42, e168–e185. [Google Scholar] [CrossRef]
- Kanwal, F.; Shubrook, J.H.; Adams, L.A.; Pfotenhauer, K.; Wai-Sun Wong, V.; Wright, E.; Abdelmalek, M.F.; Harrison, S.A.; Loomba, R.; Mantzoros, C.S.; et al. Clinical Care Pathway for the Risk Stratification and Management of Patients With Nonalcoholic Fatty Liver Disease. Gastroenterology 2021, 161, 1657–1669. [Google Scholar] [CrossRef] [PubMed]
- European Association for the Study of the Liver (EASL); European Association for the Study of Diabetes (EASD); European Association for the Study of Obesity (EASO). EASL-EASD-EASO Clinical Practice Guidelines on the management of metabolic dysfunction-associated steatotic liver disease (MASLD). J. Hepatol. 2024, 81, 492–542. [Google Scholar] [CrossRef] [PubMed]
- Carlsson, B.; Linden, D.; Brolen, G.; Liljeblad, M.; Bjursell, M.; Romeo, S.; Loomba, R. Review article: The emerging role of genetics in precision medicine for patients with non-alcoholic steatohepatitis. Aliment. Pharmacol. Ther. 2020, 51, 1305–1320. [Google Scholar] [CrossRef]
- Caddeo, A.; Spagnuolo, R.; Maurotti, S. MBOAT7 in liver and extrahepatic diseases. Liver Int 2023, 43, 2351–2364. [Google Scholar] [CrossRef]
- Xu, X.; Xu, H.; Liu, X.; Zhang, S.; Cao, Z.; Qiu, L.; Du, X.; Liu, Y.; Wang, G.; Zhang, L.; et al. MBOAT7 rs641738 (C>T) is associated with NAFLD progression in men and decreased ASCVD risk in elder Chinese population. Front. Endocrinol. 2023, 14, 1199429. [Google Scholar] [CrossRef] [PubMed]
- Hsu, C.L.; Wu, F.Z.; Lin, K.H.; Chen, Y.H.; Wu, P.C.; Chen, Y.H.; Chen, C.S.; Wang, W.H.; Mar, G.Y.; Yu, H.C. Role of Fatty Liver Index and Metabolic Factors in the Prediction of Nonalcoholic Fatty Liver Disease in a Lean Population Receiving Health Checkup. Clin. Transl. Gastroenterol. 2019, 10, e00042. [Google Scholar] [CrossRef]
- Mendez-Sanchez, N.; Brouwer, W.P.; Lammert, F.; Yilmaz, Y. Metabolic dysfunction associated fatty liver disease in healthy weight individuals. Hepatol. Int. 2024, 18, 884–896. [Google Scholar] [CrossRef]
- Hooper, R. To adjust, or not to adjust, for multiple comparisons. J. Clin. Epidemiol. 2025, 180, 111688. [Google Scholar] [CrossRef]

Disclaimer/Publisher’s Note: The statements, opinions and data contained in all publications are solely those of the individual author(s) and contributor(s) and not of MDPI and/or the editor(s). MDPI and/or the editor(s) disclaim responsibility for any injury to people or property resulting from any ideas, methods, instructions or products referred to in the content. |
© 2025 by the authors. Licensee MDPI, Basel, Switzerland. This article is an open access article distributed under the terms and conditions of the Creative Commons Attribution (CC BY) license (https://creativecommons.org/licenses/by/4.0/).