Abstract
Background/Objectives: A concussive head injury increases the likelihood of temporal lobe epilepsy through mechanisms that are not entirely understood. This study aimed to investigate how two key histopathological features shared by both TLE (temporal lobe epilepsy) and head injury—mossy fiber sprouting and hilar excitatory cell loss—contribute to the modulation of dentate gyrus excitability. Methods: A computational approach was used to explore the impact of specific levels of mossy fiber sprouting and mossy cell loss, while avoiding the confounding effects of concurrent changes. The dentate gyrus model consists of 500 granule cells, 15 mossy cells, 6 basket cells and 6 hilar perforant path-associated cells. Results: My simulations demonstrate a correlation between the degree of mossy fiber sprouting and the number of spikes in dentate gyrus granule cells (correlations coefficient R = 0.95, p < 0.0001) and other cells (correlations coefficient R = 0.99, p < 0.0001). The mean values (standard deviation, SD) and 95% CI for granule cell activity in the control group and percentage 10–50% of mossy fiber sprouting groups are 376.4 (16.7) (95% CI, 374.9–377.8) vs. 463.5 (24.3) (95% CI, 461.4–465.6) vs. 514.8 (32.5) (95% CI, 511.9–517.6) vs. 555.0 (40.4) (95% CI, 551.5–558.6) vs. 633.4 (51.8) (95% CI, 628.8–637.9) vs. 701.7 (66.2) (95% CI, 695.9–707.5). The increase in mossy fiber sprouting was significantly statistically associated with an increase in granule cell activity (p < 0.01). The removal of mossy cells led to a reduction in excitability within the model network (for granule cells, correlations coefficient R = −0.40, p < 0.0001). Conclusions: These results are generally consistent with experimental observations, which indicate a high degree of mossy fiber sprouting in animals with a higher frequency of seizures. Whereas unlike the strong hyperexcitability effects induced by mossy fiber sprouting, the removal of mossy cells led to reduced granule cell responses to perforant path activation.
1. Introduction
The precise mechanisms responsible for post-traumatic hyperexcitability in the dentate gyrus (DG) remain incompletely understood; however, experimental head trauma is associated with a distinct pattern of cell loss in the hilus [1,2,3]. More recently, whole-brain connectomics has revealed that traumatic brain injury profoundly rewires dentate inhibitory circuits and destabilizes mossy cell populations, offering a network-level explanation for chronic DG hyperexcitability [4]. Moreover, experimental head injury is linked to the development of recurrent excitatory collateral sprouting from granule cell axons [5,6]. These changes resemble the histopathological features found in tissue from individuals with temporal lobe epilepsy, where currently around 50 million individuals are affected by epilepsy, with approximately 40% of these cases classified as temporal lobe epilepsy [7,8].
Contemporary work corroborates these observations: silencing DG activity mitigates MFS and delays epileptogenesis in kindling models [9], while high-resolution studies link MeCP2 signaling [10] and adult-born granule cells to injury-induced axon sprouting [11].
Although MFS is widely thought to amplify excitatory feedback within the granule-cell layer, its exact role in seizure generation remains debated. Emerging data suggest a dorsoventral imbalance in mossy-cell vulnerability and context-dependent modulation of dentate gating [7,12,13,14,15]. Mossy fibers typically extend through the dentate hilus and stratum lucidum, forming synaptic connections with hilar cells and CA3 neurons [16]. In the hippocampus of individuals with temporal lobe epilepsy, however, mossy fiber collaterals aberrantly extend into the inner molecular layer of the dentate gyrus, where the sprouted fibers provide excitatory recurrent input to the dendrites of granule cells [17,18]. This reorganization is commonly believed to contribute to hippocampal hyperexcitability, although the precise role of mossy fiber sprouting in TLE remains a subject of research.
Thus, the complexity of investigating the primary mechanisms underlying seizure onset makes computational simulation of the dentate gyrus an essential tool for gaining new insights. Computer modeling [19,20,21,22] has facilitated significant progress in understanding complex phenomena, such as epilepsy [23,24,25,26,27,28], and in silico studies have been effectively utilized to reduce, refine, and partially substitute for animal and human experimentation [29,30,31]. The study extends classical Fickian diffusion by introducing concentration-dependent coefficients and a memory kernel, yielding a spatiotemporal equation that more closely matches experimentally observed calcium spread inside cells. Its simulations show that incorporating cellular “memory” produces non-Gaussian diffusion fronts and markedly slower equilibration, providing a mechanistic explanation for heterogeneous calcium microdomains [32]. Complementing this macroscopic perspective, the paper applies artificial neural networks to model local neuronal calcium transients, demonstrating that data-driven architectures can capture nonlinear channel kinetics and outperform traditional deterministic models in predicting sub-micron signaling hotspots [33].
As demonstrated earlier, modeling analysis serves as a valuable tool for investigating the epileptogenic mechanisms underlying temporal lobe epilepsy. A comprehensive understanding of the mechanisms underlying the generation and propagation of TLE within the hippocampal-entorhinal cortex system requires an integrated network model that emphasizes neuronal diversity. Accordingly, I have developed a neuronal network model to investigate the fundamental mechanisms underlying epilepsy generation. The simulation model integrates formalisms derived from previous studies [19,20,21].
This study aimed to deepen mechanistic understanding of the potential roles of mossy fiber sprouting and mossy cell loss in dentate excitability, with a specific focus on post-traumatic hyperexcitability. The simulations enable discussion on the intricate role of synaptic reorganization associated with experimental models of status epilepticus.
2. Materials and Methods
A scaled-down version of the dentate network was developed, reducing the number of the four primary cell types in the dentate gyrus by a factor of 2000:1 [34]. Figure 1 displays the structures of the hippocampus, such as the dentate gyrus, CA3, CA1, and the representation of the simulated microcircuit model for the DG network. The dentate gyrus model consists of 500 granule cells, 15 mossy cells, 6 basket cells and 6 hilar perforant path-associated cells. Based on their morphological structure and the presence of specific markers, neurons in the dentate gyrus are categorized into excitatory and inhibitory neurons. The first two neuron types are of the excitatory kind, whereas the latter two are inhibitory. The simulation model incorporated formalism from earlier studies [19,20,21]. A simplified demo version of the simulation model is available on the website: https://github.com/dswietlik/Dariusz-Swietlik/blob/main/Neuron%20model (accessed on 17 February 2022). The simulation environment was developed using the Delphi programming language. Each simulation consisted of 20,000 steps, with a temporal resolution of 0.5 milliseconds per step. The duration of each simulation is 10 s.
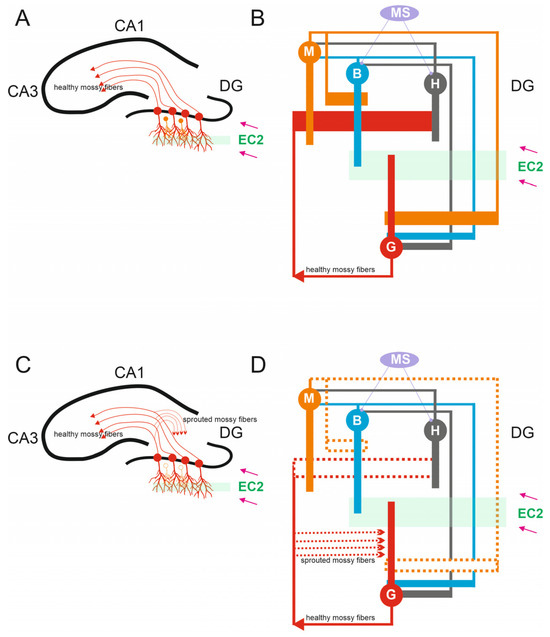
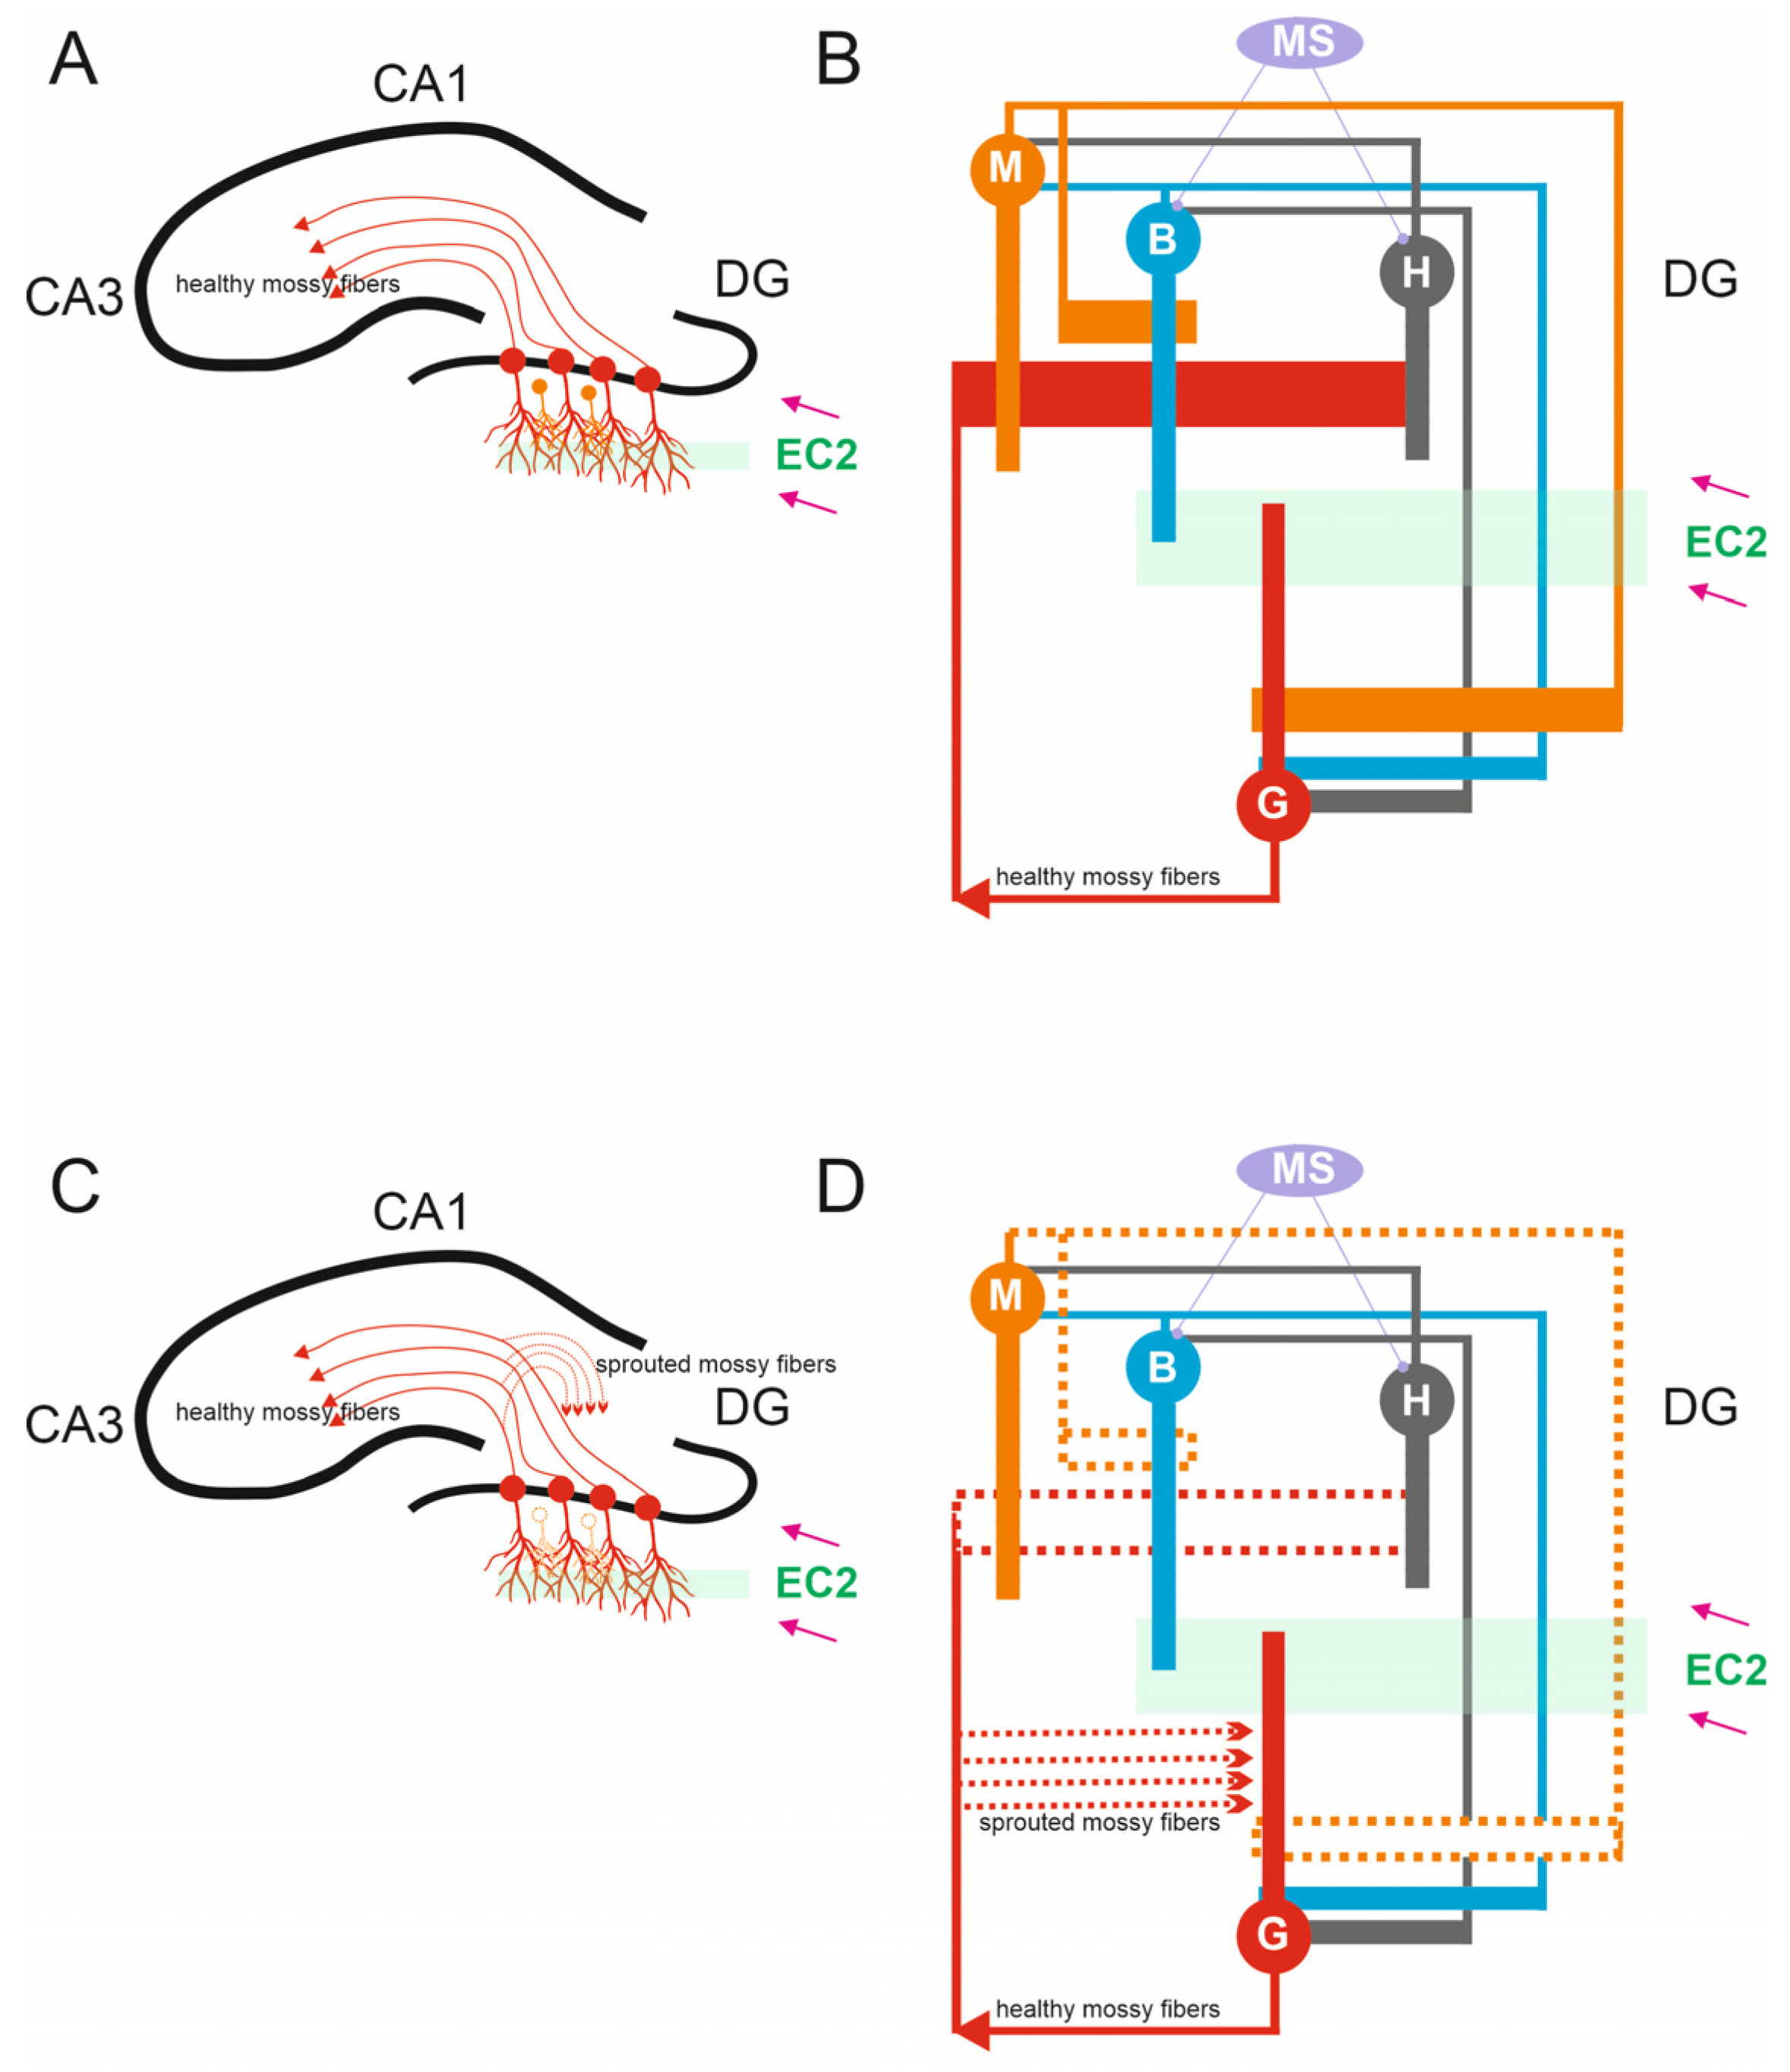
Figure 1.
Anatomy of Dentate Circuits. (A) Schematic of hippocampal structures including the DG, CA3, and CA1. In a healthy brain, mossy fibers are the axons that arise from glutamatergic dentate granule cells found within the granule cell layer of the dentate gyrus. Healthy mossy fibers provide input to CA3 pyramidal cells. DG granule cells received excitatory inputs from the entorhinal cortex 2 (EC2). (B) A representation of the simulated microcircuit model of the DG network, granule cells G, mossy cells M, basket cells B, hilar perforant path-associated cells H, and medial-septum-diagonal band (MS). (C) In the epileptic hippocampus, the loss of mossy fiber targets in the hilus leads granule cell axons to sprout and densely innervate the inner molecular layer of the dentate gyrus, a process known as mossy fiber sprouting. (D) In the case of mossy cell loss, chosen mossy cells were effectively “killed” by removing all synapses linked to and from these “dead” cells (dashed line).
2.1. Development of Biophysically Accurate Multicompartmental Models of Dentate Cells
We developed a multi-compartment hippocampal network model comprising dentate granule cells, basket interneurons and mossy cells. Each cell type was represented with simplified morphologies that included the soma, dendrite, and axon. The synaptic scheme incorporates AMPA- and NMDA-mediated glutamatergic transmission alongside GABAergic inhibition. Model equations and connectivity rules follow previously validated formalisms. Neuronal morphologies were reduced to 16 biophysical compartments—soma, a proximal axonal segment and simplified dendritic trees—whose passive and active properties were drawn from experimental and computational studies [19,20,21]. Excitatory and inhibitory synapses were assigned to the appropriate compartments. To capture intrinsic rhythmic drive, we imposed septo-hippocampal theta input (4–12 Hz), transmitted via the fornix and phase-locked to faster gamma oscillations, consistent with in vivo observations.
The biophysical characteristics of each cell were derived from cell types documented in the literature, which have been thoroughly validated against experimental data [17,23,35,36,37,38,39,40]. Table 1 provides details showing that the intrinsic properties of the model cells depicted in Figure 1 align with data from their biological equivalents in ionotropic receptors [3,41].

Table 1.
Physiological properties of cell types.
2.2. Granule Cells
Every granule cell comprised 16 compartments, each equipped with a calcium pump, a sodium current, and currents for K+ and Ca2+. Every granule cell received excitatory input on its distal third dendrites from layer 2 of the Entorhinal Cortex (EC), and on its proximal third dendrites from mossy cells. Additionally, it received inhibitory inputs on its soma and medial third dendrites from basket cells and hilar perforant path-associated cells.
2.3. Mossy Cells
Each mossy cell consisted of 16 compartments, each containing Na+, K+ and Ca2+ currents. Each mossy cell received excitatory inputs in its proximal dendrites from granule cells and other mossy cells, along with inhibitory inputs in its soma and medial dendrites from the basket cells and hilar perforant path-associated cell.
2.4. Basket Cells
Each basket cell consisted of 16 compartments, each containing Na+ and K+ currents. Each basket cell received excitatory input from layer 2 of the Entorhinal Cortex, excitatory inputs from granule and mossy cells in its proximal and medial dendrites, inhibitory inputs to its soma from medial septum, and inhibitory inputs from hilar perforant path-associated cells and other basket cells.
2.5. Hilar Perforant Path-Associated Cells
Hilar perforant path-associated cells consisted of 16 compartments, each containing Na+ and K+ currents. Each hilar perforant path-associated cell received excitatory input from granule cells in its proximal dendrites, excitatory inputs from the mossy cells in its medial dendrites, and inhibitory input to its soma from the medial septum.
2.6. Simulating Mossy Fiber Sprouting
Synaptic connections from granule cells to the proximal dendrites of other granule cells were introduced to simulate mossy fiber sprouting. In our scaled-down network, we postulated that 100 newly sprouted synapses equated to 100% mossy fiber sprouting [23]. In this study, the density of mossy fiber sprouting was limited to 0–50% to model the mild to moderate increase in mossy fiber sprouting after a concussive head injury [5]. It should be noted that 100% sprouting corresponds to the level of sprouting seen following seizures induced by pilocarpine [17].
2.7. Mossy Cell Loss
To simulate total loss of mossy cells, all synaptic connections to and from mossy cells were eliminated. In the case of 50% mossy cell loss, eight randomly chosen mossy cells were effectively “killed” by removing all synapses linked to and from these “dead” cells [23].
2.8. Statistical Methods
Statistical evaluations were conducted using Statistica TIBCO Software Inc., San Ramon, CA, USA (2017) (data analysis software system), version 13. https://www.tibco.com/. ANOVA or the Kruskal–Wallis test was used to demonstrate differences between groups along with post hoc tests. In order to determine dependence, strength, and direction between variables, correlation analysis was used by determining Spearman’s correlation coefficients. The significance level was set at 5%.
3. Results
3.1. The Role of Pathological Phenomena of Mossy Fiber Sprouting
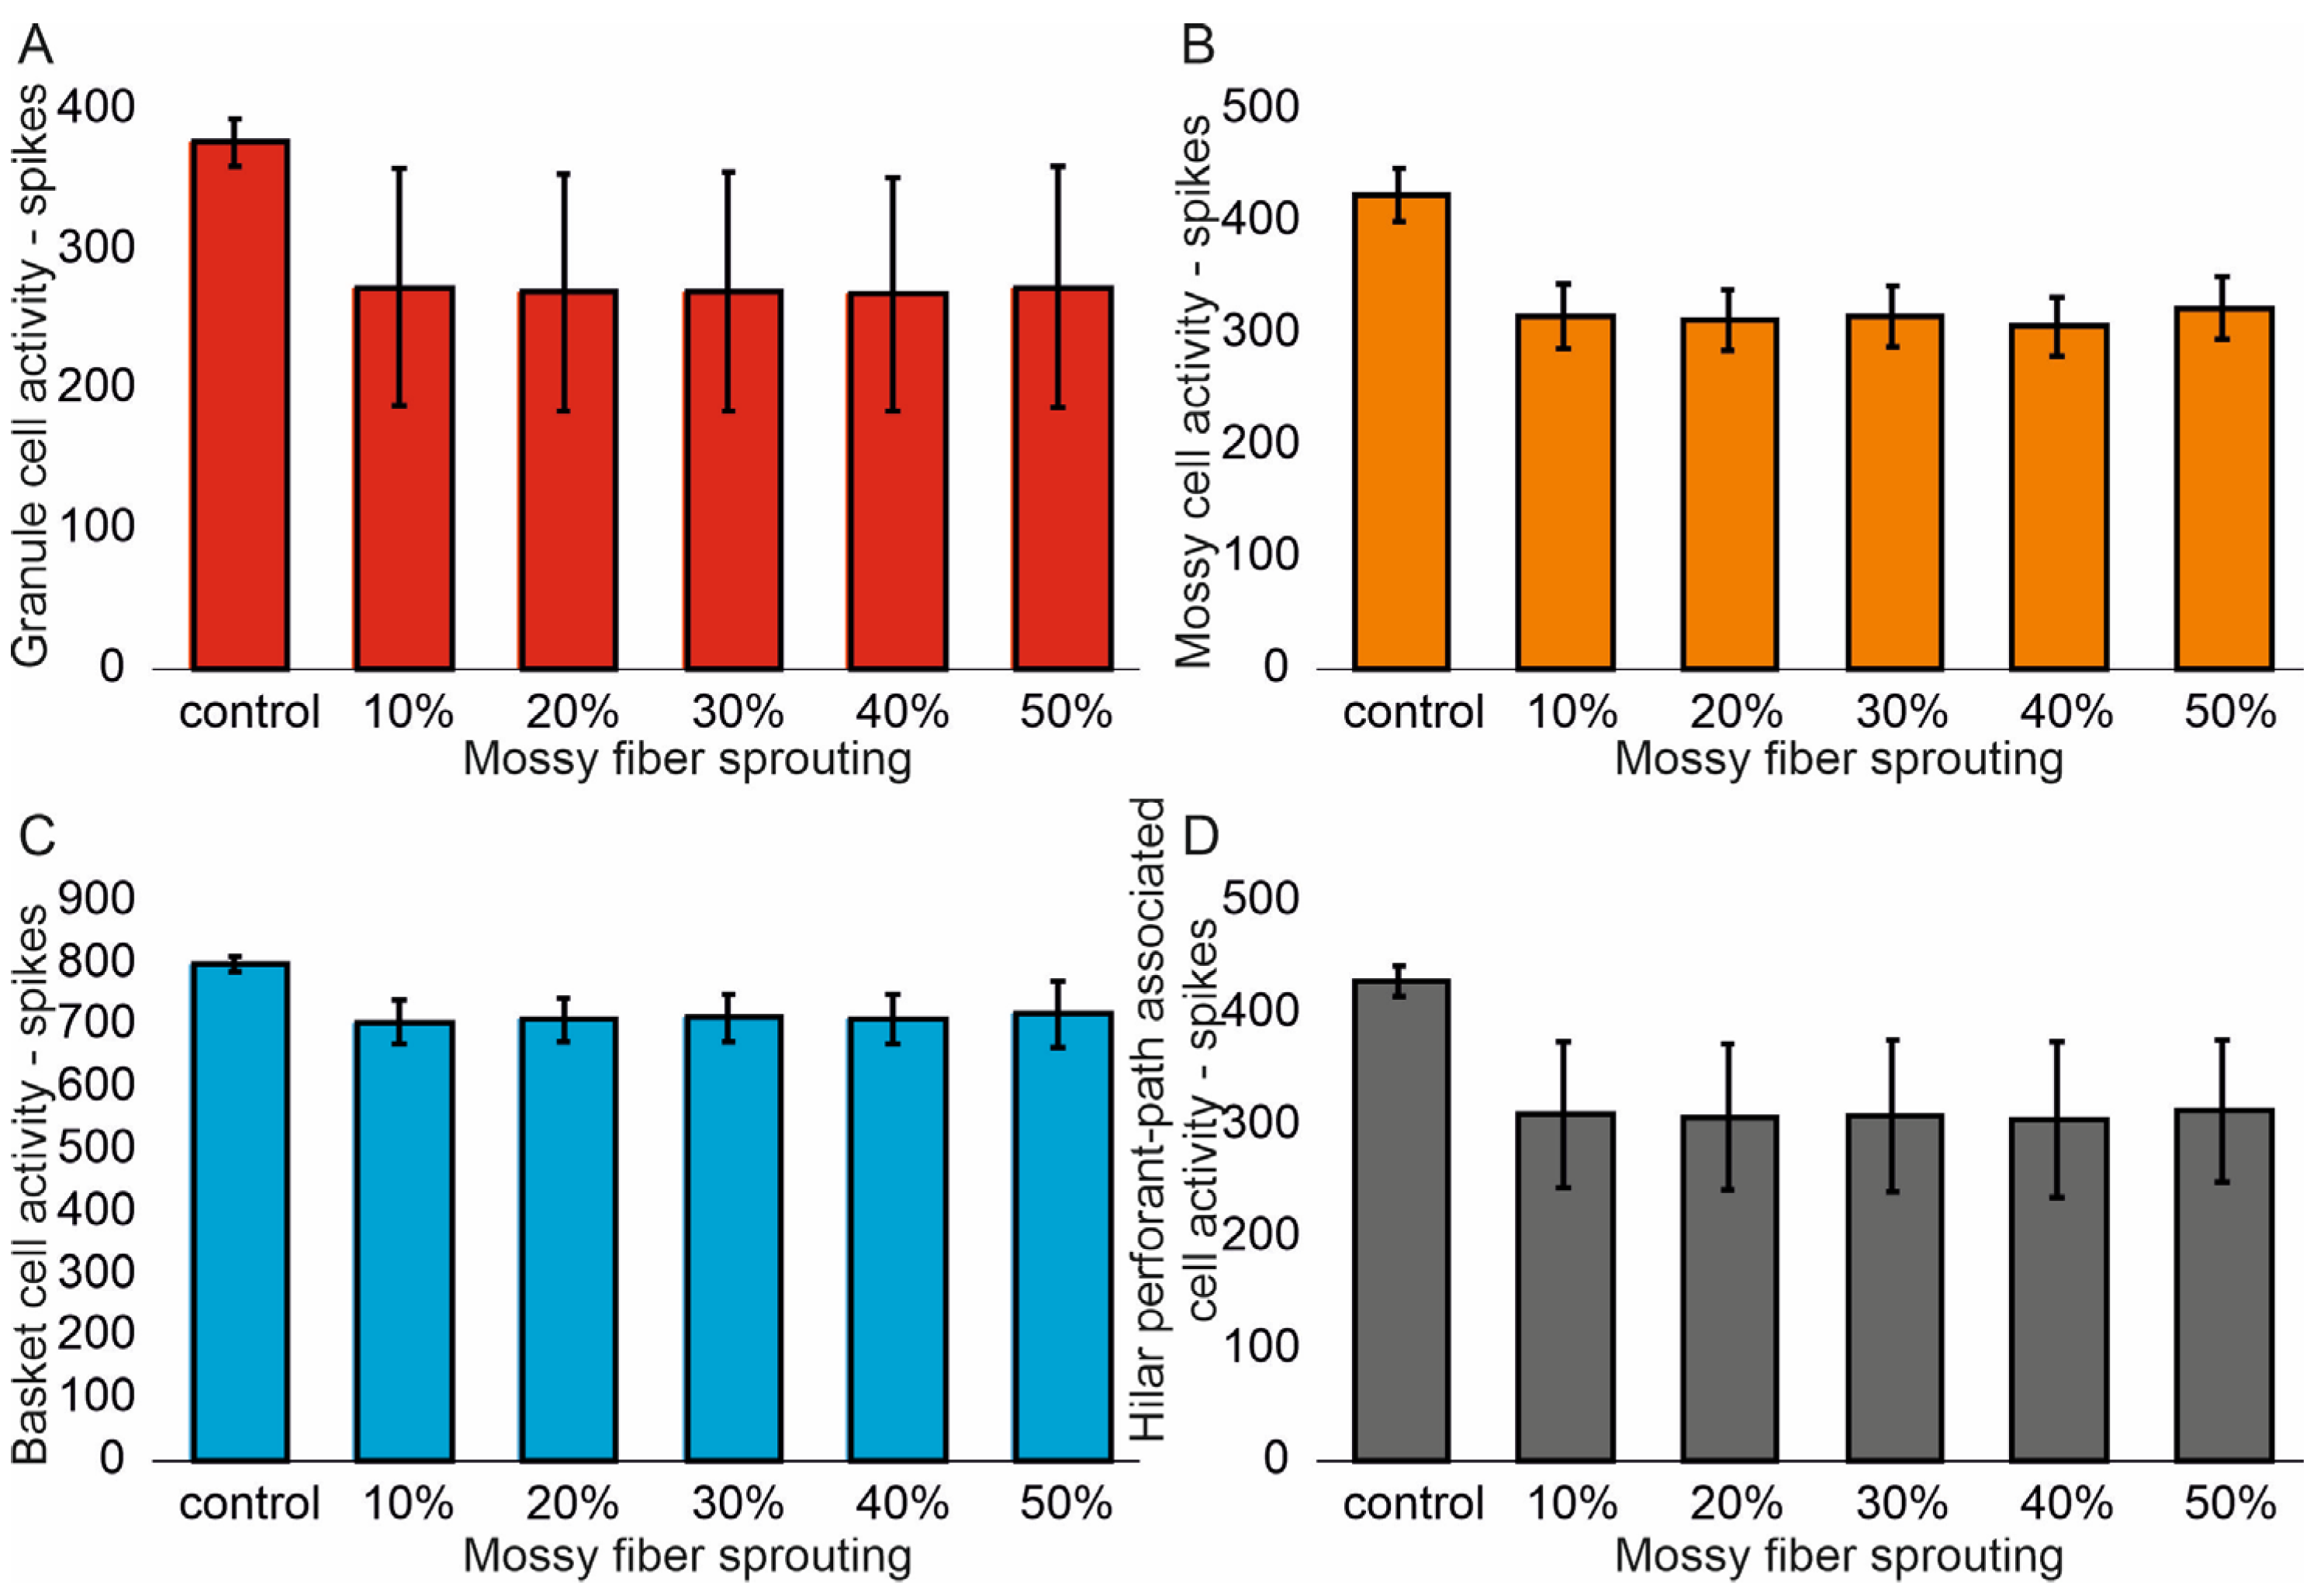
The mean values (standard deviation, SD) and 95% CI for granule cell activity in the control group and percentage 10–50% of mossy fiber sprouting groups are 376.4 (16.7) (95% CI, 374.9–377.8) vs. 463.5 (24.3) (95% CI, 461.4–465.6) vs. 514.8 (32.5) (95% CI, 511.9–517.6) vs. 555.0 (40.4) (95% CI, 551.5–558.6) vs. 633.4 (51.8) (95% CI, 628.8–637.9) vs. 701.7 (66.2) (95% CI, 695.9–707.5). There were statistically significant differences in granule cell activity versus groups (p < 0.001). Post hoc tests showed that granule cell activity was significantly higher in mossy fiber sprouting groups relative to the control group (p < 0.01). The increase in mossy fiber sprouting was significantly statistically associated with an increase in granule cell activity (p < 0.01), Figure 2A. A correlation was obtained between the degree of mossy fiber sprouting and the number of spikes for granule cells (correlations coefficient R = 0.95, p < 0.0001). The mean values (standard deviation, SD) and 95% CI for mossy cell activity in the control group and percentage 10–50% of mossy fiber sprouting groups are 424.5 (23.7) (95% CI, 411.4–437.7) vs. 695.7 (29.7) (95% CI, 679.2–712.1) vs. 815.7 (34.8) (95% CI, 796.5–835.0) vs. 915.7 (35.0) (95% CI, 896.3–935.0) vs. 1069.3 (33.1) (95% CI, 1051.0–1087.7) vs. 1216.6 (33.0) (95% CI, 1198.3–1234.9). There were statistically significant differences in mossy cell activity versus groups (p < 0.01). The increase in mossy fiber sprouting was significantly statistically associated with an increase in mossy cell activity (p < 0.0001), similar for granule cells Figure 2B. A correlation was obtained between the degree of mossy fiber sprouting and the number of spikes for mossy cells (correlations coefficient R = 0.99, p < 0.0001).
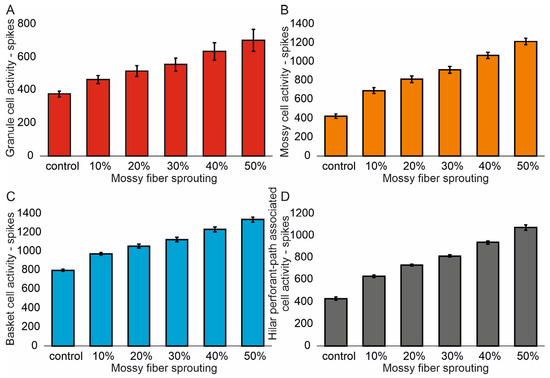
Figure 2.
The cell activity (spikes) in the control group and mossy fiber sprouting groups. (A) Granule cell activity. (B) Mossy cell activity. (C) Basket cell activity. (D) Hilar perforant path-associated cell activity.
The mean values (standard deviation, SD) and 95% CI for basket cell activity in the control group and percentage 10–50% of mossy fiber sprouting groups are 799.3 (12.2) (95% CI, 786.5–812.2) vs. 974.2 (14.9) (95% CI, 958.6–989.8) vs. 1056.2 (21.4) (95% CI, 1033.7–1078.7) vs. 1124.5 (25.3) (95% CI, 1097.9–1151.1) vs. 1232.3 (24.5) (95% CI, 1206.6–1258.0) vs. 1336.3 (27.3) (95% CI, 1307.7–1365.0). There were statistically significant differences in basket cell activity versus groups (p < 0.0001). The increase in mossy fiber sprouting was significantly statistically associated with an increase in basket cell activity (p < 0.0001), Figure 2C. A correlation was obtained between the degree of mossy fiber sprouting and the number of spikes for basket cells (correlations coefficient R = 0.99, p < 0.0001). The mean values (standard deviation, SD) and 95% CI for hilar perforant path-associated cell activity in the control group and percentage 10–50% of mossy fiber sprouting groups are 429.3 (13.5) (95% CI, 415.2–443.5) vs. 629.3 (12.2) (95% CI, 616.5–642.1) vs. 731.8 (8.5) (95% CI, 722.9–740.8) vs. 815.8 (11.8) (95% CI, 803.4–828.2) vs. 939.8 (14.2) (95% CI, 924.9–954.7) vs. 1074.5 (23.5) (95% CI, 1049.8–1099.2). There were statistically significant differences in hilar perforant path-associated cell activity versus groups (p < 0.0001). Post hoc tests showed that hilar perforant path-associated cell activity were significantly higher in 30–50% mossy fiber sprouting groups, relative to the control group (p < 0.05). Furthermore, post hoc tests showed that hilar perforant path-associated cell activity was significantly higher in 40–50% mossy fiber sprouting groups relative to the 10% mossy fiber sprouting group (p < 0.05) and were significantly higher in 50% mossy fiber sprouting group relative to 20% mossy fiber sprouting group (p = 0.0463) Figure 2D. A correlation was obtained between the degree of mossy fiber sprouting and the number of spikes for hilar perforant path-associated cells (correlations coefficient R = 0.99, p < 0.0001).
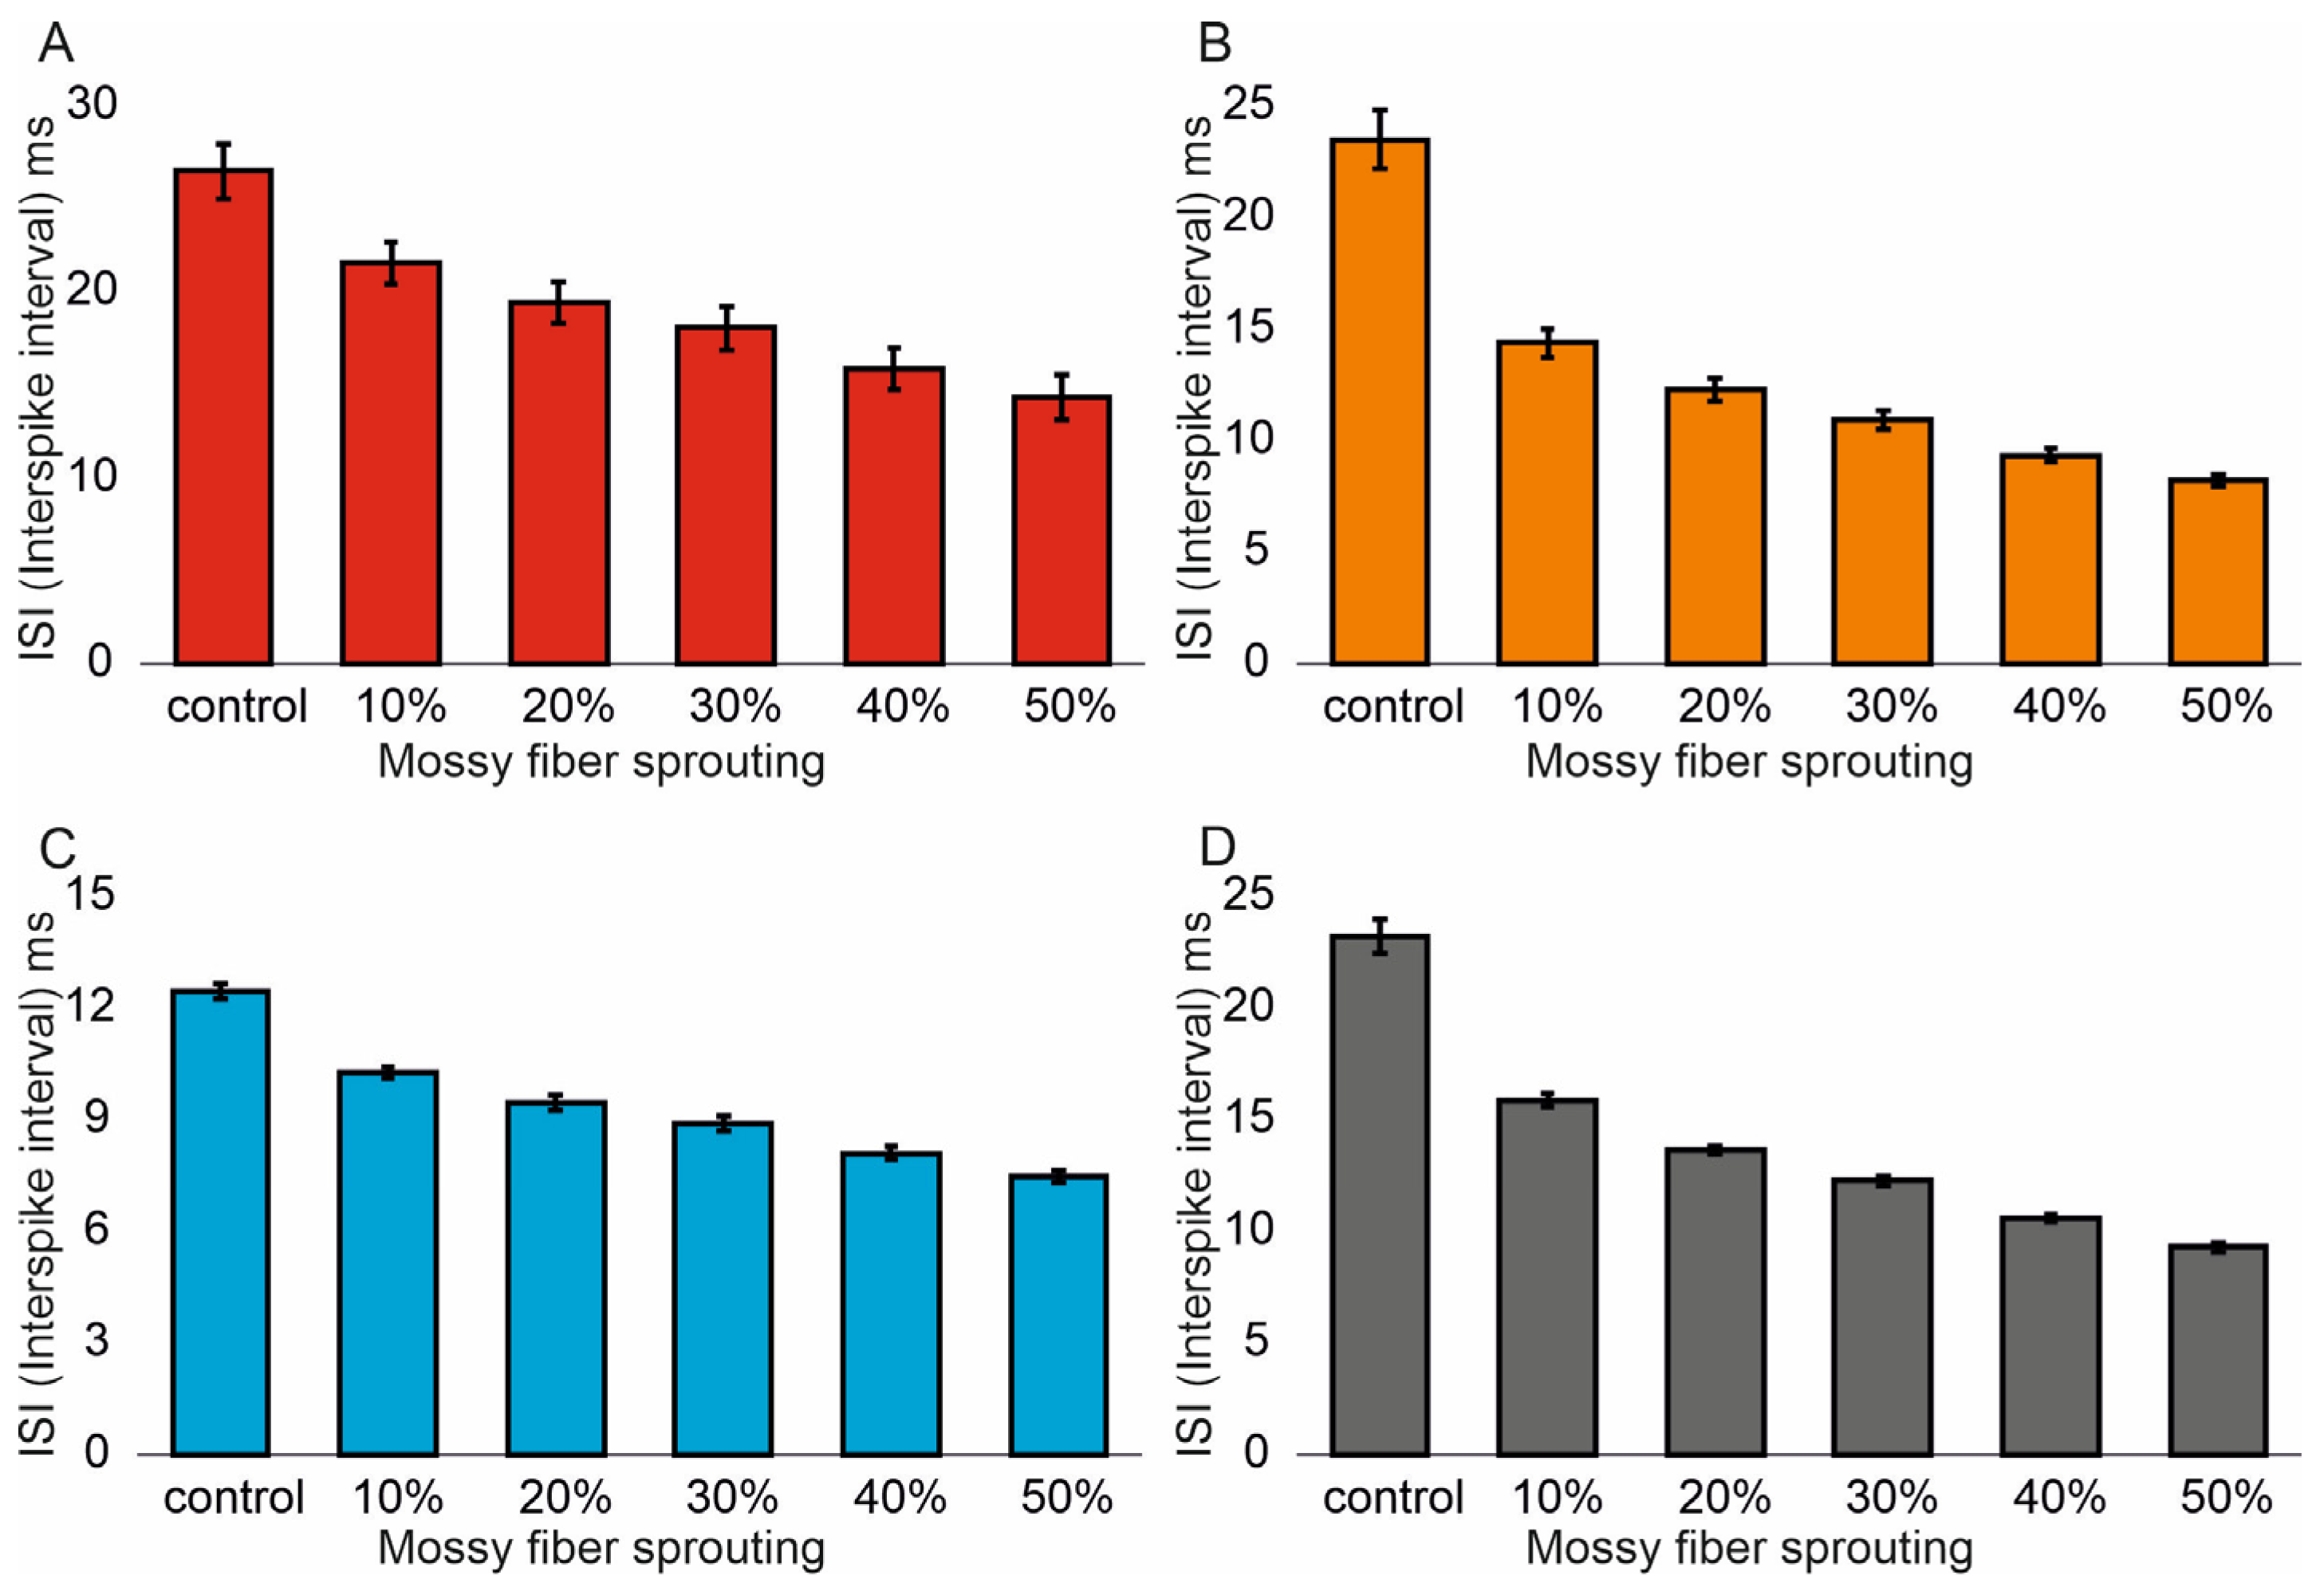
Similar associations were obtained for ISI (Interspike interval). In the control model for granule cells, the value was 26.5 (1.4) ms and (95% CI, 26.4–26.6). However, with increasing mossy fiber sprouting, the values were 21.6 (1.1) ms and (95% CI, 21.5–21.7), 19.5 (1.1) ms and (95% CI, 19.4–19.6), 18.1 (1.2) ms and (95% CI, 18.0–18.2), 15.9 (1.1) ms and (95% CI, 15.8–16.0), and 14.3 (1.2) ms and (95% CI, 14.2–14.4). There were statistically significant ISI differences for granule cells with increasing mossy fiber sprouting (p < 0.001). All groups were statistically different from each other (post hoc tests p < 0.01), Figure 3A. A correlation was obtained between the degree of mossy fiber sprouting and ISI for granule cells (correlations coefficient R = −0.95, p < 0.0001). The mean values (standard deviation, SD) and 95% CI for mossy cell ISI in the control group and percentage 10–50% of mossy fiber sprouting groups were 23.5 (1.3) ms (95% CI, 22.8–24.2) vs. 14.4 (0.6) ms (95% CI, 14.0–14.7) vs. 12.3 (0.5) ms (95% CI, 12.0–12.6) vs. 10.9 (0.4) ms (95% CI, 10.7–11.2) vs. 9.4 (0.3) ms (95% CI, 9.2–9.5) vs. 8.2 (0.2) ms (95% CI, 8.1–8.3). There were statistically significant differences in mossy cell ISI versus groups (p < 0.01). All groups were statistically different from each other (post hoc tests p < 0.001), Figure 3B. A correlation was obtained between the degree of mossy fiber sprouting and ISI for mossy cells (correlations coefficient R = −0.99, p < 0.0001). The mean values (standard deviation, SD) and 95% CI for basket cell ISI in the control group and percentage 10–50% of mossy fiber sprouting groups were 12.5 (0.2) ms, (95% CI, 12.3–12.7) vs. 10.3 (0.2) ms, (95% CI, 10.1–10.4) vs. 9.5 (0.2) ms, (95% CI, 9.3–9.7) vs. 8.9 (0.2) ms, (95% CI, 8.7–9.1) vs. 8.1 (0.2) ms, (95% CI, 7.9–8.3) vs. 7.5 (0.2) ms, (95% CI, 7.3–7.6). There were statistically significant differences in basket cell ISI versus groups (p < 0.0001). All groups were statistically different from each other (post hoc tests p < 0.001), Figure 3C. A correlation was obtained between the degree of mossy fiber sprouting and ISI for basket cells (correlations coefficient R = −0.99, p < 0.0001).
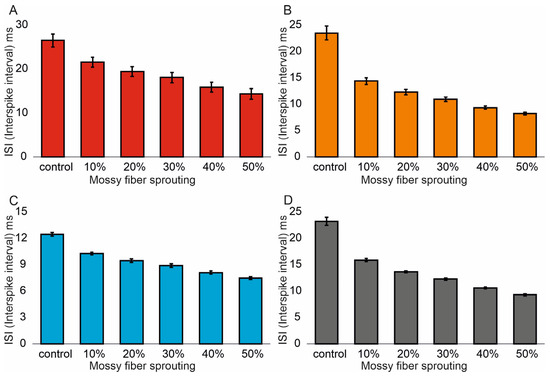
Figure 3.
Interspike interval in the control group and mossy fiber sprouting groups. (A) Granule cell activity. (B) Mossy cell activity. (C) Basket cell activity. (D) Hilar perforant path-associated cell activity.
In the control model for hilar perforant path-associated cell the ISI value was 23.2 (0.8) ms and (95% CI, 22.4–24.0), but in the increase in mossy fiber sprouting were 15.9 (0.3) ms and (95% CI, 15.6–16.2), 13.7 (0.2) ms and (95% CI, 13.5–13.8), 12.3 (0.2) ms and (95% CI, 12.1–12.4), 10.6 (0.2) ms and (95% CI, 10.5–10.8). 9.3 (0.2) ms and (95% CI, 9.1–9.5). There were statistically significant differences in hilar perforant path-associated cell ISI versus groups (p < 0.0001). Post hoc tests showed that hilar perforant path-associated cell ISI were significantly higher in the control group relative to 30–50% mossy fiber sprouting groups (p < 0.05). Furthermore, post hoc tests showed that hilar perforant path-associated cell ISI were significantly higher in 10% mossy fiber sprouting groups, relative to 40–50% mossy fiber sprouting group (p < 0.05) and were significantly higher in 20% mossy fiber sprouting group, relative to 50% mossy fiber sprouting group (p = 0.0463), Figure 3D. A correlation was obtained between the degree of mossy fiber sprouting and ISI for hilar perforant path-associated cells (correlations coefficient R = −0.99, p < 0.0001).
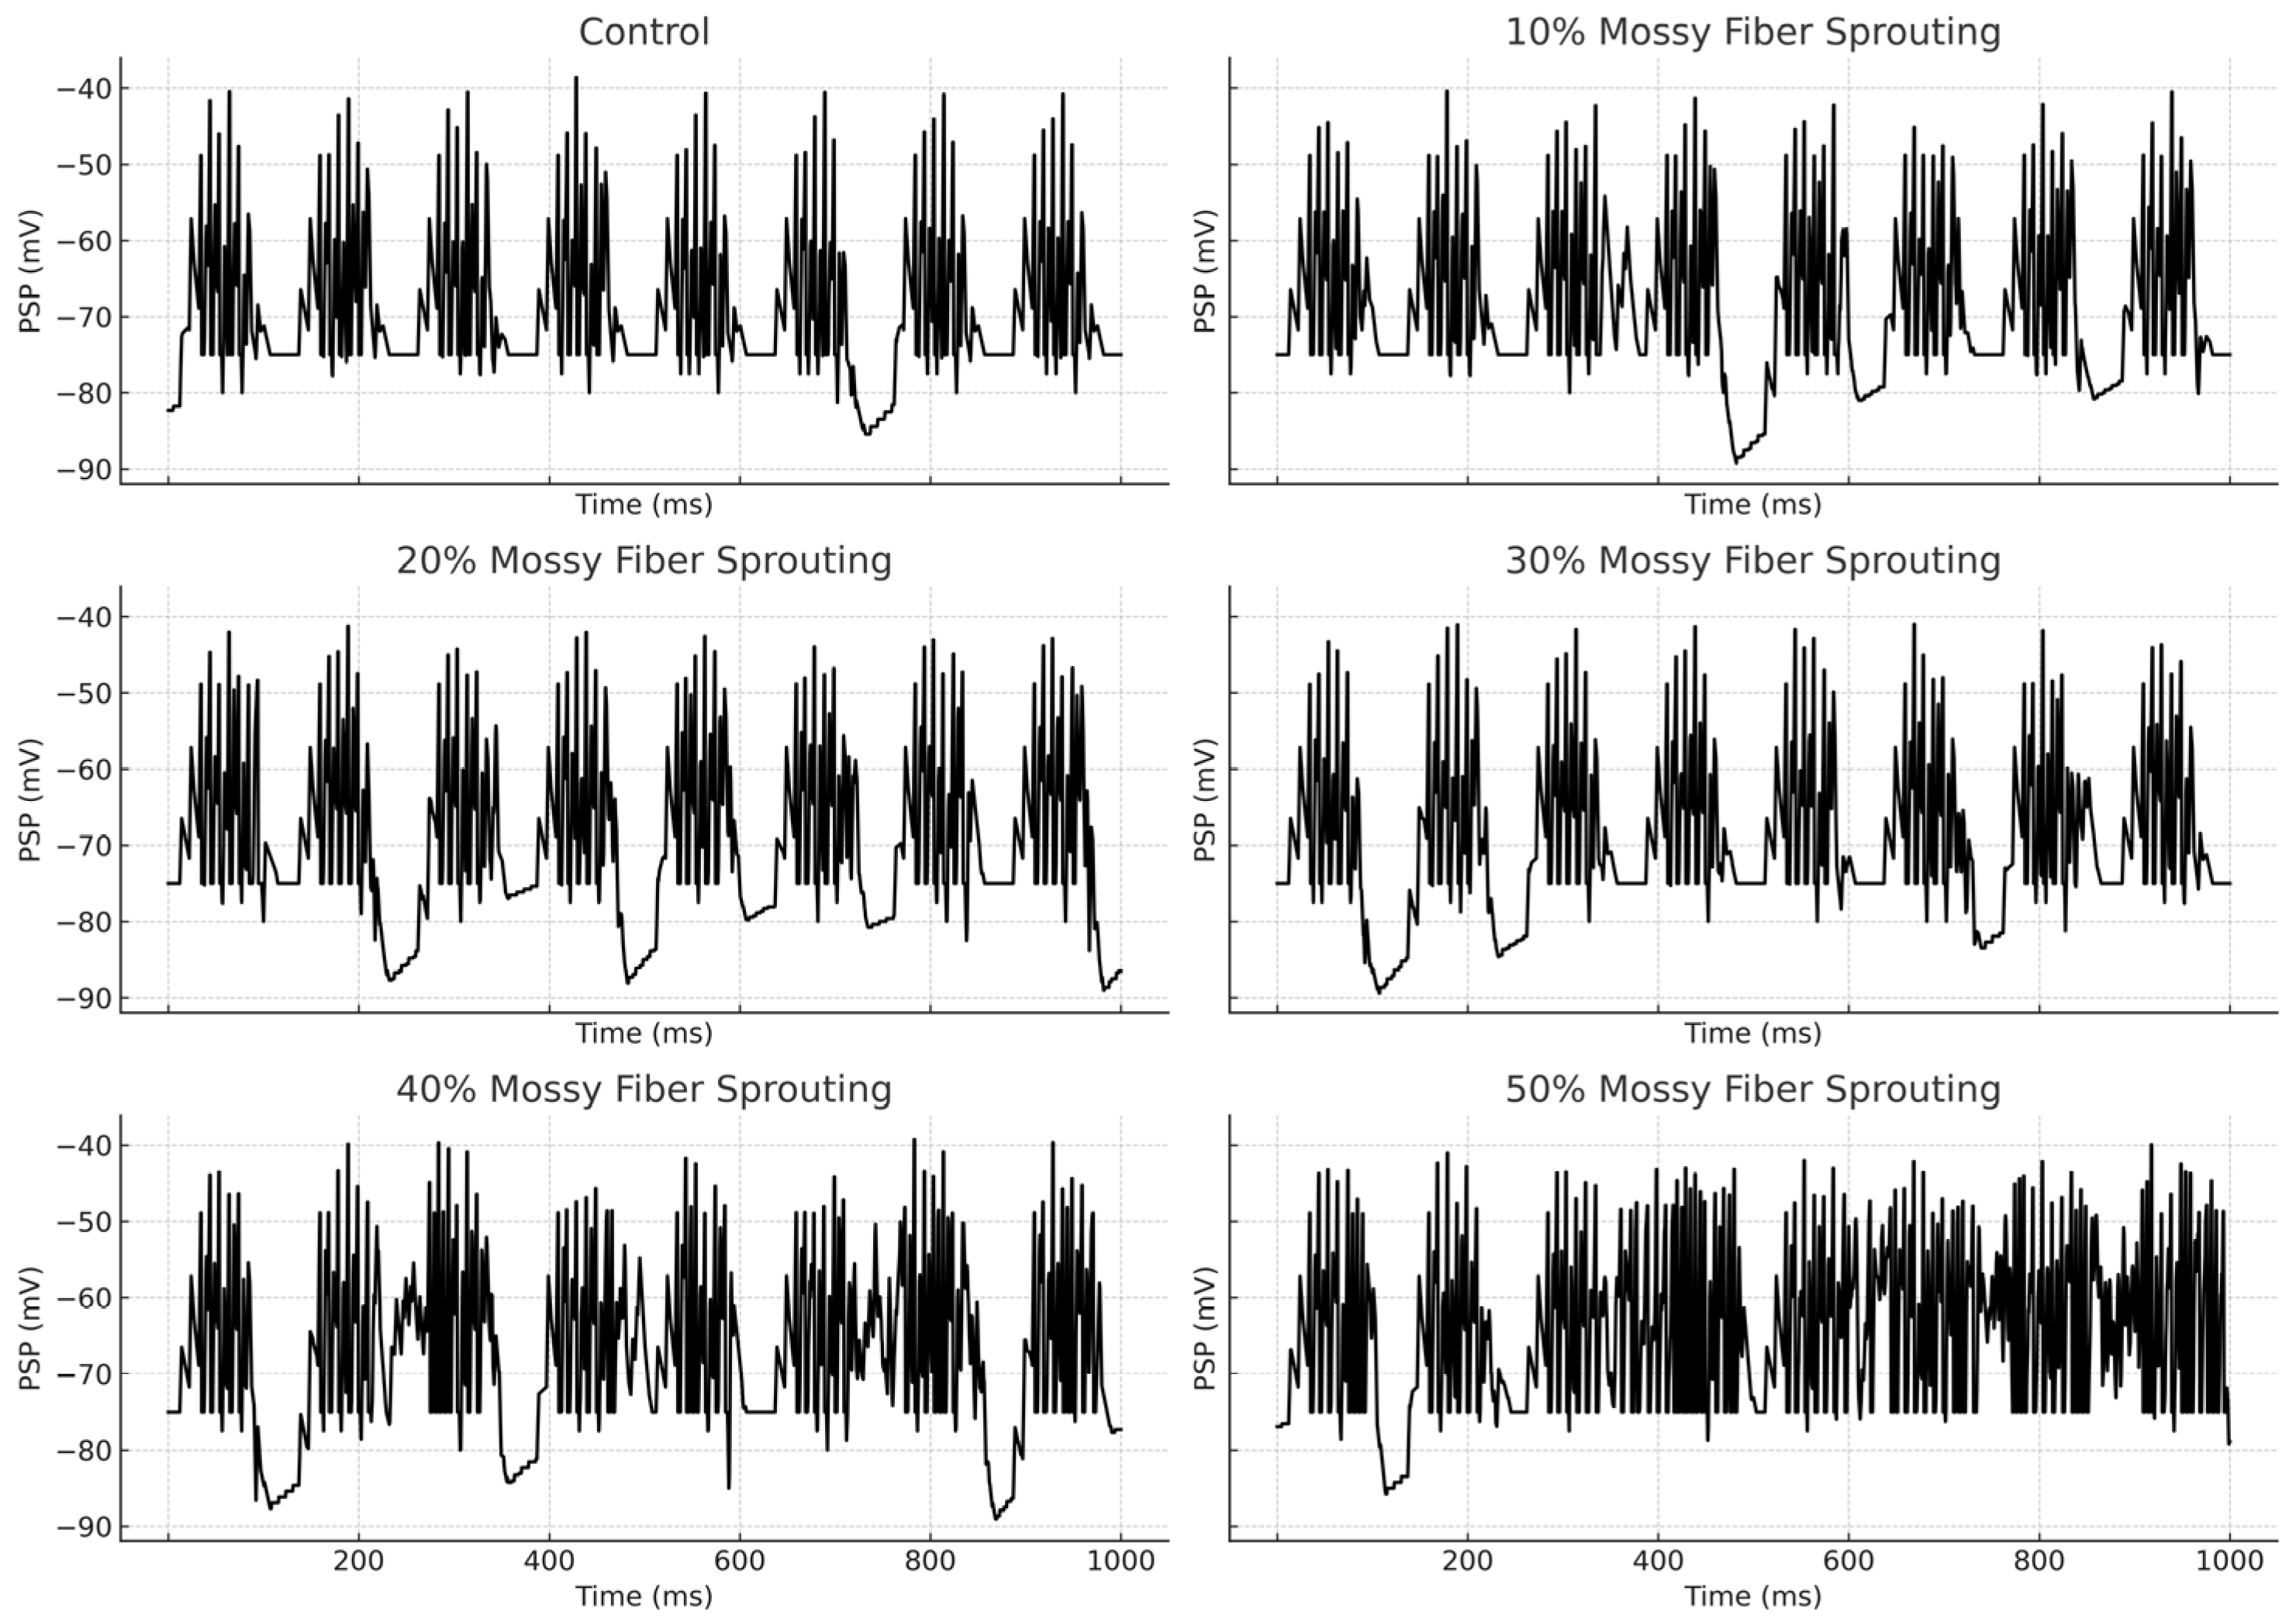
An increase in mossy fiber sprouting resulted in an overall rise in mossy cell activity. However, the activation of individual cells was variable—not all responded in the same way. Sprouting promoted more frequent firing, but also amplified the differences between individual cells, Figure 4.
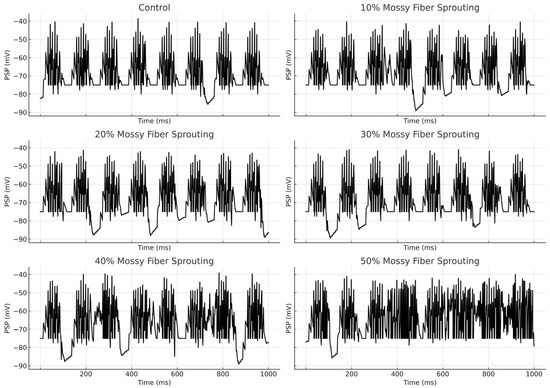
Figure 4.
Granule cell membrane voltage traces (PSP—postsynaptic potential) during the first second of the simulation.
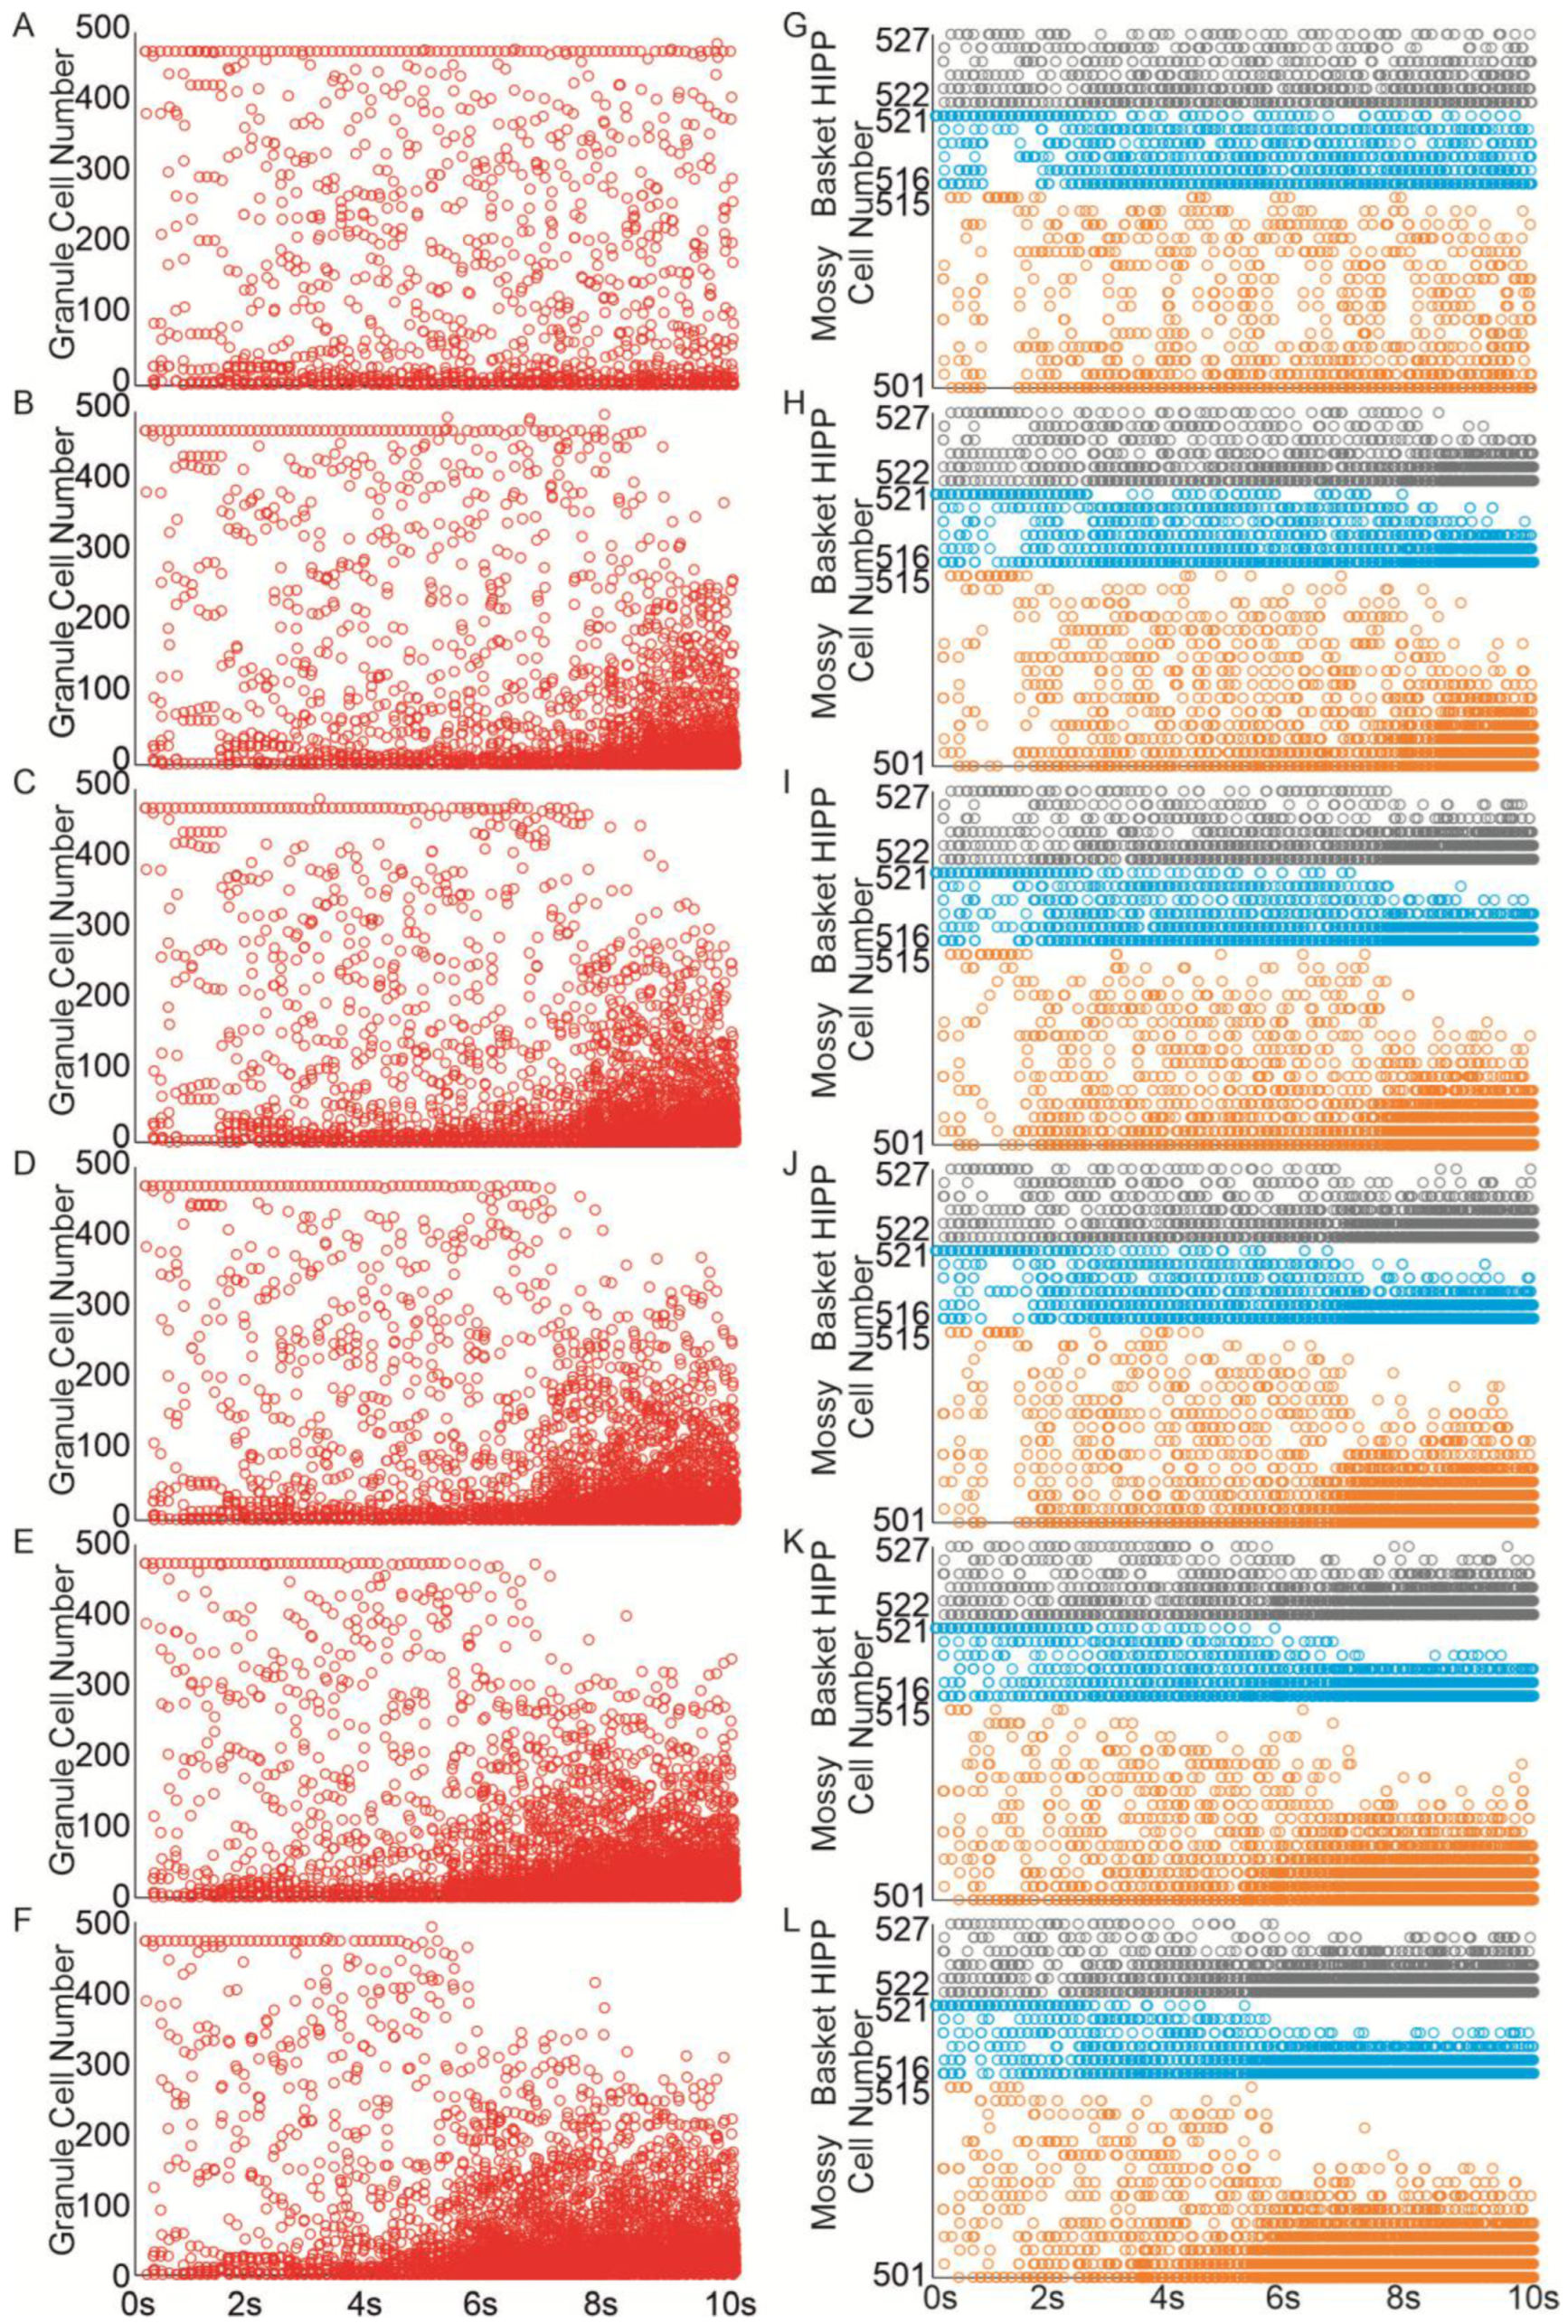
The extent of recurrent mossy fiber sprouting gradually increased from 0 to 50%. Even a 10% increase (equivalent to adding 10 recurrent mossy fiber connections per granule cell) led to the spread of activity from the initially activated granule cells to others, Figure 5B, and interneurons, Figure 5H. Increasing mossy fiber sprouting to 25% and 50% resulted in a more extensive propagation of activity, leading to the activation of all granule cells in the network and an extended duration of stimulation-induced network activity Figure 5A–F. When mossy fiber sprouting reached 15%, the localized activity extended to all inhibitory cells within the network Figure 5I–L.
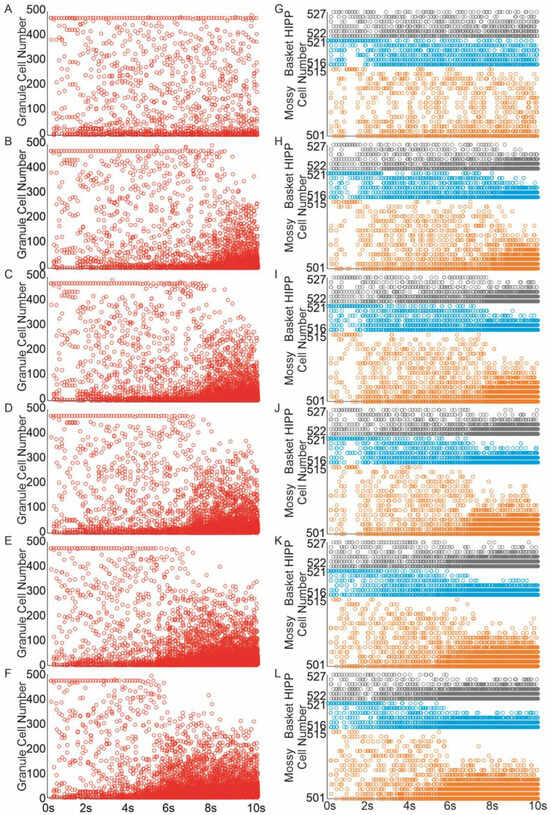
Figure 5.
Mossy fiber sprouting increases excitability in the dentate network. (A–F) Spike raster plots illustrating granule cell activity in the networks in response to perforant path input stimulation ((A)—control, (B–F) mossy fiber sprouting groups 10–50%). (G–L) Spike raster plots illustrating mossy, basket and hilar perforant path-associated cells activity in the networks in response to perforant path input stimulation ((G)—control, (H–L) mossy fiber sprouting groups 10–50%) (red—granule cell, orange—mossy cell, blue—basket cell, gray—hilar perforant path-associated cell).
3.2. The Role of Pathological Phenomena of Mossy Fiber Sprouting and Mossy Cell Loss
The mean values (standard deviation, SD) and 95% CI for granule cell activity in the control group and percentage 10–50% of mossy fiber sprouting and 50% mossy cell loss groups are 376.4 (16.7) (95% CI, 374.9–377.8) vs. 273.3 (84.1) (95% CI, 265.9–280.7) vs. 269.4 (84.9) (95% CI, 261.9–276.8) vs. 270.0 (85.7) (95% CI, 262.5–277.5) vs. 268.4 (83.3) (95% CI, 261.1–275.7) vs. 273.1 (86.4) (95% CI, 265.5–280.7). There were statistically significant differences in granule cell activity versus groups (p < 0.001). Post hoc tests showed that granule cell activity was significantly higher in the control group relative to mossy fiber sprouting and mossy cell loss groups (p < 0.01), Figure 6A. A correlation was obtained between the degree of mossy fiber sprouting (50% mossy cell loss) and the number of spikes for granule cells (correlations coefficient R = −0.40, p < 0.0001). The mean values (standard deviation, SD) and 95% CI for mossy cell activity in the control group and percentage 10–50% of mossy fiber sprouting and 50% mossy cell loss groups are 424.5 (23.7) (95% CI, 411.4–437.7) vs. 315.6 (28.7) (95% CI, 289.1–342.1) vs. 312.0 (27.1) (95% CI, 286.9–337.1) vs. 314.9 (27.2) (95% CI, 289.7–340.0) vs. 306.3 (26.6) (95% CI, 281.7–330.9) vs. 322.6 (28.0) (95% CI, 296.7–348.4). There were statistically significant differences in mossy cell activity versus groups (p < 0.0001). Post hoc tests showed that mossy cell activity was significantly higher in the control group, relative to mossy fiber sprouting and mossy cell loss groups (p < 0.05), Figure 6B. A correlation was obtained between the degree of mossy fiber sprouting (50% mossy cell loss) and the number of spikes for mossy cells (correlations coefficient R = −0.61, p < 0.0001).

Figure 6.
The cell activity (spikes) in the control group and mossy fiber sprouting groups and 50% mossy cell loss. (A) Granule cell activity. (B) Mossy cell activity. (C) Basket cell activity. (D) Hilar perforant path-associated cell activity.
The mean values (standard deviation, SD) and 95% CI for basket cell activity in the control group and percentage 10–50% of mossy fiber sprouting and 50% mossy cell loss groups are 799.3 (12.2) (95% CI, 786.5–812.2) vs. 706.2 (34.0) (95% CI, 670.5–741.9) vs. 710.0 (35.1) (95% CI, 673.2–746.8) vs. 712.7 (37.8) (95% CI, 673.0–752.3) vs. 710.5 (40.0) (95% CI, 668.5–752.5) vs. 718.8 (52.9) (95% CI, 663.3–774.4). There were statistically significant differences in basket cell activity versus groups (p = 0.0119). Post hoc tests showed that mossy cell activity was significantly higher in the control group relative to 10% mossy fiber sprouting and 50% mossy cell loss group (p = 0.0151) and 40% mossy fiber sprouting and 50% mossy cell loss group (p = 0.0338), Figure 6C. There was no statistically significant correlation between the degree of mossy fiber sprouting (50% mossy cell loss) and the number of spikes for basket cells (correlations coefficient R = −0.31, p = 0.0649). The mean values (standard deviation, SD) and 95% CI for hilar perforant path-associated cell activity in the control group and percentage 10–50% of mossy fiber sprouting and 50% mossy cell groups are 429.3 (13.5) (95% CI, 415.2–443.5) vs. 309.5 (65.7) (95% CI, 240.6–378.4) vs. 307.7 (65.2) (95% CI, 239.2–376.1) vs. 309.0 (67.5) (95% CI, 238.2–379.8) vs. 305.0 (69.2) (95% CI, 232.4–377.6) vs. 313.2 (63.1) (95% CI, 247.0–379.3). There were statistically significant differences in hilar perforant path-associated cell activity versus groups (p = 0.0114). Post hoc tests showed that hilar perforant path-associated cell activity were significantly higher in the control group relative to 20–40% mossy fiber sprouting and 50% mossy cell loss groups (p < 0.05), Figure 6D. A correlation was obtained between the degree of mossy fiber sprouting (50% mossy cell loss) and the number of spikes for hilar perforant path-associated cells (correlations coefficient R = −0.41, p = 0.0123).
In the control model for granule cells, the ISI value was 26.5 (1.4) ms and (95% CI, 26.4–26.6). In contrast, with increased mossy fiber sprouting and 50% mossy cell loss, the values were 42.7 (27.1) ms and (95% CI, 40.4–45.1), 43.9 (29.4) ms and (95% CI, 41.3–46.5), 44.0 (30.3) ms and (95% CI, 41.4–46.7), 44.4 (31.3) ms and (95% CI, 41.7–47.2), and 43.0 (27.3) ms and (95% CI, 40.6–45.4). There were statistically significant differences in ISI for granule cells under increased mossy fiber sprouting and 50% mossy cell loss (p < 0.001). Post hoc tests showed that granule cell ISI were significantly lower in the control group relative to mossy fiber sprouting and mossy cell loss groups (p < 0.01), Figure 7A. A correlation was obtained between the degree of mossy fiber sprouting (50% mossy cell loss) and ISI for granule cells (correlations coefficient R = 0.40, p < 0.0001).
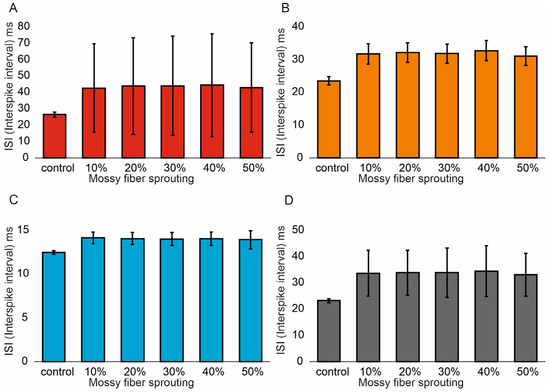
Figure 7.
Interspike interval in the control group and mossy fiber sprouting groups and 50% mossy cell loss. (A) Granule cell activity. (B) Mossy cell activity. (C) Basket cell activity. (D) Hilar perforant path-associated cell activity.
The mean values (standard deviation, SD) and 95% CI for mossy cel ISI in the control group and percentage 10–50% of mossy fiber sprouting and 50% mossy cell loss groups are 23.5 (1.3) ms (95% CI, 22.8–24.2) vs. 31.8 (3.1) ms (95% CI, 28.9–34.6) vs. 32.1 (3.0) ms (95% CI, 29.3–34.9) vs. 31.8 (3.0) ms (95% CI, 29.1–34.6) vs. 32.7 (3.0) ms (95% CI, 29.9–35.5) vs. 31.1 (2.9) ms (95% CI, 28.4–33.7). There were statistically significant differences in mossy cell ISI versus groups (p < 0.0001). Post hoc tests showed that mossy cell ISI in 20–40% mossy fiber sprouting and 50% mossy cell were significantly higher relative to the control group (p < 0.05), Figure 7B. A correlation was obtained between the degree of mossy fiber sprouting (50% mossy cell loss) and ISI for mossy cells (correlations coefficient R = 0.60, p < 0.0001). The mean values (standard deviation, SD) and 95% CI for basket cell ISI in the control group and percentage 10–50% of mossy fiber sprouting and 50% mossy cell groups are 12.5 (0.2) ms, (95% CI, 12.3–12.7) vs. 14.1 (0.7) ms, (95% CI, 13.4–14.8) vs. 14.1 (0.7) ms, (95% CI, 13.3–14.8) vs. 14.0 (0.7) ms, (95% CI, 13.2–14.8) vs. 14.1 (0.8) ms, (95% CI, 13.3–14.9) vs. 13.9 (1.1) ms, (95% CI, 12.8–15.0). There were statistically significant differences in basket cell ISI versus groups (p = 0.0116). Post hoc tests showed that basket cell ISI were significantly lower in the control group, relative to 10% mossy fiber sprouting and 50% mossy cell loss group (p = 0.0137) and 40% mossy fiber sprouting and 50% mossy cell loss group (p = 0.0322), Figure 7C. There was no statistically significant correlation between the degree of mossy fiber sprouting (50% mossy cell loss) and ISI for basket cells (correlations coefficient R = −0.31, p = 0.0658). In the control model for hilar perforant path-associated cells the ISI value was 23.2 (0.8) ms and (95% CI, 22.4–24.0), but in the increase in mossy fiber sprouting and 50% mossy cell were 33.7 (8.7) ms and (95% CI, 24.6–42.7), 33.8 (8.5) ms and (95% CI, 24.9–42.8), 33.9 (9.4) ms and (95% CI, 24.0–43.7), 34.4 (9.7) ms and (95% CI, 24.3–44.6). 33.1 (8.1) ms and (95% CI, 24.6–41.7). There were statistically significant differences in hilar perforant path-associated cell ISI versus groups (p = 0.0114). Post hoc tests showed that hilar perforant path-associated cell ISI were significantly lower in the control group, relative to 10% mossy fiber sprouting and 50% mossy cell loss group (p = 0.0353) and 40% mossy fiber sprouting and 50% mossy cell loss group (p = 0.0244), Figure 7D. A correlation was obtained between the degree of mossy fiber sprouting (50% mossy cell loss) and ISI for hilar perforant path-associated cells (correlations coefficient R = 0.41, p = 0.0122).
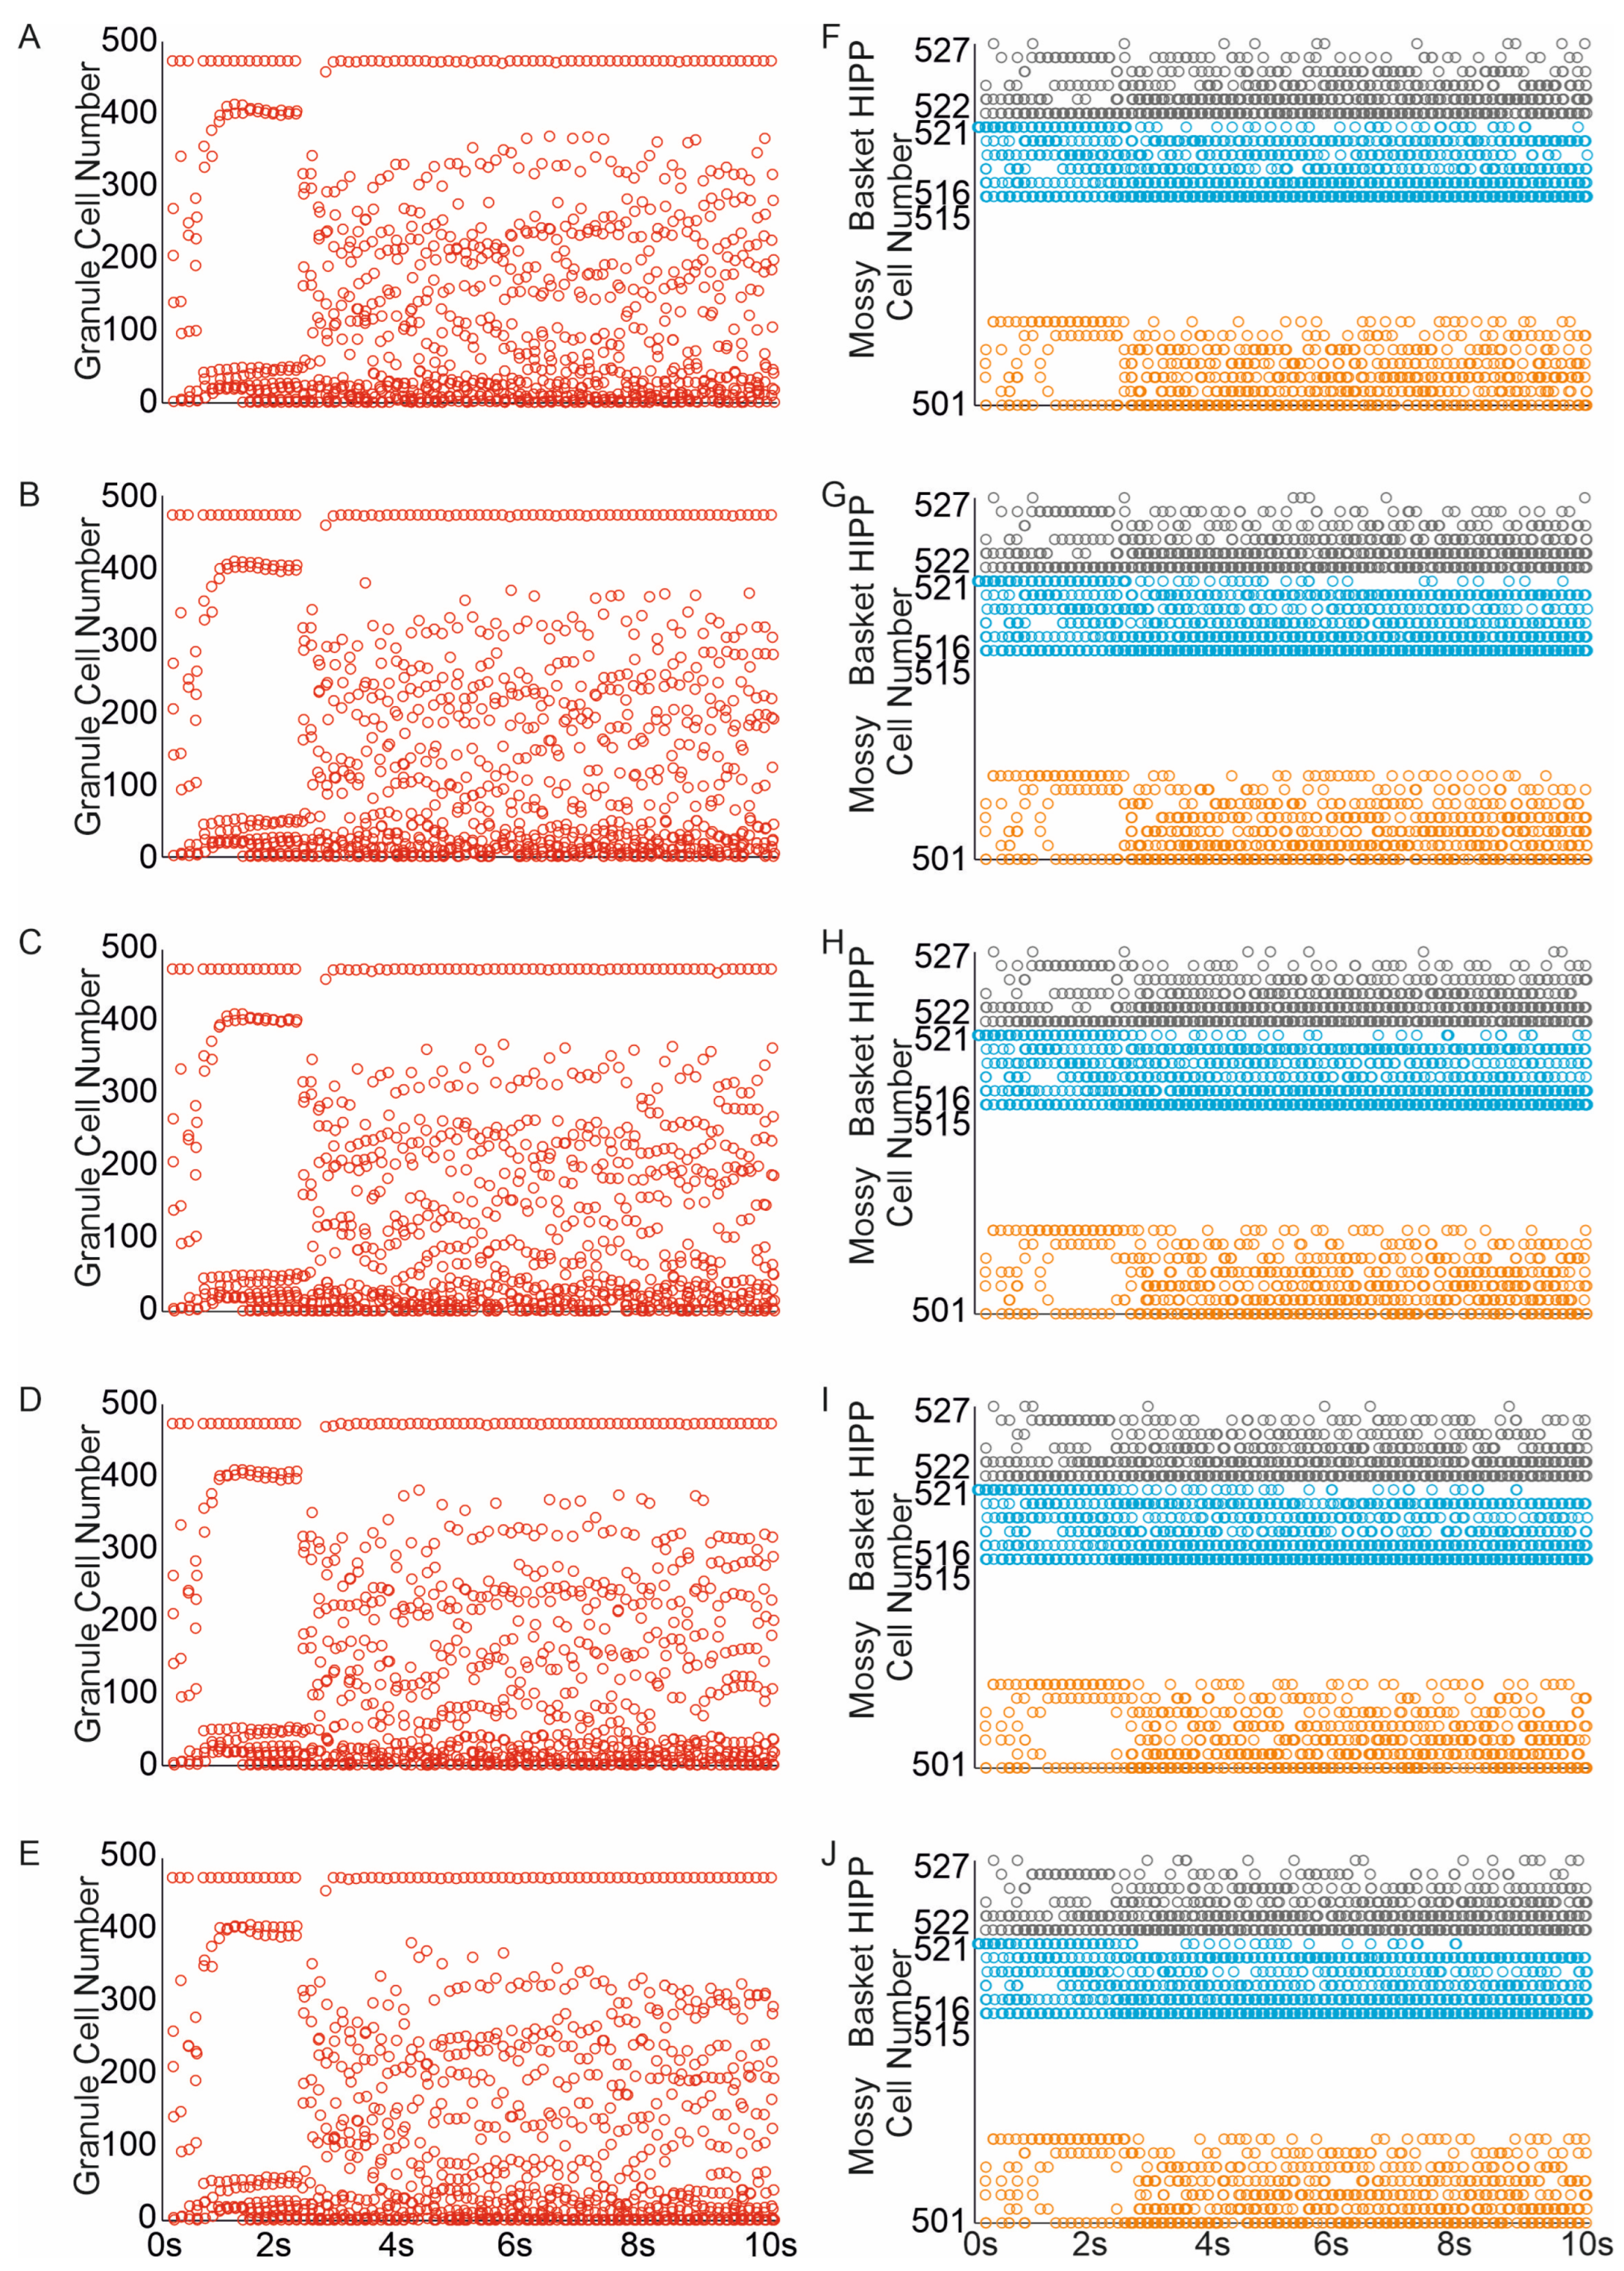
The random removal of eight mossy cells (representing 50% of the mossy cell population, similar to the extent of mossy cell loss observed after moderate head trauma) led to a reduction in both the average firing rate of all cells and the number of granule cells and interneurons engaged in network activity Figure 8A–C,F–J. The corresponding mossy cell spike raster indicated a diminished spread of network activity to mossy cells, likely because the “dead” cells were unable to contribute to the propagation of activity. The complete loss of mossy cells resulted in a further decline in network activity spread, Figure 8D,E.
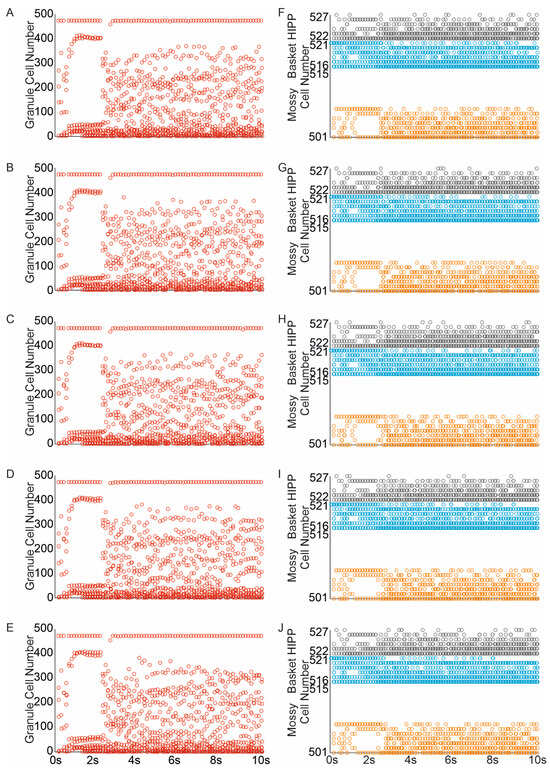
Figure 8.
Impact of mossy cell loss and sprouting on dentate network excitability. (A–E) Spike raster plots illustrating granule cell activity in the networks in response to perforant path input stimulation ((A–E) mossy cell loss and sprouting groups 10–50%). (F–J) Spike raster plots illustrating mossy, basket and hilar perforant path-associated cells activity in the networks in re-sponse to perforant path input stimulation ((F–J) mossy cell loss and sprouting groups 10–50%) (red—granule cell, orange—mossy cell, blue—basket cell, gray—hilar perforant path-associated cell).
4. Discussion
This study focuses on analyzing the role of two distinct histopathological features common to TLE and head injuries—mossy fiber sprouting and the loss of excitatory hilar cells—in modulating the excitability of the dentate gyrus. In an animal model of epilepsy, irregular axon branches and collaterals extending from a primary axon have been detected within the hilus of the dentate gyrus [42,43,44,45]. My simulation results showed that even a low level of mossy fiber sprouting is sufficient to increase the excitability of the dentate gyrus in response to lamellar activation of the perforant path. In contrast, the removal of mossy cells reduces the excitability of granule cells and inhibits the propagation of network hyperexcitability. This suggests that surviving mossy cells enhance the excitability of the dentate gyrus, even in the absence of changes in their intrinsic or synaptic properties [46,47]. Although the role of abnormal mossy fiber projections remains uncertain, one hypothesis suggests that synapses formed by mossy fiber sprouting are functionally active. This is because axon selection relies on excitatory pre- and postsynaptic activity, leading to hyperexcitation of the dentate gyrus and CA3, which may contribute to the onset of epileptogenesis [48,49,50,51,52]. As abnormal mossy fiber sprouting intensifies, excitation levels rise, and according to the compensation theory, the network attempts to counteract this imbalance. When mossy fiber sprouting reaches a point where it boosts granule cell activity enough to surpass the threshold for non-synaptic mechanisms, the network undergoes a shift. This shift marks the transition to an epileptic state. Essentially, once this threshold is crossed, the network becomes more prone to seizure activity.
My study, as a computational-simulation project, maintains a strong alignment between the model and experimental data. On the other hand, previous computational studies have analyzed the role of recurrent excitatory collaterals in epileptic activity within CA3 [53,54]. Meanwhile, other studies using a biophysically realistic computational model of the dentate gyrus have simulated the loss of smaller cells and the sprouting of smaller fibers [23,55]. My simulations show a correlation between the degree of mossy fiber sprouting and the average number and duration of discharges in granule cells of the dentate gyrus and other cells. These results are generally consistent with experimental observations. Studies have indicated a high degree of mossy fiber sprouting in animals with a higher frequency of epileptic seizures [15,56]. Nevertheless, the existence and strength of the relationship between sprouting and the frequency and duration of seizures in animal models remain subjects of debate. Some studies suggest a strong correlation, while others report more variable findings. The complexity of the underlying mechanisms may contribute to these discrepancies. Further research is needed to clarify the role of mossy fiber sprouting in seizure activity [57]. The simulations also indicated that the spatially restricted, lamellar distribution of sprouted mossy fiber contacts, as described in in vivo studies, was a key factor in sustaining seizure-like activity in the network. This specific pattern of connectivity appears to contribute to persistent hyperexcitability. The findings suggest that localized structural changes can significantly impact network dynamics. Understanding these mechanisms may provide insights into the development of epilepsy.
Finally, although the loss of mossy cells may contribute to dentate gyrus hyperexcitability by promoting mossy fiber sprouting, our simulations show that mossy cell loss alone is neither necessary nor sufficient to increase network excitability [58,59]. Instead, the removal of mossy cells led to a decrease in excitability in the modeled networks [60,61]. This finding aligns with experimental data [47]. These results highlight the crucial role of mossy fiber sprouting, even in cases where only relatively mild sprouting occurs, as seen after a moderate experimental head injury. Even a low level of mossy fiber sprouting can significantly impact network excitability. This suggests that structural changes in the dentate gyrus may contribute to altered neuronal activity. Such findings emphasize the importance of considering even subtle histopathological changes in brain injury models.
5. Conclusions
In contrast to the strong impact of mossy fiber sprouting on inducing hyperexcitability, the removal of mossy cells led to a decrease in the granule cell response to perforant path activation, which is consistent with the latest experimental data. These findings highlight the critical role of mossy fiber sprouting, even in cases where only relatively mild sprouting occurs, as seen after a moderate experimental head injury. Even a low level of mossy fiber sprouting can have a significant effect on network excitability. This suggests that structural changes in the dentate gyrus may contribute to altered neuronal activity. Such observations underscore the importance of considering even subtle histopathological changes in brain injury models.
6. Limitations
The primary limitation of in silico research lies in understanding the potential of a mathematical and computational model. The predictions and outcomes of these models are influenced by the knowledge and assumptions incorporated during their creation. As a result, the accuracy of the model depends on the quality of the information used in its development. This highlights the importance of continuously updating and refining the underlying assumptions to improve model reliability.
Funding
This research received no external funding.
Institutional Review Board Statement
Not applicable.
Informed Consent Statement
Not applicable.
Data Availability Statement
The data presented in this study are available on request from the corresponding author.
Conflicts of Interest
The author declares no conflict of interest.
References
- Lowenstein, D.H.; Thomas, M.J.; Smith, D.H.; McIntosh, T.K. Selective vulnerability of dentate hilar neurons following traumatic brain injury: A potential mechanistic link between head trauma and disorders of the hippocampus. J. Neurosci. 1992, 12, 4846–4853. [Google Scholar] [CrossRef] [PubMed] [PubMed Central]
- Toth, Z.; Hollrigel, G.S.; Gorcs, T.; Soltesz, I. Instantaneous perturbation of dentate interneuronal networks by a pressure wave-transient delivered to the neocortex. J. Neurosci. 1997, 17, 8106–8117. [Google Scholar] [CrossRef] [PubMed]
- Santhakumar, V.; Bender, R.; Frotscher, M.; Ross, S.T.; Hollrigel, G.S.; Toth, Z.; Soltesz, I. Granule cell hyperexcitability in the early post-traumatic rat dentate gyrus: The “irritable mossy cell” hypothesis. J. Physiol. 2000, 524, 117–134. [Google Scholar] [CrossRef]
- Frankowski, J.C.; Tierno, A.; Pavani, S.; Cao, Q.; Lyon, D.C.; Hunt, R.F. Brain-wide reconstruction of inhibitory circuits after traumatic brain injury. Nat. Commun. 2022, 13, 3417. [Google Scholar] [CrossRef] [PubMed] [PubMed Central]
- Santhakumar, V.; Ratzliff, A.D.; Jeng, J.; Toth, K.; Soltesz, I. Long-term hyperexcitability in the hippocampus after experimental head trauma. Ann. Neurol. 2001, 50, 708–717. [Google Scholar] [CrossRef]
- Golarai, G.; Greenwood, A.C.; Feeney, D.M.; Connor, J.A. Physiological and structural evidence for hippocampal involvement in persistent seizure susceptibility after traumatic brain injury. J. Neurosci. 2001, 21, 8523–8537. [Google Scholar] [CrossRef]
- Zhang, N.; Houser, C.R. Ultrastructural localization of dynorphin in the dentate gyrus in human temporal lobe epilepsy: A study of reorganized mossy fiber synapses. J. Comp. Neurol. 1999, 405, 472–490. [Google Scholar] [CrossRef]
- McIntosh, W.C.; Das, J.M. Temporal Seizure. In StatPearls [Internet]; StatPearls Publishing: Treasure Island, FL, USA, 2024. Available online: https://www.ncbi.nlm.nih.gov/books/NBK549852/ (accessed on 4 July 2023).
- Zhang, C.; He, Z.; Tan, Z.; Tian, F. Silencing of dentate gyrus inhibits mossy fiber sprouting and prevents epileptogenesis through NDR2 kinase in pentylenetetrazole kindling rat model of TLE. PLoS ONE 2023, 18, e0284359. [Google Scholar] [CrossRef] [PubMed] [PubMed Central]
- Chen, Y.; Wu, X.L.; Hu, H.B.; Yang, S.N.; Zhang, Z.Y.; Fu, G.L.; Zhang, C.T.; Li, Z.M.; Wu, F.; Si, K.W.; et al. Neuronal MeCP2 in the dentate gyrus regulates mossy fiber sprouting of mice with temporal lobe epilepsy. Neurobiol. Dis. 2023, 188, 106346. [Google Scholar] [CrossRef] [PubMed]
- Sack, A.S. Adult-Born Granule Cells Contribute to Dentate Gyrus Circuit Reorganization after Traumatic Brain Injury. J. Neurosci. 2023, 43, 879–881. [Google Scholar] [CrossRef] [PubMed] [PubMed Central]
- Masukawa, L.M.; O’Connor, W.M.; Lynott, J.; Burdette, L.J.; Uruno, K.; McGonigle, P.; O’Connor, M.J. Longitudinal variation in cell density and mossy fiber reorganization in the dentate gyrus from temporal lobe epileptic patients. Brain Res. 1995, 678, 65–75. [Google Scholar] [CrossRef] [PubMed]
- Mathern, G.W.; Pretorius, J.K.; Babb, T.L. Influence of the type of initial precipitating injury and at what age it occurs on course and outcome in patients with temporal lobe seizures. J. Neurosurg. 1995, 82, 220–227. [Google Scholar] [CrossRef] [PubMed]
- Mathern, G.W.; Pretorius, J.K.; Babb, T.L.; Quinn, B. Unilateral hippocampal mossy fiber sprouting and bilateral asymmetric neuron loss with episodic postictal psychosis. J. Neurosurg. 1995, 82, 228–233. [Google Scholar] [CrossRef] [PubMed]
- Wenzel, H.J.; Woolley, C.S.; Robbins, C.A.; Schwartzkroin, P.A. Kainic acid-induced mossy fiber sprouting and synapse formation in the dentate gyrus of rats. Hippocampus 2000, 10, 244–260. [Google Scholar] [CrossRef]
- Henze, D.A.; Urban, N.N.; Barrionuevo, G. The multifarious hippocampal mossy fiber pathway: A review. Neuroscience 2000, 98, 407–427. [Google Scholar] [CrossRef]
- Buckmaster, P.S.; Zhang, G.F.; Yamawaki, R. Axon sprouting in a model of temporal lobe epilepsy creates a predominantly excitatory feedback circuit. J. Neurosci. 2002, 22, 6650–6658. [Google Scholar] [CrossRef]
- Sutula, T.; Lauersdorf, S.; Lynch, M.; Jurgella, C.; Woodard, A. Deficits in radial arm maze performance in kindled rats: Evidence for long-lasting memory dysfunction induced by repeated brief seizures. J. Neurosci. 1995, 15, 8295–8301. [Google Scholar] [CrossRef]
- Świetlik, D.; Białowąs, J.; Kusiak, A.; Cichońska, D. Memory and forgetting processes with the firing neuron model. Folia Morphol. 2018, 77, 221–233. [Google Scholar] [CrossRef]
- Świetlik, D. Simulations of Learning, Memory, and Forgetting Processes with Model of CA1 Region of the Hippocampus. Complexity 2018, 2018, 1297150. [Google Scholar] [CrossRef]
- Świetlik, D.; Białowąs, J.; Kusiak, A.; Cichońska, D. A computational simulation of long-term synaptic potentiation inducing protocol processes with model of CA3 hippocampal microcircuit. Folia Morphol. 2018, 77, 210–220. [Google Scholar] [CrossRef]
- Świetlik, D.; Białowąs, J.; Moryś, J.; Kusiak, A. Computer Model of Synapse Loss During an Alzheimer’s Disease-like Pathology in Hippocampal Subregions DG, CA3 and CA1—The Way to Chaos and Information Transfer. Entropy 2019, 21, 408. [Google Scholar] [CrossRef] [PubMed]
- Santhakumar, V.; Aradi, I.; Soltesz, I. Role of mossy fiber sprouting and mossy cell loss in hyperexcitability: A network model of the dentate gyrus incorporating cell types and axonal topography. J. Neurophysiol. 2005, 93, 437–453. [Google Scholar] [CrossRef] [PubMed]
- Morgan, R.J.; Soltesz, I. Nonrandom connectivity of the epileptic dentate gyrus predicts a major role for neuronal hubs in seizures. Proc. Natl. Acad. Sci. USA 2008, 105, 6179–6184. [Google Scholar] [CrossRef] [PubMed] [PubMed Central]
- de Almeida, A.C.; Rodrigues, A.M.; Scorza, F.A.; Cavalheiro, E.A.; Teixeira, H.Z.; Duarte, M.A.; Silveira, G.A.; Arruda, E.Z. Mechanistic hypotheses for nonsynaptic epileptiform activity induction and its transition from the interictal to ictal state—Computational simulation. Epilepsia 2008, 49, 1908–1924. [Google Scholar] [CrossRef] [PubMed]
- Dyhrfjeld-Johnsen, J.; Santhakumar, V.; Morgan, R.J.; Huerta, R.; Tsimring, L.; Soltesz, I. Topological determinants of epileptogenesis in large-scale structural and functional models of the dentate gyrus derived from experimental data. J. Neurophysiol. 2007, 97, 1566–1587. [Google Scholar] [CrossRef] [PubMed]
- Zhang, L.; Fan, D.; Wang, Q. Transition Dynamics of a Dentate Gyrus-CA3 Neuronal Network during Temporal Lobe Epilepsy. Front. Comput. Neurosci. 2017, 11, 61. [Google Scholar] [CrossRef] [PubMed] [PubMed Central]
- Yu, Y.; Han, F.; Wang, Q. A Hippocampal-Entorhinal Cortex Neuronal Network for Dynamical Mechanisms of Epileptic Seizure. IEEE Trans. Neural Syst. Rehabil. Eng. 2023, 31, 1986–1996. [Google Scholar] [CrossRef] [PubMed]
- Alqahtani, S. In silico ADME-Tox modeling: Progress and prospects. Expert. Opin. Drug Metab. Toxicol. 2017, 13, 1147–1158. [Google Scholar] [CrossRef]
- Kumar, S.; Chowdhury, S.; Kumar, S. In silico repurposing of antipsychotic drugs for Alzheimer’s disease. BMC Neurosci. 2017, 18, 76. [Google Scholar] [CrossRef]
- Świetlik, D.; Białowąs, J.; Kusiak, A.; Krasny, M. Virtual Therapy with the NMDA Antagonist Memantine in Hippocampal Models of Moderate to Severe Alzheimer’s Disease, in Silico Trials. Pharmaceuticals 2022, 15, 546. [Google Scholar] [CrossRef]
- Joshi, H.; Jha, B.K. Generalized Diffusion Characteristics of Calcium Model with Concentration and Memory of Cells: A Spatiotemporal Approach. Iran. J. Sci. Technol. Trans. Sci. 2022, 46, 309–322. [Google Scholar] [CrossRef]
- Upadhyay, D.; Joshi, H. Mathematical modeling of local calcium signaling in neurons using artificial neural networks. Discret. Contin. Dyn. Syst.—S 2025, 18, 1392–1415. [Google Scholar] [CrossRef]
- Patton, P.E.; McNaughton, B. Connection matrix of the hippocampal formation: I. The dentate gyrus. Hippocampus 1995, 5, 245–286. [Google Scholar] [CrossRef] [PubMed]
- Aradi, I.; Holmes, W.R. Role of multiple calcium and calcium-dependent conductances in regulation of hippocampal dentate granule cell excitability. J. Comput. Neurosci. 1999, 6, 215–235. [Google Scholar] [CrossRef] [PubMed]
- Bartos, M.; Vida, I.; Frotscher, M.; Geiger, J.R.; Jonas, P. Rapid signaling at inhibitory synapses in a dentate gyrus interneuron network. J. Neurosci. 2001, 21, 2687–2698. [Google Scholar] [CrossRef] [PubMed] [PubMed Central]
- Buckmaster, P.S.; Strowbridge, B.W.; Kunkel, D.D.; Schmiege, D.L.; Schwartzkroin, P.A. Mossy cell axonal projections to the dentate gyrus molecular layer in the rat hippocampal slice. Hippocampus 1992, 2, 349–362. [Google Scholar] [CrossRef] [PubMed]
- Freund, T.F.; Buzsáki, G. Interneurons of the hippocampus. Hippocampus 1996, 6, 347–470. [Google Scholar] [CrossRef] [PubMed]
- Geiger, J.R.; Lübke, J.; Roth, A.; Frotscher, M.; Jonas, P. Submillisecond AMPA receptor-mediated signaling at a principal neuron-interneuron synapse. Neuron 1997, 18, 1009–1023. [Google Scholar] [CrossRef] [PubMed]
- Saraga, F.; Wu, C.P.; Zhang, L.; Skinner, F.K. Active dendrites and spike propagation in multi-compartment models of oriens-lacunosum/moleculare hippocampal interneurons. J. Physiol. 2003, 552 Pt 3, 673–689. [Google Scholar] [CrossRef] [PubMed] [PubMed Central]
- Lübke, J.; Frotscher, M.; Spruston, N. Specialized electrophysiological properties of anatomically identified neurons in the hilar region of the rat fascia dentata. J. Neurophysiol. 1998, 79, 1518–1534. [Google Scholar] [CrossRef] [PubMed]
- Sutula, T.; Zhang, P.; Lynch, M.; Sayin, U.; Golarai, G.; Rod, R. Synaptic and axonal remodeling of mossy fibers in the hilus and supragranular region of the dentate gyrus in kainate-treated rats. J. Comp. Neurol. 1998, 390, 578–594. [Google Scholar] [CrossRef] [PubMed]
- Cronin, J.; Dudek, F.E. Chronic seizures and collateral sprouting of dentate mossy fibers after kainic acid treatment in rats. Brain Res. 1988, 474, 181–184. [Google Scholar] [CrossRef] [PubMed]
- Mello, L.E.; Cavalheiro, E.A.; Tan, A.M.; Kupfer, W.R.; Pretorius, J.K.; Babb, T.L.; Finch, D.M. Circuit mechanisms of seizures in the pilocarpine model of chronic epilepsy: Cell loss and mossy fiber sprouting. Epilepsia 1993, 34, 985–995. [Google Scholar] [CrossRef] [PubMed]
- Okazaki, M.M.; Evenson, D.A.; Nadler, J.V. Hippocampal mossy fiber sprouting and synapse formation after status epilepticus in rats: Visualization after retrograde transport of biocytin. J. Comp. Neurol. 1995, 352, 515–534. [Google Scholar] [CrossRef] [PubMed]
- Ratzliff, A.d.H.; Santhakumar, V.; Howard, A.; Soltesz, I. Mossy cells in epilepsy: Rigor mortis or vigor mortis? Trends Neurosci. 2002, 25, 140–144. [Google Scholar] [CrossRef] [PubMed]
- Ratzliff, A.d.H.; Howard, A.L.; Santhakumar, V.; Osapay, I.; Soltesz, I. Rapid deletion of mossy cells does not result in a hyperexcitable dentate gyrus: Implications for epileptogenesis. J. Neurosci. 2004, 24, 2259–2269. [Google Scholar] [CrossRef] [PubMed] [PubMed Central]
- Sierra, A.; Gröhn, O.; Pitkänen, A. Imaging microstructural damage and plasticity in the hippocampus during epileptogenesis. Neuroscience 2015, 309, 162–172. [Google Scholar] [CrossRef] [PubMed]
- Zhong, Q.; Ren, B.X.; Tang, F.R. Neurogenesis in the Hippocampus of Patients with Temporal Lobe Epilepsy. Curr. Neurol. Neurosci. Rep. 2016, 16, 20. [Google Scholar] [CrossRef] [PubMed]
- Koyama, R.; Ikegaya, Y. Mossy fiber sprouting as a potential therapeutic target for epilepsy. Curr. Neurovasc. Res. 2004, 1, 3–10, Erratum in Curr. Neurovasc. Res. 2004, 1, 191. [Google Scholar] [CrossRef] [PubMed]
- Koyama, R. Dentate Circuitry as a Model to Study Epileptogenesis. Biol. Pharm. Bull. 2016, 39, 891–896. [Google Scholar] [CrossRef] [PubMed]
- Del Brutto, O.H.; Engel, J., Jr.; Eliashiv, D.S.; García, H.H. Update on Cysticercosis Epileptogenesis: The Role of the Hippocampus. Curr. Neurol. Neurosci. Rep. 2016, 16, 1. [Google Scholar] [CrossRef] [PubMed] [PubMed Central]
- Traub, R.D.; Knowles, W.D.; Miles, R.; Wong, R.K. Models of the cellular mechanism underlying propagation of epileptiform activity in the CA2-CA3 region of the hippocampal slice. Neuroscience 1987, 21, 457–470. [Google Scholar] [CrossRef] [PubMed]
- Traub, R.D.; Jefferys, J.G.; Whittington, M.A. Enhanced NMDA conductance can account for epileptiform activity induced by low Mg2+ in the rat hippocampal slice. J. Physiol. 1994, 478 Pt 3, 379–393. [Google Scholar] [CrossRef] [PubMed] [PubMed Central]
- França, K.L.; de Almeida, A.C.; Infantosi, A.F.; Duarte, M.A.; da Silveira, G.A.; Scorza, F.A.; Arida, R.M.; Cavalheiro, E.A.; Rodrigues, A.M. Enhanced synaptic connectivity in the dentate gyrus during epileptiform activity: Network simulation. Comput. Intell. Neurosci. 2013, 2013, 949816. [Google Scholar] [CrossRef] [PubMed] [PubMed Central]
- Mathern, G.W.; Bertram, E.H., 3rd; Babb, T.L.; Pretorius, J.K.; Kuhlman, P.A.; Spradlin, S.; Mendoza, D. In contrast to kindled seizures, the frequency of spontaneous epilepsy in the limbic status model correlates with greater aberrant fascia dentata excitatory and inhibitory axon sprouting, and increased staining for N-methyl-D-aspartate, AMPA and GABA(A) receptors. Neuroscience 1997, 77, 1003–1019. [Google Scholar] [CrossRef] [PubMed]
- Nadler, J.V. The recurrent mossy fiber pathway of the epileptic brain. Neurochem. Res. 2003, 28, 1649–1658. [Google Scholar] [CrossRef] [PubMed]
- Houser, C.R. Neuronal loss and synaptic reorganization in temporal lobe epilepsy. Adv. Neurol. 1999, 79, 743–761. [Google Scholar] [PubMed]
- Masukawa, L.M.; Burdette, L.J.; McGonigle, P.; Wang, H.; O’Connor, W.; Sperling, M.R.; O’Connor, M.J.; Uruno, K. Physiological and anatomical correlates of the human dentate gyrus: Consequences or causes of epilepsy. Adv. Neurol. 1999, 79, 781–794. [Google Scholar] [PubMed]
- Bernstein, H.L.; Lu, Y.L.; Botterill, J.J.; Duffy, Á.M.; LaFrancois, J.J.; Scharfman, H.E. Field EPSPs of Dentate Gyrus Granule Cells Studied by Selective Optogenetic Activation of Hilar Mossy Cells in Hippocampal Slices. Hippocampus 2025, 35, e23652. [Google Scholar] [CrossRef] [PubMed] [PubMed Central]
- Butler, C.R.; Westbrook, G.L.; Schnell, E. Adaptive Mossy Cell Circuit Plasticity after Status Epilepticus. J. Neurosci. 2022, 42, 3025–3036. [Google Scholar] [CrossRef] [PubMed] [PubMed Central]


Disclaimer/Publisher’s Note: The statements, opinions and data contained in all publications are solely those of the individual author(s) and contributor(s) and not of MDPI and/or the editor(s). MDPI and/or the editor(s) disclaim responsibility for any injury to people or property resulting from any ideas, methods, instructions or products referred to in the content. |
© 2025 by the author. Licensee MDPI, Basel, Switzerland. This article is an open access article distributed under the terms and conditions of the Creative Commons Attribution (CC BY) license (https://creativecommons.org/licenses/by/4.0/).