Abstract
Background and Aims: In this research, we sought to enhance our comprehension of liver cancer’s genetic architecture by employing Mendelian randomization (MR) techniques to establish causative relationships between particular genetic variations and liver cancer susceptibility. Methods: We integrated data from the public databases with MR analysis to identify differentially expressed genes (DEGs) associated with Hepatocellular Carcinoma (HCC). We conducted functional enrichment analyses to determine the biological processes and signaling cascades associated with the identified DEGs. We also used the CIBERSORT deconvolution method to evaluate immune cell composition in HCC tissues, followed by correlation studies examining relationships between our key genes of interest and various immune cell populations. Additionally, we validated our findings using a rat model of HCC and clinical HCC samples. Results: We obtained two key genes, EHD4 and PPARGC1A, which co-regulated M0 macrophages, suggesting their role in macrophage polarization and tumor progression. In addition, PPARGC1A is associated with resting and activated mast cells, suggesting its involvement in regulating the tumor microenvironment. Detection of rat and clinical samples further confirmed the upregulation of these genes in HCC, supporting their potential as therapeutic targets. Conclusions: Our findings emphasize the significant involvement of EHD4 and PPARGC1A in HCC, specifically regarding their influence on tumor-associated macrophage polarization and broader immune microenvironment modulation. These findings offer new insights into the molecular mechanisms driving HCC and suggest that targeting these genes may provide novel strategies for personalized treatment.
1. Introduction
Globally, primary liver malignancies now rank as the third leading cause of cancer-related mortality, claiming roughly 0.83 million lives each year [1]. Hepatocellular carcinoma (HCC) dominates the histological spectrum, representing about 85–90% of primary hepatic malignancies [2]. Even with better screening and therapy, the five-year survival seldom exceeds 20%, dropping to roughly 10% where healthcare access is scarce [3]. The risk profile is shifting: besides viral hepatitis, metabolic dysfunction-associated steatotic liver disease (MASLD) and alcohol-induced injury are now prominent drivers of HCC [4]. Large-scale genomics highlight recurrent alterations in the TERT promoter, TP53, CTNNB1(β-catenin), and AXIN1, which, together with environmental insults, propel hepatocarcinogenesis [5].
Curative resection or ablation benefits early HCC, yet high rates of relapse and metastasis persist owing to intratumoral heterogeneity [6]. In advanced disease, the multikinase inhibitor sorafenib prolongs survival but remains financially inaccessible to many patients [7]. Prognostic biomarkers are pivotal for tailoring therapy and optimizing clinical decision-making.
Recent epidemiological and genomic studies have consistently demonstrated that liver cancer exhibits significant genetic susceptibility. A large cross-sectional study in Sweden found that individuals with a first-degree relative who had developed HCC had a standardized incidence ratio (SIR) of 2.60 for liver cancer [8]. In the Nordic Twin Study, a familial clustering of liver cancer was observed, with an estimated familial risk of liver cancer in monozygotic twins of 2.1%, which is higher than in the general population [9]. In 2024, a large-scale genome-wide association study (GWAS) conducted across multiple centers in North America identified key genetic loci significantly associated with non-viral HCC, including PNPLA3rs738409 C>G (I148M), TM6SF2rs58542926 C>T (E167K), and MAU2 rs58489806 C>T [10]. In the same year, a transcriptomics-associated study based on a joint Chinese–Japanese cohort identified 22 candidate susceptibility genes at 16 new loci, indicating the presence of a unique genetic landscape in East Asian populations [11].
Currently, most studies are limited to statistical associations and lack causal inference and functional validation. This study combines MR analysis, bioinformatics analysis, animal experiments, and clinical sample detection to explore the molecular mechanisms of HCC, identify potential intervention targets, and provide a reference for the precision treatment of HCC.
2. Materials and Methods
2.1. Raw Data Acquisition
We acquired transcriptomic profiles and corresponding clinical data for GSE14520 and GSE84402 cohorts through the NCBI Gene Expression Omnibus repository. We collected expression quantitative trait loci (eQTL) information for 19,943 genes to serve as exposure parameters from the MRC IEU OpenGWAS database. We extracted liver cancer data ieu-b-4953 from the ieu database and used it as an outcome indicator for our analyses. We employed UCLCAN (https://ualcan.path.uab.edu) (accessed on 10 December 2024)to obtain comprehensive data on EHD4 mRNA expression in tumor samples, corresponding paracancerous tissues, and normal controls. The protein expression data of EHD4 were obtained from the HPA (http://www.proteinatlas.org) (accessed on 10 December 2024) and CPTAC (https://proteomics.cancer.gov) (accessed on 10 December 2024) databases.
2.2. Differential Analysis
The GSE14520 and GSE84402 cohorts were combined, yielding 234 non-tumor and 239 HCC samples. Differential expression was assessed with the limma package (version 3.58.1) in R 4.4.2, adopting an adjusted-P (FDR) < 0.05 and |log₂ fold-change| > 0.585 as cut-offs for significance. Results were depicted as a volcano plot (ggplot2) and a clustered heatmap to highlight the most prominent expression shifts.
2.3. Gene Set Enrichment Analysis
We implemented Gene Set Enrichment Analysis to identify functional categories and biological pathways associated with our co-expressed gene clusters, visualizing enrichment patterns at either end of the ranked gene list to indicate upregulated or downregulated processes. This analytical approach allowed us to investigate the activation status of various biological mechanisms within our experimental gene expression datasets. In GSEA analysis, a p-value less than 0.05 is considered statistically significant.
2.4. Inference of Infiltrating Immune Cells
For immune cell composition analysis, we employed the CIBERSORT computational framework, a validated deconvolution method that calculates immune cell proportions from bulk transcriptome profiles. After performing appropriate normalization of the HCC expression data, we determined the relative frequencies of 22 immune cell subpopulations across all samples in our study cohort. Following the determination of the immune cell profiles, we conducted correlation analyses to explore the relationships between these immune cell populations and the key genes previously identified in our study.
2.5. Instrumental Variable Selection
To identify potential causal relationships, we applied stringent criteria for selecting appropriate single-nucleotide polymorphisms (SNPs) as instrumental variables. Initially, we employed a genome-wide significance threshold (p < 5 × 10⁻⁸) to screen SNPs associated with metabolite biomarkers. To eliminate the influence of linkage disequilibrium (LD), we implemented LD clumping, excluding variants with an R² value greater than 0.001 or located within a ±10,000 kb window based on the European ancestry reference panel from the 1000 Genomes Project. Additionally, we calculated mean F-statistics to evaluate the robustness of our instrumental variables, adhering strictly to established methodological standards.
2.6. Instrumental Variable Analysis
For causal inference, we employed Inverse Variance Weighting (IVW), Weighted Median (WM), and MR-Egger regression methods. p-values were Bonferroni-adjusted for multiple comparisons, with associations deemed potentially causal at p < 0.05 and highly significant at p < 6.8 × 10⁻⁵. MR-Egger regression and MR-PRESSO were used to detect pleiotropy, while Cochran’s Q test evaluated heterogeneity. We implemented leave-one-out analysis to assess individual SNP influence on results. Effect sizes were reported as odds ratios (ORs) with 95% confidence intervals following standard epidemiological practices [12]. All analyses were conducted using R version 4.4.2, RStudio, and the “TwoSampleMR version 0.6.15 ” package.
2.7. Animals
Healthy male Wistar rats, specific pathogen-free (SPF) grade and weighing 170–200 g, were provided by Beijing Vital River Laboratory Technology Co., Ltd. (Beijing, China). (License No: SCXK (Jing) 2016-0006). This study was approved by the Ethics Committee of Experimental Animals of Dongzhimen Hospital, Beijing University of Chinese Medicine (Ethics Approval No. 21-10-01). The rats were conventionally housed in the barrier environment animal room of the Key Laboratory of Traditional Chinese Medicine Internal Science, First Clinical Medical College, Beijing University of Chinese Medicine (Batch No.: SYXK (Jing) 2015-0001), under controlled conditions of constant temperature (24 ± 1 °C), constant humidity (60 ± 10%), and a 12 h light–dark cycle, with free access to water and food. After a one-week acclimatization period, the rats were randomly assigned to groups, and the experimental procedures were initiated.
2.8. Design of Rat HCC Experiment
We selected the diethylnitrosamine (DEN)-induced HCC model because it replicates the progression from chronic inflammation to fibrosis, cirrhosis, and eventual cancer formation, similar to the clinical course seen in most HCC patients [13,14]. The HCC rat model was established by administering DEN (50 mg/kg/week, Psaitong, N60001, Beijing, China) intraperitoneally for sixteen consecutive weeks. The experimental animals were taken to observe the liver condition after the 16th week. Rats were fasted for 8 h before anesthesia, weighed, and anesthetized by intraperitoneal injection of 0.3% sodium pentobarbital solution at a dose of 0.2 mL/100 g. Abdominal aortic blood was collected, and the blood from each rat was centrifuged at 3000 rpm for 10 min. The serum was aspirated into cryovials, temporarily placed in a 4 °C refrigerator, and then transferred to a −80 °C freezer for preservation. After blood collection, the abdominal aorta was cut to drain the blood, and the liver was quickly removed. The tissue was separated in pre-cooled phosphate-buffered saline (PBS), wiped clean with absorbent paper, and photographed. The largest lobe of the liver was excised, and a tissue block (approximately 1 cm × 1 cm × 0.3 cm was cut from the liver approximately 1 cm away from the edge to retain the liver tissue and pathological specimens. The liver tissue for testing was placed in a cryovial, preserved in liquid nitrogen, and then transferred to a −80 °C freezer. Pathological tissues were placed in embedding boxes and fixed in a 4% paraformaldehyde solution for more than 48 h before processing. Finally, the rats were checked for their condition and euthanized by cervical dislocation.
2.9. Determination of Serological Indicators
The serological indicators alanine transaminase (ALT, OSR6107) and aspartate aminotransferase (AST, OSR6209) were detected using a Beckman Coulter AU Biochemical Analysis System (Beckman Coulter, Brea, CA, USA), and the sample concentration was automatically calculated.
2.10. Quantitative Real-Time PCR (qRT-PCR)
Following the manufacturer’s protocol, total hepatic RNA was isolated with the RaPure kit (Magen, R4011, Shanghai, China). One microgram of RNA was reverse-transcribed using the ABScript III mix (Abclonal, RK2029, Beijing, China) kit. qRT-PCR was carried out on a QuantStudio 6 Pro Real-Time PCR System (Thermo Fisher Scientific, Waltham, MA, USA) with SYBR Fast master mix (Abclonal, RK21203). The primer sequences used for qRT-PCR are listed in Table 1. Cycling parameters: 95 °C × 30 s; 40 cycles of 95 °C × 5 s and 60 °C × 30 s. Specificity was verified by melt-curve analysis. Relative expression was calculated by 2−ΔΔCt using GAPDH as reference.

Table 1.
The primers used in this study.
2.11. Liver Transcriptome Sequencing
Total RNA was isolated from Wistar rat liver using TRIzol® reagent, with quality evaluated by 5300 Bioanalyzer (Agilent, Santa Clara, CA, USA) and quantified via ND-2000 (NanoDrop, Wilmington, DE, USA). Shanghai Majorbio (Shanghai, China) conducted RNA processing and sequencing following Illumina protocols. Four rat liver samples per group underwent differential expression analysis. Transcript levels were calculated using the transcripts per million (TPM) method with RSEM software1.3.3 for quantification. DEGs were identified through both DESeq2 and DEGseq platforms, applying thresholds of |log2FC| ≥ 1 and either FDR ≤ 0.05 (DESeq2) or FDR ≤ 0.001 (DEGseq).
2.12. Total Protein Extraction
Frozen liver (≈50 mg) was pulverized under liquid nitrogen and lysed in 8 M urea/1% SDS/protease inhibitor cocktail (1 mL). Homogenates were sonicated on ice (three 5 s bursts, 20 kHz) and cleared by centrifugation (13,000× g, 15 min, 4 °C). Protein concentration was determined with a bicinchoninic acid assay (ThermoFisher, 23225, Waltham, MA, USA).
2.13. Protein Expression Detection
Protein expression was quantified using the Simple Western capillary immunoassay platform (ProteinSimple, BioTechne, Minneapolis, MN, USA) with the following antibodies: GAPDH (CellorLab, LF205S, Beijing, China) at 1:50 dilution, PPARGC1A (Proteintech, 66369-1-Ig, Wuhan, China) at 1:200 dilution, and EHD4 (Proteintech, 11382-2-AP, Wuhan, China) at 1:100 dilution. Other reagents were sourced from the ProteinSimple accessory kit (12–230 kDa Separation Module, 8 × 25 capillary cartridges, SM-W004). All analyses were performed using Compass software (v6.1.0). The grayscale values were analyzed using the ImageJ software (version 1.53t).
2.14. Clinical Samples
Three hepatocellular carcinoma (HCC) paraffin section samples were collected from the Xiamen Traditional Chinese Medicine Hospital. All samples were histopathologically confirmed with HCC criteria. The study protocol was approved by the Ethics Committee of Xiamen Traditional Chinese Medicine Hospital.
2.15. Histology Staining Analysis
The tissues were fixed overnight in 4% formalin (Servicebio, G1101, Beijing, China) and embedded in paraffin. Tissue sections were stained with hematoxylin and eosin (H&E) staining using a kit from Servicebio (G1003, Beijing, China) to observe the liver structure. Tissue sections were stained with Masson staining using a kit from Servicebio (G1006, Beijing, China) to observe the collagen production in the liver. Tissue sections were stained with periodic acid–Schiff (PAS) staining using a kit from Servicebio (G1008, Beijing, China) to observe the accumulation of glycogen in the liver. The quantification of the positively stained area was calculated by ImageJ software (version 1.53t).
2.16. Immunohistochemistry (IHC) Analysis
For IHC, the tissue sections were deparaffinized and rehydrated before antigen retrieval, removal of endogenous peroxidase, and blocking with normal goat serum. To detect proliferating cells, the Ki67 rabbit polyclonal antibody (GB111499, Servicebio, Beijing, China) was added dropwise with incubated in a wet chamber overnight at 4 °C. To detect EHD4, the paraffin-embedded sections were incubated overnight at 4 °C with the primary anti-EHD4 (rabbit pAb, Proteintech, 13151-1-AP, Chicago, IL, USA). The next day, the reaction solution and HRP-labeled anti-rabbit secondary antibody (GB23303, Servicebio, Beijing, China) were added dropwise and incubated at 37 °C for 30 min. Diaminobenzidine (G1212, Servicebio, Beijing, China) was applied to provide a chromogen, referring in a reddish-brown color. Positive expression was defined as brown-yellow granules in the cytoplasm.
2.17. Immunofluorescent (IF) Staining
For IF, the tissue sections were deparaffinized and rehydrated before antigen retrieval, removal of endogenous peroxidase, and blocking with normal goat serum. To detect ARG1, the paraffin-embedded sections were incubated overnight at 4 °C with the primary anti-ARG1 (rabbit pAb, Servicebio, GB11285, Beijing, China). The next day, the reaction solution and Alexa Fluor 488-labeled anti-rabbit secondary antibody (GB25303, Servicebio, Beijing, China) were added dropwise and incubated at 37 °C for 30 min. DAPI dye solution was added (G1012, Servicebio, Beijing, China) and incubated at room temperature for 10 min. The sections were placed under a scanner for image collection. The nucleus stained by DAPI is blue under ultraviolet excitation, and the positive expression is green light labeled by the corresponding fluorescein.
3. Results
3.1. Differentially Expressed Gene (DEG) Analysis
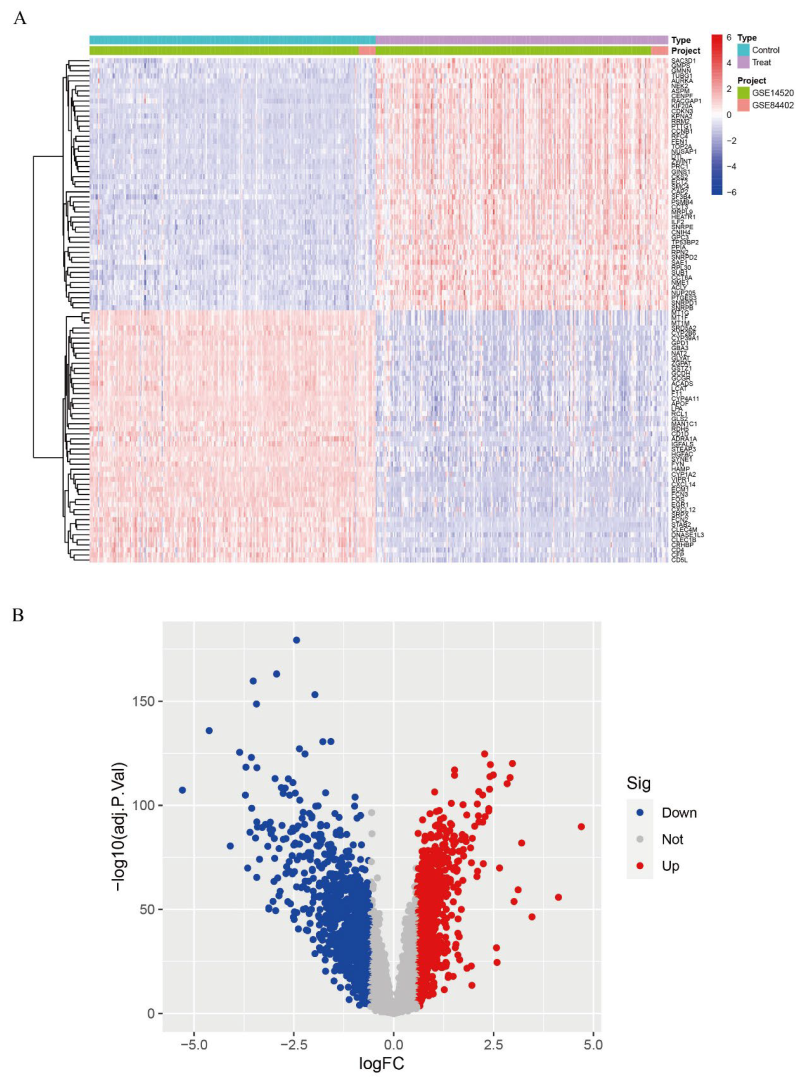
We calibrated and integrated the expression values of each gene across their respective datasets using R version 4.4.2 and eliminated batch effects through principal component analysis (PCA). Initial analysis revealed batch effects in the two HCC gene datasets (Figure 1A); however, after correction and PCA, all the samples achieved acceptable homogeneity (Figure 1B). Comparative profiling of tumor versus non-tumor liver tissue in GSE14520 and GSE84402 datasets revealed 1831 differentially DEGs—928 up-regulated and 903 down-regulated. Figure 2A displays the 50 most strongly induced and repressed transcripts in a heatmap, whereas Figure 2B depicts their overall distribution in a volcano plot.
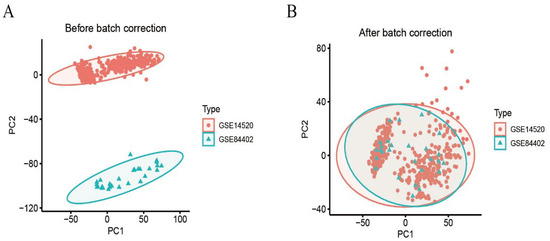
Figure 1.
Dataset calibration. (A): PCA analysis before batch correction; (B): PCA analysis after batch correction.
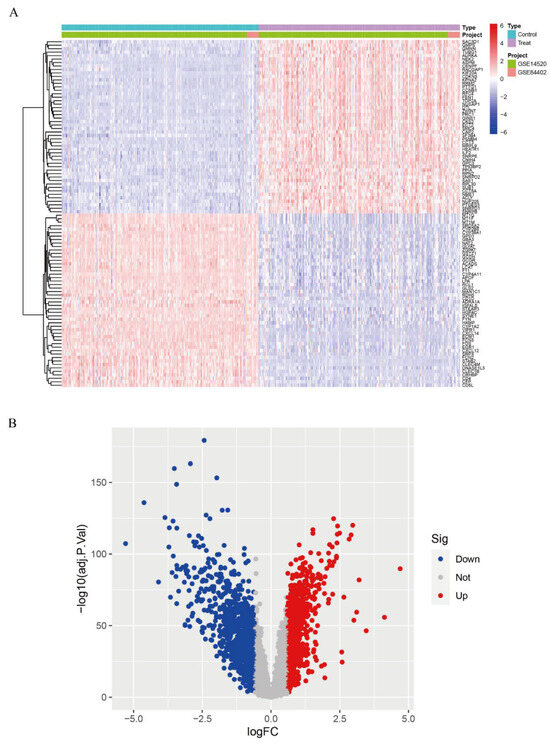
Figure 2.
Differential gene expression analysis. (A): Expression heatmap of DEGs; (B): Volcano plot of DEGs.
3.2. The Hub Genes Analysis
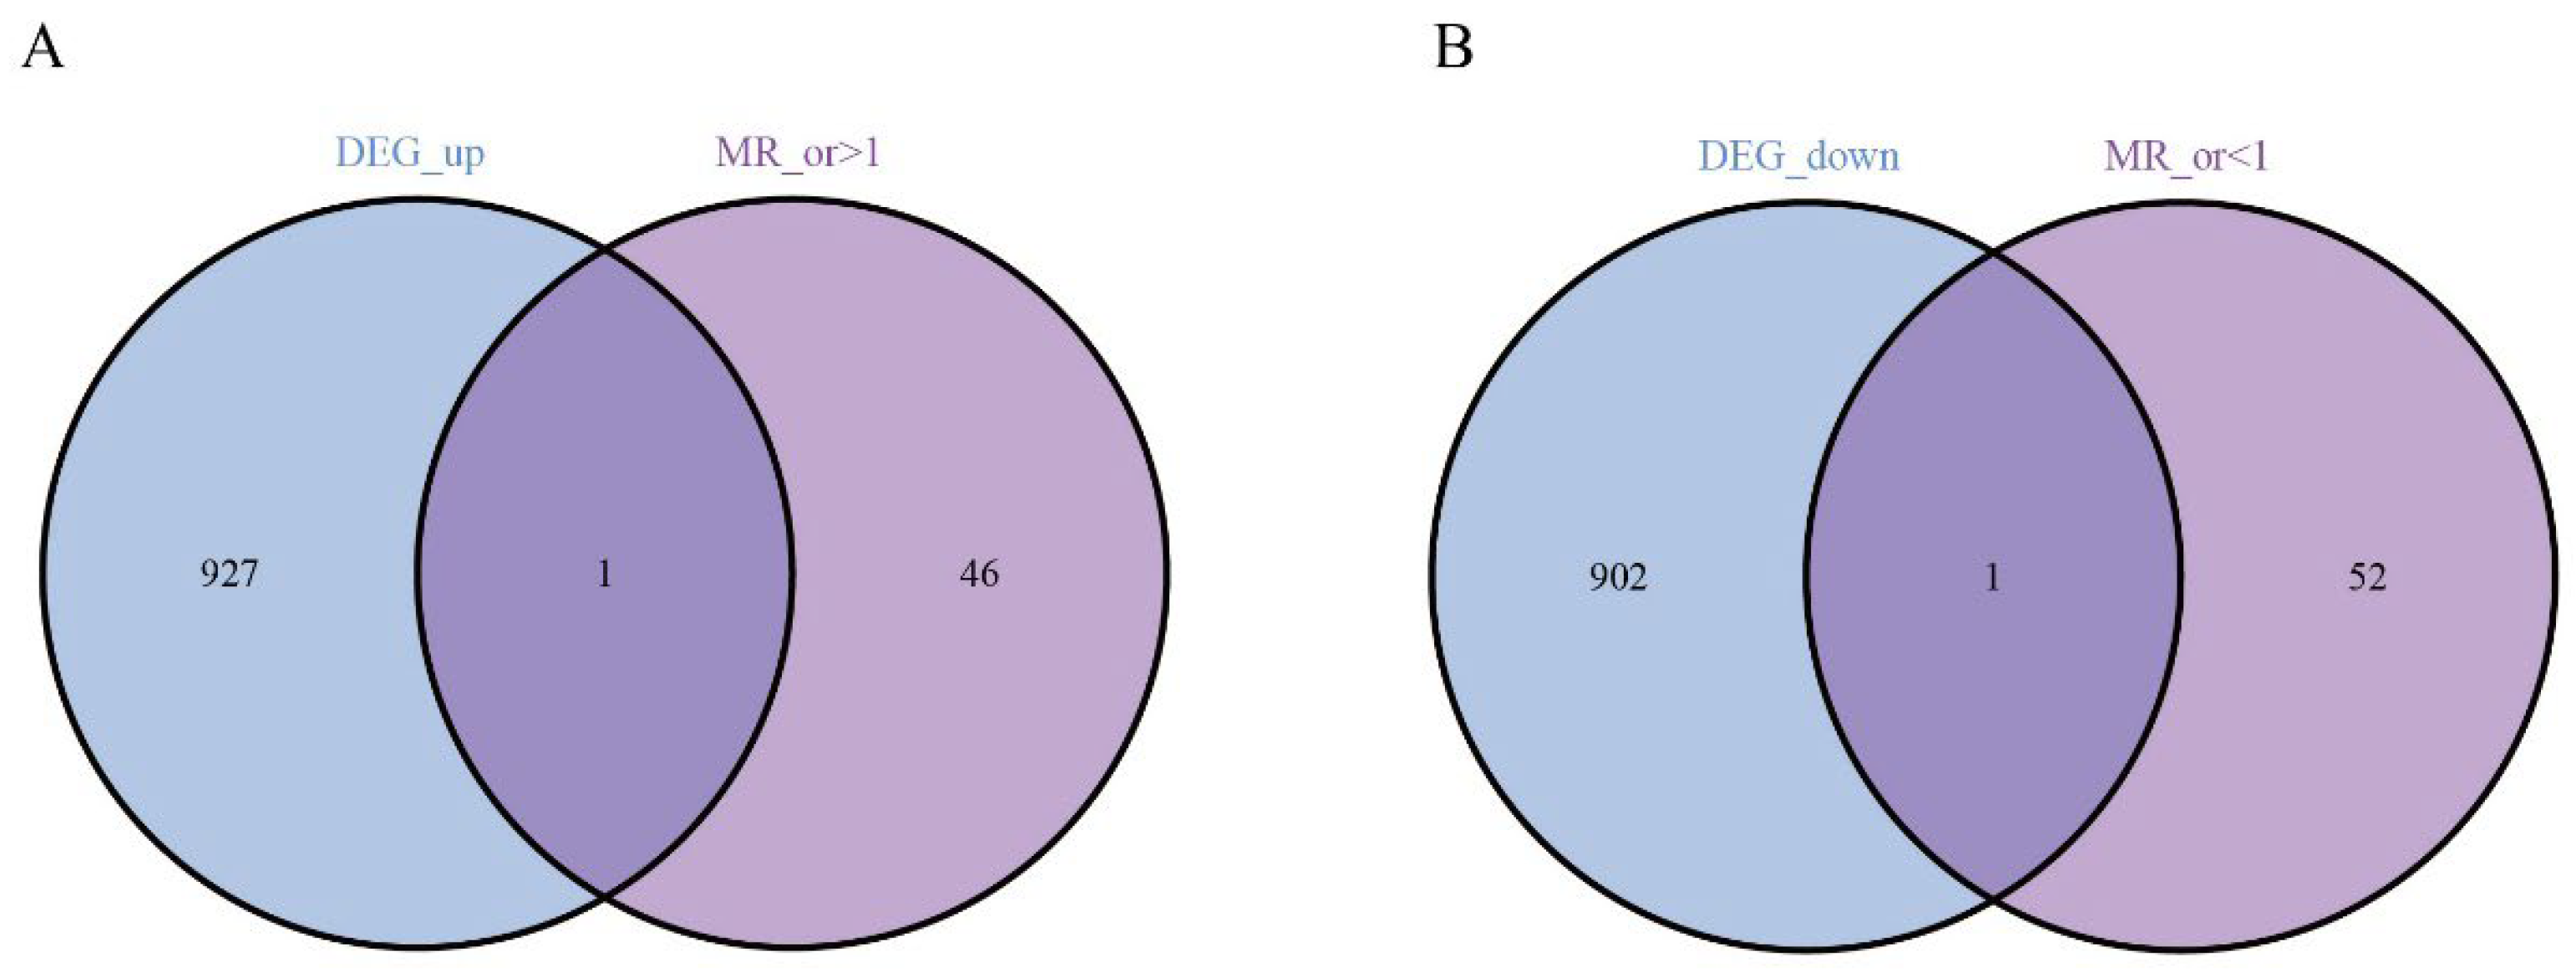
Next, we performed Mendelian randomization (MR) analysis and obtained the genes with or >1 and or <1. Intersecting these DEGs with the genes highlighted by our screen pinpointed two central candidates—EHD4 and PPARGC1A (Figure 3).
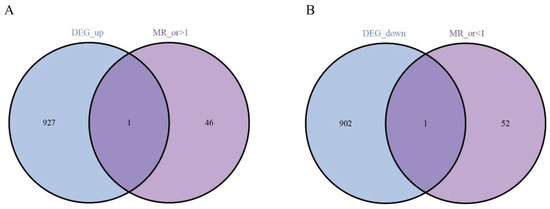
Figure 3.
Analysis of key genes. (A): The Venn analysis of up-regulated and MR_ gene; (B): 1 down-regulated co-expressed gene.
3.3. Causal Relationship Between the Hub Genes and HCC
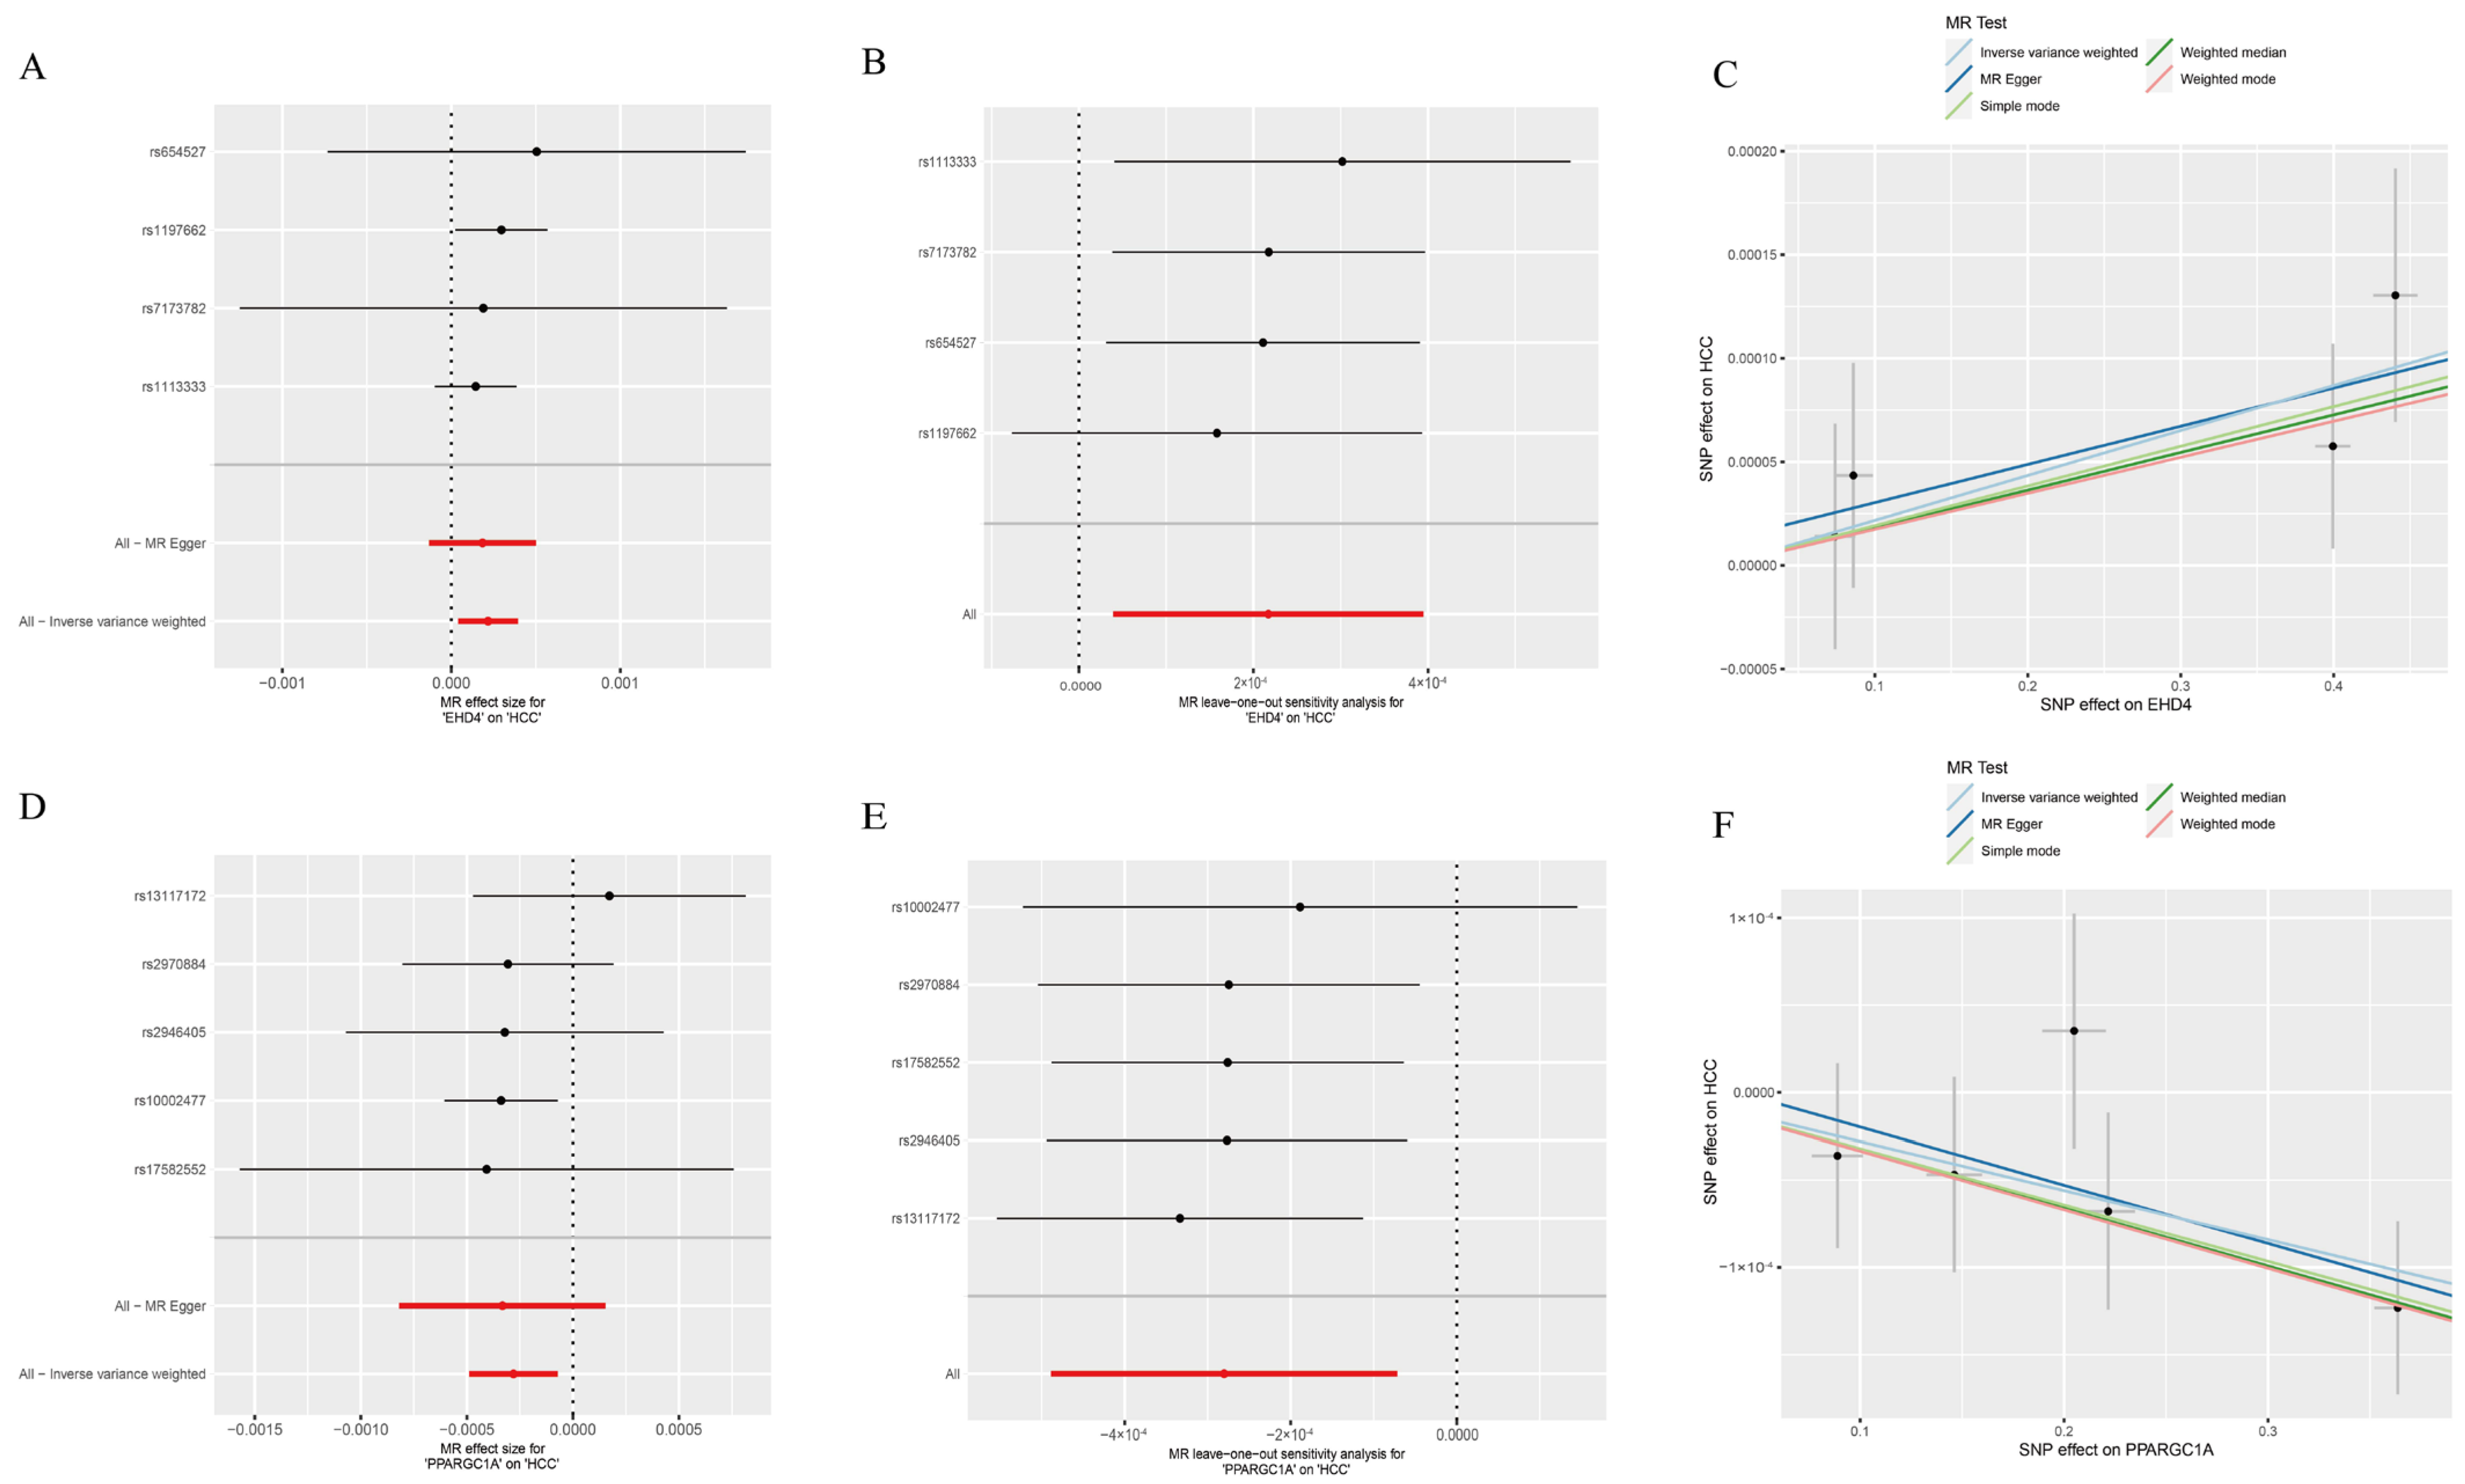
We next employed two-sample MR to explore whether the two HCC-related hub genes exert a causal influence on tumor risk. Using the inverse-variance-weighted (IVW) estimator, EHD4 displayed a significant positive association with HCC (Figure 4A–C), whereas PPARGC1A was inversely associated with disease susceptibility (Figure 4D–F). Neither the Cochran Q test for heterogeneity nor MR-Egger’s intercept for horizontal pleiotropy reached statistical significance (p > 0.05), indicating that our findings were unlikely to be confounded by variant heterogeneity or directional pleiotropy. Leave-one-out analyses further confirmed that removal of any single instrumental variable (IV) had only a minimal impact on the pooled causal estimate, underscoring the robustness of the results (Supplementary Materials). Finally, to illustrate the genomic context of these loci, we plotted the chromosomal positions of all co-expressed genes (Figure 5). The Circos plot demonstrates that EHD4 and PPARGC1A are located on different chromosomes but show significant functional interactions through co-expression networks. This genomic mapping reveals potential regulatory hotspots and highlights chromosomal regions that may play critical roles in HCC pathogenesis. The interconnecting lines between different genomic locations suggest potential trans-regulatory mechanisms that could coordinate the expression of these genes during hepatocarcinogenesis.
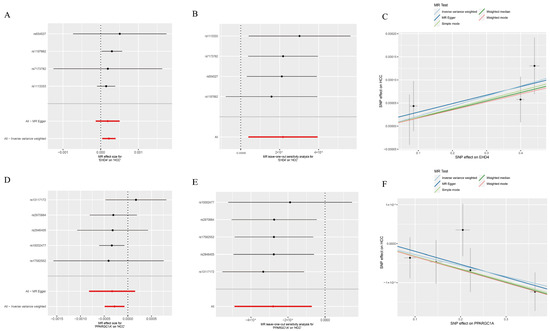
Figure 4.
Mendelian randomization analysis of the hub genes. (A): Forest plot of EHD4 against HCC risk; (B): Leave-one-out test for EHD4 on HCC; (C): Individual estimates of the causal effect of EHD4 on HCC; (D): Forest plot of PPARGC1A on HCC risk; (E): PPARGC1A leave-one-out test for HCC; (F): Individual estimates of the PPARGC1A causal effect on HCC. In panels (A,B,D,E): Red lines represent the overall MR effect estimates, while black lines represent individual SNP effect estimates with their confidence intervals.
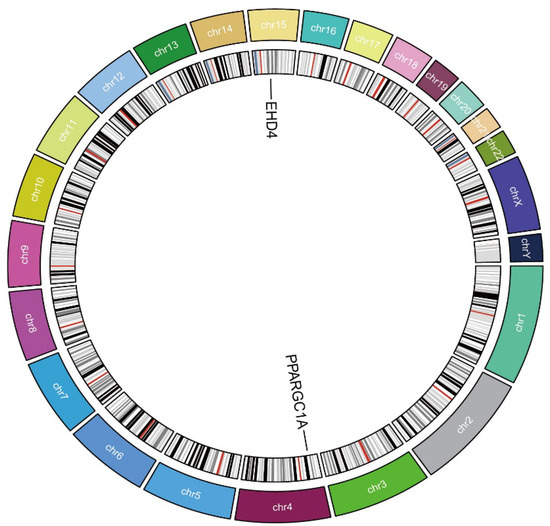
Figure 5.
Circos plot of the hub genes. The circular diagram shows chromosomal locations, genomic positions, and functional connections between identified genes. Different colors represent distinct chromosomes.
3.4. Gene Set Enrichment Analysis (GSEA) of the Hub Genes
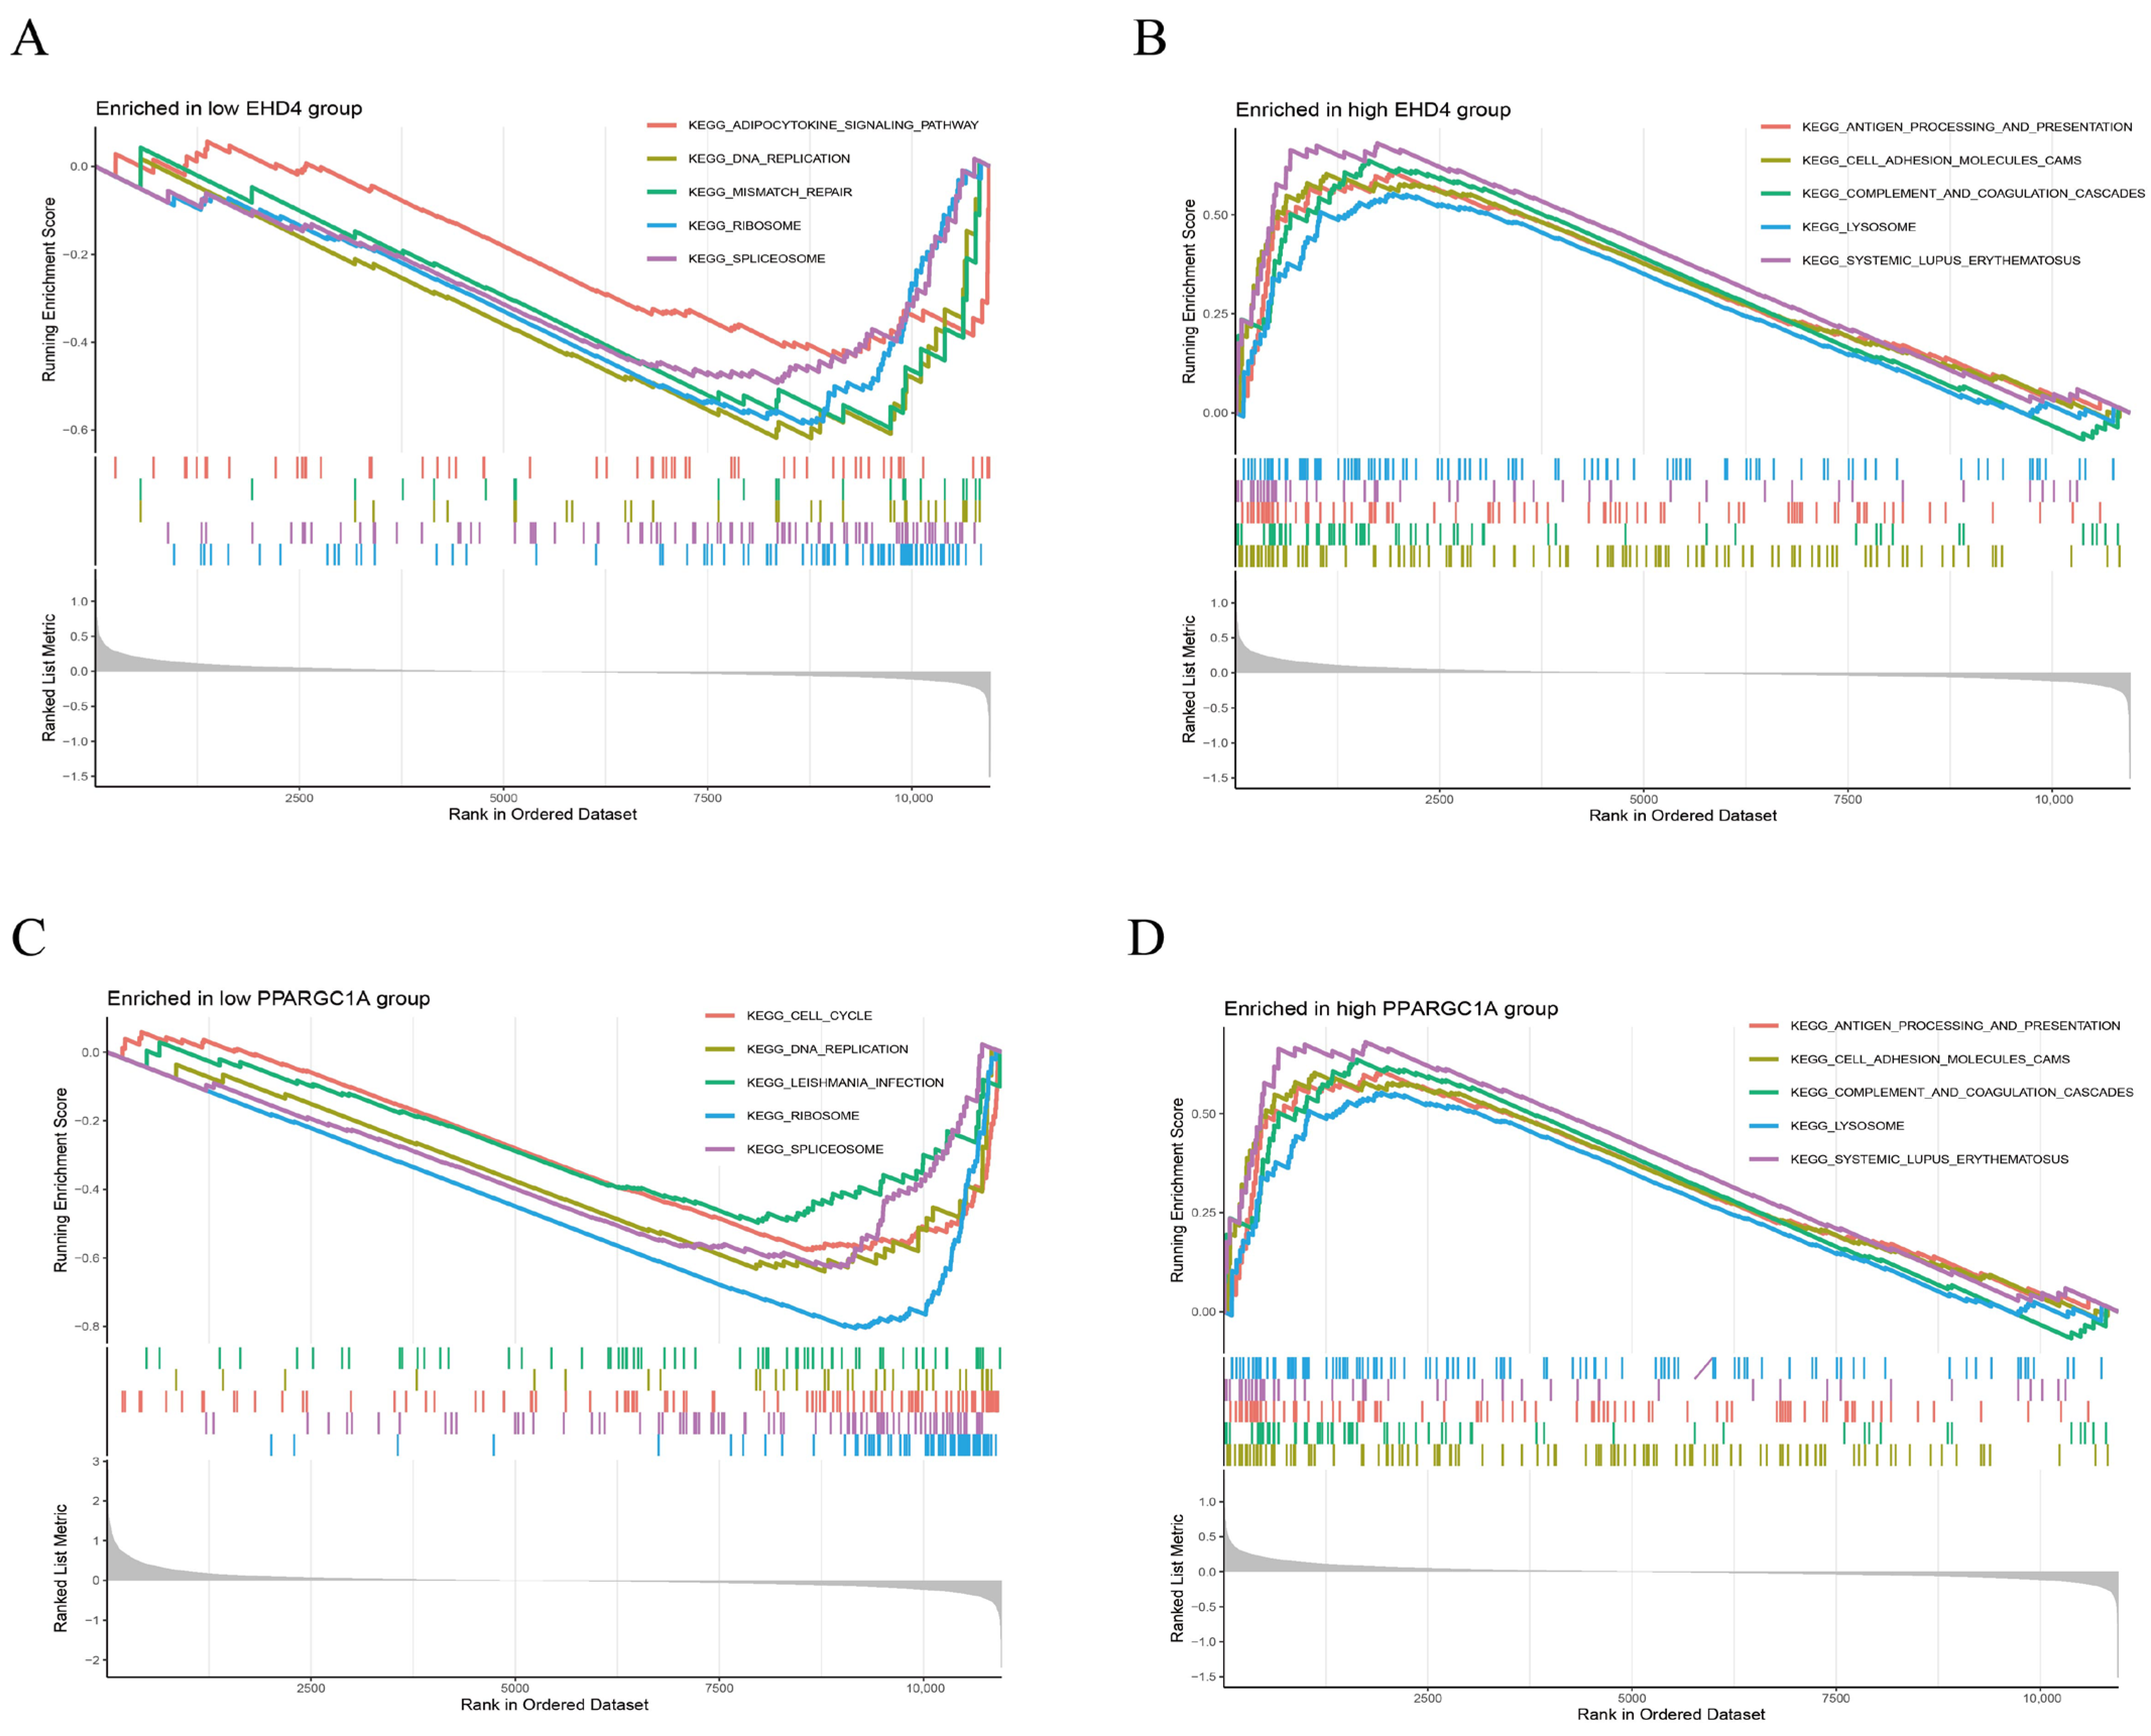
We further performed GSEA analysis to reveal significant differences in the functional pathways associated with the differential expression levels of the key genes. In the low-EHD4 expression group, the most enriched pathways included the adipocytokine signaling pathway, DNA replication, mismatch repair, ribosomes, and spliceosomes (Figure 6A). Conversely, in the high-EHD4 expression group, the most enriched pathways were antigen processing and presentation, cell adhesion molecules, complement and coagulation cascades, lysosomes, and systemic lupus erythematosus (Figure 6B). For PPARGC1A, the low-expression group exhibited enriched pathways related to cell cycle, DNA replication, EBV infection, ribosomes, and spliceosomes (Figure 6C). In contrast, the high-PPARGC1A expression group was primarily enriched for pathways involving Complement and Coagulation Cascades, Drug Metabolism Cytochrome P450, Metabolism of Xenobiotics, Retinol Metabolism, and Valine, Leucine, and Isoleucine Degradation (Figure 6D).
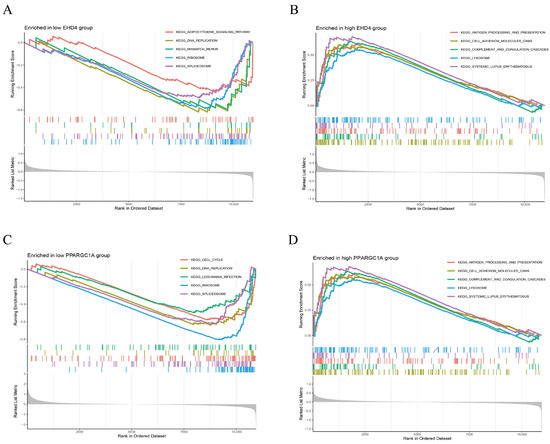
Figure 6.
Gene set enrichment analysis (GSEA) reveals distinct KEGG pathway signatures in low- and high-expression groups of EHD4 and PPARGC1A. (A): The top 5 active biological functions in the EHD4 low-expression group; (B): The top 5 active biological functions in the EHD4 high-expression group; (C): The top 5 active biological functions in the PPARGC1A low-expression group; (D): The top 5 active biological functions in the PPARGC1A high-expression group.
3.5. Assessment of Immune Cell Infiltration in HCC
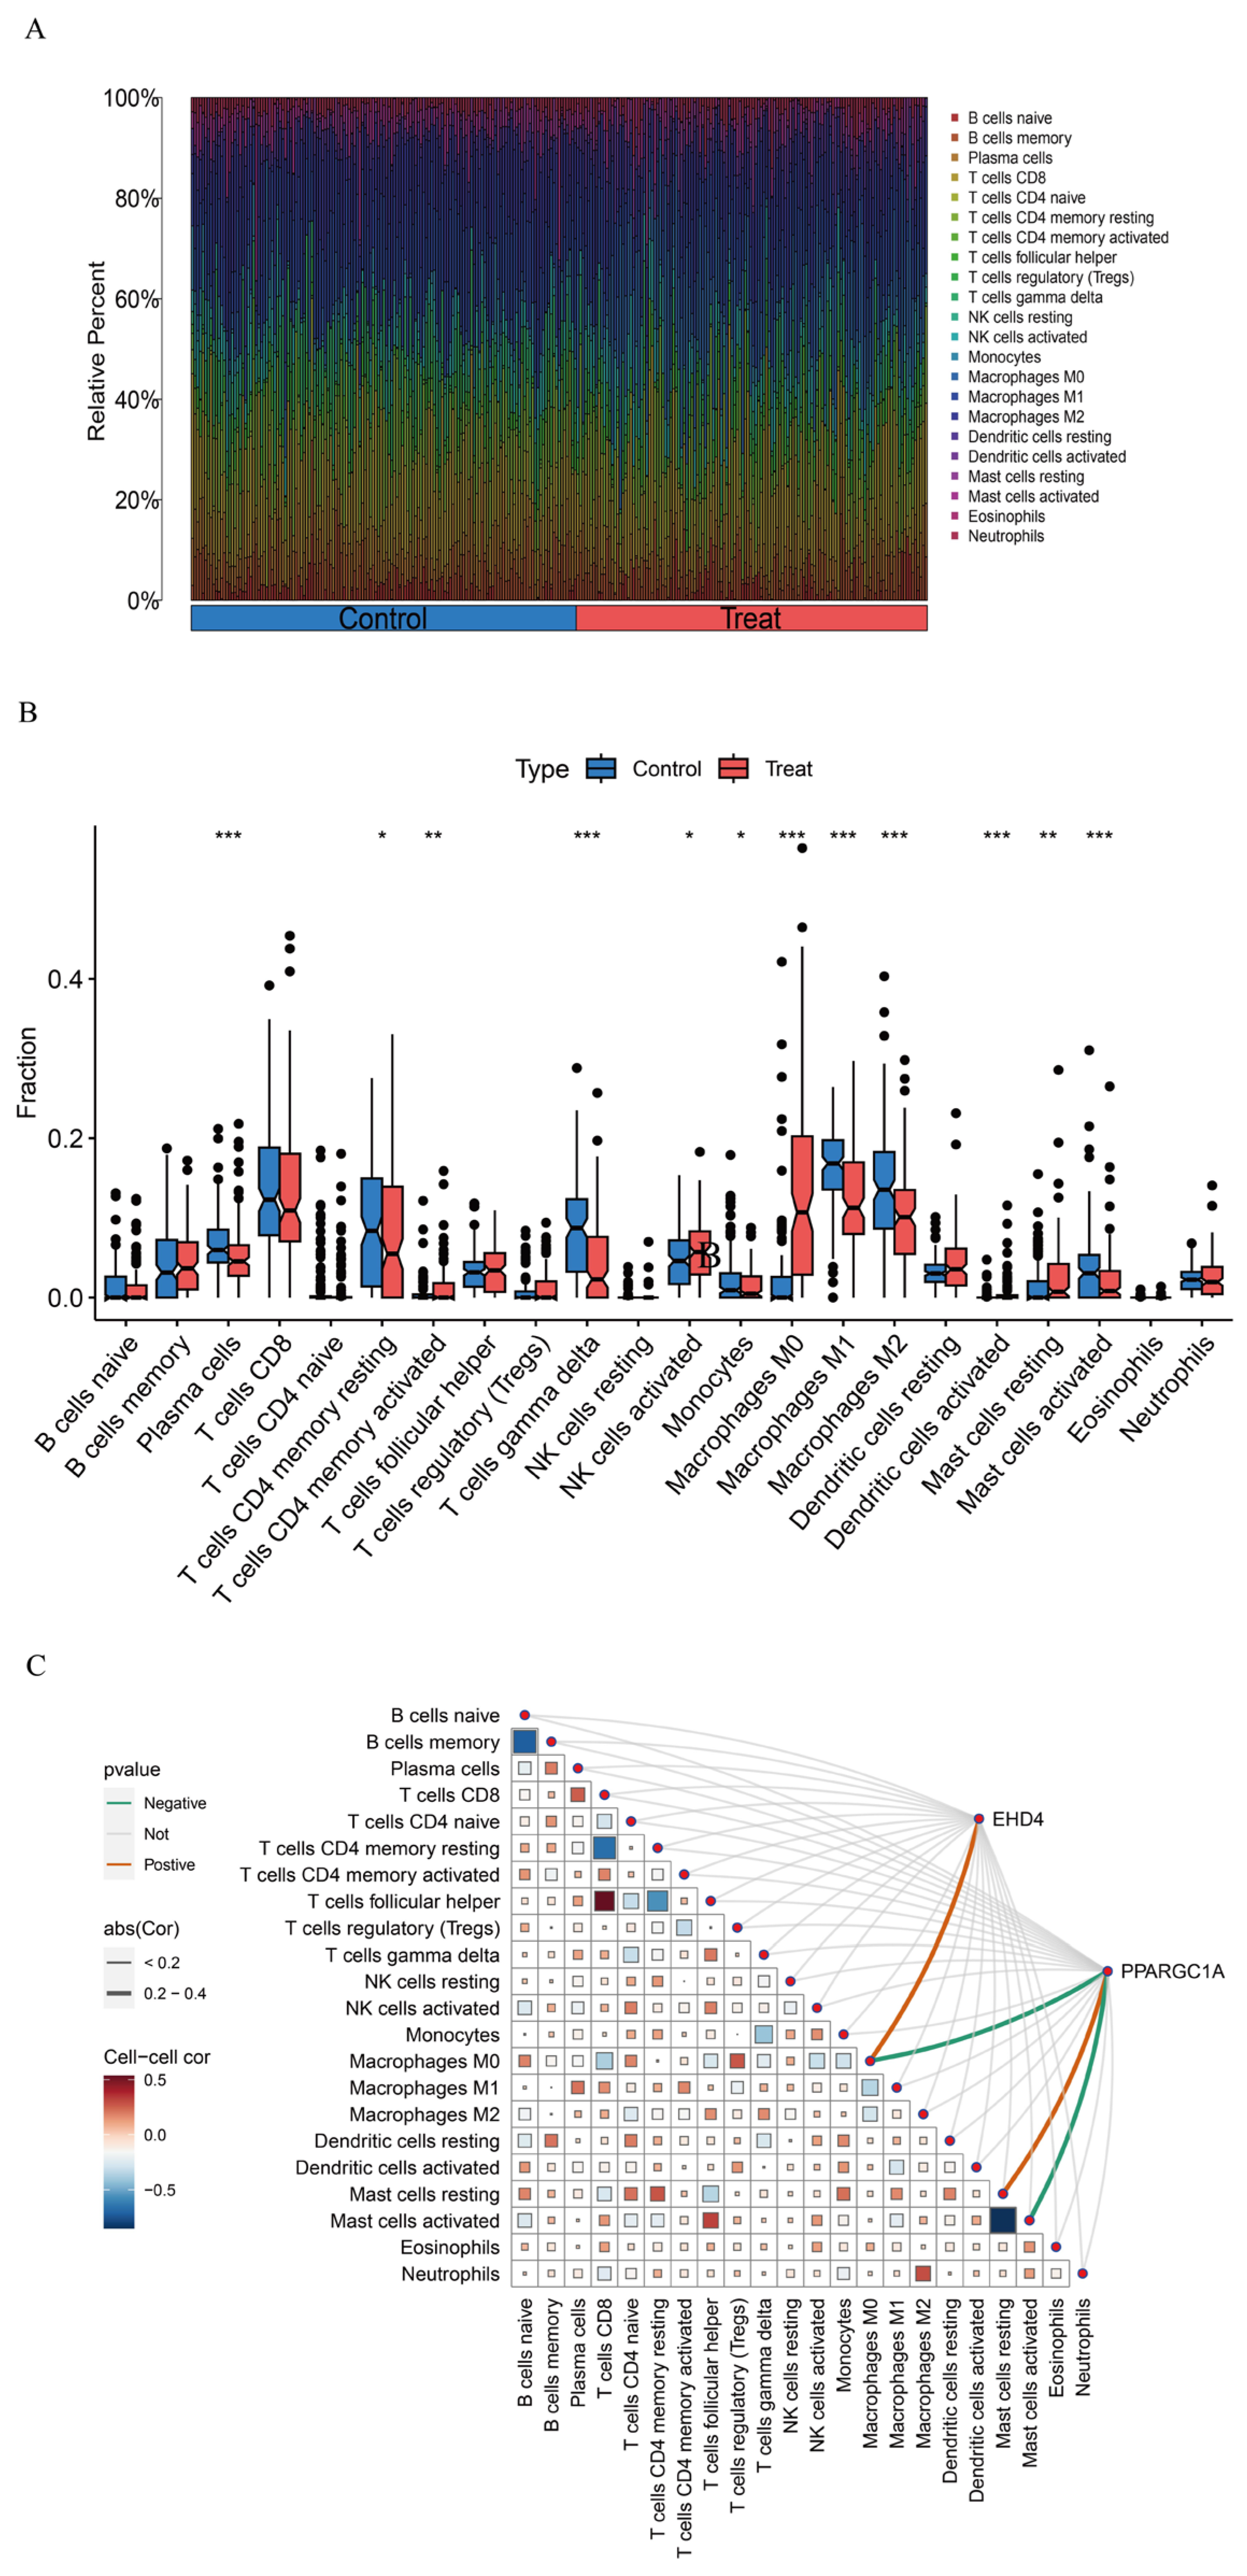
Gene function and pathway exploration suggested that the HCC co-expressed gene set is tightly linked to immune and inflammatory activities. Immune cell composition was therefore estimated with CIBERSORT, which deconvoluted the relative abundances of 22 leukocyte subsets for every sample (Figure 7A). Comparisons between tumor and non-tumor tissue uncovered marked shifts in several populations—most notably γδ T cells, activated dendritic cells, activated mast cells, plasma cells, and the M0, M1, and M2 macrophage subsets (Figure 7B)—implying that these cells may participate in HCC development. We next examined how the two hub genes relate to the immune landscape using the linkET package. EHD4 showed a positive association with M0 macrophages, whereas PPARGC1A was inversely related to M0 macrophages and activated mast cells but positively linked to resting mast cells (Figure 7C). These patterns indicate that the two genes may influence macrophage polarization and mast cell activation in the tumor micro-environment.

Figure 7.
HCC immune landscape assessment. (A): Comparative immune cell composition displayed as vertical distribution bars comparing control versus HCC tissues; (B): Differential abundance of immune cell populations (n = 22) visualized through quartile distribution plots highlighting significant variations between normal and malignant liver samples; (C): Correlation matrix visualizing interactions between identified immune cell subtypes and key differentially expressed genes. Statistical significance threshold: * p < 0.05. In panel (C): The size of squares represents the absolute value of correlation coefficients, with larger squares indicating stronger correlations, and statistical significance is indicated by filled versus empty squares. Statistical significance threshold: * p < 0.05, ** p < 0.01, *** p < 0.001.
3.6. Validation Group Differential Analysis of the Hub Genes
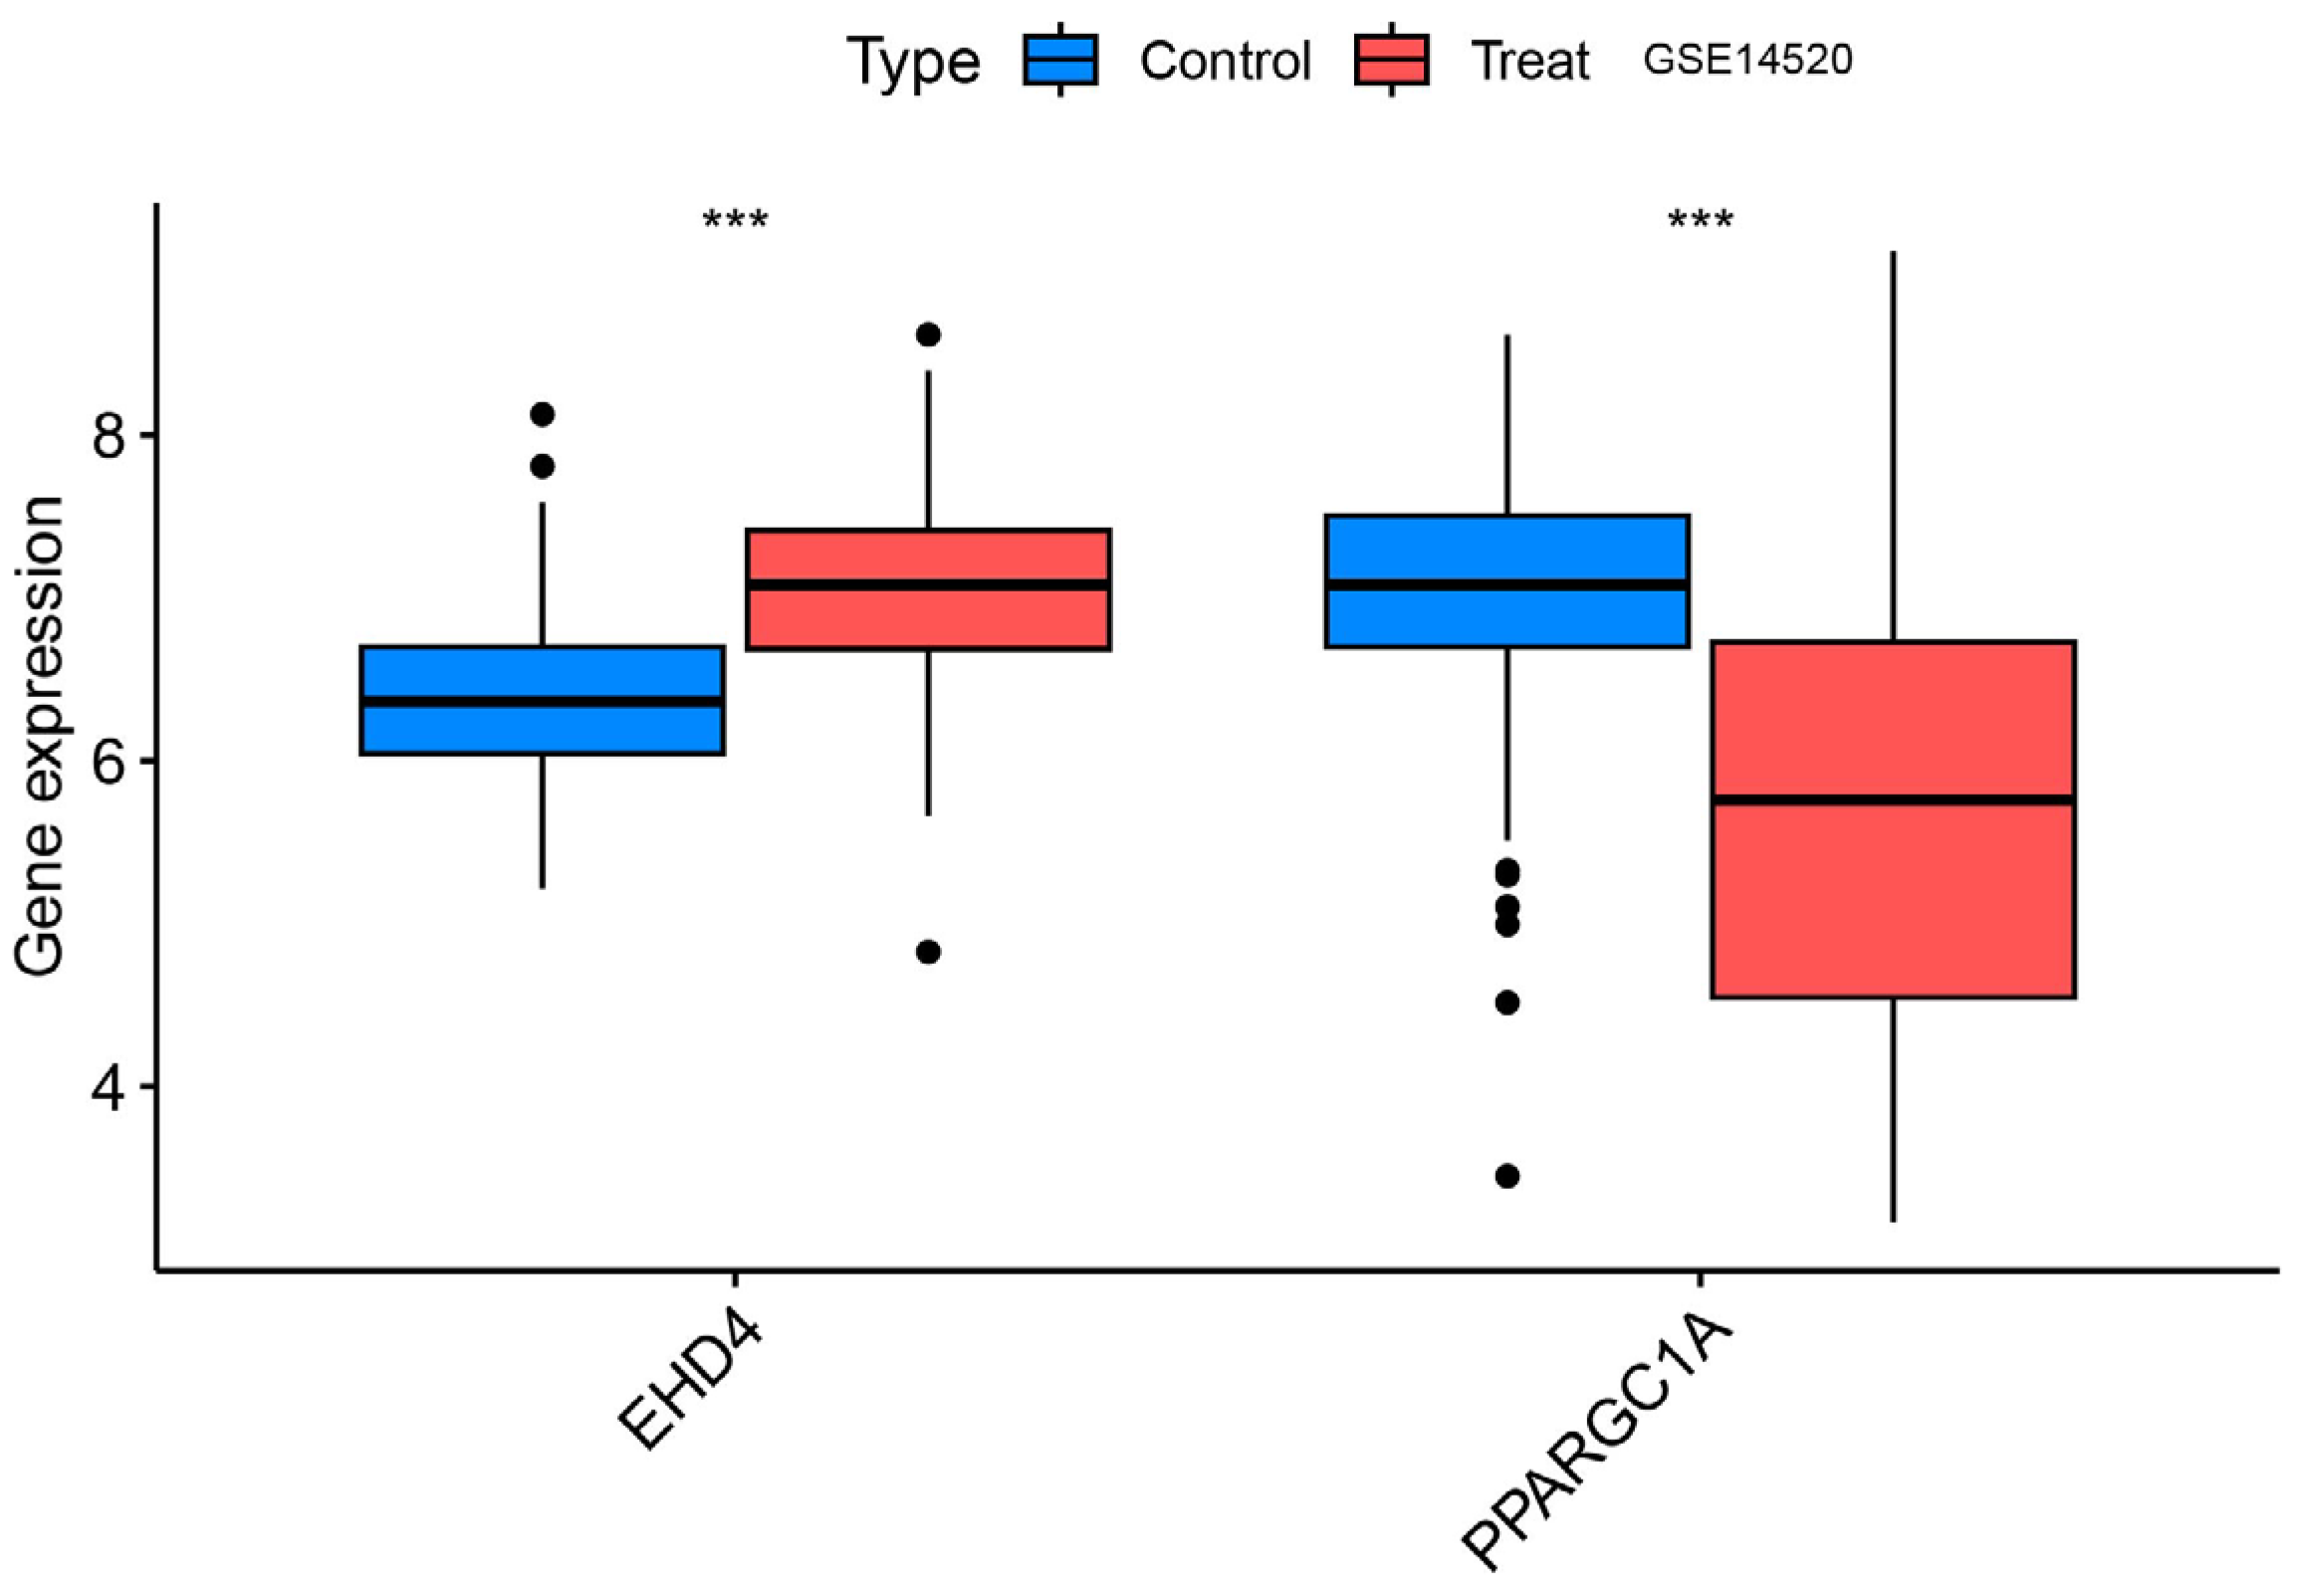
We confirmed that the co-expressed genes identified in the MR analysis had the appropriate expression levels in the GSE14520 dataset. The results showed that EHD4 expression was significantly higher in the HCC samples than in the healthy controls. PPARGC1A expression was significantly lower than in healthy controls (Figure 8), and the expression levels of both genes were consistent with our MR analysis results.

Figure 8.
Validation group differential analysis of the hub genes. ***, p < 0.001.
3.7. Expression Analysis of PPARGC1A and EHD4 in Rat HCC Model
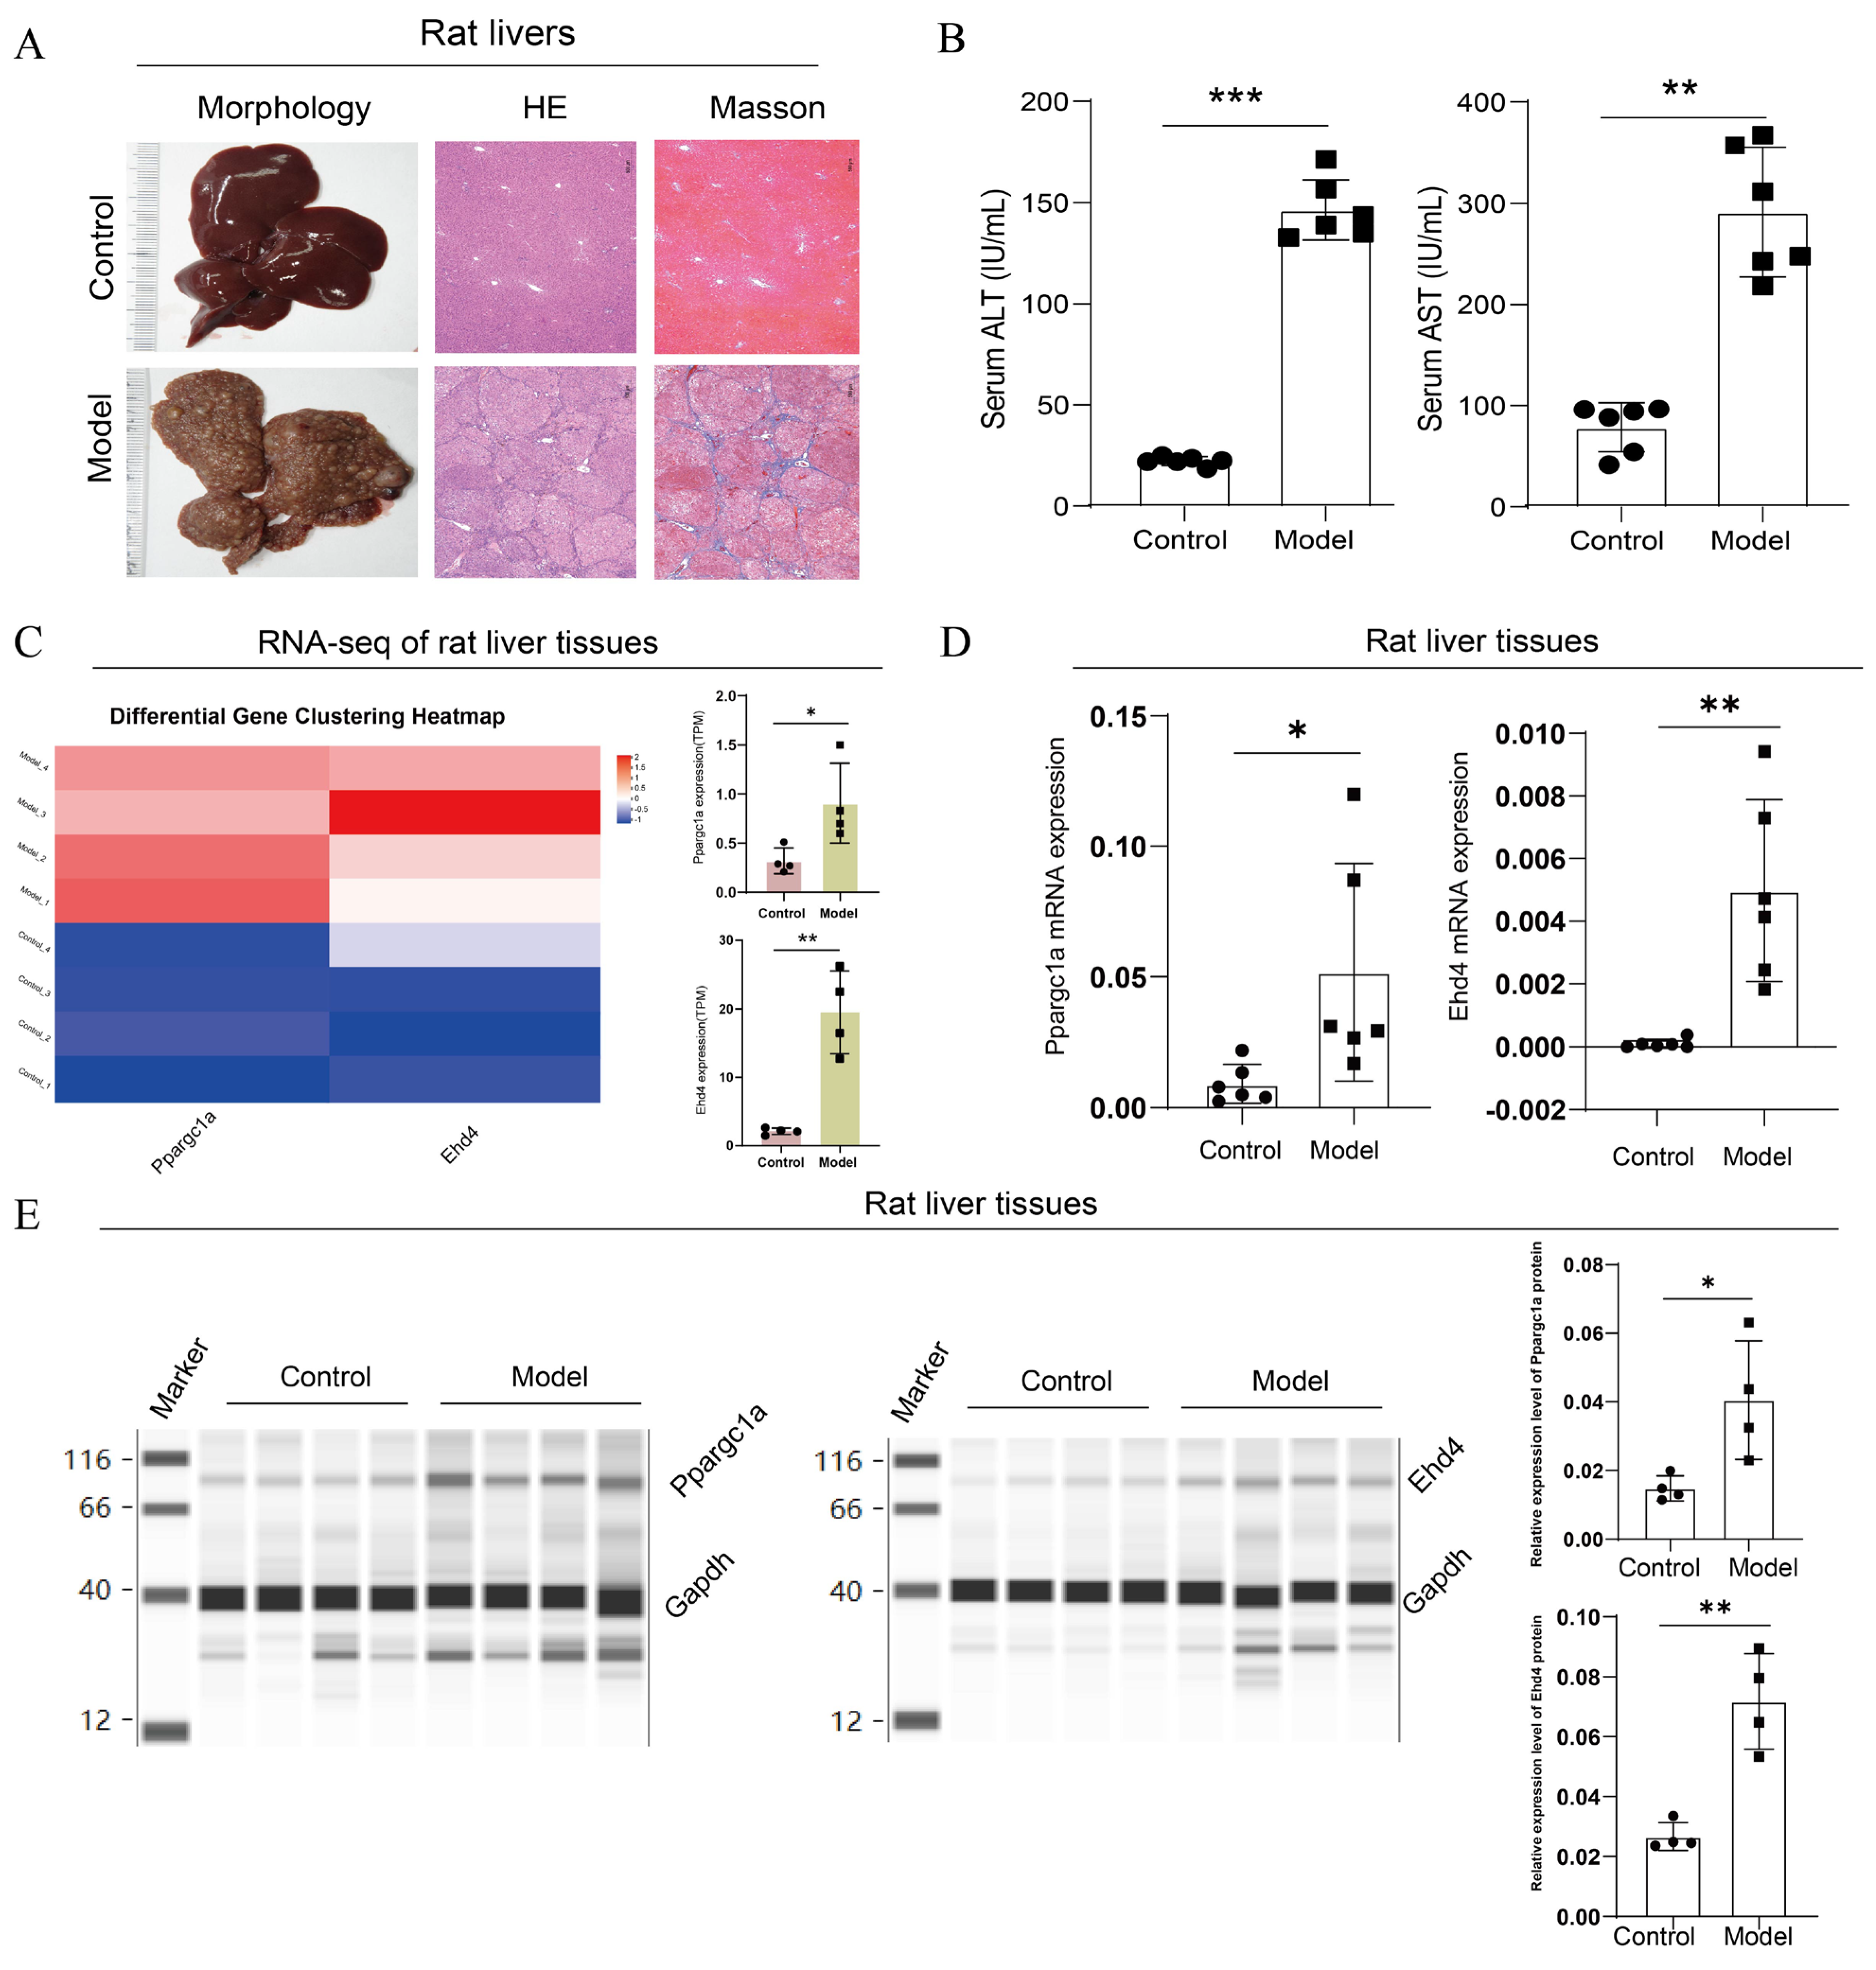
Following the completion of the rat model, we first performed pathological and serum index detection. Compared with the control group, the H&E staining of the model group exhibited disrupted lobular structures with pseudo-lobules and hyperplastic nodules formed under fibrous encapsulation; the central veins were displaced, hepatocytes varied in size in the presence of multinucleated or binucleated cells, and the nuclear-to-cytoplasmic ratio increased; degeneration, necrosis, and dysplastic hyperplasia were observed in some of the hepatocytes; the arrangement of the hepatic cords was disordered; and there was marked fibrous proliferation in the portal areas, accompanied by inflammatory cell infiltration. Masson’s trichrome staining showed no significant blue staining in the control group, while in the model group, there was a substantial increase in collagen fiber proliferation, with fibers encapsulating pseudo-lobules and abnormal hyperplastic nodules (Figure 9A). The serum detection results showed that compared with the control, the ALT and AST levels were significantly upregulated in the model group (Figure 9B). These results suggested the successful construction of the rat HCC model.

Figure 9.
Upregulated expression of PPARGC1A and EHD4 in rat HCC model. (A): Microscopic images of rat liver histopathology stained with H&E and Masson (50× magnification); (B): Serum levels of ALT and AST in rats; (C): Transcriptome analysis of rat livers. (D): Ppargc1a and Ehd4 mRNA expression in rat liver tissue; (E): Ppargc1a and Ehd4 protein expression in rat liver tissue. (B–E) Data were presented as the mean ± SD, and the p value was calculated by performing an unpaired Student’s t-test, *, p < 0.05; **, p < 0.01; ***, p < 0.001; ns, not significant.
Next, we analyzed the expression of the hub genes in rats’ livers. In the transcriptome analysis of rat livers, compared to the control group, we observed upregulation of PPARGC1A and EHD4 genes in the model group (Figure 9C). To further validate this finding, we conducted qRT-PCR analysis of Ppargc1a and Ehd4 genes in rat liver tissues, which revealed a significant increase in the model group compared to those in the control group (Figure 9D). Finally, we employed capillary protein electrophoresis analysis to assess protein expression in the rat liver, and the results indicated significant increases in Ppargc1a and Ehd4 in the model group compared to the control (Figure 9E). These findings underscore the unique significance of these two targets in HCC.
3.8. Expression Analysis of EHD4 in Clinical Samples
The above results showed the importance of these two hub genes, and the expression trends of EHD4 in public databases and the rat model were consistent. To further confirm the expression of EHD4 in HCC, we analyzed the public databases and clinical samples. The results showed that in the TCGA database, EHD4 mRNA expression is significantly upregulated in HCC compared to normal liver tissues (Figure 10A), and it is upregulated in tumor tissues with the increase in tumor grade (Figure 10B). In the CPTAC database, compared to the normal liver tissues, EHD4 protein expression is significantly upregulated in HCC (Figure 10C), and the IHC staining also indicates the upregulation of EHD4 in HCC in the HPA database (Figure 10D). Meanwhile, we collected three clinical HCC samples and detected the expression of EHD4. Our sample results showed that the protein expression of EHD4 is upregulated in HCC tissues compared to non-tumor tissues (Figure 10E). Collectively, these findings indicate that the EHD4 is a critical factor in the progression of HCC.
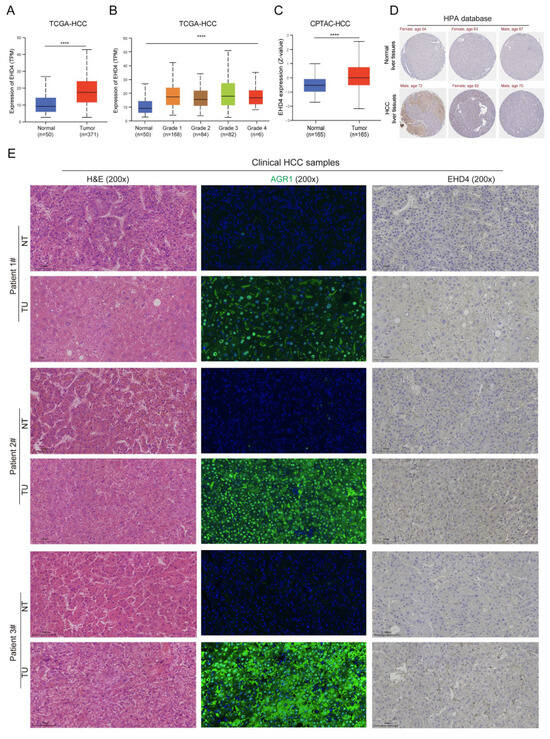
Figure 10.
The expression of EHD4 in HCC. (A) The mRNA expression of EHD4 in the TCGA-HCC database according to sample type. (B) The mRNA expression of EHD4 in the TCGA-HCC database according to tumor grade. (C) The protein expression of EHD4 in the CPTAC database. (D) The IHC staining of EHD4 in the HPA database. (E) The section staining of clinical HCC samples. ****, p < 0.0001.
4. Discussion
In China, liver cancer ranked second among all cancers in terms of mortality in 2022, and the overall five-year survival rate remains low [15]. High mortality and low survival rates not only exacerbate the public health burden but also impose significant economic and social pressures [16]. Global projections indicate that if current prevention strategies remain unchanged, liver cancer deaths could increase by 55% by 2040 [3], further underscoring the urgency of early screening and comprehensive interventions. HCC evolves through chronic hepatitis, fibrosis, and cirrhosis in a step-wise, inflammation-driven cascade governed by multiple genetic alterations [17]. Persistent insults trigger chronic hepatic inflammation, which, after years of cumulative damage, can culminate in malignant transformation [18]. Mendelian randomization (MR) offers a unique approach to understanding the genetic underpinnings of liver cancer by leveraging genetic variants as instrumental variables to infer causality between risk factors and the disease. This study integrated GEO transcriptomic data with two-sample Mendelian randomization to first identify EHD4 and PPARGC1A as key genes causally associated with HCC, which are significantly associated with liver cancer progression, indicating that genetic susceptibility plays an important role in the pathogenesis of liver cancer. Differential expression analysis and CIBERSORT analysis revealed that the expression levels of these two genes were significantly correlated with tumor-associated macrophage infiltration. The findings were subsequently validated in a DEN-induced rat HCC model.
EHD4, an important member of the EHD family, is the first extracellular matrix protein to contain an EH structural domain [19]. And EHD4, in turn, as a membrane transport regulatory protein, belongs to the EHD family of proteins along with EHD1, EHD2, and EHD3, all of which contain an EH domain at the C-terminus [20,21]. Related studies [22,23,24] have found that the EHD family is also involved in regulating cellular endocytosis, which is closely related to cancer. Endocytosis plays a key role in cell signalling, polarity, and adhesion, which are critical for cancer cell growth and metastasis. Studies have shown that members of the EHD family, such as EHD2, play an important role in inhibiting the migration and invasion of HCC cells [25]. Decreased EHD2 expression correlates with higher tumor grade and metastasis rates, suggesting that EHD4 may play a role in HCC through a similar mechanism. In addition, EHD4 may be closely related to signalling pathways in HCC. For example, EHD3 promotes cancer progression by affecting the Wnt/β-catenin signalling pathway [26]. This signalling pathway is also important in HCC as it is closely related to cell proliferation, apoptosis, and differentiation. Therefore, EHD4 may influence the occurrence and development of HCC by regulating similar signalling pathways. Another noteworthy aspect is that EHD4 may influence chemotherapy resistance in HCC cells; other members of the EHD family, such as EHD1, have been shown to influence cellular sensitivity to chemotherapeutic drugs in certain cancers by modulating intracellular drug accumulation and efflux [27]. Investigating whether EHD4 has a similar function in HCC will help develop new anti-cancer treatment strategies, and the expression of EHD4 protein in clear cell carcinoma is significantly higher than that in eosinophilic cell tumors, which is more conducive to future clinically effective targeted therapy for patients with related cancers [28]. Although there are limited studies on the specific role of EHD4 in HCC, by drawing on the studies of other members of the EHD family, we can speculate that EHD4 may affect the progression, metastasis, and chemoresistance of HCC through multiple mechanisms. This provides a strong direction for future in-depth studies on the role of EHD4 in HCC, and may provide new targets for HCC treatment.
PPARGC1A, also known as PPAR coactivator 1-alpha (PGC-1α), plays a pivotal role in cellular metabolism and energy homeostasis. The protein encoded by this gene initiates multiple functions, including alpha-tubulin, estrogen receptor, and peroxisome proliferator-activated receptor-binding activities. It is involved in processes such as cellular response to hexose stimuli, cellular response to organic cyclic compounds, and regulation of smooth muscle cell proliferation [29,30]. Tumor-associated macrophages (TAMs) and tumor microenvironments (TME s) are key drivers of hepatocarcinogenesis and progression, and PPARGC1A has been identified as a TAM-associated prognostic genes in liver cancer [31]. PPARGC1A has also been shown to be closely associated with liver cancer [32] and other related metabolic diseases [33]. Immunotherapy and competitive endogenous RNA (ceRNA) are the main research hotspots in hepatocellular carcinoma. Zuo et al. [34] identified the target gene PPARGC1A in the prognosis-associated sub-network of ceRNAs and further established a risk prediction model, elucidating its key role in predicting the poor prognosis of liver cancer. They found a strong correlation between different types of tumor-infiltrating immune cells and immune checkpoints, providing new ideas for the study of the pathogenesis of liver cancer. In another case–control study [35], the investigators assessed the specific association between liver cancer risk and PPARGC1A polymorphisms in a Moroccan population, confirming that PPARGC1A serves as a common prognostic marker for hepatocellular carcinoma, and that the PPARGC1A rs8192678 polymorphism is strongly associated with an increased risk of hepatocellular carcinoma in the Moroccan population. Qian et al. [36] conducted an in-depth analysis of PPARGC1A using the Cancer Genome Atlas dataset to effectively assess the impact of PPARGC1A on the overall survival of liver cancer patients and discovered that PPARGC1A is a protective factor for liver cancer patients and ultimately better prevents and predicts liver cancer metastases through the development of a more effective high-throughput technology to identify metastasis inhibitors, which is supported by our Mendelian randomization study. Notably, PPARGC1A was up-regulated in our DEN-induced rat HCC model, whereas several large-scale human studies have documented a marked down-regulation of PPARGC1A in hepatocellular carcinoma and linked its low expression to poor prognosis [32]. In contrast, PPARGC1A is over-expressed in non-small-cell lung cancer, where it actively promotes metastatic dissemination [37]. These discordant findings emphasize the existence of tissue- and species-specific regulatory circuits and may also reflect differences in tumor stage. Moreover, tumor-micro-environment heterogeneity and metabolic stressors such as hypoxia can switch PPARGC1A between tumor-suppressive and tumor-promoting roles. Deblois and colleagues showed that the PGC-1/ERR axis exerts bidirectional effects depending on cellular context [38]. Together, these observations underscore the importance of integrating multi-species datasets and carefully considering biological context when translating results from animal models to the clinic. Future work should delineate the temporal dynamics of PPARGC1A expression across HCC progression and unravel how micro-environmental cues modulate its function.
Our study indicates that both EHD4 and PPARGC1A play a co-regulatory role in macrophage M0 polarization. The involvement of EHD4 and PPARGC1A in hepatocellular carcinoma may be mediated by the regulation of tumor-associated macrophages (TAMs) and other immune cells. The observed positive correlation between EHD4 and M0-type macrophages suggests a specific function of EHD4 in unpolarized macrophages, which exist in an inactivated state and have the potential to differentiate into either pro-inflammatory M1-type or pro-tumorigenic M2-type macrophages, depending on microenvironmental cues. Macrophages are critical components of the immune system and are responsible for pathogen phagocytosis and antigen presentation. Their endocytic capacity is essential for normal immune function [39]. EHD4 may influence the behavior of M0-type macrophages, potentially promoting tumor progression and immune escape by modulating the macrophage endocytosis pathway or the membrane protein recycling process [40]. PPARGC1A is closely linked to the immunoregulatory functions of TAMs, particularly the suppression of proinflammatory signals within the tumor microenvironment. PPARGC1A affects the invasive and metastatic potential of HCC cells by influencing macrophage activity, suggesting that it may be a crucial molecular target for modulating the HCC microenvironment [34,41]. Studies have shown that PPARGC1A expression is negatively correlated with M0 macrophages, an undifferentiated form of macrophages in the TME. This correlation suggests that PPARGC1A may influence macrophage polarization, potentially reducing the pro-tumoral M2 phenotype, which is often associated with tumor progression in HCC [42]. Additionally, in hepatocellular carcinoma, PPARGC1A was positively correlated with resting mast cells and negatively correlated with activated mast cells, suggesting that PPARGC1A may play a key role in regulating the mast cell activation status in the tumor microenvironment. Mast cells play a complex role in tumor development and are usually involved in pro-inflammatory and immune regulation. The positive correlation between PPARGC1A and resting mast cells suggests that it may reduce the tumor-promoting effects of mast cells by maintaining the inactivated state of these cells. Meanwhile, the negative correlation between PPARGC1A and activated mast cells suggests that it may attenuate the pro-inflammatory effects of mast cells in the tumor microenvironment by inhibiting their activation [43,44,45]. PPARGC1A may play a protective role in limiting tumor progression by regulating mast cell status. Further studies on this mechanism may provide new targets for the treatment of hepatocellular carcinoma.
In summary, genome-wide association studies (GWASs) in recent years still provide relatively limited genetic evidence for EHD4 and PPARGC1A in hepatocellular carcinoma. In the case of PPARGC1A, its classical coding variant rs8192678 (Gly482Ser) was reported to be associated with an increased risk of HCC in a case–control study in North African Morocco [35]. However, in a large North American multicenter GWAS from 2024, the PPARGC1A locus did not reach the genomics significance threshold, suggesting that the risk effect may be population- or environment-specific. As for EHD4, no significant association signals located at the EHD4 locus have been detected in any of the currently published GWAS, including multi-stage cohorts of HBV-associated and non-viral HCC, which supports the importance of confirming EHD4 function in the present study through causal extrapolation and animal studies. Eventually, our study identified EHD4 and PPARGC1A as key regulators in hepatocellular carcinoma (HCC), particularly through their roles in modulating tumor-associated macrophages (TAMs) and other immune cells within the tumor microenvironment. The positive correlation between EHD4 and M0-type macrophages underscores its potential function in influencing macrophage polarization and promoting tumor progression and immune evasion. Similarly, PPARGC1A appears to play a dual role in HCC, affecting both macrophage activity and the immune landscape. These findings not only deepen our understanding of the molecular mechanisms driving HCC but also highlight EHD4 and PPARGC1A as promising targets for therapeutic intervention. Future studies should focus on validating these targets in a clinical setting and exploring their potential in developing personalized treatment strategies for HCC.
Study Limitations
Although this study combined multi-omics data, Mendelian randomization, and animal model systems to reveal the potential role of EHD4 and PPARGC1A in hepatocellular carcinoma, certain limitations remain. In vivo validation used a DEN-induced rat model, which differs from human HCC in genetic background and immune microenvironment, so extrapolation to clinical settings requires caution. The study lacks functional experimental evidence, such as gene knockout/overexpression experiments, making it difficult to fully elucidate the molecular mechanisms by which these genes regulate immune cells. Additionally, the cross-sectional design failed to dynamically track the expression changes in target genes across different stages of HCC. Future studies should include prospective follow-up in multi-ethnic population cohorts and combine gene editing technologies to conduct in-depth functional validation, thereby providing more reliable molecular targets for the clinical treatment of liver cancer.
Supplementary Materials
The following supporting information can be downloaded at: https://www.mdpi.com/article/10.3390/biomedicines13061313/s1, Table S1: MR Analysis Results; Table S2: Heterogeneity Test Results for MR Analysis; Table S3: MR-Egger Intercept Test for Horizontal Pleiotropy.
Author Contributions
Concept and design: X.Z., Y.Y. and J.W.; Experiments and procedures: S.L., W.Q. and C.L.; Data curation: X.C., Q.L., S.Z. and W.W.; Formal analysis: H.D. and X.L.; Methodology: X.Z., Y.Y. and J.W.; Writing of the article: S.L., W.Q. and C.L. All authors have read and agreed to the published version of the manuscript.
Funding
This study was supported by the National Natural Science Foundation of China (Grant No. 82405314, awarded to Xiaobin Zao) and the Science and Technology Plan Project of Xiamen Municipal Government (Grant No. 3502Z202374112, awarded to Junzheng Wu).
Institutional Review Board Statement
All animal experiments were approved by the Ethics Committee of Experimental Animals at Dongzhimen Hospital, Beijing University of Chinese Medicine (Ethics Approval No: 21-10-01, approved on 24 August 2020). The Ethics Committee of Xiamen Hospital of Traditional Chinese Medicine approved the investigation of clinical samples (Ethics Approval No: 2020-K030-01, approved on 7 September 2020). All procedures were performed following institutional guidelines for the care and use of laboratory animals to minimize suffering and distress. For the analysis of human data (GEO database), publicly available anonymized datasets were used in compliance with relevant ethical standards.
Informed Consent Statement
Not applicable.
Data Availability Statement
The datasets generated and/or analyzed during the current study are available from the corresponding author upon reasonable request (yeyongan@vip.163.com).
Conflicts of Interest
The authors declare no conflicts of interest.
References
- Bray, F.; Laversanne, M.; Sung, H.; Ferlay, J.; Siegel, R.L.; Soerjomataram, I.; Jemal, A. Global cancer statistics 2022: GLOBOCAN estimates of incidence and mortality worldwide for 36 cancers in 185 countries. CA Cancer J. Clin. 2024, 74, 229–263. [Google Scholar] [CrossRef] [PubMed]
- Llovet, J.M.; Kelley, R.K.; Villanueva, A.; Singal, A.G.; Pikarsky, E.; Roayaie, S.; Lencioni, R.; Koike, K.; Zucman-Rossi, J.; Finn, R.S. Hepatocellular carcinoma. Nat. Rev. Dis. Primers 2021, 7, 6. [Google Scholar] [CrossRef] [PubMed]
- Rumgay, H.; Arnold, M.; Ferlay, J.; Lesi, O.; Cabasag, C.J.; Vignat, J.; Laversanne, M.; McGlynn, K.A.; Soerjomataram, I. Global burden of primary liver cancer in 2020 and predictions to 2040. J. Hepatol. 2022, 77, 1598–1606. [Google Scholar] [CrossRef] [PubMed]
- Kinsey, E.; Lee, H.M. Management of Hepatocellular Carcinoma in 2024: The Multidisciplinary Paradigm in an Evolving Treatment Landscape. Cancers 2024, 16, 666. [Google Scholar] [CrossRef]
- Toh, M.R.; Wong, E.Y.T.; Wong, S.H.; Ng, A.W.T.; Loo, L.-H.; Chow, P.K.-H.; Ngeow, J. Global Epidemiology and Genetics of Hepatocellular Carcinoma. Gastroenterology 2023, 164, 766–782. [Google Scholar] [CrossRef]
- Joliat, G.R.; Allemann, P.; Labgaa, I.; Demartines, N.; Halkic, N. Treatment and outcomes of recurrent hepatocellular carcinomas. Langenbeck’s Arch. Surg. 2017, 402, 737–744. [Google Scholar] [CrossRef]
- Dagogo-Jack, I.; Shaw, A.T. Tumour heterogeneity and resistance to cancer therapies. Nat. Rev. Clin. Oncol. 2018, 15, 81–94. [Google Scholar] [CrossRef]
- Hemminki, K.; Sundquist, K.; Sundquist, J.; Försti, A.; Liska, V.; Hemminki, A.; Li, X. Familial risks for liver, gallbladder and bile duct cancers and for their risk factors in Sweden, a low-incidence country. Cancers 2022, 14, 1938. [Google Scholar] [CrossRef]
- Mucci, L.A.; Hjelmborg, J.B.; Harris, J.R.; Czene, K.; Havelick, D.J.; Scheike, T.; Graff, R.E.; Holst, K.; Möller, S.; Unger, R.H.; et al. Familial Risk and Heritability of Cancer Among Twins in Nordic Countries. JAMA 2016, 315, 68–76. [Google Scholar] [CrossRef]
- Hassan, M.M.; Li, D.; Han, Y.; Byun, J.; Hatia, R.I.; Long, E.; Choi, J.; Kelley, R.K.; Cleary, S.P.; Lok, A.S.; et al. Genome-wide association study identifies high-impact susceptibility loci for hepatocellular carcinoma in North America. Hepatology 2024, 80, 87–101. [Google Scholar] [CrossRef]
- Zhang, J.; Zhang, Q.; Hu, W.; Liang, Y.; Jiang, D.; Chen, H. A transcriptome-wide association study identified susceptibility genes for hepatocellular carcinoma in East Asia. Gastroenterol. Rep. 2024, 12, goae057. [Google Scholar] [CrossRef] [PubMed]
- Erzurumluoglu, A.M.; Liu, M.; Jackson, V.E.; Barnes, D.R.; Datta, G.; Melbourne, C.A.; Young, R.; Batini, C.; Surendran, P.; Jiang, T.; et al. Meta-analysis of up to 622,409 individuals identifies 40 novel smoking behaviour associated genetic loci. Mol. Psychiatry 2020, 25, 2392–2409. [Google Scholar] [CrossRef] [PubMed]
- Santos, N.P.; Colaço, A.A.; Oliveira, P.A. Animal models as a tool in hepatocellular carcinoma research: A Review. Tumor Biol. 2017, 39, 1010428317695923. [Google Scholar] [CrossRef]
- Uehara, T.; Pogribny, I.P.; Rusyn, I. The DEN and CCl4-Induced Mouse Model of Fibrosis and Inflammation-Associated Hepatocellular Carcinoma. Curr. Protoc. Pharmacol. 2014, 66, 14.30.1–14.30.10. [Google Scholar] [CrossRef]
- Han, B.; Zheng, R.; Zeng, H.; Wang, S.; Sun, K.; Chen, R.; Li, L.; Wei, W.; He, J. Cancer incidence and mortality in China, 2022. J. Natl. Cancer Cent. 2024, 4, 47–53. [Google Scholar] [CrossRef]
- Wu, Z.; Yu, Y.; Xie, F.; Chen, Q.; Cao, Z.; Chen, S.; Liu, G.G. Economic burden of patients with leading cancers in China: A cost-of-illness study. BMC Health Serv. Res. 2024, 24, 1135. [Google Scholar] [CrossRef]
- Marquardt, J.U.; Andersen, J.B.; Thorgeirsson, S.S. Functional and genetic deconstruction of the cellular origin in liver cancer. Nat. Rev. Cancer. 2015, 15, 653–667. [Google Scholar] [CrossRef]
- Schulze, K.; Nault, J.C.; Villanueva, A. Genetic profiling of hepatocellular carcinoma using next-generation sequencing. J. Hepatol. 2016, 65, 1031–1042. [Google Scholar] [CrossRef]
- Kuo, H.J.; Tran, N.T.; Clary, S.A.; Morris, N.P.; Glanville, R.W. Characterization of EHD4, an EH domain-containing protein expressed in the extracellular matrix. J. Biol. Chem. 2001, 276, 43103–43110. [Google Scholar] [CrossRef]
- Lu, Q.; Insinna, C.; Ott, C.; Stauffer, J.; Pintado, P.; Rahajeng, J.; Baxa, U.; Walia, V.; Cuenca, A.; Hwang, Y.-S.; et al. Early steps in primary cilium assembly require EHD1/EHD3-dependent ciliary vesicle formation. Nat. Cell Biol. 2015, 17, 531. [Google Scholar] [CrossRef]
- Naslavsky, N.; Caplan, S. EHD proteins: Key conductors of endocytic transport. Trends Cell Biol. 2011, 21, 122–131. [Google Scholar] [CrossRef]
- Cai, B.; Giridharan, S.S.P.; Zhang, J.; Saxena, S.; Bahl, K.; Schmidt, J.A.; Sorgen, P.L.; Guo, W.; Naslavsky, N.; Caplan, S. Differential roles of C-terminal Eps15 homology domain proteins as vesiculators and tubulators of recycling endosomes. J. Biol. Chem. 2013, 288, 30172–30180. [Google Scholar] [CrossRef]
- Bahl, K.; Naslavsky, N.; Caplan, S. Role of the EHD2 unstructured loop in dimerization, protein binding and subcellular localization. PLoS ONE 2015, 10, e0123710. [Google Scholar] [CrossRef]
- Wang, H.; Ma, Y.; Lin, Y.; Chen, R.; Xu, B.; Deng, J. SHU00238 promotes colorectal cancer cell apoptosis through miR-4701-3p and miR-4793-3p. Front. Genet. 2020, 10, 1320. [Google Scholar] [CrossRef]
- Liu, J.; Ni, W.; Qu, L.; Cui, X.; Lin, Z.; Liu, Q.; Zhao, H.; Ni, R. Decreased expression of EHD2 promotes tumor metastasis and indicates poor prognosis in hepatocellular carcinoma. Dig. Dis. Sci. 2016, 61, 2554–2567. [Google Scholar] [CrossRef]
- Yu, J.; Yan, Y.; Hua, C.; Song, H. EHD3 promotes gastric cancer progression via Wnt/β-catenin/EMT pathway and associates with clinical prognosis and immune infiltration. Am. J. Cancer Res. 2023, 13, 4401–4417. [Google Scholar]
- Gao, J.; Meng, Q.; Zhao, Y.; Chen, X.; Cai, L. EHD1 confers resistance to cisplatin in non-small cell lung cancer by regulating intracellular cisplatin concentrations. BMC Cancer 2016, 16, 470. [Google Scholar] [CrossRef]
- Di Meo, A.; Batruch, I.; Brown, M.D.; Diamandis, E.P.; Yang, C.; Finelli, A.; Jewett, M.A.; Yousef, G.M. Searching for prognostic biomarkers for small renal masses in the urinary proteome. Int. J. Cancer 2020, 146, 2315–2325. [Google Scholar] [CrossRef]
- Taghvaei, S.; Saremi, L.; Babaniamansour, S. Computational analysis of Gly482Ser single-nucleotide polymorphism in PPARGC1A gene associated with CAD, NAFLD, T2DM, obesity, hypertension, and metabolic diseases. PPAR Res. 2021, 2021, 5544233. [Google Scholar] [CrossRef]
- Hernandez-Quiles, M.; Broekema, M.F.; Kalkhoven, E. PPARgamma in metabolism, immunity, and cancer: Unified and diverse mechanisms of action. Front. Endocrinol. 2021, 12, 624112. [Google Scholar] [CrossRef]
- Huang, A.; Lv, B.; Zhang, Y.; Yang, J.; Li, J.; Li, C.; Yu, Z.; Xia, J. Construction of a tumor immune infiltration macrophage signature for predicting prognosis and immunotherapy response in liver cancer. Front. Mol. Biosci. 2022, 9, 983840. [Google Scholar] [CrossRef] [PubMed]
- Zhang, Q.; Xiong, L.; Wei, T.; Liu, Q.; Yan, L.; Chen, J.; Dai, L.; Shi, L.; Zhang, W.; Yang, J.; et al. Hypoxia-responsive PPARGC1A/BAMBI/ACSL5 axis promotes progression and resistance to lenvatinib in hepatocellular carcinoma. Oncogene 2023, 42, 1509–1523. [Google Scholar] [CrossRef]
- Aisyah, R.; Sadewa, A.H.; Patria, S.Y.; Wahab, A. The PPARGC1A is the gene responsible for thrifty metabolism related metabolic diseases: A scoping review. Genes 2022, 13, 1894. [Google Scholar] [CrossRef]
- Zuo, Z.; Chen, T.; Zhang, Y.; Han, L.; Liu, B.; Yang, B.; Han, T.; Zheng, Z. Construction of a ceRNA network in hepatocellular carcinoma and comprehensive analysis of immune infiltration patterns. Am. J. Transl. Res. 2021, 13, 13356–13379. [Google Scholar]
- Tanouti, I.A.; Fellah, H.; El Fihry, R.; Zerrad, C.; Abounouh, K.; Tahiri, M.; Belkouchi, A.; Badre, W.; Pineau, P.; Benjelloun, S.; et al. Association of peroxisome proliferator-activated receptor gamma coactivator 1 alpha coding variants with hepatocellular carcinoma risk in the Moroccan population: A case-control study. Asian Pac. J. Cancer Prev. 2023, 24, 3689–3696. [Google Scholar] [CrossRef]
- Qian, C.N.; Mei, Y.; Zhang, J. Cancer metastasis: Issues and challenges. Chin. J. Cancer 2017, 36, 38. [Google Scholar] [CrossRef]
- Li, J.D.; Feng, Q.C.; Qi, Y.; Cui, G.; Zhao, S. PPARGC1A is up-regulated and facilitates lung cancer metastasis. Exp. Cell Res. 2017, 359, 356–360. [Google Scholar] [CrossRef]
- Deblois, G.; St-Pierre, J.; Giguère, V. The PGC-1/ERR signalling axis in cancer. Oncogene 2013, 32, 3483–3490. [Google Scholar] [CrossRef]
- Hirayama, D.; Iida, T.; Nakase, H. The phagocytic function of macrophage-enforcing innate immunity and tissue homeostasis. Int. J. Mol. Sci. 2017, 19, 92. [Google Scholar] [CrossRef]
- Farha, M.; Jairath, N.K.; Lawrence, T.S.; El Naqa, I. Characterization of the tumor immune microenvironment identifies M0 macrophage-enriched cluster as a poor prognostic factor in hepatocellular carcinoma. JCO Clin. Cancer Inform. 2020, 4, 1002–1013. [Google Scholar] [CrossRef]
- Chen, C.; Wang, Z.; Ding, Y.; Qin, Y. Tumor microenvironment-mediated immune evasion in hepatocellular carcinoma. Front. Immunol. 2023, 10, 1133308. [Google Scholar] [CrossRef] [PubMed]
- Ishtiaq, S.M.; Arshad, M.I.; Khan, J.A. PPARγ signaling in hepatocarcinogenesis: Mechanistic insights for cellular reprogramming and therapeutic implications. Pharmacol. Ther. 2022, 240, 108298. [Google Scholar] [CrossRef] [PubMed]
- Chang, W.H.; Lai, A.G. The pan-cancer mutational landscape of the PPAR pathway reveals universal patterns of dysregulated metabolism and interactions with tumor immunity and hypoxia. Ann. N. Y. Acad. Sci. 2019, 1448, 65–82. [Google Scholar] [CrossRef]
- Zao, X.; Cao, X.; Liang, Y.; Zhang, J.; Chen, H.; Zhang, N.; Liu, R.; Jin, Q.; Chen, Y.; Li, X.; et al. The Chinese herbal KangXianYiAi formula inhibits hepatocellular carcinoma by reducing glutathione and inducing ferroptosis. Pharmacol. Res.-Mod. Chin. Med. 2023, 8, 100276. [Google Scholar] [CrossRef]
- Wang, C.; Dong, L.; Li, X.; Zhou, J.; Zhang, X.; Li, Y.; Wang, L.; Xu, J.; Li, D.; Liu, L. The PGC1α/NRF1-MPC1 axis suppresses tumor progression and enhances the sensitivity to sorafenib/doxorubicin treatment in hepatocellular carcinoma. Free Radic. Biol. Med. 2021, 163, 141–152. [Google Scholar] [CrossRef]


Disclaimer/Publisher’s Note: The statements, opinions and data contained in all publications are solely those of the individual author(s) and contributor(s) and not of MDPI and/or the editor(s). MDPI and/or the editor(s) disclaim responsibility for any injury to people or property resulting from any ideas, methods, instructions or products referred to in the content. |
© 2025 by the authors. Licensee MDPI, Basel, Switzerland. This article is an open access article distributed under the terms and conditions of the Creative Commons Attribution (CC BY) license (https://creativecommons.org/licenses/by/4.0/).