Systematic Review

Resting-State Functional MRI in Dyslexia: A Systematic Review

by
Bruce Martins
1,†,
Isabel A. B. Verrone
1,2,†,
Mariana M. I. Sakamoto
1,†,
Mariana Y. Baba
1,
Melissa E. Yvata
1,
Katerina Lukasova
2 and
Mariana P. Nucci
1,*
1
LIM44—Hospital das Clínicas da Faculdade Medicina da Universidade de São Paulo, São Paulo 05403-000, Brazil
2
Centro de Matemática, Computação e Cognição (CMCC), Universidade Federal do ABC, Santo André 09210-580, Brazil
*
Author to whom correspondence should be addressed.
These authors contributed equally to this work.
Biomedicines 2025, 13(5), 1210; https://doi.org/10.3390/biomedicines13051210
Submission received: 1 April 2025 / Revised: 9 May 2025 / Accepted: 12 May 2025 / Published: 16 May 2025

Abstract

:
Background/Objectives: The present review addresses and systematically analyses the most frequently reported neuropsychological and functional connectivity (FC) alterations in individuals with dyslexia compared to controls. By synthesizing extant evidence, this work aims to clarify dyslexic connectivity profiles and provide a foundation for future research and clinical translation. Methods: This systematic review analyzed publications from the last 10 years in two scientific databases, focusing on individuals with dyslexia, without previous injuries, who underwent resting-state functional magnetic resonance imaging (rs-fMRI) assessments, comparing them with typical readers. Results: This review revealed that most dyslexia studies on brain FC using rs-fMRI focused on children (92%), underscoring a gap in research on adults and limiting our understanding of brain maturation processes and neuroplasticity across the lifespan. FC alterations primarily involved ipsilateral connections (60%), with reduced connectivity mainly in the left hemisphere (40%), particularly in posterior regions, aligning with the neurobiological hypothesis of phonological and visual–phonological dysfunctions in dyslexia. Conversely, increased connectivity in the right hemisphere (20%) may indicate the engagement of an alternative network and highlight the complexity of neural adaptations in dyslexia. Conclusions: The findings highlight a significant gap in the study of adult dyslexia and suggest that FC alterations predominantly affect the left hemisphere, with possible compensatory mechanisms in the right hemisphere. Reading fluency improvements in dyslexia may be linked to connectivity changes across multiple brain networks rather than the classical reading circuitry alone. Increased and decreased connectivity in various regions related to executive function, language, and salience processing indicate that broader cognitive mechanisms play a key role in reading performance.

1. Introduction

Reading fluency, the ability to read accurately and effortlessly, is a critical skill for optimal individual development in our modern society [1]. This skill is essential for reading success, as it allows readers to devote their cognitive resources from word decoding to comprehension [2]. Systematic disturbances in this process, such as in developmental dyslexia, are worthy of significant scientific attention, particularly given their prevalence. Developmental dyslexia is defined by both the Diagnostic and Statistical Manual of Mental Disorders 5th Edition (DSM-5) and International Classification of Diseases 11th Revision (ICD-11) as a specific learning disorder marked by persistent difficulties in reading fluency, accuracy, decoding, and comprehension, despite adequate intelligence, sensory function, and educational exposure. According to the DSM-5 [3], it is classified under “Specific Learning Disorder with impairment in reading”, while the ICD-11 [4] characterizes it as a developmental disorder of reading skills. Both frameworks emphasize that symptoms should emerge early in schooling, cause functional impairment, and not be attributable to other neurological or psychiatric conditions. This standardized approach ensures consistency in the clinical and neuroimaging characterization of dyslexia, which affects reading specifically without impairing broader cognitive domains like attention, memory, or intelligence. [3,4]. It is estimated to be prevalent in approximately 7% of the world population [5], with higher prevalence in boys compared to girls [6]. Yet, understanding and addressing dyslexia remains a crucial area for ongoing research and development of intervention strategies [7].
The application of various magnetic resonance imaging (MRI) techniques, including structural MRI, diffusion MRI, and functional MRI (fMRI) [8], has emerged as one of the main approaches over the past decades to advance our understanding of the underlying mechanisms and root causes of this disorder, and provide complementary insights into brain characteristics of the condition [9]. Out of these, fMRI plays a central role in determining which cortical networks and regions of interest (ROIs) are recruited in individuals with dyslexia when engaged in tasks or resting [8,9]. Rs-fMRI, especially, makes it possible to assess FC, since it explores spontaneous fluctuations in brain activity that reflect the functional organization of cortical networks and their interactions [10].
As commonly observed in the literature, the vast majority of functional neuroimaging studies in dyslexia focus on children, while reports involving adults with dyslexia remain scarce. This pattern was also noted in our previous systematic review on brain structural alterations across the lifespan in individuals with dyslexia [11]. In pediatric populations, findings related to brain functional connectivity (FC) are often inconsistent, largely due to the use of diverse methodological approaches—most involving task-based fMRI—as well as variations in the selection of neural networks and regions of interest (ROIs) analyzed.
Nonetheless, multiple studies have reported that, compared to age-matched controls, children with dyslexia exhibit altered FC in reading-related networks, including the sensorimotor dorsal, frontoparietal, visual, and auditory networks [12]. These alterations typically involve increased connectivity in regions associated with cognitive control and decreased connectivity in language and subcortical regions. In adults, although the literature is limited, the few available studies [13] show patterns that are partially consistent with findings in children. These include both disruptions in networks critical for reading and the emergence of compensatory mechanisms, particularly in executive control systems such as the frontoparietal and salience networks.
Despite the growing body of research on dyslexia, a gap persists in the systematic synthesis of rs-fMRI findings specific to this population. To date, no comprehensive review has consolidated the heterogeneous methodologies and variable results reported across studies. The present review addresses this gap by systematically analyzing the most frequently reported neuropsychological and FC alterations in individuals with dyslexia compared to controls. By synthesizing extant evidence, this work aims to clarify dyslexic connectivity profiles and provide a foundation for future research and clinical translation.

2. Materials and Methods

2.1. Information Sources and Search Strategy

A systematic literature search was conducted using two electronic databases: PubMed and Scopus. The search encompassed studies published between 2015 and 2025, with the final search executed on 16 January 2025. The selection and reporting of studies followed the Preferred Reporting Items for Systematic Reviews and Meta-Analyses (PRISMA) guidelines (https://www.prisma-statement.org/; accessed 16 January 2025) [14]. This study was registered on Prospero 2025 (CRD420251024961).
Search strategies were developed using predefined Boolean operators and keywords relevant to dyslexia and functional connectivity. The full search strings used were as follows:
PubMed: (dyslexia [Title/Abstract] OR “Reading disorder” [Title/Abstract] OR “Reading disorders” [Title/Abstract] OR “Reading disability” [Title/Abstract] OR “Reading disabilities” [Title/Abstract] OR “Developmental reading disability” [Title/Abstract] OR “Developmental reading disabilities” [Title/Abstract] OR “Developmental reading disorder” [Title/Abstract] OR “Developmental reading disorders” [Title/Abstract] OR “developmental dyslexia” [Title/Abstract] OR “reading deficit” [Title/Abstract] OR “reading impairment” [Title/Abstract] OR “developmental language disorder” [Title/Abstract] OR “dyslexia reading” [Title/Abstract]) AND (“resting state” [Title/Abstract] OR “resting-state” [Title/Abstract] OR rs-fmri [Title/Abstract] OR “functional connectivity” [Title/Abstract] OR “resting state fMRI” [Title/Abstract] OR “functional brain connectivity” [Title/Abstract] OR “resting-state fMRI” [Title/Abstract] OR “magnetic resonance imaging” [Title/Abstract]).
Scopus: (TITLE-ABS-KEY (dyslexia OR “Reading disorder” OR “Reading disorders” OR “Reading disability” OR “Reading disabilities” OR “Developmental reading disability” OR “Developmental reading disabilities” OR “Developmental reading disorder” OR “Developmental reading disorders” OR “developmental dyslexia” OR “reading deficit” OR “reading impairment” OR “developmental language disorder” OR “dyslexia reading”) AND TITLE-ABS-KEY (“resting state” OR “resting-state” OR rs-fmri OR “functional connectivity” OR “resting state fMRI” OR “functional brain connectivity” OR “resting-state fMRI” OR “magnetic resonance imaging”)) AND PUBYEAR > 2014 AND PUBYEAR < 2026 AND (EXCLUDE (EXACTKEYWORD, “EEG”) OR EXCLUDE (EXACTKEYWORD, “Case Report”) OR EXCLUDE (EXACTKEYWORD, “Child”) OR EXCLUDE (EXACTKEYWORD, “Cerebrovascular Accident”) OR EXCLUDE (EXACTKEYWORD, “Glioma”) OR EXCLUDE (EXACTKEYWORD, “Brain Neoplasms”) OR EXCLUDE (EXACTKEYWORD, “Schizophrenia”) OR EXCLUDE (EXACTKEYWORD, “Disease Association”) OR EXCLUDE (EXACTKEYWORD, “Primary Progressive Aphasia”) OR EXCLUDE (EXACTKEYWORD, “Seizure”) OR LIMIT-TO (EXACTKEYWORD, “Controlled Study”) OR EXCLUDE (EXACTKEYWORD, “Alzheimer Disease”) OR EXCLUDE (EXACTKEYWORD, “Nonhuman”) OR EXCLUDE (EXACTKEYWORD, “Alzheimer’s Disease”) OR EXCLUDE (EXACTKEYWORD, “Dementia”) OR EXCLUDE (EXACTKEYWORD, “Parkinson Disease”)) AND (LIMIT-TO (SUBJAREA, “MEDI”) OR LIMIT-TO (SUBJAREA, “NEUR”) OR LIMIT-TO (SUBJAREA, “PSYC”)) AND (LIMIT-TO (DOCTYPE, “ar”)) AND (LIMIT-TO (LANGUAGE, “English”)) AND (LIMIT-TO (SRCTYPE, “j”)) AND (EXCLUDE (EXACTSRCTITLE, “Journal Of Alzheimer S Disease”) OR EXCLUDE (EXACTSRCTITLE, “Alzheimer S And Dementia”) OR EXCLUDE (EXACTSRCTITLE, “Frontiers In Oncology”) OR EXCLUDE (EXACTSRCTITLE, “Aphasiology”) OR EXCLUDE (EXACTSRCTITLE, “Epilepsia”) OR EXCLUDE (EXACTSRCTITLE, “Epilepsia Open”) OR EXCLUDE (EXACTSRCTITLE, “Current Alzheimer Research”) OR EXCLUDE (EXACTSRCTITLE, “Alzheimer’s And Dementia Diagnosis Assessment And Disease Monitoring”) OR EXCLUDE (EXACTSRCTITLE, “Parkinsonism And Related Disorders”) OR EXCLUDE (EXACTSRCTITLE, “Epilepsy Research”) OR EXCLUDE (EXACTSRCTITLE, “Epilepsy Currents”) OR EXCLUDE (EXACTSRCTITLE, “BMC Musculoskeletal Disorders”) OR EXCLUDE (EXACTSRCTITLE, “Autism Research”) OR EXCLUDE (EXACTSRCTITLE, “Stroke”) OR EXCLUDE (EXACTSRCTITLE, “Future Oncology”) OR EXCLUDE (EXACTSRCTITLE, “Multiple Sclerosis And Related Disorders”) OR EXCLUDE (EXACTSRCTITLE, “Cancers”) OR EXCLUDE (EXACTSRCTITLE, “Brain Injury”) OR EXCLUDE (EXACTSRCTITLE, “Amyotrophic Lateral Sclerosis And Frontotemporal Degeneration”) OR EXCLUDE (EXACTSRCTITLE, “Dementia And Geriatric Cognitive Disorders Extra”) OR EXCLUDE (EXACTSRCTITLE, “Cancer”) OR EXCLUDE (EXACTSRCTITLE, “Alzheimer’s Dementia The Journal Of The Alzheimer’s Association”) OR EXCLUDE (EXACTSRCTITLE, “Alzheimer’s And Dementia Translational Research And Clinical Interventions”)).

2.2. Selection Criteria

The review included original research articles published in peer-reviewed journals, written in English, and published within the last 10 years. Study selection was guided by the PICO (population, intervention, comparison, outcome) framework as the primary inclusion criterion. The population (P) encompassed individuals of any age diagnosed with dyslexia or reading disorders, excluding those with a history of brain injury or other neurological conditions. Intervention (I) referred to studies employing rs-fMRI to assess functional brain alterations associated with dyslexia. Comparison (C) required the inclusion of a control group composed of individuals with typical reading abilities for direct comparison with the dyslexic group. Outcome (O) involved the reporting of results either through group comparisons or through correlations between FC and demographic or neuropsychological variables.

2.3. Exclusion Criteria

The exclusion criteria for this review comprised articles classified as narrative reviews, systematic reviews, descriptive reviews, meta-analyses, case reports, expert opinions, and book chapters, as the focus was exclusively on original research. Studies not published in English were excluded to ensure consistency in data interpretation.
Research involving participants with reading disorders resulting from neurological or psychiatric comorbidities—such as stroke, traumatic brain injury, epilepsy, Alzheimer’s disease, dementia, or Parkinson’s disease—was excluded. Similarly, studies that included participants with reading disorders associated with other conditions, such as autism, aphasia, and mood disorders, or that focused on familial history or genetic alterations related to dyslexia (e.g., in neonates), were not considered. In addition, studies that did not include a comparison between individuals with dyslexia and typically developing readers were excluded.
Concerning the intervention, studies using imaging methodologies other than rs-fMRI—such as EEG, MEG, or fNIRS—were excluded. Studies employing analytical approaches outside the scope of conventional FC analysis, including those based solely on machine learning techniques, were also excluded. Furthermore, studies that analyzed resting-state conditions within task-based fMRI designs, as well as those focused on structural connectivity rather than FC, were not included.

2.4. Selection Process and Data Compilation

The selection process for the articles included in this systematic review was conducted by four authors (B.M., M.M.I.S., I.B. and M.Y.B.) using the Rayyan software (https://www.rayyan.ai/) [15]. Initially, duplicated references were automatically identified and removed. Subsequently, the titles and abstracts of the remaining studies were independently screened by the authors M.M.I.S., I.B., M.Y.B., and M.E.Y., working in randomly assigned pairs, in a blinded fashion, and according to predefined inclusion and exclusion criteria. In cases of disagreement between reviewers on the inclusion of any article, a third senior author (M.P.N. or K.L.) was consulted to resolve the conflict and reach a consensus. Articles deemed potentially eligible were retrieved in full text and reassessed by the entire team for final eligibility. The final selection was based on group consensus among all participating authors (B.M., M.M.I.S, I.B., M.Y.B., M.E.Y., K.L. and M.P.N.).
As part of the screening process, keyword-based filtering was applied to identify studies that met the eligibility criteria. Keywords were used to include relevant studies and exclude those that did not align with the review’s objectives. Additionally, studies were manually labeled and excluded based on methodological or thematic aspects that did not fit the scope of the review. This process ensured that only studies investigating resting-state functional connectivity (rs-FC) in dyslexia were included. This rigorous selection process ensured that only relevant studies investigating rs-FC in individuals with dyslexia were included in the final analysis.
The authors M.M.I.S., I.B., and M.E.Y. were responsible for extracting the demographic, clinical, and neuropsychological characteristics of volunteers and dyslexia patients, with verification by B.M. They also compiled the characteristics of functional brain imaging (a parameter of acquisition and data analysis) and their outcomes, checked by M.Y.B. All data were double checked by the senior authors K.L. and M.P.N.
The conceptualization of this systematic review was undertaken by B.M., K.L., and M.P.N. The authors M.M.I.S., I.B., B.M., M.Y.B., and M.E.Y. were responsible for conducting the review and analysis, while the preparation of the original draft was carried out by M.M.I.S. and I.B. The review and editing of the manuscript were undertaken by B.M., M.Y.B., K.L., and M.P.N. The overall supervision and management of this project were the responsibility of M.P.N. All of the authors contributed to the writing of the complete manuscript.

2.5. Data Collection

Two main topics were used to organize the data from the papers under review, and the corresponding information was presented in tables highlighting the following features. The demographic and neuropsychological domain, summarized in the first table, included the language and nationality assessed in each study, an essential aspect given that dyslexia manifestations may vary across languages, as well as detailed characteristics of the study population, such as sample size, age, sex, and years of education for both dyslexic and control participants. It also describes the neuropsychological tests used to assess intelligence, reading ability, and other cognitive domains to rule out comorbidities such as attention deficits, memory impairments, and motor or oculomotor coordination issues. The neuroimaging methodology domain, presented in the second table, detailed how rs-fMRI data were acquired and preprocessed, as well as the FC measures applied. It also reported the main findings regarding group differences and correlations with clinical and neuropsychological data, particularly those related to reading processes. This structured approach provides a comprehensive descriptive overview of the neural mechanisms underlying dyslexia, enabling better comparability and interpretation across studies.

2.6. Risk-of-Bias Assessment

The article selection process was conducted in pairs, with a third independent author responsible for determining their inclusion. The data presented in the tables were organized into the predefined groups by the authors, and their accuracy was validated by an independent group. The final inclusion of studies in the systematic review was decided through consensus among all reviewers.

2.7. Methodological Quality Assessment

The methodological quality of the included studies was assessed using the Newcastle–Ottawa Scale (NOS) [16], a widely adopted tool for evaluating the risk of bias in observational studies. The NOS evaluates three main domains: the selection of study groups, the comparability of groups, and the ascertainment of exposure (or outcome).
The selection domain considers the adequacy of case definitions, sample representativeness, the selection of control groups, and the clear exclusion of the target condition in controls. Comparability examines whether the study controlled for major confounding factors relevant to the research question, either through design or statistical analysis. The exposure section assesses the reliability of exposure measurements, the consistency of methods between cases and controls, and non-response rates.
Each study can receive a maximum score of 9 points, with high methodological quality defined as scores between 7 and 9, moderate quality between 4 and 6, and low quality between 0 and 3 points [17].
The NOS was independently applied by three reviewers (BM, IABV, and MYB). To evaluate the consistency between raters, the Cohen’s Kappa coefficient was calculated, ranging from 0 (no agreement) to 1 (perfect agreement) [18]. This was computed using R Statistical Software (v2021; https://www.r-project.org; accessed 1 May 2015) and the statistical package “irr” (v0.84.1; R Core Team 2019; https://www.r-project.org, accessed 1 May 2025) [19].

2.8. Data Analysis

The data presented in each table were analyzed using percentage values and range distributions to emphasize key characteristics, specific patterns, and notable exceptions according to their respective applications. Additionally, the results were categorized to highlight the most salient aspects within each context, providing an integrated overview of the systematic review through both quantitative and qualitative analyses.

3. Results

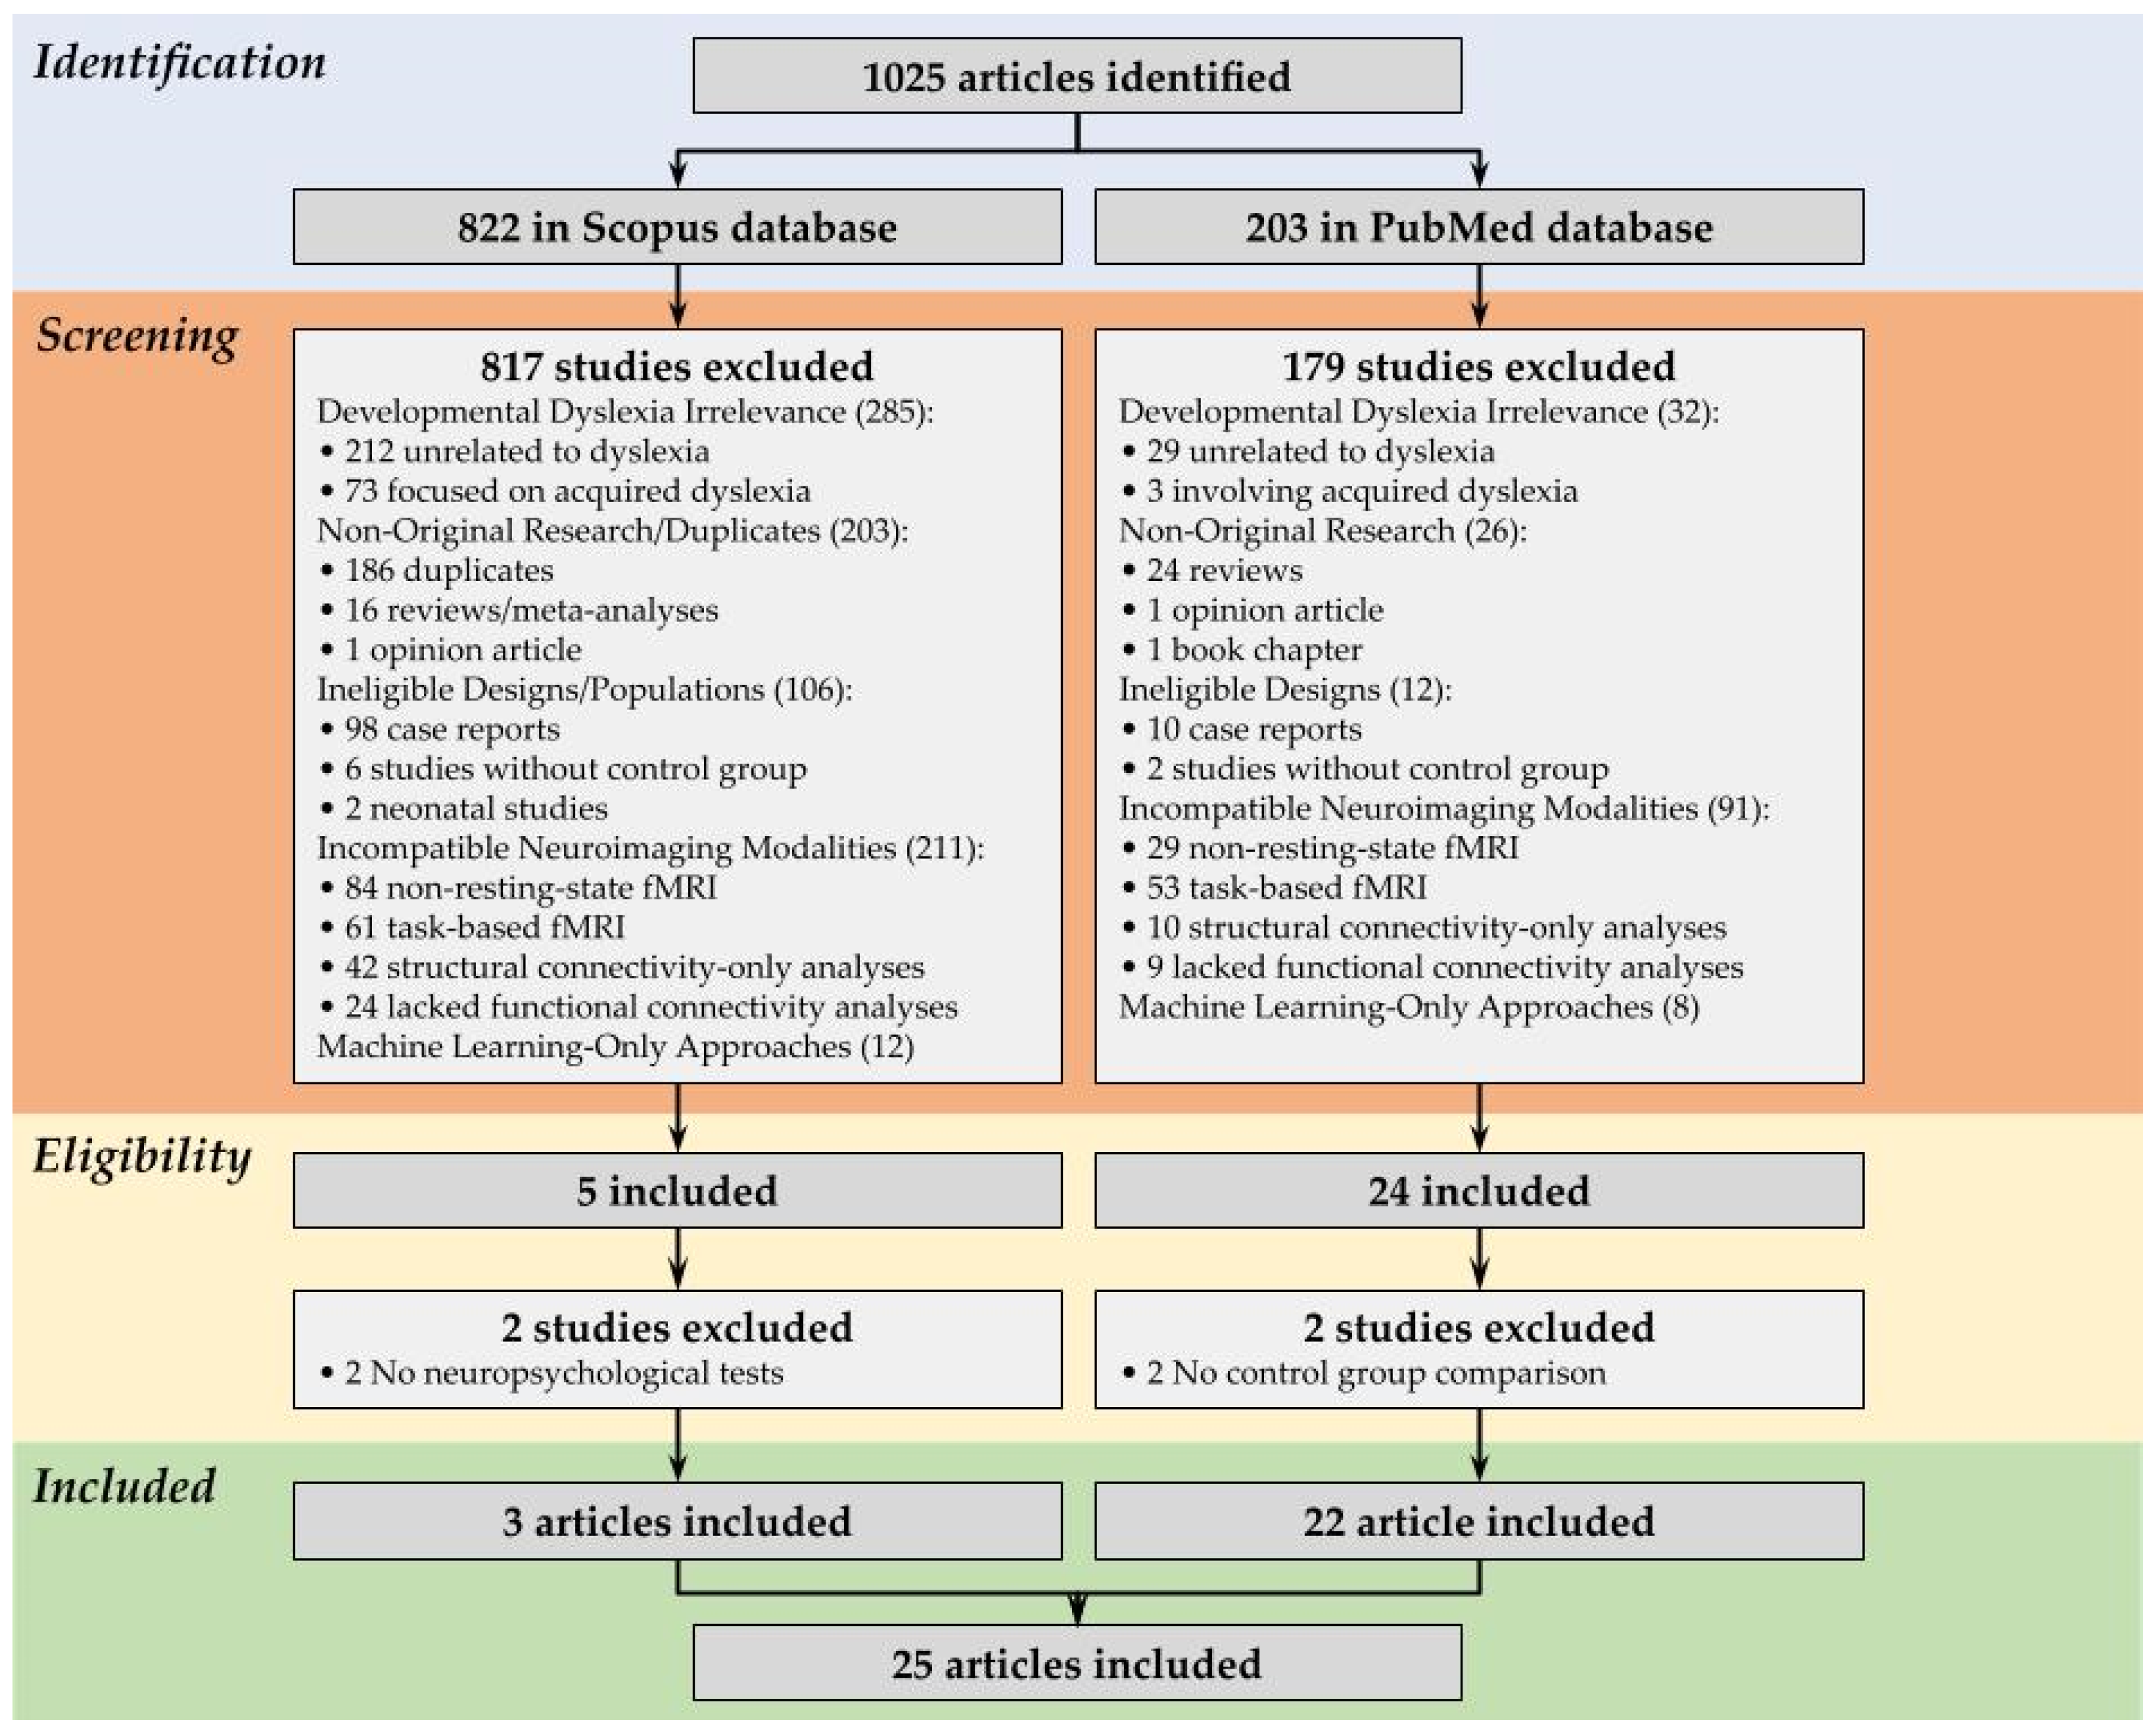
3.1. Study Selection

A total of 1025 references were imported from the selected databases. The majority of these references, 822 studies, were retrieved from Scopus, while 203 references were imported from PubMed, contributing to the final dataset used for screening and selection.
From the 822 articles identified in Scopus, 817 were excluded during screening. The primary reasons for exclusion were irrelevance to developmental dyslexia (285 studies, of which 212 did not address dyslexia and 73 focused on acquired dyslexia secondary to brain injury or neurological conditions); duplication or non-original research (203 studies, comprising 186 duplicates, 16 reviews/meta-analyses, and 1 opinion piece); ineligible study designs or populations (106 studies, including 98 case reports, 6 studies without a control group, and 2 neonatal studies); and incompatible neuroimaging modalities (211 studies, of which 84 used non-rs-fMRI techniques [e.g., EEG, MEG, or fNIRS], 61 employed task-based fMRI, 42 analyzed only structural connectivity, and 24 lacked FC analyses). An additional 12 studies were excluded for using machine learning-only approaches. After that, two articles were removed in the eligibility process because they did not report application of any neuropsychological tests; after exclusions, three articles met the inclusion criteria. Similarly, of the 203 articles retrieved from PubMed, 179 were excluded. These exclusions mirrored the Scopus criteria, with the largest categories being incompatible neuroimaging modalities (91 studies: 29 using non-rs-fMRI, 53 task-based fMRI, 10 structural connectivity-only, and 9 lacking FC analyses) and irrelevance to developmental dyslexia (32 studies: 29 not addressing dyslexia and 3 involving acquired dyslexia). Other exclusions included non-original research (24 reviews, 1 opinion article, 1 book chapter), ineligible designs (10 case reports, 2 studies without controls), and 8 machine learning-only studies. After that, 2 articles were removed in the eligibility process because they did not compare the control group with the dyslexics; after exclusions, 22 articles met the inclusion criteria. After completing the selection process and applying all exclusion criteria across both databases, only 25 full original articles were included in this systematic review. With all the exclusions from both databases, there were only 25 articles left [20,21,22,23,24,25,26,27,28,29,30,31,32,33,34,35,36,37,38,39,40,41,42,43,44], as illustrated in the PRISMA flowchart (Figure 1).

3.2. Methodological Quality Assessment Results

Three independent reviewers assessed the methodological quality of the included studies using the Newcastle–Ottawa Scale (NOS). Inter-rater agreement varied among the pairs: Rater 1 and Rater 2 agreed on 48% of the ratings (Cohen’s kappa = 0.329, p = 0.001), indicating fair agreement; Rater 1 and Rater 3 agreed on 36% (kappa = 0.206, p = 0.024); and Rater 2 and Rater 3 agreed on 64% (kappa = 0.545, p < 0.001), reflecting moderate agreement. To determine the final methodological quality rating for each study, a majority rule was applied: at least two raters had to agree on the rating for it to be accepted. Based on this process, of the 25 studies evaluated, 4 were classified as high methodological quality, 19 as moderate, and 2 as low quality according to the NOS criteria. This approach ensured that the final ratings reflected a consensus among the reviewers, thereby enhancing the reliability of the quality assessment (Figure 2).

3.3. Study Characteristics

3.3.1. Demographic Data

In the context of this systematic review, Table 1 serves as a key resource for understanding the demographic and neuropsychological characteristics of individuals with developmental dyslexia studied in rs-FC analysis. Given the variability of dyslexia across age groups and linguistic backgrounds, this table organizes the selected studies according to key demographic variables, allowing for a more nuanced understanding of the neurobiological aspects of the disorder. By categorizing participants into children and adults, the table enables the analysis of developmental differences and how the manifestations of dyslexia may change over time, highlighting potential age-related neural patterns and adaptations.
Moreover, including neuropsychological assessments highlights the range of cognitive functions examined in these studies, shedding light on how reading proficiency, phonological processing, and attention mechanisms may be linked to underlying connectivity differences.
Table 1 provides a list of the countries and languages represented in the dataset. English is the most frequently studied language, appearing in 14 of the selected studies (56.0%) [22,26,28,29,30,31,32,35,37,38,39,41,42,43]. German appears twice (8.0%) [33,44], while French [24], Turkish [21], Brazilian Portuguese [36], and Catalan [27] are represented only once (4.0% each). Additionally, Japanese is noted with both its syllabic Hiragana and logographic Kanji scripts (4.0%) [34]. If split into opaque and transparent languages (according to the phoneme–grapheme correspondence) [45], German, Turkish, Brazilian Portuguese, Catalan, and Japanese Hiragana (syllabic scripts are highly phonetic and transparent) are part of the transparent group, comprising 36% of the sample, and the opaque group consisting of English, Chinese, French, and Japanese Kanji are 64% of the sample. The literature shows that dyslexia diagnosis is easier in transparent languages because consistent letter–sound mapping allows for easier decoding of words, and difficulties related to dyslexia are more evident and not mistaken as reading errors or poor comprehension of irregularities in the language [46].
The United States (USA) appears most frequently, with 13 mentions (52.0%) [22,26,28,29,31,32,35,37,38,39,41,42], followed by China with 4 occurrences (16.0%) [20,23,25,40], while Canada [30,43] and Germany [33,44] each appear twice (8.0% each), and Turkey [21], Belgium [24], Brazil [36], Spain [27], and Japan are mentioned only once [34] (4.0% each), as shown in Table 1. In terms of language distribution, there is a strong research focus on English and studies conducted in the USA, with other languages and regions remaining comparatively underrepresented.
It is important to note that many studies use different nomenclatures when they are talking about dyslexia, such as “reading disorders”, “learning impairment”, “reading impairment” and other variations of the sort. In order to simplify understanding, we have placed all these terms under the umbrella of dyslexia. All studies contained a control group and a dyslexic group with some variations in regard to additional groups; we used abbreviations to simplify the table. There are a plethora of terms and abbreviations used to describe dyslexia, but all of the studies finalize the diagnostics as dyslexia once you evaluate the neuropsychological tests. For comprehension and clarity purposes, we chose the umbrella term dyslexia and the abbreviation DYS (dyslexia); for specific subgroups in specific studies, we have DYSe (dyslexics that receive special education), MD (mood disorders), and BD (behavior disorders). Specific subgroups represent a minority of the studies, accounting for only 8.0% (2 out of 25) [21,37], as shown in Table 1.
The number of participants in each study is often split between control and dyslexic groups, with variations in sample sizes across studies. The mean number of subjects is 26 controls and 25 DYS, with the biggest study with 65 controls and 55 DYS and the smallest with 9 controls and 10 DYS (Table 1). Most of the selected studies included both male and female subjects, with only one study exclusively involving male subjects. Notably, only three studies reported a majority of female participants with dyslexia.
Regarding the age of participants in the selected studies, the values ranged from children to young adults. To facilitate the analysis of the neuropsychological assessment tools employed, the content following Table 1 was organized into two groups: first, the selected studies involving children, followed by those involving adults. This structure allows for a clearer evaluation of the tools used, considering the necessary adaptations based on age. The majority of studies (92% (23 out of 25) focused on children, with ages ranging from pre-readers at 5 years old to pre-teens to 12 years old [20,21,22,23,24,25,26,27,28,29,30,31,32,33,34,35,36,37,38,39,40,41,42]. As commonly observed in the dyslexia literature, studies involving adults are less frequent. Among the selected studies, only two included adult participants [43,44], one reported on teens aged 17–18 years, and the other on young adults (21–22 years old). This inclusion reflects an emergence not only in understanding the patterns of functional brain connectivity associated with dyslexia but also in exploring age-related neuroplasticity across different developmental stages.
Considering the reading age, most of the selected studies did not report this information (Table 1). Only a few studies [20,21,25,27,33] classified participants according to literacy stages; for example, one longitudinal study divided its sample into two groups: “before literacy introduction” (BL) and “after literacy introduction” (AL). Similarly, information on years of education was absent in 92.0% (23/25) of the studies [20,21,22,23,24,26,27,28,29,30,31,32,34,35,36,37,38,39,40,41,42,43,44], which is expected given the predominant focus on children. However, some studies did specify educational background, reporting, for instance, prior exposure to dyslexia-focused instruction lasting 12–24 months or categorizing participants by school level, such as kindergarten, second grade, or 4th–6th grade.

3.3.2. Neuropsychological Tests for Dyslexia Evaluation

According to the diagnostic criteria, individuals with dyslexia must exhibit impaired reading performance while other cognitive domains remain intact. Furthermore, these deficits should not be attributable to other factors such as sensory impairments or inadequate education [22]. To confirm this, non-verbal intelligence tests are often employed to verify that the individual’s intellectual abilities are comparable to those of people without dyslexia. Differentiation between dyslexic and typical readers typically involves reading and/or phonological tests. Dyslexia is also highly comorbid with conditions such as ADHD, dyscalculia, and dyspraxia. As a result, assessments for attention, mathematical abilities, and motor skills are commonly included in the diagnostic process. It is important to note that most diagnostic tools are language-specific and require adaptations and validation tailored to the linguistic and cultural context of each country. Standardized assessments are frequently modified from their original versions to ensure they are appropriate for specific populations.
Intelligence tests were administered across the studies, employing diverse methodologies. The most frequently used test was the WISC (32.0%, 8/25) [20,21,24,26,27,32,34,39], in various editions (WISC-IV and WISC-III). The TONI was the second most common (28.0%, 7/25) [22,28,29,31,38,41,42], with TONI-III and IV being the versions applied. Other frequently used assessments included the WASI (20.0%, 5/25) [26,30,36,39,43]; verbal, nonverbal, and full-scale versions) and Raven’s Progressive Matrices (nonverbal; 16.0%, 4/25) [23,25,34,40]. Less common measures were the PPVT (11.1%, 3/25) [28,31,38] and the WPPSI (4.0%, 1/25) [33], with one study not employing an IQ test [37]. The predominance of nonverbal intelligence assessments (76.0%, 19/25) [22,23,25,26,28,29,30,31,33,34,35,38,40,41,42,43,44] suggests a methodological emphasis on evaluating cognitive abilities independent of language proficiency, since the verbal component of intelligence may be influenced by dyslexia’s core deficits.
Reading accuracy was assessed using a range of standardized measures. Word reading was evaluated in the majority of studies (92.0% 23/25) [20,21,22,24,25,26,27,28,29,30,31,32,33,34,35,36,37,38,39,41,42,43,44]; the most frequently used tests were the Test of Word Reading Efficiency (TOWRE) [3,7,9,10,11,12,13,16,22,23,24] and the Woodcock–Johnson (WJ) [22,26,28,29,31,32,35,37,38,39,44], each appearing in 44.0% (11/25) of the studies. The most common subtests of these two were the WJ Letter–Word Identification subtest [6,22,26,28,29,31,35,37,38,39,44] and the TOWRE Sight Word Efficiency subtest (8/11) [6,22,26,28,29,30,31,35,43]. The Chinese Character Recognition Test Battery (CRTB) was used in 8.0% (2/25) of studies [20,25], underscoring language-specific adaptations in word recognition assessment. Less frequently used tests included the Test of Adolescent and Adult Language (TALE-C) [27], the Test of Silent Reading Efficiency (TOSREC) [28], the Salzburger Lese- und Rechtschreibtest (SLRT-II) [33], the Word Reading Task (LPI) [36], the Word Identification Task [43], and the Standard Comprehension Test [34], each appearing in 4.0% (1/25) of the studies. Pseudoword reading accuracy was evaluated in a large portion of the studies (72.0%, 18/25) [22,24,26,27,28,29,30,31,32,35,36,37,38,39,41,42,43,44], with various standardized tests applied. The TOWRE was the most frequently used measure, appearing in 44.0% (11/25) [22,26,28,29,30,31,32,39,41,42,43], followed by the Word Attack subtest of WJ-III, which appeared in 32.0% of the studies (8/25) [26,28,29,35,37,38,39,43]. PROLEC-R Pseudowords [27], LPI Pseudoword Reading Task [36], and the Analytic Battery Nonwords [24] each appear in 1 paper (4.0%). The majority of studies reported significant group differences in word reading (78.26%, 18/23 total with word reading tests) and pseudoword (83.33%, 15/18 total with pseudoword reading tests) reading performance between dyslexic and control participants. These results are expected given the population being studied, and also are suggestive of the correct diagnosis of the dyslexic group.
More than half of the studies (48.0%, 12/25) report evaluating text reading accuracy [23,25,26,27,28,29,30,31,32,38,39,42,44]. Among those, the most frequently used measures were Woodcock–Johnson subtests (passage comprehension and reading fluency), employed in 20.0% (5/25) of the studies [28,29,30,31,39,44]. The second most common assessment was the Gray Oral Reading Test (GORT) (20.0%, 5/25) [26,29,32,39,42]; in some cases, both WJ and GORT were administered together [29,39]. Other tests included the Test of Silent Reading Efficiency (TOSREC) (8.0%, 2/25) [29,38] and the TALE-C text subtest (4.0%, 1/25) [27]. Additionally, unspecified reading fluency tests (8.0%, 2/25) and a paragraph reading task (4.0%, 1/25) were reported. The grand majority of papers who evaluated text reading (11/14, 84.6%) [23,25,27,28,29,30,31,32,39,42] reported significant group differences between dyslexics and controls in text reading assessments. These assessments focused on different aspects of reading, including fluency and comprehension, providing insights into how dyslexia affects text processing beyond single-word recognition and also ensuring a more naturalistic investigation of reading difficulties.
Tests aimed to measure phonemic awareness and sound manipulation were also applied. They are important for the development of reading skills as they enable individuals to identify and manipulate phonemes. Phonological processing was assessed 44.0% of the time (11/25) [22,23,28,29,31,34,37,38,40,41,44], with the Elision subtest from the Comprehensive Test of Phonological Processing (CTOPP) appearing in 24.0% (6/25) [22,28,29,31,37,38] of the studies. The Rapid Automatized Naming test (RAN) was included in a number of studies (44.0%, 11/25) [20,27,28,30,31,33,34,39,40,41,44], with a variation of the full application (Digits, Letters, Colors, and Shapes) or just one part of the test. Most applications showed significant differences between control and dyslexics performance in the task (63.64%, 7/11) [20,28,30,31,34,40,41,44].
Other domains were assessed, such as visual attention, motor skills, and memory, mostly as secondary measures to rule out other comorbidities. Language and attention assessments were included in a smaller portion of the studies. Language evaluations were only 4% of studies (1/25), featuring the Vocabulary Test (CRM) [23]. Similarly, attention assessments were conducted in 32% of the studies (8/25) [20,28,29,31,35,38,41,42]; the most common measure was Conners Comprehensive Behavior Rating Scales (CBRS) and its subtests (24% 6/25) [20,28,29,38,41,42]. After that, there were four articles (16%) that used the Test of Everyday Attention (TEA-Ch) [28,31,35,41], and there was also a individual case of Continuous Performance Test (CPT) [28]. Inhibition tasks, such as the Stroop test, were employed in 16.0% (4/25) [22,28,31,38,41] of studies, while parent/teacher-reported EF (BRIEF) and performance-based flexibility tests (D-KEFS, Wisconsin Card Sorting Test) each appeared in 12.0% (3/25) [28,31,35]. Memory was assessed in 32.0% (8/25) [27,28,31,33,34,35,38,39] of studies (the tests included Rey–Osterrieth Complex Figure, Children’s Memory Scale, WISC Digit Span), with working memory being the most common measure (20.0%, 5/25) [27,28,31,35,38].
The majority of studies evaluating executive functions (62.5%, 5/8) [27,28,31,35,38] reported significant differences in individuals with dyslexia, particularly in working memory (WISC Digit Span) and inhibition tasks (Stroop Test). These findings suggest that dyslexia involves core challenges in executive functioning beyond reading difficulties. Spelling assessments consistently showed group differences and memory measures produced mixed results. Notably, all studies using comprehensive behavioral ratings (BRIEF) found significant executive function impairments, supporting the view that dyslexia often co-occur with broader cognitive challenges.

3.4. Brain Functional Connectivity (rs-fMRI)

3.4.1. rs-fMRI Acquisition

Among the studies included in this review, approximately 93.7% acquired the rs-fMRI data using high-field MRI scanners (3 Tesla) [20,22,23,24,25,26,27,28,29,30,31,32,33,34,35,36,37,38,39,40,41,42,43], while only 6.2% used lower-field systems (1.5 Tesla) [21,44]. The predominant use of 3 T scanners reflects their clear advantages for rs-fMRI, such as a higher signal-to-noise ratio, enhanced spatial resolution, and greater sensitivity in detecting FC patterns. In contrast, although 1.5 T systems are more widely available and commonly used in clinical environments; they offer reduced sensitivity for research applications, requiring detailed functional brain mapping. Regarding scanner manufacturers, Philips was the most frequently reported among the 3 T studies (47.8% 11 out of 23) [22,28,29,31,34,35,37,38,41,42], followed by Siemens (43.4% 10 out of 23) [20,23,25,26,27,30,33,40,43] and GE (17.4%) [24,32,36,39], as shown in Table 2.
Notably, the two studies using 1.5 T scanner were conducted in different geographical and temporal contexts, suggesting that scanner availability and local infrastructure may influence in the selection of field strength. One study, conducted in Austria in 2014, used a Philips 1.5 T system [44], while the other, carried out in Turkey in 2024, employed a Siemens 1.5 T scanner [21] (Table 2). These cases highlight how technological evolution and resource availability over time and location can shape methodological choices in rs-fMRI research.
In terms of imaging sequences, the echo-planar imaging (EPI) sequence was used in 80% (20 out of 25) of studies [20,22,23,24,25,26,27,28,31,32,34,36,37,38,39,40,41,42,43,44], while 20% (5 out of 25) [21,29,30,33,35] reported the use of T2*-weighted sequences (Table 2). Despite being listed separately, EPI sequences are typically based on T2* contrast, which is essential for capturing the BOLD signal in functional imaging. The EPI is a fast pulse sequence that allows for whole-brain image acquisition in a matter of seconds, making it ideal for fMRI studies as it can rapidly detect subtle BOLD signal changes related to neural activity. This suggests methodological equivalence in most cases, even when sequence naming varied.
Regarding the acquisition parameters of rs-fMRI, the repetition time (TR) was predominantly set around 2000 ms, with 76.0% (19 out of 25) [20,22,23,25,26,27,31,32,33,34,35,36,37,38,39,40,41,42,43] of studies using this or a closely related value. A smaller proportion of the selected studies (16.0%) reported TR values equal to or less than 1000 ms [24,28,29,30], and two studies chose values bigger than 2000 ms [21,44]. The echo time (TE) was generally close to 30 ms, although a few studies employed slightly higher values. The combination of a TR around 2000 ms and a TE near 30 ms reflects commonly accepted parameters in rs-fMRI protocols aimed at optimizing BOLD sensitivity, indicating a notable degree of methodological consistency across studies, as shown in Table 2.
The number of slices required to acquire a full brain volume is directly related to the slice thickness, as thinner slices demand a greater number to ensure complete anatomical coverage, as reported in all the selected studies. However, only 64% (16 out of 25) [20,21,22,23,24,25,26,27,29,30,34,36,39,40,43,44] of them reported the slice numbers used (Table 2), which ranged from 25 to 140, and the slice thickness, which varied from 2 to 5 mm. Among these, most studies (8/25) used between 25 and 40 slices with a thickness of 3 to 4 mm [20,21,25,27,34,36,40,44], while others (7/25) used between 48 and 64 slices with thinner slices ranging from 2 to 3 mm [22,23,24,26,29,30,43]. Curiously, one study (1/25) used 140 slices with 3.5 mm [39], likely aiming to cover more than the entire brain.
Another important parameter influencing spatial resolution is the field of view (FOV), which was reported in 64% of the studies (16 out of 25) and ranged from 192 to 240 mm. The most frequently used FOV was 192 mm (16% 4 out of 25) [21,23,25,33], followed by 220 [24,26,36,44] and 240 mm [27,32,34,39] (each with 16%). Intermediate values, such as 200 mm [40], 210 mm [30], 211 mm [26], and 224 mm [20], were less commonly reported. Notably, 44% of studies did not report FOV values, once again emphasizing inconsistencies in methodological reporting that may affect reproducibility and hinder meaningful comparisons across studies.
The number of volumes acquired also varied considerably across studies, ranging from 75 to 857 volumes. This corresponds to acquisition times between approximately 2.5 and 10.2 min, depending on the repetition time (TR) used. In general, a higher number of volumes increases the total temporal resolution and enhances the statistical robustness of the analysis. For this reason, some studies (16%) opted to acquire multiple shorter runs and later concatenate the sequences during analysis [22,23,26,33]. Nevertheless, most of studies (32%, 8/25) preferred intermediate acquisition times ranging from 6 to 9 min (approximately 180 to 300 volumes) [24,25,27,32,36,39,40,43]. Others (24% 6/25) adopted longer single runs, typically around 10 min in duration and comprising more than 300 volumes [28,29,30,31,35,38], while a subset of 24% (6/25) employed shorter protocols lasting less than 5.5 min, acquiring between 75 and 165 volumes [21,34,37,41,42,44].
The condition under which rs-fMRI is acquired, such as eyes open, closed, or fixated, can significantly influence brain activity patterns and must be considered when interpreting FC results [47]. Most studies (44% 11/25) instructed participants to remain awake while looking at a fixation cross; one of these studies instructs the participants to let their minds wander, a widely adopted approach to minimize eye movements and maintain alertness [29,30,31,35,36,37,38,39,41,42,43]. Other studies (24% 6/25) instructed participants to stay awake with their eyes closed or simply to keep their eyes closed, not thinking about anything [20,22,23,24,25,26], while 12% (3/25) used the condition “awake with eyes open” [21,34,44]. Only one study (4%) explicitly instructed participants to remain motionless and avoid thinking [40]. Notably, 16% (4/25) of the studies did not report the specific resting-state condition, highlighting a gap in methodological transparency that may affect data interpretation and reproducibility [27,28,32,33].

3.4.2. rs-fMRI Processing

Among the included studies, 56% (14/25) used the CONN toolbox software for rs-fMRI data processing, with versions ranging from 13 to 18 [26,27,28,29,30,31,32,35,37,38,39,41,42,43,44]. Earlier versions were typically associated with SPM8, while more recent ones were used in conjunction with SPM12. In 8% of the studies, other pipelines were used, including FSL (with one specifying the MELODIC tool) [21,33], SPM (version 8 or 12) combined with the GIFT toolbox [42], or AFNI (in one case, version 17.2.17) [36]. Additionally, DPABI (version 4.5 and 5.1) or DPARSF were employed for preprocessing only [20,23,34,40], also representing 8% of each. Other tools, such as BrainVoyager [24], and Dynamic BC Toolbox [23], were rarely mentioned (4%) and only one study (4%) did not mention the software used [22].
rs-fMRI preprocessing includes volume realignment, co-registration with the T1 image, atlas-based segmentation, normalization, smoothing, and noise removal. While these steps are generally standardized across software platforms, the denoising stage represents a key source of methodological variability. Studies adopted a range of thresholds to identify motion artifacts and BOLD signal fluctuations, in addition to applying temporal band-pass and spatial filters. A conservative setting was used in 32% of studies [27,30,32,33,34,38,39,44], defining outlines as volumes with framewise displacement (FD) > 0.5 mm or BOLD signal change (BSC) > 3 standard deviations (SD). Liberal thresholds (FD > 2 mm and BSC > 9 SD) were used in 20% of studies [20,21,23,25,26,37,41], while 8% applied intermediate values (e.g., FD > 0.9 mm and BSC > 5 SD) [36,43]. Notably, 28% of the studies did not report denoising criteria [22,24,28,29,31,35,40], and one study (4%) employed independent component analysis (ICA) for noise removal [42].
The most frequently used high-pass filter for temporal filtering was 0.1 Hz (32.0%) [23,26,32,33,34,36,39,43,44], followed by 0.2 Hz (24%) [28,31,35,37,38,41], 0.08 Hz (16.0%) [20,22,25,40], and 0.09 Hz (12.0%) [29,30,44]. These values indicate a general preference for low-frequency filtering around 0.1 Hz, in line with standard recommendations for rs-fMRI preprocessing.
Regarding spatial smoothing, most studies (44%) applied full width at half maximum (FWHM) of 8 mm [26,27,29,32,35,37,38,41,42,43,44], followed by 6 mm (28%) [20,22,25,33,34,36,39], 5 mm (12%) [23,24,30], and 4 mm (8%) [23,40]. In 8% of studies, smoothing parameters were not specified [28,31]. These findings reflect a general preference for moderate to high smoothing.
The most commonly used method for assessing FC among the selected studies (52% [48] 13 out of 25) was the univariate seed-to-voxel approach [24,26,27,29,30,31,34,36,39,40,43,44], which explores the correlation between a predefined seed region and all other voxels in the brain. This was followed by the bivariate ROI-to-ROI analysis (36% 9/25) [20,22,23,25,33,35,37,38,41,43], which examines connectivity between pairs of ROIs. Independent component analysis (ICA) was applied in 12% of the studies [21,28,42], while multivariate graph theory approaches were used in 8% [31,37], and 4% employed multi-voxel pattern analysis (MVPA) [27], as shown in Table 2.
Seeds and ROIs were defined based on brain segmentation using various anatomical atlases. The most commonly used reference (92.0% 23 out of 25) was the MNI (Montreal Neurological Institute) template [20,21,23,24,25,26,27,28,29,30,32,33,34,35,36,37,38,39,40,41,42,43,44]. Both the Harvard–Oxford atlas (including its use via FSL) and the WFU PickAtlas were used in 20% (5/25) of the studies [27,29,31,35,37]. Less frequently used atlases included Talairach [22], AAL (Automated Anatomical Labeling) [26], Glasser [33], Juelich Histological [39], and Haskins Pediatric Atlases [36], each reported once, in approximately 4% of the studies.
Among the selected studies, ROIs were selected from anatomical or functional atlases or derived from functional brain networks of interest, serving as seeds in seed-to-voxel analyses or as target regions in ROI-to-ROI analyses. Based on this, ROIs were grouped according to their representative functional networks. Many studies investigated more than one network, so to better represent the findings, we categorized the results into 10 functional networks: the dorsal attention network (DAN) was the most frequently examined (52%) [21,22,23,29,30,33,34,35,36,38,42,43], followed by the frontoparietal network (FPN, 44%) [20,21,22,29,30,32,35,41,42], and the visual (VIS, 36%) [20,22,23,24,25,26,34,42,44]. The cingulo-opercular network (CON) [22,29,30,32,35,37,41] and the sensorimotor network (SMN) were investigated in 28% of studies [20,21,22,23,30,42]. FPN and CON are often considered components of the executive control network. Additionally, 24% of studies analyzed the salience network (SAL) [22,26,28,31,39,43] and 20% examined the auditory network [20,22,33,40,42,44] or ventral attention network (VAN) [21,22,29,35,42]. The default mode network (DMN) appeared in 12% of the studies [21,22,27,43], while the language network was explored in 8% [22,44].

3.4.3. rs-fMRI Outcomes

The outcomes were analyzed through comparisons of FC between groups and by examining correlations between connectivity results and clinical data (including demographic and neuropsychological measures). In the analysis of group comparisons regarding FC in the selected articles, we observed that 28% (7/25) of the studies reported both an increase and a decrease in FC in the dyslexia group compared to controls [20,21,27,31,32,42,44]. In contrast, 24% (6/25) of the studies reported only a reduction in FC [24,33,35,36,38,40], while only 12% (3/25) reported an increase [23,26,39]. Thus, the most frequent pattern in the dyslexia group was a decrease in FC compared to controls, especially among children, who accounted for 92% of these results.
Among the studies on adults, only two were included [43,44], and only one of them showed significant results for investigating the issue of neuroplasticity in young adults [44]. Interestingly, this study was among those that reported both an increase and a decrease in FC in the dyslexia group.
Additionally, 20% of the studies found no significant differences between groups [29,34,37,41,43], while 16% did not report or explicitly mention this information [22,25,28,30].
When analyzing the anatomical distribution of FC findings, we observed that, in dyslexia, alterations predominantly occur in ipsilateral connections (60%) [20,21,23,24,26,27,31,32,33,35,36,38,39,40,44]. Among these, 40% were located in the left hemisphere [20,21,23,24,32,33,35,36,38,39,40,44], with a higher concentration of FC reductions, while 20% were in the right hemisphere, where increased FC was more prevalent [21,24,26,27,31]. Only 16% of the studies also identified contralateral changes, involving interhemispheric communication [20,23,31,44].
Interestingly, 32% of the ipsilateral results were concentrated in the posterior region of the brain [20,21,23,33,35,36,42,44], while only 16% reported changes in connections between anterior and posterior regions, particularly along the frontoparietal pathway, where increased FC was more frequent in individuals with dyslexia [20,23,32,39]. These findings suggest that, especially in children with dyslexia, FC alterations predominantly occur in ipsilateral connections within the left hemisphere, showing a pattern of decreased connectivity, particularly in posterior brain regions.
Outcomes related to the correlation analysis between FC results and neuropsychological data were reported in 80% of the studies. Among these, 64% used reading fluency tests [22,23,24,25,28,30,31,32,34,37,39,40,41,42,43,44], 12% employed mood or emotional assessments [26,31,37], 8% included phonological awareness tasks [23,37], and smaller proportions used writing measures, RAN, and specific tests (4% each) [23,24,30,32]. However, most studies (32%) conducted the correlation analysis including both groups [22,23,24,30,31,39,40,42]. Another 12% performed the analysis based on connectivity differences between groups [34,42,43], with a focus on greater connectivity in controls compared to individuals with dyslexia, while 8% analyzed only the control group [25,34]. Additionally, 4% of the studies did not clearly specify how the analysis was conducted [44]. In the target population, participants with dyslexia, only 24% reported this correlation, which would be essential for a better understanding of how the altered connectivity patterns in this group relate to neuropsychological data [22,28,32,37,41,43].
When evaluating the descriptions of correlations in the dyslexic group, it was observed that improvements in reading fluency were associated with increased connectivity between various regions, including connections between lateral sensorimotor areas and visual regions [22] of the SAL [28], between areas of the SAL and frontal regions of the executive function network, as well as between bilateral regions related to cognition [28]. Connectivity between the left inferior parietal lobule (IPL) and the posterior cingulate cortex (PCC) was also reported [32]. However, these descriptions are relatively vague and do not allow us to conclude that these networks are specifically linked to the classical reading circuitry. Only one study clearly highlighted increased connectivity in posterior regions of the left hemisphere. Negative correlations were observed between improvements in reading fluency and decreased FC in several networks, including the FPN [37], the CON [41], subcortical regions, areas related to language, the primary visual cortex (V1) [28], as well as between the supramarginal gyrus (SMG) and angular gyrus (AG) [43]. Although these areas are not directly part of the classical reading network, they are functionally linked to executive function, language and SAL, suggesting that broader cognitive mechanisms may influence reading performance in individuals with dyslexia.

4. Discussion

This systematic review demonstrated that the majority of dyslexia studies assessing brain FC using rs-fMRI focused on children (92%), highlighting a significant gap in the literature regarding adults with dyslexia. This limits our understanding of brain maturation processes and neuroplasticity across the lifespan. Regarding FC findings, the results revealed that alterations predominantly occurred in ipsilateral connections (60%), with a particular emphasis on the left hemisphere (40%), where reductions in connectivity were most frequent, especially in posterior regions. This pattern is consistent with neurobiological hypotheses of dyslexia that point to dysfunctions in the phonological route and visuo-phonological integration [49]. In contrast, increased connectivity was observed in the right hemisphere (20%), possibly reflecting compensatory mechanisms.
A relevant aspect observed in this review was the predominance of studies conducted in English-speaking countries, with 52% carried out in the United States. This geographical and linguistic concentration may introduce a significant bias in the literature, limiting the generalizability of findings to populations from other regions. However, a recent bibliometric analysis identified 9166 publications on dyslexia between 2000 and 2021, indexed in the SSCI and SCI-E databases, highlighting that the United States, the United Kingdom, and Germany were the three most productive countries, while China, Israel, and Japan led dyslexia-related publications in the Asian context. Moreover, the University of Oxford stood out as the institution with the highest number of publications and the highest h-index in the field of dyslexia [50].
Additionally, a predominance of studies conducted in opaque languages (such as English and Chinese) was noted, accounting for 64% of the included articles. These languages feature more complex and irregular phoneme–grapheme correspondence rules, which tend to intensify the symptoms of dyslexia [51]. In contrast, in transparent languages such as Italian, Spanish, and Portuguese, where the correspondence between letters and sounds is more regular, individuals with dyslexia typically exhibit difficulties more related to reading speed than accuracy. This difference may reflect distinct phenotypic profiles of dyslexia [52]. Therefore, the predominance of studies in opaque languages may overestimate or distort specific characteristics of dyslexia that do not manifest in the same way in more transparent linguistic contexts.
This geolinguistic asymmetry highlights the need to promote greater diversity in sample populations and linguistic contexts analyzed, in order to enhance the representativeness of neurofunctional findings and advance the global understanding of dyslexia.
In demographic terms, there was a predominance of samples composed of male participants, reflecting the higher prevalence of dyslexia among males. Dyslexia is a condition known to exhibit gender differences, with a greater incidence in males [6], a pattern that was generally mirrored in the selected studies. Additionally, sample sizes varied considerably across studies and were generally modest, an aspect that may limit the statistical power and robustness of the FC analyses.
Interestingly, among the studies included in this review, only two investigated adults with developmental dyslexia, and one of them included exclusively male participants [44]. This limited representation highlights a critical gap in the literature and underscores the importance of understanding how the adult brain adapts to dyslexia over time, particularly considering the long-term effects on educational attainment, professional opportunities, occupational trajectory, and socioeconomic independence. Such insights are particularly relevant for individuals who carry significant family responsibilities, such as heads of household. One study explicitly reported that socioeconomic status plays a significant role in access to dyslexia diagnosis, and in shaping educational and employment experiences during adulthood [53]. These findings emphasize the need to examine dyslexia not only through a neurobiological lens but also considering contextual and socioeconomic factors that may modulate outcomes in adult populations.
As is often the case in the literature, the majority of functional neuroimaging studies in dyslexia focus on children, with adult data being markedly scarce, a limitation also reflected in this review [11]. Regarding children, findings are often inconsistent, largely due to methodological variability in functional connectivity analysis, including differences in the networks and regions of interest (ROIs). Nevertheless, multiple studies [20,21,22,23,24,25,26,27,28,29,30,31,32,33,34,35,36,37,38,39,40,41,42] report that dyslexic children, compared to age-matched controls, exhibit altered functional connectivity in reading-related networks, such as the dorsal sensorimotor, frontoparietal, visual, and auditory networks, often showing increased connectivity in cognitive control regions and decreased connectivity in core language and subcortical areas. In adults, few studies are available [43,44] for comparison, which makes any generalizability difficult; the limited findings for adults generally align with those from pediatric populations, revealing abnormal connectivity patterns within reading networks, as well as the compensatory recruitment of executive control networks, such as the frontoparietal and salience networks. However, due to a significant gap in adult representation, the only conclusion plausible at this point is about the urgent need for more functional studies to clarify the developmental trajectory and long-term neural adaptations associated with dyslexia.
It is important to recognize that most neuropsychological diagnostic tools are inherently language specific and require rigorous adaptation and validation to align with the linguistic and cultural context of each population [54]. The heterogeneity of instruments observed across the included studies reflects this necessity, particularly in cross-cultural neuropsychology, where constructs such as “phonological awareness” manifest differently depending on the language’s orthographic transparency. For instance, pseudoword reading tasks like the TOWRE are widely used and valid for assessing phonological deficits in opaque languages such as English, but they show limited discriminative power when applied to logographic languages like Chinese. In such cases, tools like the Chinese Reading Test Battery (CRTB), which emphasizes character recognition, are more ecologically valid [55].
In the present review, the neuropsychological tests analyzed were those reported in each included study to assess dyslexia and to identify the presence or absence of relevant comorbidities, such as ADHD, dyscalculia, and dyspraxia. This justified our decision to review and describe these instruments, given their role in characterizing participant profiles and controlling for overlapping cognitive impairments. Consequently, the diversity of tests reflects not only linguistic differences but also variations in the scope of neuropsychological screening conducted across studies. It was therefore relevant to evaluate how each study assessed key cognitive domains related to the reading process and its associated functions.
Although this variability poses challenges for direct comparisons of cognitive impairments within dyslexia across studies, it does not necessarily compromise the synthesis of findings. Some studies have shown that core deficits in dyslexia, such as impairments in phonological processing and rapid automatized naming, can be reliably identified using appropriately adapted tools [56]. Nonetheless, we acknowledge that due to the lack of cross-cultural protocols for dyslexia assessment, the account for nuances of the interaction between the development and reading acquisition in different linguistic contexts and must be considered when interpreting cross-study patterns and drawing generalizable conclusions. A critical evaluation of test validity and cultural applicability is therefore essential in future reviews and meta-analyses.
Regarding the FC findings, most studies used high-field MRI scanners (3T), which represent an important methodological advantage. The increased magnetic field strength improves the signal-to-noise ratio (SNR), allowing for a more precise detection of spontaneous brain activity fluctuations during rest [57]. Additionally, higher spatial resolution (with slice thicknesses under 3 mm) [24,25,27,43] and temporal resolution (TR < 2000 ms) [23,25,27,29,30,31,43] enable a more detailed identification of neural networks, including small and deep brain regions. This combination enhances the robustness and reproducibility of the findings, increasing the reliability of FC pattern interpretations and aligning with the conservative parameters adopted in most studies during data processing.
In addition to the methodological heterogeneity in analytical approaches, this review also revealed substantial variability in imaging acquisition protocols across the included studies, which may influence reproducibility and the comparability of findings. Although most studies reported basic acquisition parameters, only a portion provided full details regarding head motion thresholds, scan duration, and participant instructions. Notably, most studies adhered to recommended standards for resting-state fMRI acquisition, employing total scan times exceeding six minutes, a critical threshold to ensure reliable functional connectivity estimates [48]. Some studies adopted a strategy of performing multiple shorter acquisitions, later concatenated into a single sequence, to improve data quality and minimize motion artifacts. In line with established guidelines, the majority of studies instructed participants to keep their eyes open with visual fixation (typically on a crosshair), while others used eyes closed or eyes open without fixation protocols, which can differentially impact baseline network activity [58]. Temporal resolutions of 2 s or less were also commonly applied, aligning with best practices for capturing dynamic fluctuations in brain activity during resting state [48].
In terms of preprocessing procedures, we observed additional heterogeneity. To better interpret this, we classified the denoising strategies used by the studies as conservative (32%), intermediate (8%), or liberal (20%), based on the presence and extent of motion correction, physiological noise removal, and filtering methods. These differences in preprocessing pipelines can significantly affect functional connectivity results and should be more consistently reported in future studies to support replication and synthesis. We recommend the adoption of standardized reporting practices, such as those proposed by recent neuroimaging guidelines, to enhance transparency and comparability in this growing field [47].
All connectivity methods applied in the analyzed studies were based on traditional static FC approaches, with the exception of one study that employed effective connectivity analysis [20]. Regarding the statistical approaches, most studies used bivariate methods such as seed-to-voxel, ROI-to-ROI, and Granger causality analysis, which assess the relationship between pairs of brain regions. Notably, the predominance of seed-to-voxel studies [24,26,27,29,30,31,34,36,39,40,43,44] reflects the exploratory nature of this research, given the lack of clarity and consistencies regarding which neural networks are functionally altered in dyslexia. Less frequently, multivariate methods such as graph theory, independent component analysis (ICA), and multi-voxel pattern analysis (MVPA) were used, allowing for the examination of more complex spatial patterns and simultaneous interactions across multiple brain regions [59,60].
The neural networks DAN, FPN, CON, SMN, and SAL were frequently reported as ROIs in the selected studies, despite not being part of the classical reading circuit. The VIS network, which is directly involved in word and letter recognition, was also widely reported. These networks play fundamental roles in modulating auxiliary cognitive processes that are essential for fluent and effective reading: the DAN is associated with visual and spatial attention; the FPN with executive control, decision making, and working memory; the SAL with salience detection and the prioritization of relevant linguistic information; the CON with sustained attention and error monitoring; and the SMN with motor coordination and sensorimotor/visual integration [61].
Importantly, this interaction among these networks has led to their functional classification into three main hubs, which integrate information across distinct neural systems, despite occupying different structural positions and engaging differently depending on the task. The first, referred to as the ’default-control connector hub’, involves the FPN, DMN, and contextual association networks (CANs). The second, known as the ’cross-control connector hub’, is composed of the CON, DAN, and FPN networks, mediating the transition between internal and external attention. The third, the ’processing-control connector hub’, integrates sensory and motor networks (VIS, auditory, and somatomotor) with CON and DAN, coordinating sensory and motor processing with attention and control [62].
In addition to these frequently reported networks, other systems that are equally important for reading, either directly or in a complementary manner, were also reported, although less consistently across studies. These include the auditory network, essential for phonological processing; VAN, involved in the reorientation of attention to unexpected stimuli; DMN, which may interact with attentional systems during reading; and the language network, classically associated with phonological and semantic processing [61]. In individuals with dyslexia, altered FC within these networks may reflect either compensatory mechanisms or additional dysfunctions that negatively affect reading performance [13].
A consistent finding across studies was a widespread pattern of decreased FC, particularly in the left and posterior regions of the brain, areas typically implicated in reading-related processes. The most frequently reported regions with reduced activity included the left MTG, inferior frontal gyrus (IFG) (especially the pars triangularis), frontopolar cortex, and ACC. Additional reductions were observed in limbic and temporal structures such as the amygdala, hippocampus, MTG, ITG, and STG. In the parietal lobe, decreased signal was consistently found in the precuneus, angular gyrus, and SMG, indicating potential disruptions in attentional control and sensory integration.
At the network level, hypoconnectivity was reported in key systems involved in cognitive control and self-regulation, including the FPN, DMN, and CON. Reductions were also observed in visual processing areas such as the calcarine cortex, occipital lobe, and the VWFA, reinforcing the notion that visual decoding is impaired in dyslexia [63]. These findings align with evidence showing that dyslexia is marked by a disruption in posterior left-hemispheric networks during phonological processing [64], and that the development of visual tuning for print, especially within the inferior occipitotemporal regions, is delayed in children with dyslexia [65]. Together, this widespread hypoconnectivity across cognitive, sensory, and language-related networks underscores the multifactorial nature of reading difficulties in dyslexia.
In contrast, increased FC was reported less frequently and appeared more regionally specific. Notable examples included connections between the cuneus and the IFG, as well as between the right anterior insula (vAI) and subcortical structures such as the amygdala, thalamus, hypothalamus, and brainstem. These findings may reflect the brain’s attempt to recruit alternative circuits to compensate for deficits in regions traditionally involved in reading, such as the visual word form area (VWFA), superior temporal gyrus (STG), and inferior parietal lobule (IPL) [63]. Increased connectivity with frontal regions may also indicate the greater engagement of executive control and attentional systems in response to difficulties with automated phonological decoding [66,67]. The bilateral amygdala showed increased connectivity with the middle frontal gyrus (MFG) and the right temporal pole (TP), suggesting the recruitment of emotional and subcortical networks. This pattern may be linked to greater emotional load during reading, potentially reflecting anxiety, frustration, or heightened attentional vigilance in response to the task [68]. Additional increases in connectivity were observed involving the medial prefrontal cortex (MPFC), DMN, precuneus, and the left fusiform gyrus (FFG). Specifically, increased connectivity in the left fusiform region may represent an effort to enhance VWFA activation, which is critical for visual word recognition. The recruitment of these other regions, although atypical, may serve as alternative support mechanisms for reading processes in children and adults with dyslexia.
Correlations between FC and reading skills were the most frequently reported outcomes in the selected studies, highlighting the relevance of reading performance in understanding the neural patterns associated with dyslexia. Positive correlations were predominantly found in regions such as the left IPL, superior medial gyrus (SMd), medial prefrontal cortex (mPFC), as well as the inferior temporal gyrus (ITG) and superior temporal gyrus (STG). These areas are involved in grapheme–phoneme conversion, cognitive control, and phonological and semantic processing [69]. The findings suggest that stronger connectivity in these regions may reflect effective compensatory strategies in individuals with better reading performance.
In contrast, negative correlations were reported less frequently, involving primarily the CON, left IFG, left SPL, and the superior and middle frontal gyri (SFG and MFG). In these cases, increased connectivity was associated with poorer reading performance, possibly indicating excessive cognitive effort, attentional overload, or atypical recruitment of regions that would typically support more automatic reading processes. These findings align with evidence of functional disruptions in specific regions among dyslexic individuals, such as the posterior left middle temporal gyrus (post-LMTG), which although often overlooked in studies involving typical readers has been consistently found to be hypoactive in dyslexic readers and responsive to intervention [70].

Limitations

One of the challenges identified in this systematic review was the wide variability in terminology used to refer to dyslexia, such as ’reading disorder’, ’reading disability’, ’learning impairment’, among other variations. This terminological inconsistency can negatively impact the identification and selection of relevant studies, compromising the comprehensiveness and accuracy of systematic reviews and hindering clear comparative analysis across different studies. In addition, substantial variability was also observed in the methodologies used to assess FC, as well as in the selection of neural networks and ROIs, many of which were not directly related to the reading process. These inconsistencies further complicate the integration and interpretation of findings across studies, limiting the development of a coherent neurobiological model of dyslexia.
Another relevant limitation was the frequent absence of detailed information regarding participants’ educational background or reading age. Although most studies used neuropsychological assessments adjusted for age and/or schooling, only a few explicitly reported these variables [20,21,25,27,33]. For instance, the two studies involving adults with dyslexia did not clarify whether participants had completed compulsory education, which is critical for interpreting long-term compensatory mechanisms. Given that reading experience and educational attainment significantly influence brain plasticity, the omission of such data weakens the developmental interpretation of rs-FC alterations and highlights the need for more comprehensive and standardized reporting in future studies.

5. Conclusions

This systematic review revealed a predominance of studies involving children, highlighting functional hypoconnectivity in posterior regions of the left hemisphere in dyslexia, consistent with phonological pathway deficits. Increases in connectivity were less frequent and possibly compensatory. Networks such as DAN, FPN, CON, and VIS were frequently involved, indicating the importance of auxiliary processes like attention and executive control. Correlations between FC and reading skills reinforce the complexity of the neural mechanisms underlying the disorder. Methodological heterogeneity and the focus on opaque languages limit generalizability, emphasizing the need for more diverse and standardized studies.

Author Contributions

The conceptualization of this systematic review was undertaken by B.M., K.L. and M.P.N. The authors M.M.I.S., I.A.B.V., B.M., M.Y.B. and M.E.Y. were responsible for conducting the review and analysis, while the preparation of the original draft was carried out by M.M.I.S. and I.A.B.V. The review and editing of the manuscript were undertaken by B.M., M.Y.B., K.L. and M.P.N. The overall supervision and management of this project were the responsibility of M.P.N. All authors have read and agreed to the published version of the manuscript.

Funding

This research received no external funding.

Informed Consent Statement

Not applicable.

Data Availability Statement

All the data supporting the results are included in the manuscript.

Acknowledgments

This work was supported by Coordenação de Aperfeiçoamento Pessoal de Nível Superior (CAPES)—Programa de Demanda Social (code 001).

Conflicts of Interest

The authors declare no conflicts of interest.

References

  1. Bigozzi, L.; Tarchi, C.; Vagnoli, L.; Valente, E.; Pinto, G. Reading Fluency As a Predictor of School Outcomes across Grades 4–9. Front. Psychol. 2017, 8, 200. [Google Scholar] [CrossRef]
  2. Huettig, F.; Pickering, M.J. Literacy Advantages Beyond Reading: Prediction of Spoken Language. Trends Cogn. Sci. 2019, 23, 464–475. [Google Scholar] [CrossRef] [PubMed]
  3. American Psychiatric Association. Diagnostic and Statistical Manual of Mental Disorders (DSM-5), 5th ed.; American Psychiatric Publishing: Washington, DC, USA, 2022; Volume 5. [Google Scholar]
  4. Harrison, J.E.; Weber, S.; Jakob, R.; Chute, C.G. ICD-11: An international classification of diseases for the twenty-first century. BMC Med. Inform. Decis. Mak. 2021, 21, 206. [Google Scholar] [CrossRef] [PubMed]
  5. Peterson, R.L.; Pennington, B.F. Developmental dyslexia. Lancet 2012, 379, 1997–2007. [Google Scholar] [CrossRef] [PubMed]
  6. Arnett, A.B.; Pennington, B.F.; Peterson, R.L.; Willcutt, E.G.; DeFries, J.C.; Olson, R.K. Explaining the sex difference in dyslexia. J. Child Psychol. Psychiatry 2017, 58, 719–727. [Google Scholar] [CrossRef]
  7. Turker, S.; Kuhnke, P.; Cheung, V.K.M.; Weise, K.; Hartwigsen, G. Neurostimulation improves reading and alters communication within reading networks in dyslexia. Ann. N. Y. Acad. Sci. 2025, 1544, 172–189. [Google Scholar] [CrossRef]
  8. Elnakib, A.; Soliman, A.; Nitzken, M.; Casanova, M.F.; Gimel’farb, G.; El-Baz, A. Magnetic resonance imaging findings for dyslexia: A review. J. Biomed. Nanotechnol. 2014, 10, 2778–2805. [Google Scholar] [CrossRef]
  9. Ramus, F.; Altarelli, I.; Jednoróg, K.; Zhao, J.; Scotto di Covella, L. Neuroanatomy of developmental dyslexia: Pitfalls and promise. Neurosci. Biobehav. Rev. 2018, 84, 434–452. [Google Scholar] [CrossRef]
  10. Mongerson, C.R.L.; Jennings, R.W.; Borsook, D.; Becerra, L.; Bajic, D. Resting-State Functional Connectivity in the Infant Brain: Methods, Pitfalls, and Potentiality. Front. Pediatr. 2017, 5, 159. [Google Scholar] [CrossRef]
  11. Martins, B.; Baba, M.Y.; Dimateo, E.M.; Costa, L.F.; Camara, A.S.; Lukasova, K.; Nucci, M.P. Investigating Dyslexia through Diffusion Tensor Imaging across Ages: A Systematic Review. Brain Sci. 2024, 14, 349. [Google Scholar] [CrossRef]
  12. Perdue, M.V.; Mahaffy, K.; Vlahcevic, K.; Wolfman, E.; Erbeli, F.; Richlan, F.; Landi, N. Reading intervention and neuroplasticity: A systematic review and meta-analysis of brain changes associated with reading intervention. Neurosci. Biobehav. Rev. 2022, 132, 465–494. [Google Scholar] [CrossRef]
  13. Turker, S.; Kuhnke, P.; Jiang, Z.; Hartwigsen, G. Disrupted network interactions serve as a neural marker of dyslexia. Commun. Biol. 2023, 6, 1114. [Google Scholar] [CrossRef] [PubMed]
  14. Page, M.J.; McKenzie, J.E.; Bossuyt, P.M.; Boutron, I.; Hoffmann, T.C.; Mulrow, C.D.; Shamseer, L.; Tetzlaff, J.M.; Akl, E.A.; Brennan, S.E.; et al. The PRISMA 2020 statement: An updated guideline for reporting systematic reviews. Int. J. Surg. 2021, 88, 105906. [Google Scholar] [CrossRef] [PubMed]
  15. Ouzzani, M.; Hammady, H.; Fedorowicz, Z.; Elmagarmid, A. Rayyan—A web and mobile app for systematic reviews. Syst. Rev. 2016, 5, 210. [Google Scholar] [CrossRef] [PubMed]
  16. Wells, G.; Shea, B.; O’Connell, D.; Peterson, J.E.; Welch, V. The Newcastle–Ottawa Scale (NOS) for Assessing the Quality of Case-Control Studies in Meta-Analysis. Eur. J. Epidemiol. 2011, 25, 603–605. [Google Scholar]
  17. Carra, M.C.; Romandini, P.; Romandini, M. Risk of Bias Evaluation of Cross-Sectional Studies: Adaptation of the Newcastle-Ottawa Scale. J. Periodontal Res. 2025. [Google Scholar] [CrossRef]
  18. Cohen, J. A Coefficient of Agreement for Nominal Scales. Educ. Psychol. Meas. 1960, 20, 37–46. [Google Scholar] [CrossRef]
  19. Gamer, M.; Lemon, J.; Singh, I. irr: Various Coefficients of Interrater Reliability and Agreement, R package version 0.84.1. 2010. Available online: https://CRAN.R-project.org/package=irr (accessed on 5 May 2025).
  20. Tan, S.; Deng, S.; Song, X.; Su, X.; Zhao, J.; Yang, K.; Li, H.; Wang, D.; Fu, J.; Gong, R.; et al. Altered effective connectivity on rapid automatized naming deficits in Chinese children with developmental dyslexia: An rs-fMRI study with Ganger causality analysis. J. Psychiatr. Res. 2024, 175, 235–242. [Google Scholar] [CrossRef]
  21. Gengeç Benli, Ş.; İçer, S.; Demirci, E.; Karaman, Z.F.; Ak, Z.; Acer, İ.; Sağır, G.R.; Aker, E.; Sertkaya, B. Data-driven exploratory method investigation on the effect of dyslexia education at brain connectivity in Turkish children: A preliminary study. Brain Struct. Funct. 2024, 229, 1697–1712. [Google Scholar] [CrossRef]
  22. Farah, R.; Dworetsky, A.; Coalson, R.S.; Petersen, S.E.; Schlaggar, B.L.; Rosch, K.S.; Horowitz-Kraus, T. An executive-functions-based reading training enhances sensory-motor systems integration during reading fluency in children with dyslexia. Cereb. Cortex 2024, 34, bhae166. [Google Scholar] [CrossRef]
  23. Li, Y.; Li, J.; Yang, Y.; Bi, H.Y. Disruption of dynamic functional connectivity in children with developmental dyslexia. Lang. Cogn. Neurosci. 2023, 38, 621–635. [Google Scholar] [CrossRef]
  24. Gosse, C.; Dricot, L.; Van Reybroeck, M. Evidence of Altered Functional Connectivity at Rest in the Writing Network of Children with Dyslexia. Brain Sci. 2022, 12, 243. [Google Scholar] [CrossRef] [PubMed]
  25. Yang, X.; Zhang, J.; Lv, Y.; Wang, F.; Ding, G.; Zhang, M.; Meng, X.; Song, Y. Failure of resting-state frontal-occipital connectivity in linking visual perception with reading fluency in Chinese children with developmental dyslexia. NeuroImage 2021, 233, 117911. [Google Scholar] [CrossRef] [PubMed]
  26. Sturm, V.E.; Roy, A.R.K.; Datta, S.; Wang, C.; Sible, I.J.; Holley, S.R.; Watson, C.; Palser, E.R.; Morris, N.A.; Battistella, G.; et al. Enhanced visceromotor emotional reactivity in dyslexia and its relation to salience network connectivity. Cortex 2021, 134, 278–295. [Google Scholar] [CrossRef] [PubMed]
  27. Mateu-Estivill, R.; Forne, S.; Lopez-Sala, A.; Falcon, C.; Caldu, X.; Sopena, J.M.; Sans, A.; Adan, A.; Grau, S.; Bargallo, N.; et al. Functional connectivity alterations associated with literacy difficulties in early readers. Brain Imaging Behav. 2021, 15, 2109–2120. [Google Scholar] [CrossRef]
  28. Horowitz-Kraus, T.; DiFrancesco, M.; Greenwood, P.; Scott, E.; Vannest, J.; Hutton, J.; Dudley, J.; Altaye, M.; Farah, R. Longer Screen Vs. Reading Time is Related to Greater Functional Connections Between the Salience Network and Executive Functions Regions in Children with Reading Difficulties vs. Typical Readers. Child Psychiatry Hum. Dev. 2021, 52, 681–692. [Google Scholar] [CrossRef]
  29. Greenwood, P.; Dudley, J.; Hutton, J.; DiFrancesco, M.; Farah, R.; Horowitz-Kraus, T. Higher maternal education is related to negative functional connectivity between attention system networks and reading-related regions in children with reading difficulties compared to typical readers. Brain Res. 2021, 1766, 147532. [Google Scholar] [CrossRef]
  30. Cross, A.M.; Ramdajal, R.; Peters, L.; Vandermeer, M.R.J.; Hayden, E.P.; Frijters, J.C.; Steinbach, K.A.; Lovett, M.W.; Archibald, L.M.D.; Joanisse, M.F. Resting-state functional connectivity and reading subskills in children. NeuroImage 2021, 243, 118529. [Google Scholar] [CrossRef]
  31. Nachshon, O.; Farah, R.; Horowitz-Kraus, T. Decreased Functional Connectivity Between the Left Amygdala and Frontal Regions Interferes With Reading, Emotional, and Executive Functions in Children With Reading Difficulties. Front. Hum. Neurosci. 2020, 14, 104. [Google Scholar] [CrossRef]
  32. Margolis, A.E.; Pagliaccio, D.; Davis, K.S.; Thomas, L.; Banker, S.M.; Cyr, M.; Marsh, R. Neural correlates of cognitive control deficits in children with reading disorder. Brain Imaging Behav. 2020, 14, 1531–1542. [Google Scholar] [CrossRef]
  33. Kuhl, U.; Neef, N.E.; Kraft, I.; Schaadt, G.; Dorr, L.; Brauer, J.; Czepezauer, I.; Muller, B.; Wilcke, A.; Kirsten, H.; et al. The emergence of dyslexia in the developing brain. NeuroImage 2020, 211, 116633. [Google Scholar] [CrossRef] [PubMed]
  34. Hashimoto, T.; Higuchi, H.; Uno, A.; Yokota, S.; Asano, K.; Taki, Y.; Kawashima, R. Association Between Resting-State Functional Connectivity and Reading in Two Writing Systems in Japanese Children With and Without Developmental Dyslexia. Brain Connect. 2020, 10, 254–266. [Google Scholar] [CrossRef] [PubMed]
  35. Freedman, L.; Zivan, M.; Farah, R.; Horowitz-Kraus, T. Greater functional connectivity within the cingulo-opercular and ventral attention networks is related to better fluent reading: A resting-state functional connectivity study. NeuroImage Clin. 2020, 26, 102214. [Google Scholar] [CrossRef]
  36. Buchweitz, A.; Costa, A.C.; Toazza, R.; de Moraes, A.B.; Cara, V.M.; Esper, N.B.; Aguzzoli, C.; Gregolim, B.; Dresch, L.F.; Soldatelli, M.D.; et al. Decoupling of the Occipitotemporal Cortex and the Brain’s Default-Mode Network in Dyslexia and a Role for the Cingulate Cortex in Good Readers: A Brain Imaging Study of Brazilian Children. Dev. Neuropsychol. 2019, 44, 146–157. [Google Scholar] [CrossRef]
  37. Horowitz-Kraus, T.; Woodburn, M.; Rajagopal, A.; Versace, A.L.; Kowatch, R.A.; Bertocci, M.A.; Bebko, G.; Almeida, J.R.C.; Perlman, S.B.; Travis, M.J.; et al. Decreased functional connectivity in the fronto-parietal network in children with mood disorders compared to children with dyslexia during rest: An fMRI study. NeuroImage Clin. 2018, 18, 582–590. [Google Scholar] [CrossRef]
  38. Horowitz-Kraus, T.; DiCesare, C.; Kiefer, A.W. Longer Fixation Times During Reading Are Correlated With Decreased Connectivity in Cognitive-Control Brain Regions During Rest in Children. Mind Brain Educ. 2018, 12, 49–60. [Google Scholar] [CrossRef] [PubMed]
  39. Davis, K.; Margolis, A.E.; Thomas, L.; Huo, Z.; Marsh, R. Amygdala sub-regional functional connectivity predicts anxiety in children with reading disorder. Dev. Sci. 2018, 21, e12631. [Google Scholar] [CrossRef]
  40. Zhou, W.; Xia, Z.; Bi, Y.; Shu, H. Altered connectivity of the dorsal and ventral visual regions in dyslexic children: A resting-state fMRI study. Front. Hum. Neurosci. 2015, 9, 495. [Google Scholar] [CrossRef]
  41. Horowitz-Kraus, T.; Toro-Serey, C.; DiFrancesco, M. Increased Resting-State Functional Connectivity in the Cingulo-Opercular Cognitive-Control Network after Intervention in Children with Reading Difficulties. PLoS ONE 2015, 10, e0133762. [Google Scholar] [CrossRef]
  42. Horowitz-Kraus, T.; DiFrancesco, M.; Kay, B.; Wang, Y.; Holland, S.K. Increased resting-state functional connectivity of visual- and cognitive-control brain networks after training in children with reading difficulties. NeuroImage Clin. 2015, 8, 619–630. [Google Scholar] [CrossRef]
  43. Cheema, K.; Ostevik, A.V.; Westover, L.; Hodgetts, W.E.; Cummine, J. Resting-state networks and reading in adults with and without reading impairments. J. Neurolinguistics 2021, 60, 101016. [Google Scholar] [CrossRef]
  44. Schurz, M.; Wimmer, H.; Richlan, F.; Ludersdorfer, P.; Klackl, J.; Kronbichler, M. Resting-State and Task-Based Functional Brain Connectivity in Developmental Dyslexia. Cereb. Cortex 2015, 25, 3502–3514. [Google Scholar] [CrossRef] [PubMed]
  45. de León Rodríguez, D.; Buetler, K.A.; Eggenberger, N.; Laganaro, M.; Nyffeler, T.; Annoni, J.-M.; Müri, R.M. The Impact of Language Opacity and Proficiency on Reading Strategies in Bilinguals: An Eye Movement Study. Front. Psychol. 2016, 7, 649. [Google Scholar] [CrossRef]
  46. Borleffs, E.; Maassen, B.A.M.; Lyytinen, H.; Zwarts, F. Cracking the Code: The Impact of Orthographic Transparency and Morphological-Syllabic Complexity on Reading and Developmental Dyslexia. Front. Psychol. 2019, 9, 2534. [Google Scholar] [CrossRef] [PubMed]
  47. Patriat, R.; Molloy, E.K.; Meier, T.B.; Kirk, G.R.; Nair, V.A.; Meyerand, M.E.; Prabhakaran, V.; Birn, R.M. The effect of resting condition on resting-state fMRI reliability and consistency: A comparison between resting with eyes open, closed, and fixated. NeuroImage 2013, 78, 463–473. [Google Scholar] [CrossRef]
  48. Kumar, V.A.; Lee, J.; Liu, H.-L.; Allen, J.W.; Filippi, C.G.; Holodny, A.I.; Hsu, K.; Jain, R.; McAndrews, M.P.; Peck, K.K.; et al. Recommended Resting-State fMRI Acquisition and Preprocessing Steps for Preoperative Mapping of Language and Motor and Visual Areas in Adult and Pediatric Patients with Brain Tumors and Epilepsy. Am. J. Neuroradiol. 2024, 45, 139–148. [Google Scholar] [CrossRef]
  49. Paz-Alonso, P.M.; Oliver, M.; Lerma-Usabiaga, G.; Caballero-Gaudes, C.; Quiñones, I.; Suárez-Coalla, P.; Duñabeitia, J.A.; Cuetos, F.; Carreiras, M. Neural correlates of phonological, orthographic and semantic reading processing in dyslexia. NeuroImage Clin. 2018, 20, 433–447. [Google Scholar] [CrossRef]
  50. Wu, Y.; Cheng, Y.; Yang, X.; Yu, W.; Wan, Y. Dyslexia: A Bibliometric and Visualization Analysis. Front. Public Health 2022, 10, 915053. [Google Scholar] [CrossRef]
  51. Cao, F.; Sussman, B.L.; Rios, V.; Yan, X.; Wang, Z.; Spray, G.J.; Mack, R.M. Different mechanisms in learning different second languages: Evidence from English speakers learning Chinese and Spanish. NeuroImage 2017, 148, 284–295. [Google Scholar] [CrossRef]
  52. Miles, E. Dyslexia may show a different face in different languages. Dyslexia 2000, 6, 193–201. [Google Scholar] [CrossRef]
  53. Macdonald, S.; Deacon, L. Twice upon a time: Examining the effect socio-economic status has on the experience of dyslexia in the United Kingdom. Dyslexia 2019, 25, 3–19. [Google Scholar] [CrossRef]
  54. Wolf, M.; Gotlieb, R.J.M.; Kim, S.A.; Pedroza, V.; Rhinehart, L.V.; Tempini, M.L.G.; Sears, S. Towards a dynamic, comprehensive conceptualization of dyslexia. Ann. Dyslexia 2024, 74, 303–324. [Google Scholar] [CrossRef] [PubMed]
  55. Hu, W.; Lee, H.L.; Zhang, Q.; Liu, T.; Geng, L.B.; Seghier, M.L.; Shakeshaft, C.; Twomey, T.; Green, D.W.; Yang, Y.M.; et al. Developmental dyslexia in Chinese and English populations: Dissociating the effect of dyslexia from language differences. Brain 2010, 133, 1694–1706. [Google Scholar] [CrossRef]
  56. Landerl, K.; Harald, F.H.; Moritz, H.; De Jong, P.F.; Alain, D.; George, M.; Rauno, P.; Georgiou, G.K. Phonological Awareness and Rapid Automatized Naming as Longitudinal Predictors of Reading in Five Alphabetic Orthographies with Varying Degrees of Consistency. Sci. Stud. Read. 2019, 23, 220–234. [Google Scholar] [CrossRef]
  57. Raimondo, L.; Oliveira, ĺ.A.F.; Heij, J.; Priovoulos, N.; Kundu, P.; Leoni, R.F.; van der Zwaag, W. Advances in resting state fMRI acquisitions for functional connectomics. NeuroImage 2021, 243, 118503. [Google Scholar] [CrossRef] [PubMed]
  58. Power, J.D.; Mitra, A.; Laumann, T.O.; Snyder, A.Z.; Schlaggar, B.L.; Petersen, S.E. Methods to detect, characterize, and remove motion artifact in resting state fMRI. NeuroImage 2014, 84, 320–341. [Google Scholar] [CrossRef]
  59. McNorgan, C.; Smith, G.J.; Edwards, E.S. Integrating functional connectivity and MVPA through a multiple constraint network analysis. NeuroImage 2020, 208, 116412. [Google Scholar] [CrossRef]
  60. Bahrami, M.; Laurienti, P.J.; Shappell, H.M.; Simpson, S.L. Brain Network Analysis: A Review on Multivariate Analytical Methods. Brain Connect. 2023, 13, 64–79. [Google Scholar] [CrossRef]
  61. Seitzman, B.A.; Snyder, A.Z.; Leuthardt, E.C.; Shimony, J.S. The State of Resting State Networks. Top. Magn. Reson. Imaging 2019, 28, 189–196. [Google Scholar] [CrossRef]
  62. Gordon, E.M.; Lynch, C.J.; Gratton, C.; Laumann, T.O.; Gilmore, A.W.; Greene, D.J.; Ortega, M.; Nguyen, A.L.; Schlaggar, B.L.; Petersen, S.E.; et al. Three Distinct Sets of Connector Hubs Integrate Human Brain Function. Cell Rep. 2018, 24, 1687–1695.e1684. [Google Scholar] [CrossRef]
  63. Taran, N.; Farah, R.; DiFrancesco, M.; Altaye, M.; Vannest, J.; Holland, S.; Rosch, K.; Schlaggar, B.L.; Horowitz-Kraus, T. The role of visual attention in dyslexia: Behavioral and neurobiological evidence. Hum. Brain Mapp. 2022, 43, 1720–1737. [Google Scholar] [CrossRef]
  64. Raschle, N.M.; Zuk, J.; Gaab, N. Functional characteristics of developmental dyslexia in left-hemispheric posterior brain regions predate reading onset. Proc. Natl. Acad. Sci. USA 2012, 109, 2156–2161. [Google Scholar] [CrossRef]
  65. Maurer, U.; Brem, S.; Bucher, K.; Kranz, F.; Benz, R.; Steinhausen, H.C.; Brandeis, D. Impaired tuning of a fast occipito-temporal response for print in dyslexic children learning to read. Brain 2007, 130, 3200–3210. [Google Scholar] [CrossRef] [PubMed]
  66. Taran, N.; Farah, R.; Gashri, C.; Gitman, E.; Rosch, K.; Schlaggar, B.L.; Horowitz-Kraus, T. Executive functions–based reading training engages the cingulo-opercular and dorsal attention networks. Netw. Neurosci. 2023, 7, 1452–1482. [Google Scholar] [CrossRef] [PubMed]
  67. Frye, R.E.; Wu, M.H.; Liederman, J.; Fisher, J.M. Greater Pre-Stimulus Effective Connectivity from the Left Inferior Frontal Area to other Areas is Associated with Better Phonological Decoding in Dyslexic Readers. Front. Syst. Neurosci. 2010, 4, 156. [Google Scholar] [CrossRef]
  68. Haft, S.; Duong, P.; Ho, T.; Hendren, R.; Hoeft, F. Anxiety and Attentional Bias in Children with Specific Learning Disorders. J. Abnorm. Child. Psychol. 2018, 47, 487–497. [Google Scholar] [CrossRef] [PubMed]
  69. Zuk, J.; Perdue, M.V.; Becker, B.; Yu, X.; Chang, M.; Raschle, N.M.; Gaab, N. Neural correlates of phonological processing: Disrupted in children with dyslexia and enhanced in musically trained children. Dev. Cogn. Neurosci. 2018, 34, 82–91. [Google Scholar] [CrossRef]
  70. Koyama, M.S.; Kelly, C.; Shehzad, Z.; Penesetti, D.; Castellanos, F.X.; Milham, M.P. Reading networks at rest. Cereb. Cortex 2010, 20, 2549–2559. [Google Scholar] [CrossRef]
Figure 1. The PRISMA flowchart of the systematic review showing the inclusion and exclusion of studies.
Biomedicines 13 01210 g001
Figure 2. Quality assessment using the Newcastle–Ottawa Scale (NOS) for each study [20,21,22,23,24,25,26,27,28,29,30,31,32,33,34,35,36,37,38,39,40,41,42,43,44].
Biomedicines 13 01210 g002
Table 1. Demographic characteristics of dyslexia of development.
Ref.YearDemographic DataNeuropsychological Tests for Dyslexia Evaluation
CountryLanguageGroupNSex
W:M
Age (Years)Years of Education (or Level)IQWord Reading AccuracyPseudoword Reading AccuracyText Reading AccuracyRANPhonological TaskAttentionOther
rs-fMRI in Children
Tan S et al. [20]2024ChinaChineseControl DYS36
64
8:28
25:39
9.4 ± 1.1
9.8 ± 1.1
2nd to 5th gradeWISC-IV
(FSIQ ≥ 80)
CRTBNRNRDigits, Letters, Colors and ShapesNRConners Teacher Rating Scale (CBRS)PRS
Gengeç B et al. [21]2024TurkeyTurkishControl
DYS
DYSe
15
13
15
10:5
3:10
6:9
10.1 ± 1.5
8.9 ± 1.7
9.4 ± 1.5
E-DYS: DYS with special education for 12–24 monthsWISC-IV (≥80)Number of words read per minuteNRNRNRNRNRMotor coordination assessment
Farah R et al. [22]2024USAEnglishControl
DYS
65
55
29:36
24:31
10.1 ± 1.7
9.9 ± 1.3
NRNon-verbal Intelligence Test (TONI)Letter–Word and Word Attack subtests (WJ-III);
Sight Word Efficiency subtest (TOWRE)
Timed pseudoword decoding efficiency (TOWRE)NRNRElision (CTOPP)NRStroop, Stories listening
Li Y et al. [23]2022ChinaChineseControl
DYS
38
22
17:21
17:5
10.9 ± 0.8
10.7 ± 0.9
NRNon-verbal
(Raven)
NRNRReading Fluency TestNROddity detection taskNRVocabulary (CRM)
Gosse C et al. [24]2022BelgiumFrenchControl
DYS
16
16
9:5
5:9
9.3 ± 1.0
9.4 ± 1.2
NRNon-verbal
(WISC-IV)
Analytic Battery of Written Language (Regular and Irregular Words)Analytic Battery of Written Language (Nonwords)NRNRNRNRSpelling (BALE), Concise Evaluation Scale for Children’s Handwriting
Yang X et al. [25]2021ChinaChineseControl
DYS
25
18
13:12
6:12
10.4 ± 1.0
10.2 ± 1.0
10:12 (4°:6°)Non-verbal (Raven)CRTBNRReading Fluency TestNRNRNRNR
Sturm VE et al. [26]2021USAEnglishControl
DYS
22
32
11:11
15:17
10.5 ± 1.5
10.3 ± 1.4
NRNon-verbal (WASI)Sight Word Efficiency (TOWRE-2) and Letter–Word
(WJ-IV)
Phonemic Decoding Efficiency (TOWRE-2) and Word Attack (WJ-IV)Paragraph Reading
(GORT-5)
NRNRNRSocial Skills, Anxiety and Depression (BASC-2)
Mateu-Estivill R et al. [27]2021SpainCatalanControl
DYS
30
34
NR7.4 ± 0.5
7.1 ± 0.7
1st or 2nd gradeVIQ and PIQ
(WISC-IV)
Words subtest (TALE-C)Pseudowords subtest (PROLEC-R)Text subtests (TALE-C)Letters, Objects and ColorsNRNRExecutive Function and Verbal Fluency (FAS, Animals), Spelling (TALE-C), Digit span
(WISC-IV)
Horowitz-Kraus T et al. [28]2021USAEnglishControl
DYS
28
29
NR10 ± 1.3
9.8 ± 1.3
NRNon-verbal Intelligence test
(TONI-3) and VIQ (PPVT-4)
TOSREC, Sight Word Efficiency (TOWRE) and Letter–Word (WJ)Pseudoword Efficiency (TOWRE) and Word Attack (WJ)Passage Comprehension (WJ)Numbers, Objects, Colors and Letters (CTOPP)Elision (CTOPP)Conners Comprehensive Behavior Rating Scales (CBRS), Sky Search (TEA-Ch), Sustained (CPT)Working memory (Digit Span—WISC), Coding and Symbol Search (WISC), Switching (Stroop), Fluency (DKEFS), EF (BRIEF)
Greenwood P et al. [29]2021USAEnglishControl
DYS
21
24
6:15
12:12
10.0 ± 1.5
9.8 ± 1.4
NRNon-verbal Intelligence test
(TONI-IV)
Sight Word Efficiency (TOWRE) and Letter–Word (WJ)Pseudoword Efficiency (TOWRE) and Word Attack (WJ)TOSREC, Passage Comprehension (WJ) and GORTNRElision and Blending Words (CTOPP-2)Conners Self-report Test
(CBRS)
NR
Cross AM et al. [30]2021CanadaEnglishControl
DYS
65
18
45:38 (Total)10.9 ± 1.0NRNon-verbal (WASI-II)Sight Word Efficiency (TOWRE-2)Phonemic Decoding Efficiency (TOWRE-2)Passage Comprehension
(WJ-III)
LettersNRNRNR
Nachshon O et al. [31]2020USAEnglishControl
DYS
37
27
15:22
15:12
9.9 ± 1.0
10.7 ± 1.1
NRNon-verbal Intelligence test
(TONI-3) and VIQ (PPVT-4)
Sight Word Efficiency (TOWRE) and Letter–Word (WJ)Pseudowords Reading Efficiency (TOWRE) and Pseudoword Reading (WJ)Passage Comprehension (WJ)Numbers and Letters (CTOPP)Elision (CTOPP)Sky Search (TEA-Ch)Inhibition (STROOP), Working memory (Digit Span—WISC), Symbol Search (WISC), Switching (Wisconsin, EF (BRIEF), Coding (WISC)
Margolis AE et al. [32]2020USAEnglishControl
DYS
18
20
10:8
8:12
10.4 ± 1.7
9.8 ± 1.3
NRFIQ,
VIQ and PIQ (WASI)
TOWRE-2 and WJ-IIITOWRE-2GORT-5NRNRNRRapid Simon Task
Kuhl U et al. [33]2020 (pub)
2012–2013 (initial data) 2015–2015 (final data)
GermanyGermanControl
DYS
16
16
7:9
5:11
BL:
5.6 ± 4
5.8 ± 4
AL:
8.8 ± 3
8.4 ± 3
BL:
Kindergarten (before literacy)
AL:
Second grade
BL:
Non-verbal (WPPSI-III)
AL:
Non-verbal (WISC-IV)
BL:
-
AL:
SLRT-II
NRNRBL:
Colored Objects (BISC)
AL:
-
BL:
BISC
AL:
Base competence for school years
(BAKO)
NRBL:
Short-term memory (K-ABC)
AL:
German spelling test (DERET 1-2) and Heidelberg math’s test (HRT1-4)
Hashimoto T et al. [34]2020JapanJapanese (syllabic Hiragana and logographic Kanji)Control
DYS
46
22
6:40
3:19
10.5
10.7
NRFSIQ,
VIQ and
PIQ (WISC-III or IV)
Standard comprehension test of abstract wordsNRNRType not specifiedBackward word repetition (3 mola and 4 mola word)NRRey–Osterrieth Complex Figure (copy, immediate recall and delayed recall)
Freedman L et al. [35]2020USAEnglishControl
DYS
30
26
16:14
10:16
10.0 ± 1.4
10.0 ± 1.3
NRNon-verbal Intelligence test (TONI-3)Letter–Word (WJ-III) and Sight Word Efficiency (TOWRE)Word Attack (WJ-III)NRNRNRVisual attention (TEA-Ch)Digit span (WISC-III), Switching (D-KEFS), Wisconsin Card Sorting Task, Inhibition (BRIEF)
Davis K et al. [39]2018USAEnglishControl
DYS
21
24
NR10.2 ± 1.8
9.8 ± 1.2
NRVIQ and non-verbal (WASI) and WISC-IVLetter–Word and spelling
(WJ-III)
Word Attack (WJ-III) and Phonemic Decoding Efficiency (TOWRE-2)Reading Fluency (WJ-III) and GORT-5Letters and Digits (CTOPP-2)NRNRChildren’s memory scale (CMS) story memory, word pairs and numbers; RCMAS, CDRS-R
Buchweitz A et al. [36]2018 (pub)
2014–15 (tests)
BrazilBrazilian PortugueseControl
DYS
16
16

7:9
5:11
8.4 ± 0.5
9.6 ± 0.8
NRWASIWord Reading Task (LPI)Pseudoword Reading Task (LPI)Reading Comprehension testNRNRNRNR
Horowitz-Kraus T, Wood et al. [37]2018USAEnglishControl
DYS
MD
BD
17
15
14
11
9:8
7:8
11:3
3:9
9.8 ± 1.4
10.3 ± 1.5
15.5 ± 1.8
16.7 ± 1.8
NRNRLetter–Word
(WJ-III)
Word Attack (WJ-III)NRNRElision (CTOPP)NRNR
Horowitz-Kraus T, DiCesare et al. [38]2018USAEnglishControl
DYS
9
10
4:5
2:8
10.2 ± 0.7
9.9 ± 0.9
NRNon-verbal IQ
(TONI-3) and
VIQ (PPVT-4)
Letter–Word
(WJ-III)
Word Attack (WJ-III)TOSRECNRElision (CTOPP)Conners Comprehensive Behavior Rating Scales (CBRS)Shifting (Color-word Stroop), Visual attention (Sky Search), Working memory (Digit-span), and Learning (Wisconsin)
Zhou W et al. [40]2015ChinaChineseControl
DYS
26
21
16:10
9:12
12.0 ± 1.2
12.0 ± 1.6
NRNon-verbal
(C-WISC and Raven)
NRNRReading Fluency TestRANPhoneme deletion and Lexical decisionNRMorphological production
Horowitz-Kraus T, Toro-Serey C et al. [41]2015USAEnglishControl
DYS
17
15
8:9
8:7
9.8 ± 1.4
10.3 ± 1.5
NRNon-verbal Intelligence test
(TONI-3)
TOWRETOWRENRObjects (CTOPP)Elision (CTOPP)Conners Comprehensive Behavior Rating Scales (CBRS) and Speed and accuracy (TEA-Ch)Fluency abilities (D-KEFS), Switching (WCST), Inhibition abilities (Stroop—D-KEFS)
Horowitz-Kraus T, Difrancesco M et al. [42]2015USAEnglishControl
DYS
18
18
9:9
9:9
9.8 ± 1.7
9.9 ± 1.3
NRNon-verbal Intelligence test
(TONI-3)
TOWREDecoding subtest for nonwords reading (TOWRE)Rate, Accuracy (GORT-IV)NRNRConners Comprehensive Behavior Rating Scales (CBRS)NR
rs-fMRI in adults
Cheema K et al. [43]2021CanadaEnglishControl
DYS
19
14
14:5
10:4
21.6 ± 2.0
24.4 ± 5.4
NRNon-verbal (WASI)Sight Word Efficiency (TOWRE-1) and Word IdentificationPseudoword Decoding Efficiency (TOWRE-1) and Word Attack (WJ)NRNRNRNRSpelling
Schurz M et al. [44]2015GermanyGermanControl
DYS
14
15
0:14
0:15
17.8 ± 1.2
18.3 ± 1.1
NRVIQ, PIQ (WAIS-R)Word ReadingNon-word ReadingSentence ReadingObjectsLexical decision taskNRNR
Note: Bold font indicates significant group differences. Abbreviations: NR: not reported; N: number of subjects; m: months; W: women; M: male; IQ: intelligence quotient; RAN: rapid automatized naming tasks; DYS: dyslexic; DYSe: dyslexics who received special education; BL: before literacy; AL: after literacy; FSIQ: full-scale intelligence quotient; TONI: test of nonverbal intelligence; FIQ: full-4 IQ; PIQ: performance IQ; VIQ: verbal IQ; CRTB: Chinese Character Recognition Test Battery and Assessment Scale for Primary School Children; TALE-C: Test d’análisis de Lectura i escriptura en català (reading–writing analysis test Catalan version); TOSREC: Test of silent reading efficiency and comprehension; LPI: Language Proficiency Index; PROLEC-R: Batería de evaluacion de los processos lectores (assessment tests of reading process); FAS: F-A-S phonemic verbal fluency test; GORT: Gray Oral Reading Test; CRM: Character Recognition Measures and Assessment Scale; CBRS: Conners Comprehensive Behaviour Rating Scale; TEA-Ch: Test of everyday attention for children; CPT: Continuous performance task; PRS: pupil rating scale; BASC: Behaviou Assessment System for children; D-KEFS: Delis–Kaplan Executive function system; EF: executive function; BRIEF: Behaviour Rating Inventory of Executive Function; CMS: children’s memory scale; RCMAS: Revised children’s manifest anxiety scale; CDRS-R: Children’s depression rating scale; WCST: Wisconsin card sorting test; TOWRE: Test of Word Reading Efficiency; SWE: Sight Word Efficiency (TOWRE subtest); CTOPP: Comprehensive Test of Phonological Processing; MD: Mood disorders; BD: Behavioral disorders; WISC: Wechsler Intelligence Scale for Children; BALE: Analytic Battery of Written Language; WJ-III: Woodcock-Johnson III Tests of Achievement; WJ-IV: Woodcock-Johnson IV Tests of Achievement; BISC: Bielefelder Screening zur Früherkennung von Lese-Reschtschreibschwierigkeiten (Bielefeld screening of literacy precursor abilities); K-ABC: Kaufman Assessment Battery for Children. German version; WPPSI-III: Wechsler Preschool and Primary Scale of Intelligence. German Version; SLRT-II: Lese- und Rechtschreibtest. Weiterentwicklung des Salzburger Lese- und Rechtschreibtests (Salzburg test of reading and spelling); DERET 1-2: Deutscher Rechtschreibtest für das erste und zweite Schuljahr (German spelling test); BAKO 1-4: Basiskompetenzen für Lese Rechtschreibleistungen (test of basic reading and spelling skills); HRT 1-4: Heidelberger Rechentest—Erfassung mathematischer Basiskompetenzen im Grundschulalter (standardized arithmetic efficiency test; PPVT: Peabody Picture Vocabulary Test; WASI: Wechsler Abbreviated Scale of Intelligence.
Table 2. Brain functional connectivity characteristics on acquisition, process, and outcomes of dyslexia.
Ref.rs-fMRI Acquisitionrs-fMRI Processrs-fMRI Outcomes
Equipment FieldSequenceTR/TE (ms)Slice NumberSlice Thickness (mm)FOVVolumes (Time)ConditionSoftware
Version
Denoising ProcessAtlasType of AnalyzeROIsDifference in FC of GroupsClinical-Connectivity Correlation
Outlier ParametersTemporal Filter (Hz)Spatial Smoothed * (mm)
rs-fMRI in Children
Tan S et al. [20]Siemens 3 TEPI2000/30323.5224NRAwake with eyes closedDPABI 5.1>3 mm 3° rotation0.01–0.086MNIROI-to-ROI (Granger causality analysis)Left SOG, PreCG, IFG tri, MFG,
SMG, SMA, PG, right PG, bilaterally MOG, and
STG
DYS showed decreased EC from left PreCG to right PreCu and AG, and left ACC and calcarine, as well as from left MFG to left calcarine, compared to controls. Enhanced EC from right Cu to left IFG tri (DYS > controls).Letter-RAN scores positively correlated with EC from left PG to left ACC.
Gengeç B et al. [21]Siemens 1.5 TT2*2800/53255192133Awake eyes openFSL MELODIC 6.0.4>2 mm or mean of 0.5 mm0.015MNIICA AROMA-dual regressionVIS: right occipital lobe sub-gyral;
DMN: bilateral MTG;
FPN: l-STG, l-MTG, l-IPL, right cerebellum cerebellar tonsil, right PreCu;
VAN: bilateral insula;
OFN: r-ACC;
LMN: l-IPL
VIS: DYS decreased FC in the right compared to EDYS and in the left MOG in EDYS compared to controls
Compared to controls:
DMN: DYS decreases FC in the left MTG; FPN: DYS increases FC in the STG; VAN: DYS increases FC in the left IA OFN: DYS decreases FC in the right dACC; LMN: DYS decreases FC in the left IPL
NR
Farah R et al. [22]Philips 3 T (dataset 1 and 2)/Philips 3T (dataset 3)EPI (dataset 1 and 2)/EPI multi-band (dataset 3)2000/30 (dataset 1 and 2)/700/30 (dataset 3)37 (dataset 1 and 2)/48 (dataset 3)4 (dataset 1)/3 (dataset 2 and 3)NR180/300/857Eyes closedNRNR0.009–0.086TalairachROI-to-ROISMd, SMl, CON, auditory, DMN, PMN, VIS, FPN, salience, VAN, DAN, MTL, BG, THA and cerebellumNo group differencesReading fluency shows positive correlation with the FC in DYS within the SMd, FPN, and between the SMd and auditory networks for both groups, as well as between pseudoword reading fluency and FC in DYS within the SMl and VIS
Li Y et al. [23]Siemens 3TEPI2000/31.8|2000/3054|322|3192160 | 240Awake with eyes closed, not thinking about anythingDPABI 4.5 and SPM 8
Dynamic BC toolbox
>3 mm or 3° rotation0.01–0.14MNIDynamic FC by ROI-to-ROI and ALFF and ReHoReading network: PreCG, PostCG, MFG, IFG, AG, IPL, STG, MTG, ITG, FG, MOG, and Cu bilaterallyDYS showed a greater temporal variability of FC at left IFG with the left MTG, and the left MOG with right than controls.
DYS showed reduced ALFF and ReHo compared to controls.
Temporal variability in the left IFG negatively correlated with reading fluency and phonological awareness for both groups.
Gosse C et al. [24]GE 3TEPI1500/30642220250Awake with eyes closedBrain Voyager 20.4NR0.0055MNISeed-to-voxelLeft GMFA located in BA6 in the posterior part of the MFG.DYS reduction in FC at bilateral frontoparietal, limbic, and cerebellum, as well as the left temporolimbic and temporal areas compared to controlsReading and handwriting scores correlated positively in almost all clusters in both groups
Yang X et al. [25]Siemens 3TEPI2400/30403192180Awake with eyes closedSPM 12FD > 2 mm; 2° rotation0.01–0.086MNIROI-to-ROIV1, BA17NRPositive correlation between FC (V1-MFG) and reading fluency in controls
Sturm VE et al. [26]Siemens 3TEPI2000/31|
1290/32.4
31|683.5|2.2220|211180|279Awake with eyes closedSPM 12|CONN 17f<2 mm0.01–0.18MNI | AALSeed-to-voxelSAL network: right ventral AI, bilateral ACCDYS showed stronger FC in right vAI with the pACC, the anterior MCC, amygdala, THA, hypothalamus, and brainstemPositive correlation between FC of the right vAI—pACC, anterior MCC, and the right frontal pole with emotional facial behavior.
Mateu-Estivill R et al. [27]Siemens 3TEPI2500/29403240242NRSPM12|CONNFD > 0.5 mm or SIC > 3 SD0.008–0.1 8MNI|Harvard–Oxford AtlasMVPA | Seed-to-voxelPCA
—Cluster 1: PCC and right MFG,
—Cluster 2: the left FFG
DYS higher FC right MFG with DMN and lower with bilateral AI and SMGNo significant correlations were found
Horowitz-Kraus T et al. [28]Philips 3TEPI700/30NR3NR857NRSPM 12|CONN 17fNR0.008–0.2NRMNIICASAL network: ACC, bilateral AI, bilateral rostral PFC; bilateral SMGNRDYS showed positive correlations between screen vs. reading time ratio and FC of SAL network and frontal EF regions, as well as between SAL network and bilateral cognitive control regions, associative visual processing regions, and negative correlation with FC subcortical cognitive control, language, and V1 region
Greenwood P et al. [29]Philips 3TT2*700/30483200857Awake, fixated on a crossSPM 12|CONNNR0.008–0.098MNI|WFU PickAtlasSeed-to-voxelCON: bilateral aPFC, lateral AI/FOp, medial AI/FOp, AI/FOp, dACC/medial SFC; FPN: bilateral DLPFC, IPL, IPS, PreCu, MCC; DAN: FEF, pIPS, aIPS, MT+, and left SMA/pre-SMA, right IFG, MFG, and AI; VAN: bilateral AI, SFG, and MTG, right SMG (TPJ), IFG/MFG, left STG, PreCu, MedFG, and sulcus callosomarginalisNo group differencesDYS shows a negative correlation between maternal education and FC between FPN and left central opercular cortex and occipital
FFG
Cross AM et al. [30]Siemens 3TT2*1000/30483210360Awake, fixated on a crossSPM 12|CONNFD < 0.5 mm or BSC > 3 SD0.008–0.095MNISeed-to-voxelMFG, IFG opercularis, IFG triangularis, PreCG, STG posterior, AG, SPL, SMA, FFG, OP, THANRPositive correlation between FC in left dorsal and anterior regions with decoding proficiency, and between left THA, and right FFG with sight word reading, RAN, and reading comprehension abilities. A negative association between reading comprehension and RSFC from SPL to SFG and MFG, in left hemisphere.
Nachshon O et al. [31]Philips 3TEPI2000/38NR5NR300Awake, fixated on a crossSPM/CONNNR0.008–0.2NRFSL Harvard–OxfordSeed-to-voxel and graph theoryAmygdala: BLA and CAN bilateralDYS showed lower global efficiency values within the amygdala network, a greater FC of the bilateral amygdala with the right TP and the right MFG, and a lower FC between the left amygdala and the left FP.
DYS decreases FC between the amygdala (left > right) with right FP, the left amygdala with left FP, and the right amygdala with left THA
Positive correlation between reading/EF measures and FC of left amygdala-bilateral FP, and negative correlation between emotional abilities and FC of left Amygdala-right FP
Margolis AE et al. [32]GE 3TEPI2000/30NR3240292NRSPM 12|CONN 16bFD > 0.5 mm or BSC > 30.01–0.18MNISeed-to-voxelCON: AI/FP, aPFC, THA bilateral and dorsal ACC
FPN: DLPFC, IPL, IPS, PreCu bilaterally
DYS reduced FC of CON with left FPN and temporal-parietal regions and increased FC with cerebellum than controls.
DYS showed decreases FC from FPN to DMN in controls
Both groups have a negative correlation FC of FPN (left IPL and right SFG) with Simon’s performance.
DYS showed a positive correlation between FC left IPL to PCC with word-reading accuracy.
Kuhl U et al. [33]Siemens 3TT2*2000/30NR3.9919275|118NRFSL 5.0 and AFNI 17.2.17FD > 0.5 mm0.01–0.16MNI|Glasse atlasROI-to-ROICortical: V1, and left MT, FG, A1, PT, BA6, BA44, and BA45/47
Subcortical areas: MGB, LGN, and iC
DYS showed lower FC in the left A1 and PT compared to controls, mainly in boys before literacyNR
Hashimoto T et al. [34]Philips 3TEPI2000/30343.75240160Awake eyes openDPARSF|SPM8FD > 0.5 mm and
BSC > 1.5%
0.01–0.16MNISeed-to-voxelThe left lFG and IPL; bilateral FG and the right IOGNo group differences.Control: fluent reading (Hiragana) positively correlated with FC between left FG and left ventral fronto-temporal area and fewer correlations in DYS.
Control > DYS showed a positive correlation between the FC of left IPL-right MFG with Kanji accuracy
Freedman L et al. [35]Philips 3TT2*2000/30NR3NR300Awake, fixated on a crossCONN 18NR0.008–0.28MNI|WFU PickAtlasROI-to-ROICON: bilateral aPFC and AI; FPN: bilateral DLPFC, IPL, IPS, PreCu; DAN: bilateral FEF and IPS; VAN: bilateral IFG, STG, MFG, IPLCON and VAN FC differences between high and low fluency separation groupsNR
Davis K et al. [39]GE 3TEPI2200/301403.5240273Minds wander, awake, looking at a crossSPM 12 and CONN 16bFD > 0.5 mm0.01–0.16MNI and Juelich Histological AtlasSeed-to-voxelAmygdala: BLA and CAN bilateralDYS showed an increase in FC from left BLA to an MPFC compared to controls, as well as in bilateral CMA to MPFC (left SMFG and MFG)Both groups showed FC from left BLA and bilateral CMA to mPFC positively predicted reading impairment and negatively predicted reading fluency.
Buchweitz A et al. [36]GE 3TEPI2000/30293.5220210Awake looking at a crossAFNI>0.9 mm0.01–0.16Haskins Ped | MNISeed-to-voxelLeft FFG (VWFA), left AG, left IFG, left MTG, left STGDYS showed lower FC between VWFA and PCC compared to controls.NR
Horowitz-Kraus T, Wood et al. [37]Philips 3TEPI2000/38NR5NR165Awake, fixated on a crossSPM 8|CONN 13pFD > 2 mm0.008–0.28MNI|WFU PickAtlasROI-to-ROI and graph theoryCON: dACC and bilaterally aPFC, lateral AI/FOp, medial AI/FOp, and AI/FOp; FPN: bilateral DLPFC, bilateral IPL, bilateral, IPS, bilateral PreCu, mCCNo group differences in the FPN and CONDYS had a lower reading score and higher FC FPN compared to the mood disorders group. DYS had a negative correlation between phonological awareness and FC of CON
Horowitz-Kraus T, DiCe et al. [38]Philips 3TEPI2000/38NR5NR300Awake, fixated on a crossSPM 8|CONNFD > 0.02 mm0.008–0.28MNIROI-to-ROIBilateral ACC/BA24DYS showed lower FC in ACC/BA24 with left IFG/BA45Lower negative FC between ACC and left IFG tri regions was correlated with longer fixation times during reading in DYS.
Zhou W et al. [40]Siemens 3TEPI2000/30333200240Motionless and no thinkingDPARSFNR0.01–0.084MNISeed-to-voxelLeft IPS, VWFADYS decreases FC between left IPS to the left MFG and VWFA to the anterior part of the left MFG compared to controlsBoth groups showed a positive correlation in score of reading fluency with FC for IPS-MFG and VWFA-MFG
Horowitz-Kraus T, Toro-Serey C et al. [41]Philips 3TEPI2000/38NR5NR165Awake, fixated on a crossSPM 8|CONN13pFD > 2 mm0.008–0.28MNIROI-to-ROICON: bilateral aPFC, bilateral lateral AI, bilateral medial AI, bilateral AI, and dACC; FPN: mCC and bilateral DLPFC, IPL, IPS, and PreCuNo group differences in the FPN and CONDYS showed a negative correlation between reading scores and FC of CON
Horowitz-Kraus T, Difrancesco M et al. [42]Philips 3TEPI2000/38NR5NR165Awake, fixated on a crossSPM8 and GIFTIC noiseNR8MNIICA/PCAICs—
Visual: bilateral FFG, Cu, LG, ITG; Executive functions: bilateral SFG and MFG; Attention: bilateral ACC and SFG; SM: bilateral Pre and Pos CG; language: bilateral IFG, MFG, ACC, left SPL, SMG; Occipito-temporal: bilateral LG, MTG, FFG; DAN: bilateral PreCu, SFG, LG, MTG, AG; and Memory: parahippocampal gyrus
DYS showed greater FC between visual and SM IC compared with controls.
DYS showed decreased FC between visual, EF, and Attention ICs compared to controls
Both groups had a negative correlation between visual and SM FC with word and nonword reading scores.
rs-fMRI in adults
Cheema K et al. [43]Siemens 3TEPI1980/30642.2NR182Awake, fixated on a crossSPM12
CONN
FD > 0.9 mm; BSC > 5 z-value;0.01–0.18MNISeed-to-ROIDMN: MPFC, bilateral LP, PCC; DAN: bilateral FEF and IPS; SAL: bilateral AI and RPFC, ACC, SMGNo group differences in seeds IFG, SMG, and FFG or DMN, DAN, and SALThe between-group difference in left SMG-left AG FC showed a positive correlation with TOWRE SWE fluency behavior, and negative correlation for DYS
Schurz M et al. [44]Philips 1.5TEPI2200/45255220110Awake eyes openSPM 8|CONN 13iFD > 0.5 mm; BSC > 1.5% or 0.008–0.098MNISeed-to-voxelOccipito-Temporal seeds: left FFG and left ITGDYS showed stronger FC in left FFG with right PreCu, but lower with left IFG tri, as well as between the left ITG with bilateral IFG (op, orb and tri) and stronger with left PreCu.Positive correlation for both groups: Reading and Verbal IQ with FC of FFG with left IFG (op and tri), and ITG and STG with left IFG tri;, only reading with FC of MTG with left IFG (ob and op) and between IFG with left MTG; reading and naming was correlated with ITG and STG with left IFG op. The negative correlation was found between IFG and left IPL/AG
Left temporo-parietal seeds: left STG and left IPLDYS showed weaker FC in the left STG with left IFG op, and the left IPL with right hippocampus and left PreCu.
Left temporal and frontal seeds: left MTG and left IFGDYS showed stronger FC in left MTG with left IFG oper, right FP and left calcarine sulcus; and lower FC in left IFG with left MTG and SMA and stronger with right rolandic operculum.
Note: * FWHM measures. Abbreviations: Ref.: reference; fMRI: functional magnetic resonance image; NR: not reported; TR: time of repetition; TE: time of echo; ms: milliseconds; mm: millimeters; FOV: field of view; Hz: hertz; ROI: Region of interest; EPI: echo-planar imaging; DPABI: Data processing and analysis for brain imaging; FSL: FMRIB software library; MELODIC: Multivariate Exploratory Linear Optimized Decomposition into Independent Components; SPM: Statistical Parametric Mapping; Dynamic BC: Dynamic brain connectome; AFNI: Analysis of functional neuroimages; DPARSF: Data-processing Assistant for Resting-State fMRI; GIFT: Group ICA for fMRI Toolbox; FD: framewise displacement; SIC: Signal intensity changes; SD: Standard deviation; IC noise: independent components noise; FWHM: Full width at half maximum; MNI: Montreal Neurological Institute; AAL: Automated Anatomical Labeling; ICA AROMA: independent component analysis—automatic removal of motion artifacts; Dynamic FC: Dynamic Functional Connectivity; ALFF: Amplitude of low-frequency fluctuation; ReHo: Regional Homogeneity; MVPA: multi-voxel pattern analysis; ICA: independent component analysis; PCA: Principal component analysis; SOG: Superior occipital gyrus; IFG tri: inferior frontal gyrus triangularis; SMG: supramarginal gyrus; PG: Parietal gyrus; IPL: Inferior parietal lobe; SMd: Dorsal somatomotor network; SMl: Lateral somatomotor; DMN: Default mode network; PMN: Parietal memory network; VIS: Visual network; FPN: Frontoparietal network; VAN: Ventral attention network; OFN: orbitofrontal network; LMN: lateral motor network; DAN: Dorsal attention network; CON: Cingulo-opercular network; MTL: medial temporal lobe; BG: Basal ganglia; PreCG: precentral gyrus; PostCG: Postcentral gyrus; AG: angular gyrus; ITG: inferior temporal gyrus; MOG: Middle occipital gyrus; GMFA: graphemic/motor frontal area; BSC: BOLD Signal Change; BLA: Basolateral amygdaloid complex; CAN: Central amygdala nucleus; BA: Brodmann area; A1: primary auditory cortex; V1: primary visual cortex; PCC: Posterior Cingulate Cortex; ACC: Anterior Cingulate Cortex; AI: Anterior insula; aPFC: Anterior prefrontal cortex; vAI: ventral anterior insula; dACC: dorsal anterior cingulate cortex; DLPFC: dorsolateral prefrontal cortex; FEF: Frontal eye fields; IPS: intraparietal sulcus; pIPS: posterior intraparietal sulcus; aIPS: Anterior intraparietal sulcus; SMA: supplementary motor area; pre-SMA: pré-supplementary motor area; TPJ: Temporoparietal junction; SFG: Superior frontal gyrus; MedFG: medial frontal gyrus; FP: Fronto-parietal; THA: Thalamus; TP: temporal pole; MFG: middle frontal gyrus; SPL: superior parietal lobule; OP: operculum; tri: triangularis; BA17: Brodmann area 17; SAL: Salience; MT: middle temporal area; FFG: fusiform gyrus; PT: planum temporale; BA6: ventral premotor cortex; BA44: pars opercularis of the inferior frontal gyrus; BA45/47: pars triangularis/orbitalis of the inferior frontal gyrus; iC: inferior colliculus; IC: independent component; MGB: medial geniculate nucleus; LGN: lateral geniculate nucleus; IOG: inferior occipital gyrus; FOp: Frontal Operculum; VWFA: visual word form area; MTG: middle temporal gyrus; STG: superior temporal gyrus; IFG: inferior frontal gyrus; mCC: midcingulate cortex; BA24: Brodmann area 24; LG: lingula gyrus; DYS: Dyslexic; EC: effective connectivity; FC: functional connectivity; EDYS: dyslexic children who received special education; pACC: Pregenual anterior cingulate cortex; MPFC: medial prefrontal cortex; CMA: cingulate motor area; PreCu: precuneous; Cu: Cuneus; SMFG: superior medial frontal gyrus; RAN: Rapid automatized naming; EF: executive functions; RSFC: resting state functional connectivity; TOWRE: test of word reading efficiency; SWE: Sight Word Efficiency; IQ: intelligence quotient; IFG op: opercular part of the inferior frontal gyrus; Haskins Ped: Haskins pediatric atlas; CG: cingulate gyrus.; LP: Lateral posterior thalamic nucleus; SM: somatomotor network.
Disclaimer/Publisher’s Note: The statements, opinions and data contained in all publications are solely those of the individual author(s) and contributor(s) and not of MDPI and/or the editor(s). MDPI and/or the editor(s) disclaim responsibility for any injury to people or property resulting from any ideas, methods, instructions or products referred to in the content.

