Abstract
Background/Objectives: While T2* mapping effectively assesses cerebral blood oxygenation, its utility for capturing cardiac phase-dependent myocardial changes in hypertrophic cardiomyopathy (HCM) is underexplored. This study investigates T2* dynamics in an HCM mouse model, to validate T2* as a clinically relevant biomarker for improved HCM diagnosis and treatment monitoring. Methods: A cardiac-specific Mybpc3 genetic mouse model, closely mirroring human HCM, was used with 12 young mice (6–11 weeks old), including both male and female wild-type (WT) and Mybpc3-KI (HCM) groups. The cardiac function was assessed using self-gated multi-slice 2D CINE imaging. To investigate myocardial T2* variations across the cardiac cycle, multi-gradient echo (MGE) imaging was employed. This approach used retrospective gating and continuous acquisition synchronization with pulse oximetry at 9.4 T small animal MRI. Results: Mybpc3-KI mice demonstrated left-ventricular (LV) hypertrophy compared to WT (HCM = 50.08 ± 4.68 µm/g vs. WT = 45.80 ± 20.07 µm/g, p < 0.01) and reduced ejection fraction (HCM = 38.55 ± 5.39% vs. WT= 72.53 ± 3.95%, p < 0.01). Myocardial T2* was significantly elevated in HCM across all cardiac phases (HCM = 12.14 ± 1.54 ms vs. WT = 7.93 ± 1.57 ms, p = 0.002). Strong correlations were observed between myocardial T2* and LV mass (rho = 0.88, p = 0.03). Conclusions: T2* was elevated in HCM with increased LV mass, highlighting the potential of T2* MRI as a sensitive biomarker for distinguishing healthy mice from those with HCM and revealing possible myocardial abnormalities.
1. Introduction
Hypertrophic cardiomyopathy (HCM) is a genetically driven cardiac disorder with a prevalence of 200 to 500 cases per 100,000 individuals [1,2]. It is most commonly caused by mutations in genes encoding sarcomeric proteins, particularly MYH7 (OMIM #115197) and MYBPC3 (OMIM #600958), yet its clinical presentation can differ widely in both age of onset and severity [3,4,5]. One of the major challenges in managing HCM lies in the early detection of myocardial alterations, such as myocardial fibrosis and microvascular dysfunction, that precede overt structural changes and may dynamically fluctuate throughout the cardiac cycle [6,7,8,9,10,11].
Magnetic resonance imaging (MRI) provides the means for myocardial tissue assessment in HCM. Current MRI approaches rely on covering a single cardiac phase, most often diastole [12]. While this strategy captures important structural information, it provides only a static snapshot of a highly dynamic organ. Key physiological properties, such as myocardial oxygenation, perfusion, and mechanical strain, vary significantly between systole and diastole [6,7,8], and these temporal fluctuations are likely to hold diagnostic relevance, particularly in the early stages of HCM when overt left ventricular hypertrophy (LVH) is absent.
Earlier studies have leveraged quantitative cardiac magnetic resonance (CMR) techniques, such as quantitative mapping of the MRI metric transversal effective relaxation time (T2*), to investigate these changes because of its sensitivity to myocardial oxygenation, perfusion, and fibrotic remodeling [13,14,15,16,17,18]. At ultrahigh magnetic field strengths, T2* values have been shown to correlate with myocardial wall thickness in HCM, suggesting increased sensitivity to early tissue abnormalities [19,20]. Ultrahigh field MRI enhances the signal-to-noise ratio and susceptibility contrast, enabling more precise detection of subtle myocardial changes that may be undetectable at lower magnetic field strengths [21,22]. However, implementing this approach in human studies remains technically challenging. Magnetohydrodynamic (MHD) effects distort the electrocardiogram (ECG) signal at high magnetic field strengths, which presents a challenge for the synchronization of data acquisition with cardiac activity [23,24,25]. These issues are particularly pronounced in small animal models due to their high heart rates [26].
To overcome these challenges and to capture myocardial T2* fluctuations across the cardiac cycle, we developed a retrospectively gated, cardiac phase-resolved T2* mapping technique that synchronizes image acquisition with the cardiac cycle, enabling the dynamic assessment of myocardial tissue properties [27,28]. To investigate the underlying mechanisms in a controlled setting, we back-translated clinical observations into a humanized HCM mouse model at a defined pathological stage. This approach captures dynamic changes that may be missed in conventional single-phase T2* mapping. By providing mechanistic insights into myocardial tissue alterations, this approach has the potential to refine clinical imaging strategies for earlier and more precise HCM detection, potentially improving risk stratification and patient management.
2. Materials and Methods
2.1. Mouse Model Carrying Human HCM Gene Mutation
All animal studies were designed and handled in accordance with ARRIVE guidelines, with EU Directive 2010/63/EU and Regulation (EU) 2019/1010, and were approved by the local state review board with ethical approval number G0257/18. The Mybpc3-KI HCM mouse model, carrying a heterozygous G > A point mutation on the last nucleotide of exon 6 in the myosin binding protein C3 (Mybpc3) gene on a C57BL/6J background [29], was bred and maintained in the institutional animal facility to generate homozygous Mybpc3-KI (KI) mice and their wild-type (WT) littermate controls. Both sexes were included to account for potential sex-based differences in disease progression. In total, 3 female and 3 male WT mice, along with 3 female and 3 male KI mice aged 6–11 weeks old were used for in vivo cardiac MRI.
2.2. Free Breathing, Cardiac Phased-Resolved T2* Mapping
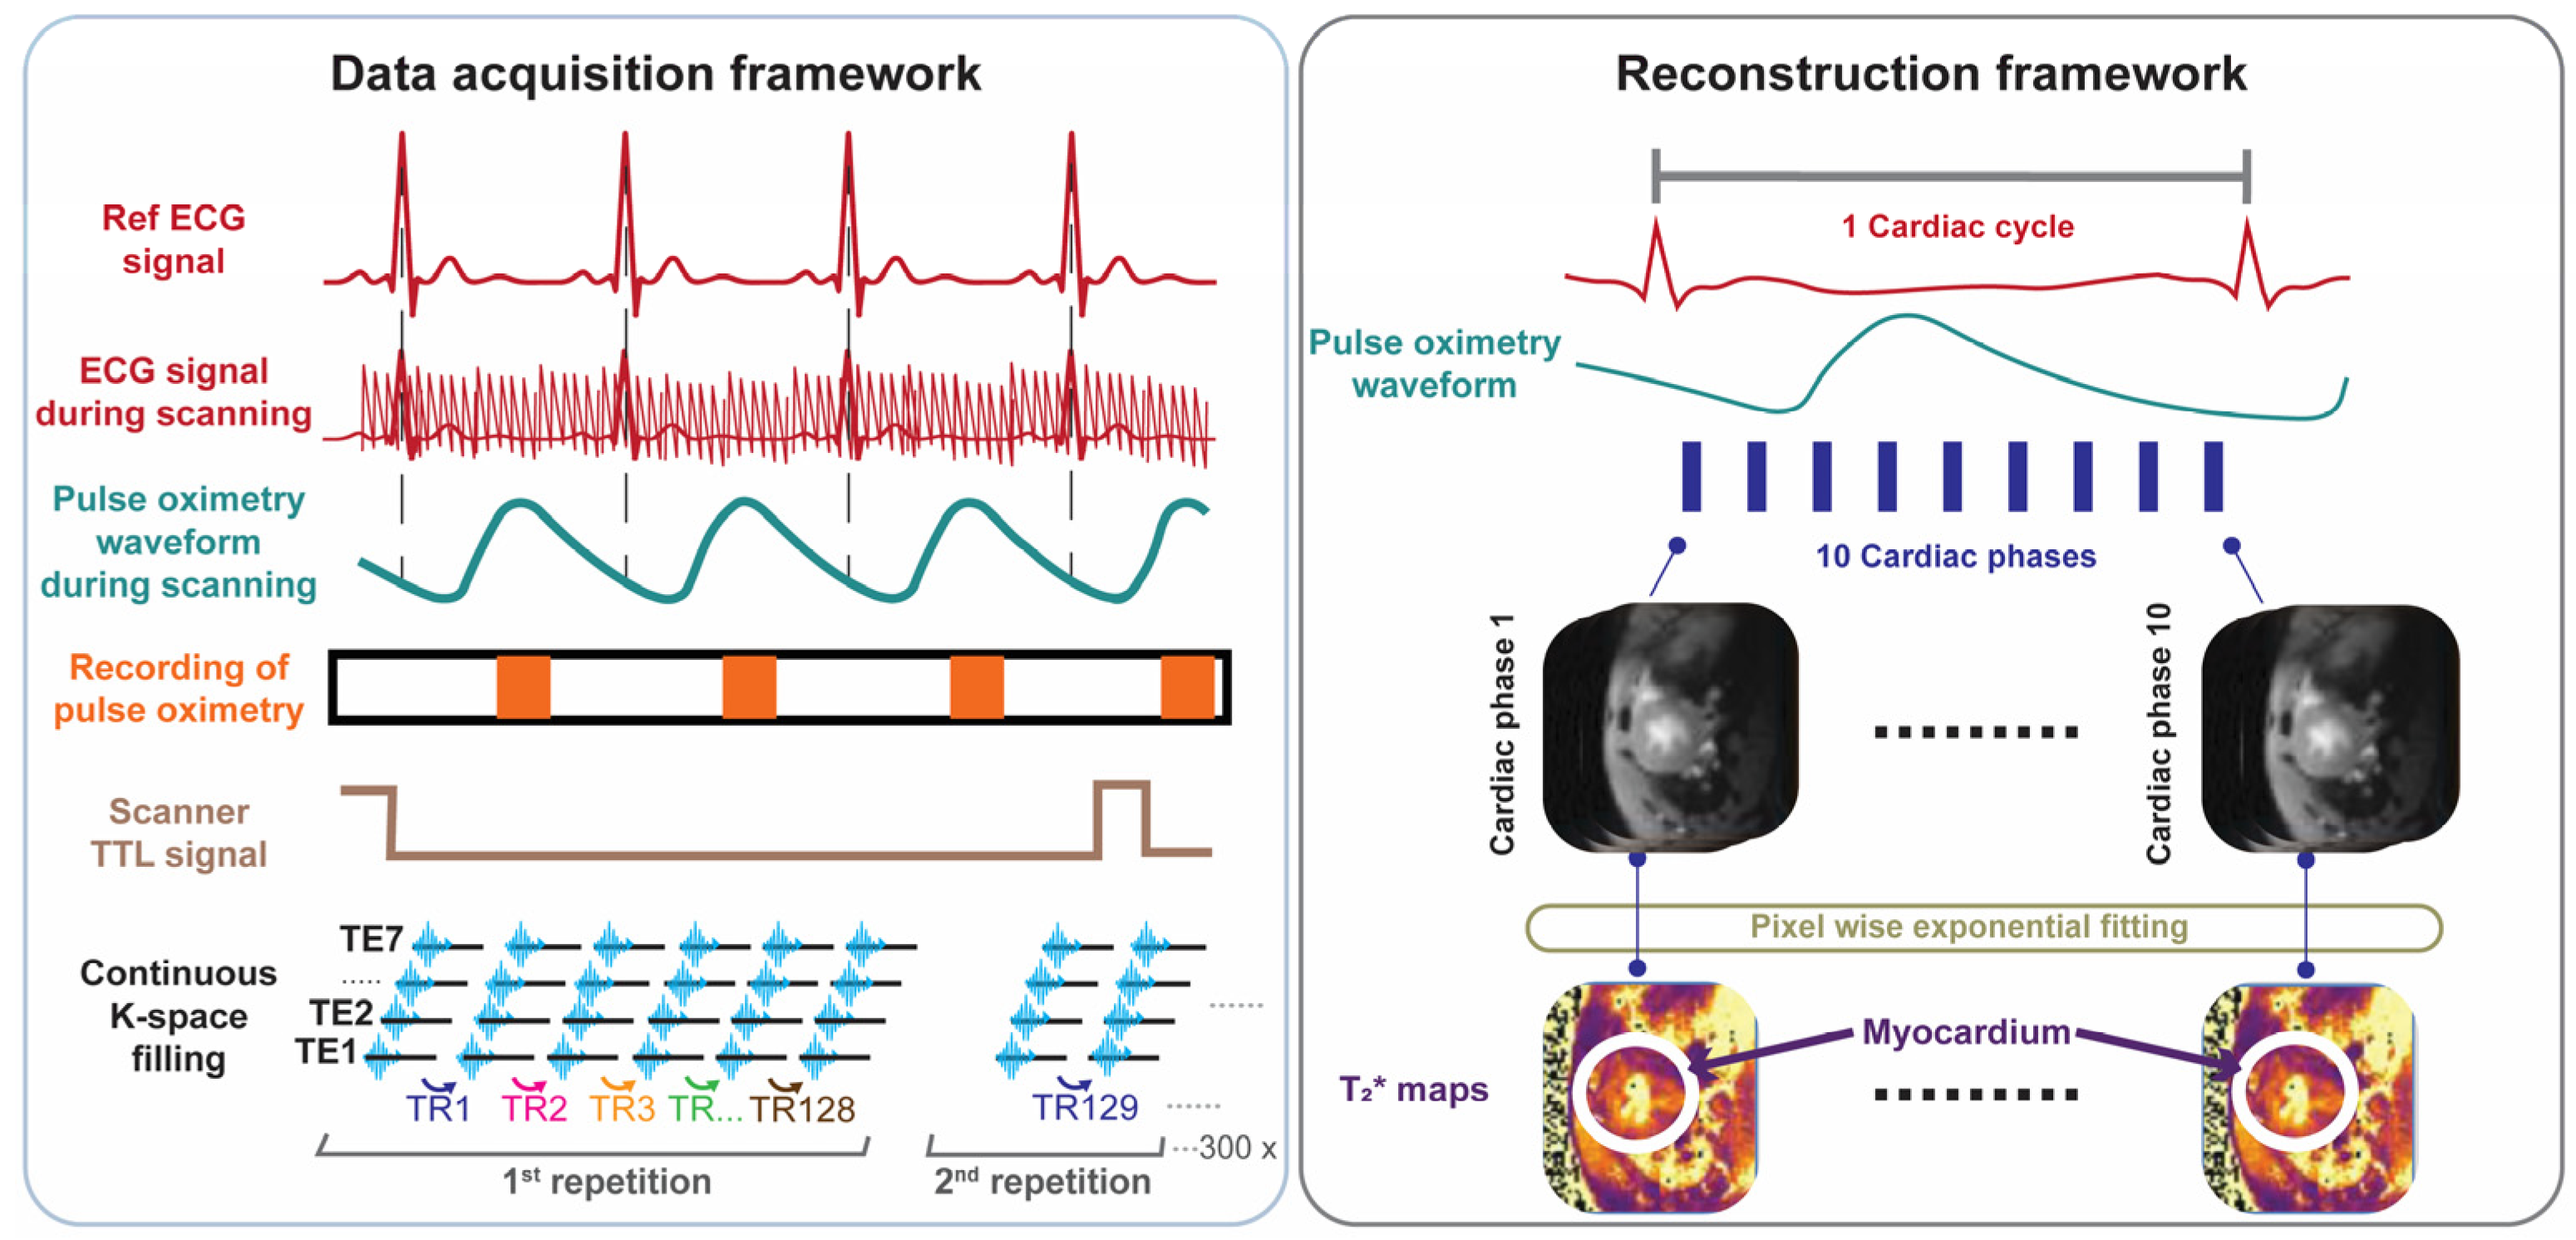
For probing T2* across the cardiac cycle we developed, implemented, and validated free breathing, retrospectively gated cardiac phase-resolved T2* mapping with full R-R interval coverage. This approach involves continuous acquisition of multi-gradient-echo (MGE) data during cardiac motion (Figure 1). Reconstruction of the cardiac phase-resolved images is based on the timing of the cardiac events. This technique relies on sorting raw data into cardiac phases using external cardiac triggering signals, such as those derived from pulse oximetry or simulated heartbeats. Retrospective gating was used to enable image reconstruction for each phase of the cardiac cycle and to facilitate probing myocardial T2* dynamics across all cardiac phases.

Figure 1.
Data acquisition and retrospective gated image reconstruction scheme used for cardiac phase-resolved, whole cardiac cycle T2* mapping of the mouse heart. Data acquisition framework: MRI data acquisition is performed continuously. Synchronization is achieved by recording the pulse-oximetry trace and the scanner’s TTL trigger signal. Following data collection, retrospective gating based on recorded signals is performed. Reconstruction framework: Each k-space line is assigned to the corresponding cardiac phase and then averaged to yield 10 cardiac phases, each with 7 echoes obtained for different echo times. T2* maps are generated via pixel-wise mono-exponential fitting of the T2* signal decay.
To validate the retrospectively gated cardiac phase-resolved T2* mapping approach, we performed a phantom study using simulated heart beats for reconstruction. An NMR tube phantom containing six different iron concentrations (0.75–5 µL ferumoxytol/mL distilled water, ferumoxytol stock solution (0.03 g/mL iron) was prepared to mimic myocardial T2* properties (T2* = 4–20 ms) at 9.4T. The phantom was scanned using a fully sampled 2D multi-gradient-echo (MGE) sequence with 300 continuous measurements and linear sequential Cartesian phase-encoding. To test the robustness of the reconstruction method, artificial heartbeat patterns mimicking the typical mouse heart rate range were emulated. For validation, various conditions were examined, including different repetition numbers, cardiac phase timing variations, and variable cardiac cycle durations typical of mouse imaging conditions. Second-order B0 shimming was applied to minimize magnetic field inhomogeneity while image quality was assessed using signal-to-noise ratio (SNR) measurements following the National Electrical Manufacturers Association (NEMA) single-image method [30]. Two reconstruction approaches were compared: a conventional MGE reconstruction (reference method) and a retrospective binning method that sorted data based on the simulated cardiac timing and the scanner’s binary Transistor–Transistor Logic (TTL) output signal (detailed parameters of the MRI protocol are provided in Table 1).

Table 1.
Summary of the MRI parameters used in the phantom and in the in vivo studies. The parameters used for multi-echo gradient-echo (MGE) MRI using conventional reconstruction (reference) and retrospective binning MGE are identical.
2.3. In Vivo Cardiac MRI
In vivo cardiac MRI was conducted on a 9.4T small bore animal MRI system (BioSpec 94/20, Bruker BioSpin, Ettlingen, Germany) using a 72 mm linear volume resonator for transmission and a 4-channel surface cardiac RF array for signal reception (Bruker BioSpin MRI GmbH, Ettlingen, Germany). The mice were anesthetized using 3% isoflurane (CP-Pharma, Burgdorf, Germany) in 300 mL/min medical air and 250 mL/min oxygen, and maintained at 1 to 1.5% isoflurane after induction throughout the imaging. Their heart rate, respiration, and core body temperature were monitored using a gating system (Model 1030, SA Instruments Inc., New York, NY, USA). Two-dimensional CINE images of the whole heart were acquired for cardiac chamber quantification and for cardiac function assessment. For this purpose, 7–8 short axis (SAX) slices covering the whole heart were consecutively acquired using self-gated bright-blood CINE IntraGate-FLASH with scanning parameters provided in Table 1.
2.4. Cardiac Phase-Resolved T2* Mapping
Following phantom validation, the retrospectively gated cardiac phase-resolved T2* mapping method was implemented for in vivo mouse imaging covering a mid-ventricular slice of a short axis view (SAX) of the heart. Before MGE data acquisition, and to minimize off-resonance artifacts, the 2nd order shimming ROI was positioned as tightly as possible around the myocardium, ensuring minimal artifact interference in critical regions near the air–tissue interface. During data acquisition, MGE raw data were continuously acquired using sequential linear phase encoding (Figure 1). Simultaneously, a cardiac triggering signal was recorded using fiber optic pulse oximetry (Model 1030, SA Instruments Inc., New York, NY, USA) along with a TTL output signal generated by the pulse sequence, indicating the start and the end of each whole k-space measurement. Both signals were simultaneously recorded and digitized using an analog-to-digital converter (DT 9800-16SE-BNC, Data Translation GmbH, Bietigheim-Bissinge, Germany) and exported through simplified data acquisition software (HSE-Haemodyn, Version 1.5, Hugo Sachs Elektronik–Harvard Apparatus GmbH, March-Hugstetten, Germany).
Each k-space readout obtained for all of the echoes was binned into the corresponding cardiac phases based on MRI data acquisition timestamps, obtained from the TTL recordings, and pulse oximetry peaks. R-R intervals deviating by more than 5% from the moving median of 10 consecutive heartbeats were excluded to prevent errors caused by pulse-oximetry trigger failures, which sometimes resulted in incorrect cardiac cycle durations. This method, adapted from Di Sopra et al. [31], helped remove outliers while capturing natural variations in the heart rate.
Based on the validation study in phantoms, the number of cardiac phases of 10 was set to reconstruct the cardiac phase-resolved multi-gradient-echo images followed by T2* quantification, as outlined in the reconstruction framework shown in Figure 1. A total of 10 cardiac phases were chosen to balance the competing constraints of temporal resolution, image quality, heart rate, and hardware limitations to ensure reliable T2* quantification while maintaining a feasible scan time. By using a short TR (~100 ms) and carefully optimized TE inter-echo spacing across multiple echoes, we achieved sufficient temporal resolution to capture the key cardiac phases—especially end-systole—within a ~10-min scan. This configuration allowed for accurate T2* curve fitting while staying within the duty cycle limits of the gradient system, making it well-suited for retrospective cardiac–respiratory gated small animal MRI.
The allocated k-space lines for each phase and gradient-echo were processed with a reconstruction pipeline, including zero- and first-order phase correction, complex averaging, and fast Fourier transform (FFT) (Figure 1). The multi-gradient-echo data obtained for each cardiac phase were used for pixelwise mono-exponential fitting to generate a T2* map for each distinct cardiac phase (Figure 1). A cardiac phase shift correction was applied to ensure that the first phase aligns with the onset of systole.
Data sorting, image reconstruction, and T2* quantification were performed offline in a workstation using custom-developed MATLAB (R2021a; MathWorks, Inc., Natick, MA, USA) scripts.
2.5. Data Analysis
Cardiac chamber quantification and cardiac function assessment were performed using manual segmentation based on the AHA 17-segment model in the open-source software Segment v4.0 R11044b (Medviso, segment.heiberg.se, Lund, Sweden) [32]. Endo- and epicardial borders were manually segmented in end-systole and end-diastole using a stack of SAX views derived from CINE imaging. From these segmentations, left ventricular (LV) ejection fraction (EF), LV myocardial mass, and LV wall thickness were calculated. End-diastolic volume (EDV) and end-systolic volume (ESV) were derived to quantify the volumetric status of the LV at maximum filling and maximum contraction.
For T2* assessment, a ROI covering the myocardium of the left ventricle was defined. The mask was manually drawn using a home-built segmentation code in MATLAB. The T2* of all pixels within the myocardial ROI was averaged for further analysis.
2.6. Statistical Analysis
Experimental statistics were conducted, and graphs were generated in R studio version 4.4.1 (R Studio Inc., Boston, MA, USA; http://www.rstudio.com/) and MATLAB.
For the phantom study, T2* measurements were analyzed using both the retrospective gating method and the reference method, and their agreement was assessed using linear regression and Pearson’s R2. Intraclass correlation coefficients (ICCs) were determined to examine the agreement between both methods. For the animal study (n = 12), non-parametric tests were used: Mann–Whitney U for group comparisons, Spearman correlation for relationships, and the Friedman test for T2* differences across the cardiac phases. The Friedman test statistic (χ2: Chi-squared) quantifies the magnitude of differences across repeated measurements within groups. When the Friedman test indicated significant differences, post hoc pairwise comparisons were performed using Wilcoxon signed-rank tests with Holm’s correction. For the Spearman correlation, rho (ρ) was used as the correlation coefficient, with correlation strength defined as follows: very weak (0.00–0.19), weak (0.20–0.39), moderate (0.40–0.59), strong (0.60–0.79), and very strong (0.80–1.00). Differences were considered statistically significant with * p < 0.05 with ** p < 0.01, *** p < 0.001.
3. Results
3.1. Validation in Phantom Study
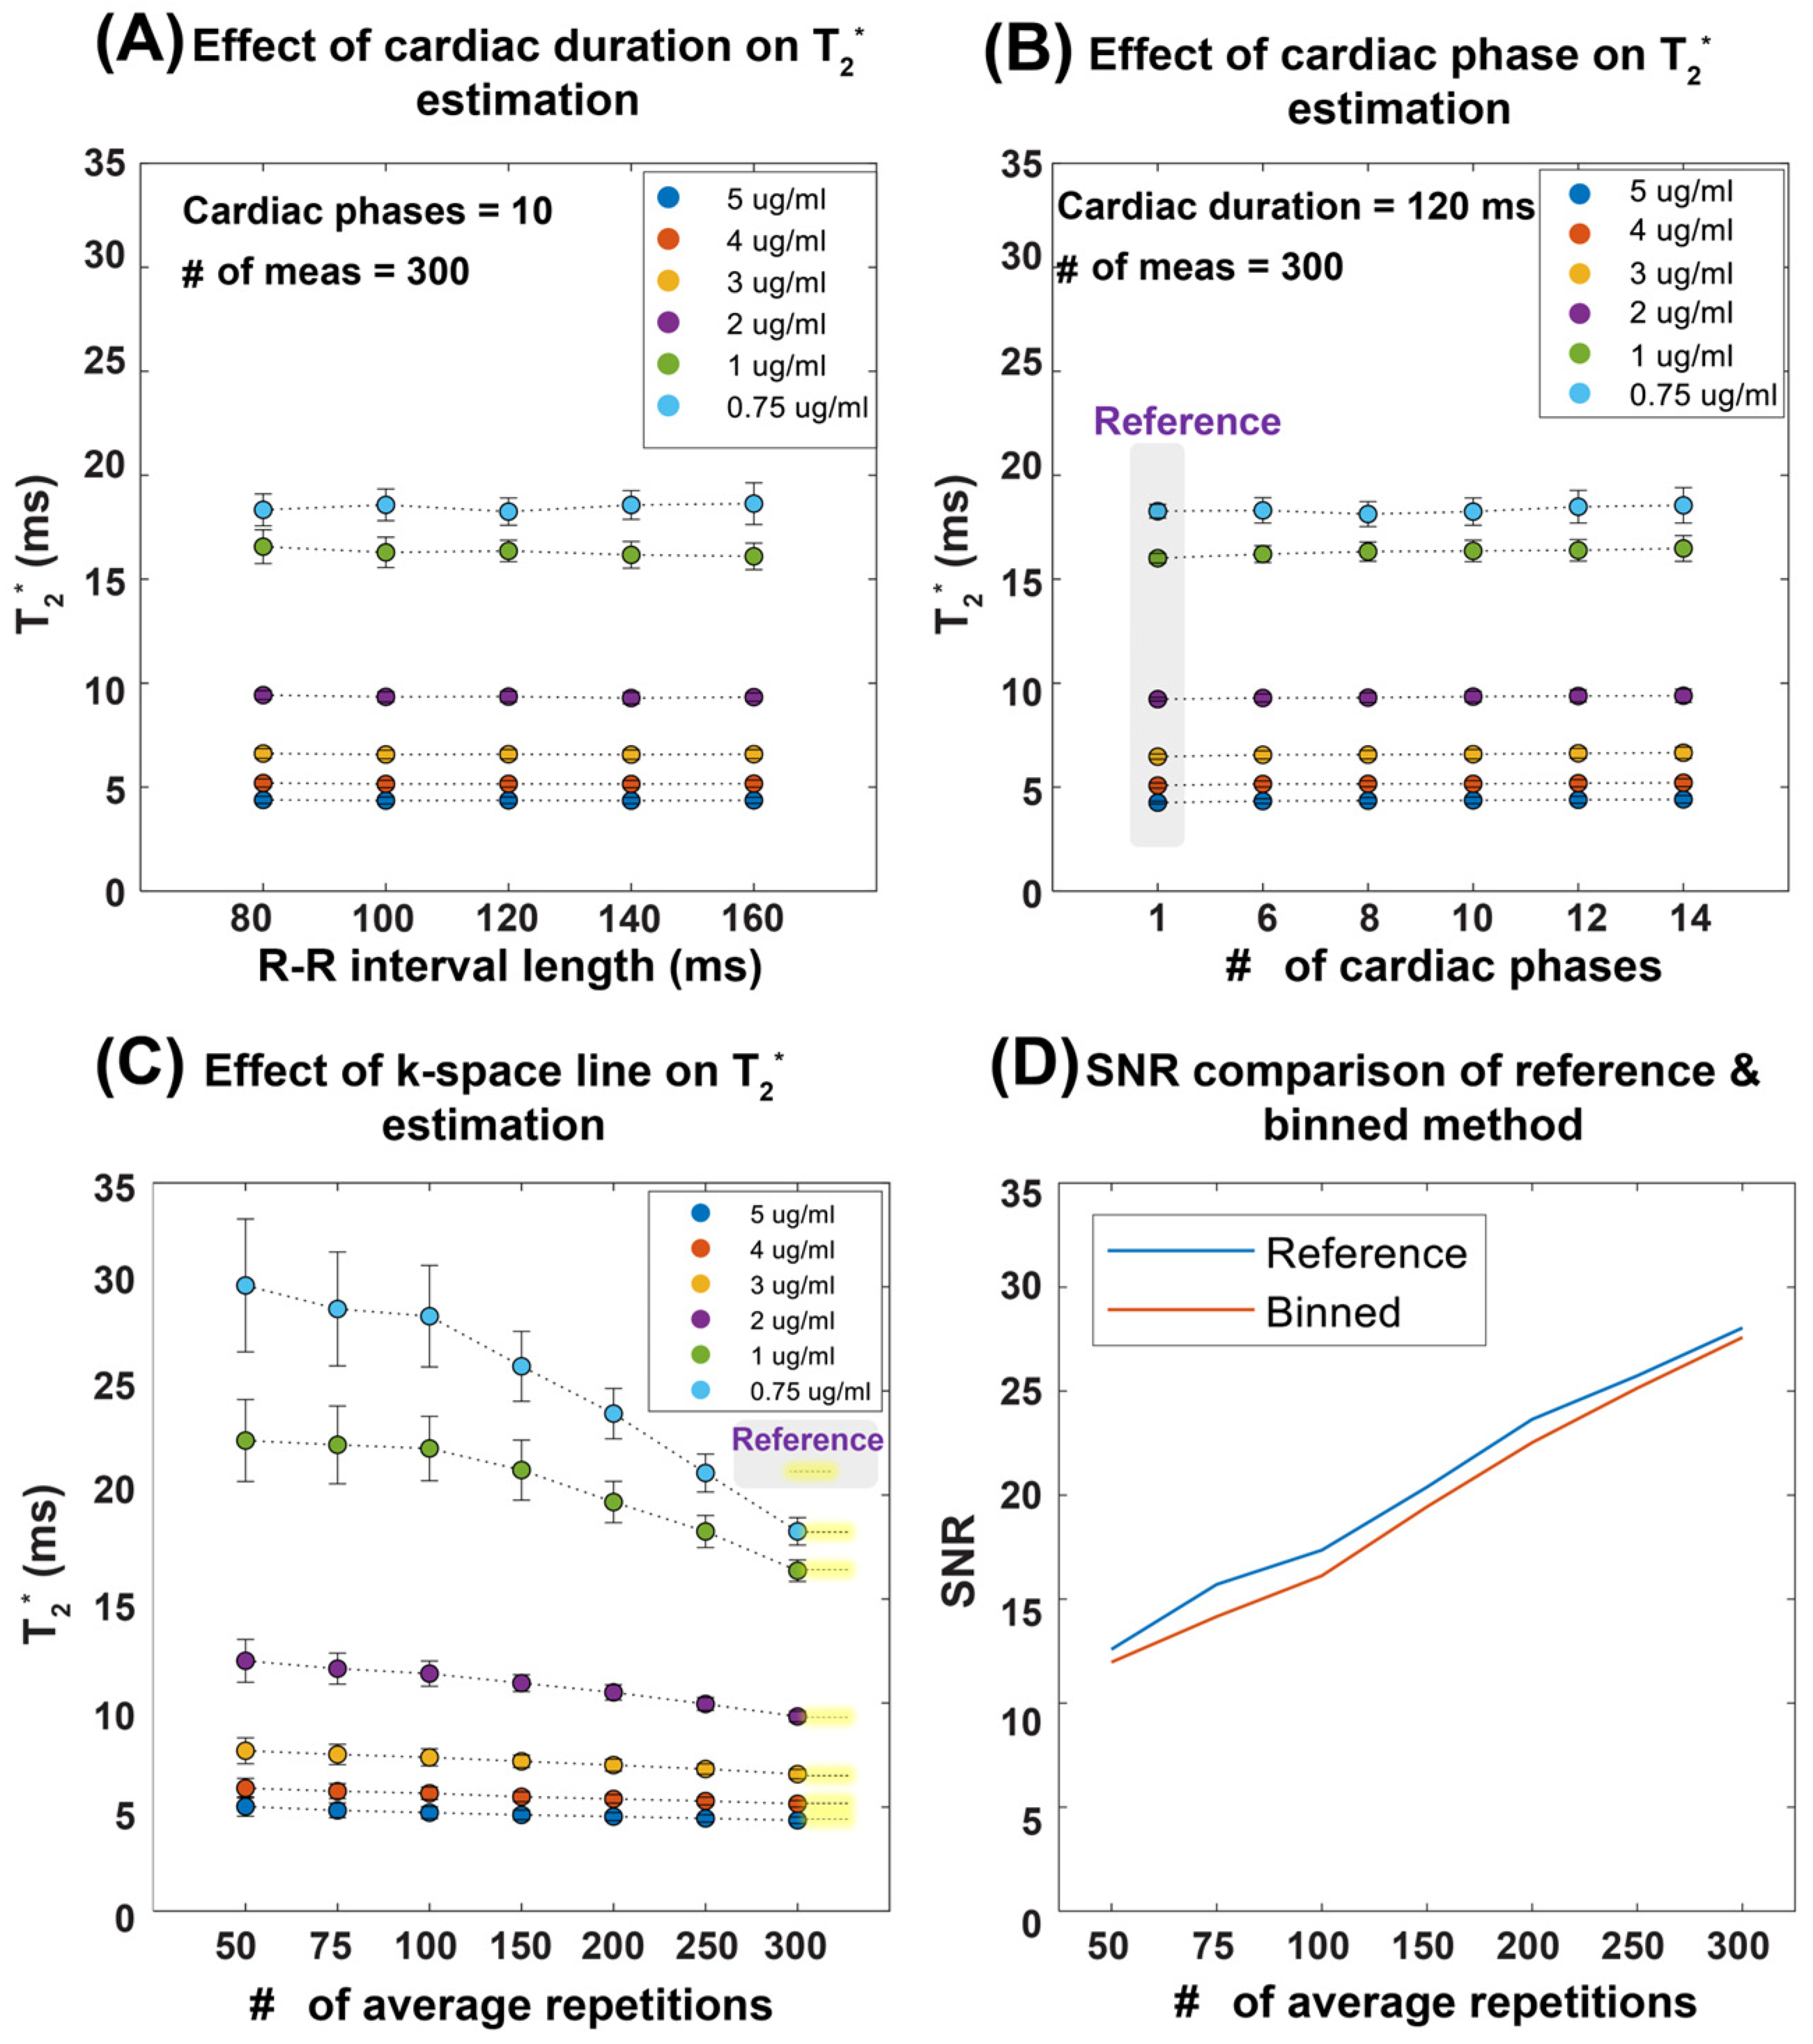
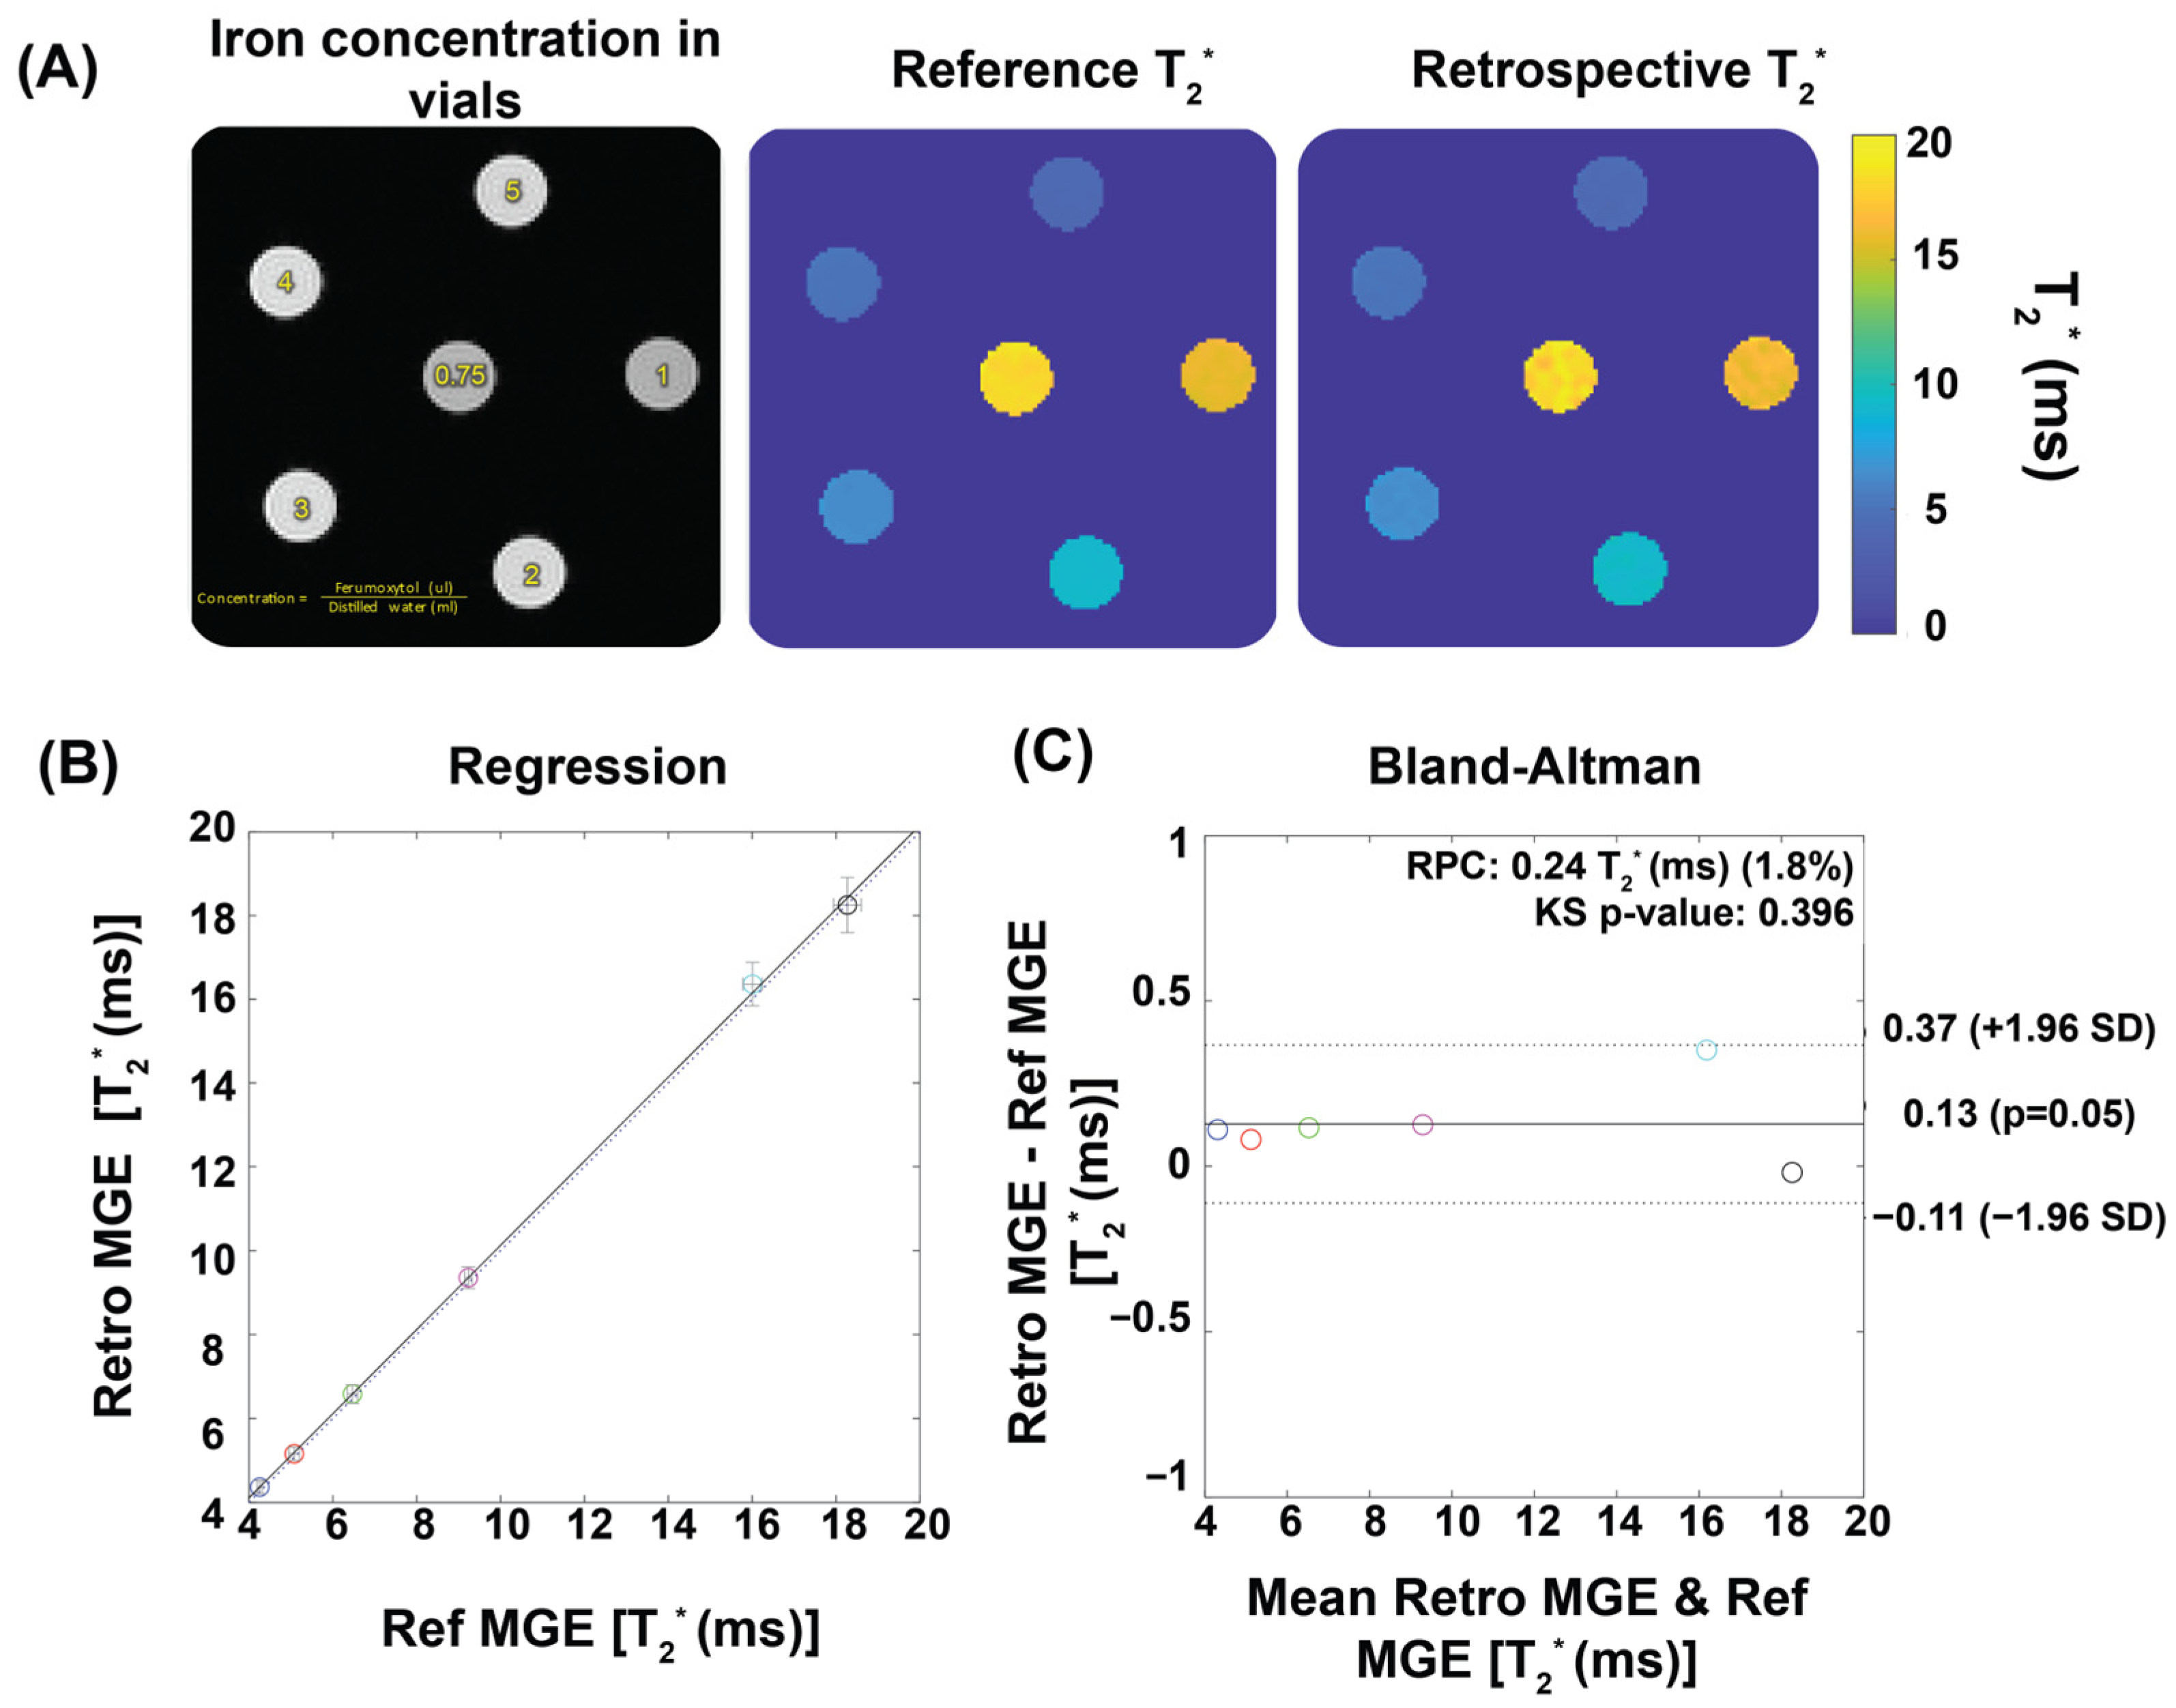
Figure 2 demonstrates the performance of our T2* mapping approach under different conditions with consistent results obtained for a large range of R-R intervals covering 80–160 ms. The accuracy improved with an increased number of repetitions, while retrospective binning slightly reduced the signal-to-noise ratio (SNR) without altering overall trends (Figure 2A–D). Figure 3 shows T2* maps derived from the reference method and the binning approach using real mouse pulse-oximetry signals. The regression and Bland–Altman plots confirm strong agreement between both methods (R2 = 1, ICC~1), supporting the robustness of retrospective binning.
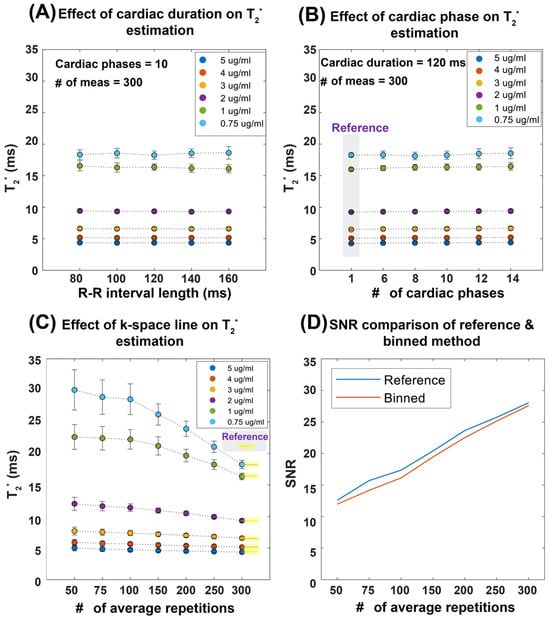
Figure 2.
Summary of results obtained from the validation of temporal phase-resolved, retrospectively gated T2* mapping in a phantom study. To emulate the in vivo situation, a simulated heart rate was used. The T2* mapping performance was evaluated as a function of the heart period, the number of cardiac phases, and the number of repetitions (average). (A) Robustness of the proposed binning method against R-R interval length, mimicking the in vivo situation. (B) Effect of the number of cardiac phases with a total cardiac phase of one representing a static acquisition without binning, used as the reference. (C) The impact of averaging, showing that, as the number of repetitions increases, the T2* values converge toward the reference, particularly at 300 repetitions. Averaging is performed in the k-space domain. (D) The relationship between SNR and the number of averages for a representative vial with 0.75 µg ferumoxytol per ml of distilled water, illustrating that both the reference and retrospective gating methods exhibit similar SNR trends, though the binning approach results in slightly lower SNR values compared to the reference protocol. Abbreviations: Card Dur: cardiac duration, # of Meas: number of measurements.
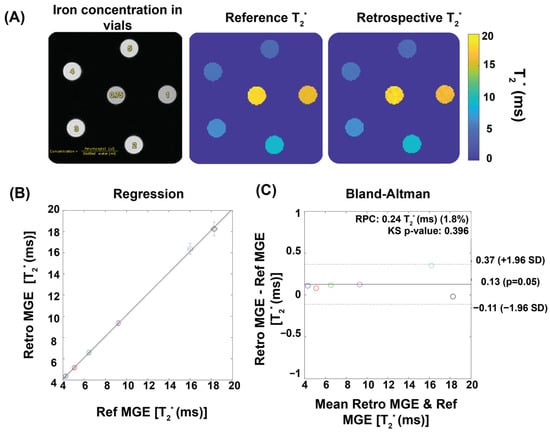
Figure 3.
Validation of temporal phase-resolved T2* mapping for phantoms using ferumoxytol solutions to mimic myocardial T2* properties. (A) Qualitative comparison of T2* maps. An exemplary first echo image (TE = 1.5) of six iron concentrations reconstructed by the retrospective gating approach together with T2* maps of the phantom obtained from reference MGE and from a retrospective gating MGE sorted by a real pulse-oximetry signal recorded from a mouse. (B) The retrospective gating approach shows strong correlation with the reference method, as indicated by R2 ~ 1. The dotted line shows the identity line, while the solid line illustrates the linear regression fitting. The correlation was assessed using Pearson’s regression. (C) The Bland–Altman plot demonstrates a good agreement between the reference and the retrospective gating approach. Each colored circle represents a different ferumoxytol concentration. The dashed lines indicate a confidence level of 95%, while the continuous lines depict the average percentage variances.
3.2. Mouse Model Carrying Mybpc3 Gene Mutation Shows HCM Phenotype Revealed by CMR
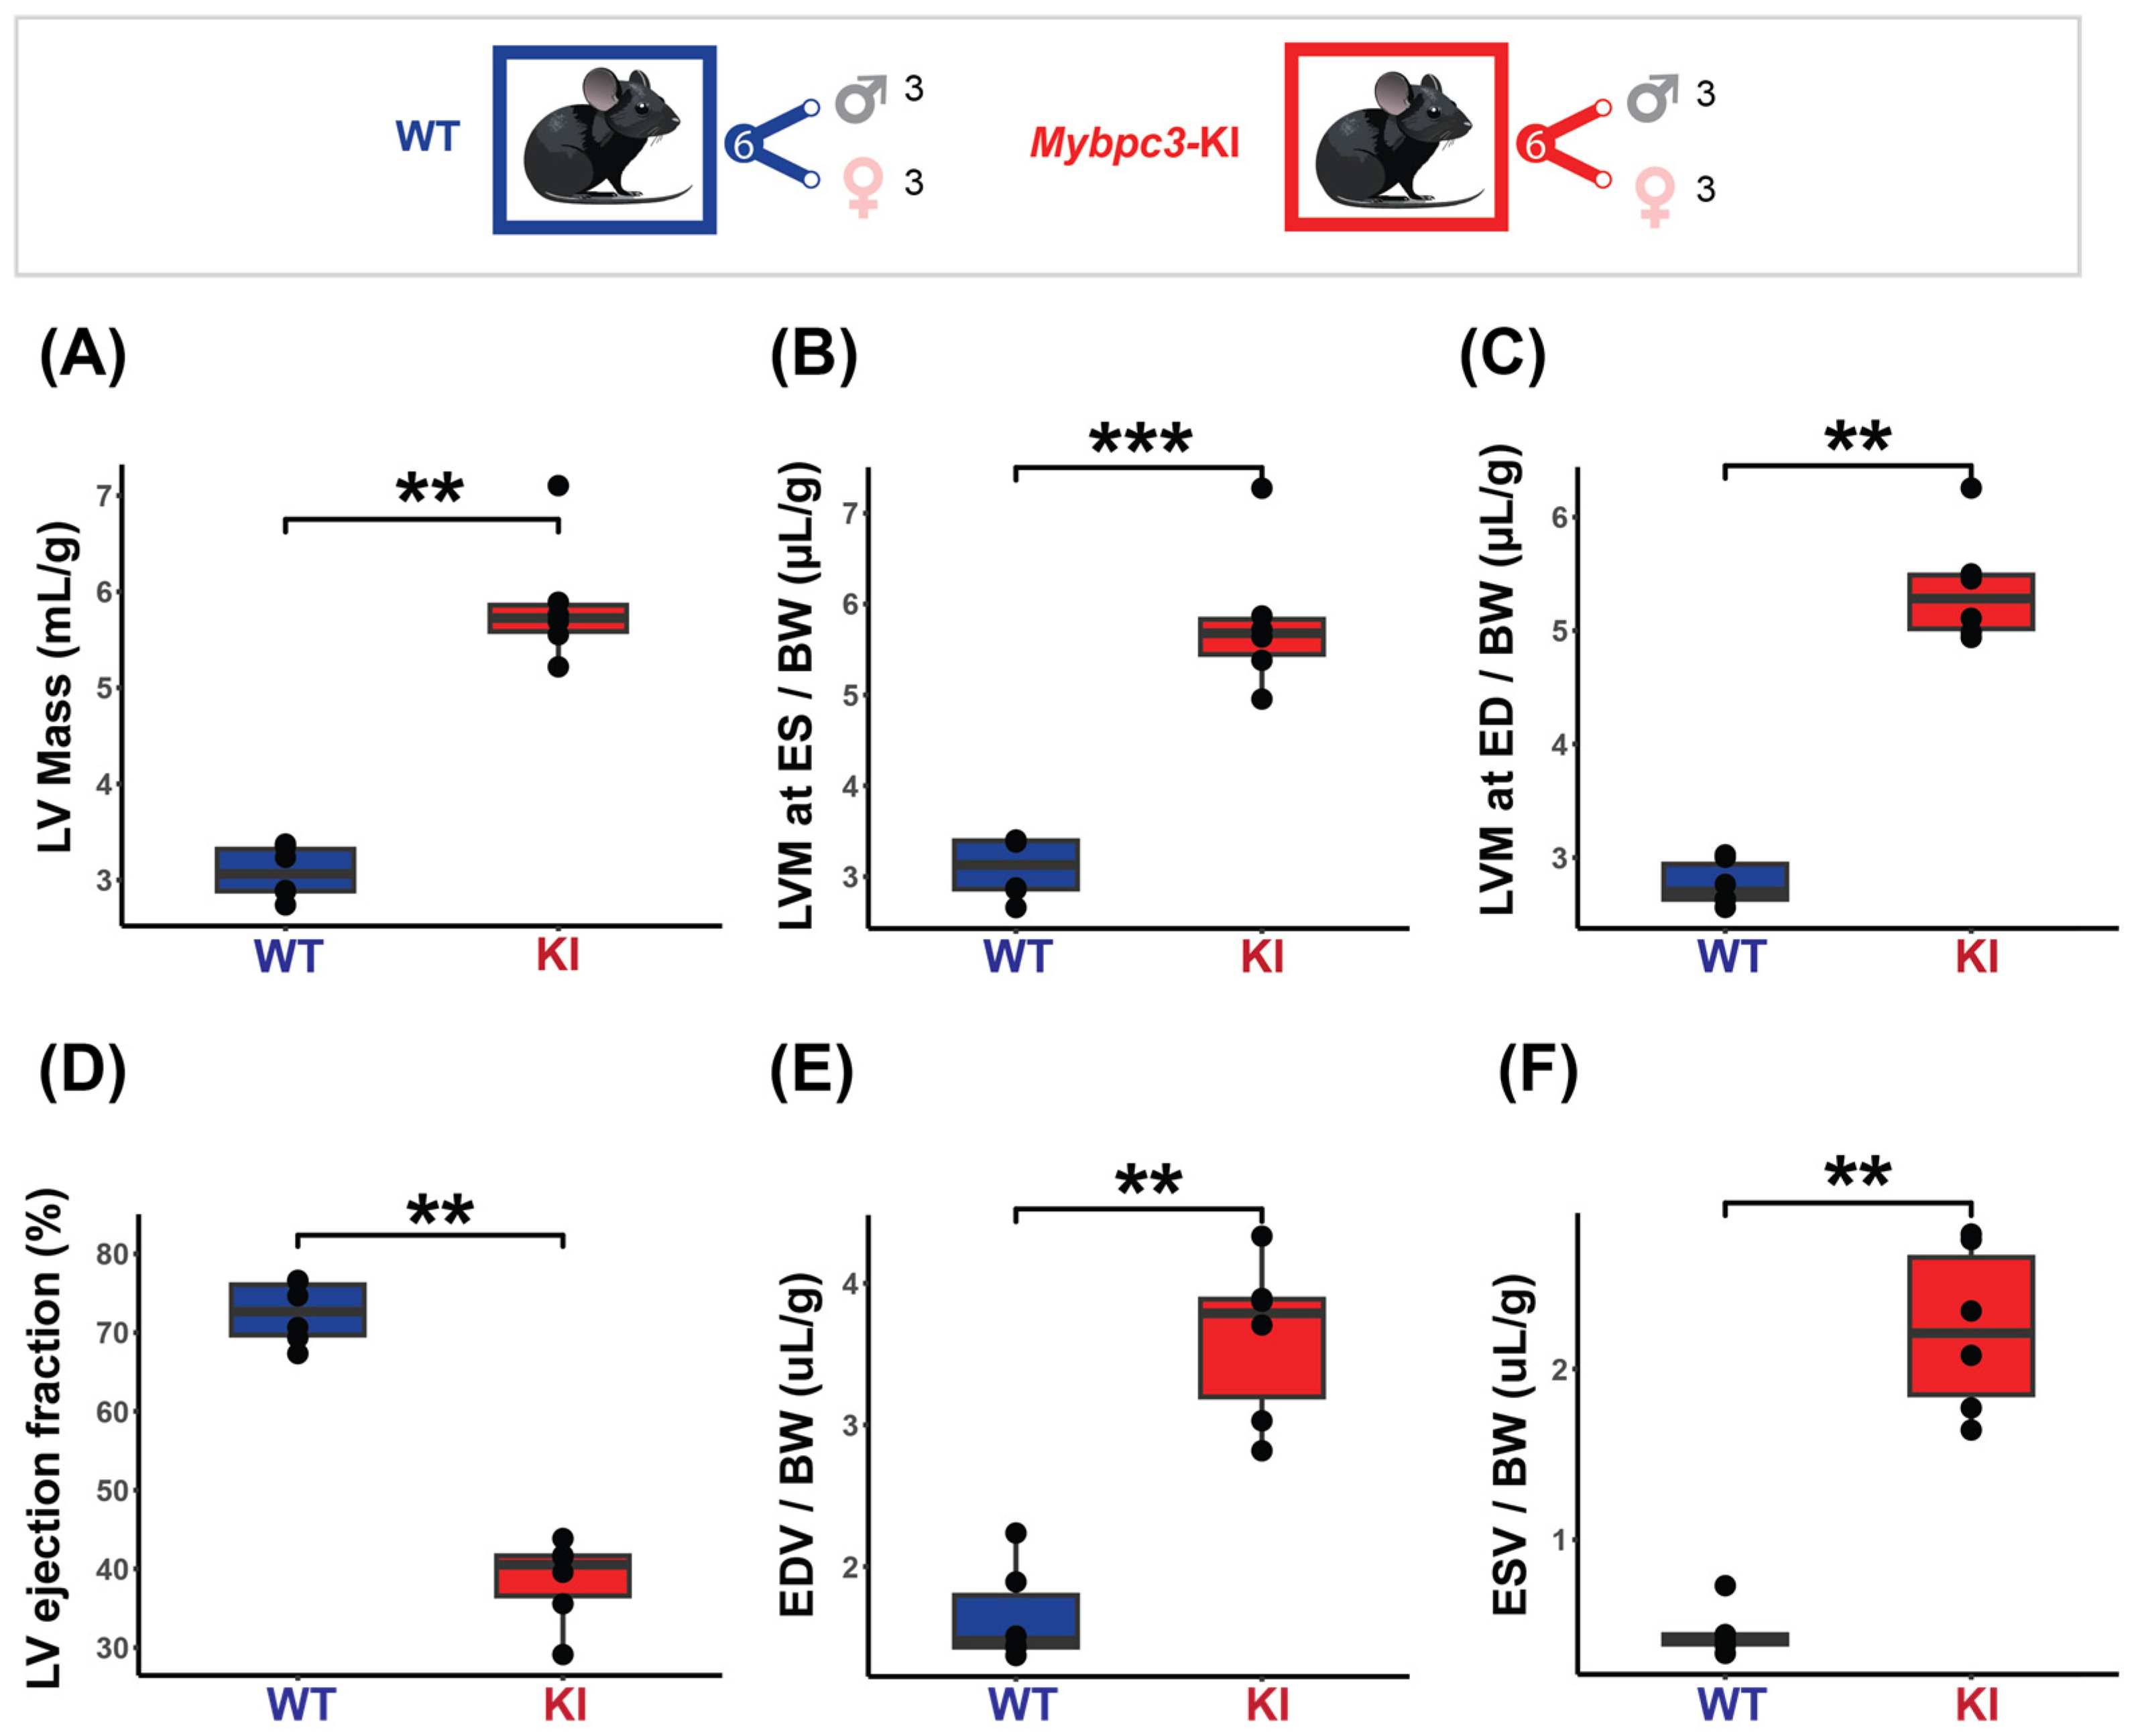
The results obtained from the cardiac chamber quantification and the cardiac function assessment in the HCM model are summarized in Figure 4. To ensure comparability and account for size-related differences, all measurements were normalized to body weight. The HCM mice displayed pronounced cardiac hypertrophy, with increased LV mass at ED (KI = 5.37 ± 0.49 µg/g vs. WT = 2.77 ± 0.20 µg/g, p < 0.01) and ES (KI = 5.81 ± 0.79 µg/g vs. WT = 3.09 ± 0.33 µg/g, p < 0.001) (Figure 4A–C). Regional LV wall thickness was not uniformly increased, with the overall mid and apical regions being significantly thicker in the HCM mice (KI LVT Mid = 50.08 ± 4.68 µm/g vs. WT LVT Mid = 45.80 ± 20.07 µm/g, p < 0.01, KI LVT Apical = 51.72 ± 5.76 µm/g vs. WT LVT Apical = 40.50 ± 13.18 µm/g, p < 0.01). A significantly lower LVEF was found in the HCM mice (KI = 38.55 ± 5.39% vs. WT = 72.53 ± 3.95%, p < 0.01, Figure 4D). The EDV and ESV were also significantly higher in the HCM mice (KI EDV = 3.61 ± 0.57 µL/g vs. WT EDV = 1.65 ± 0.34 µL/g, p < 0.01), (KI ESV = 2.23 ± 0.49 µL/g vs. WT ESV = 0.46 ± 0.14 µL/g, p < 0.01 (Figure 4E,F). No significant correlation between LVEF and LV mass was found (KI rho = −0.43, p = 0.4; WT rho = −0.23, p = 0.7).
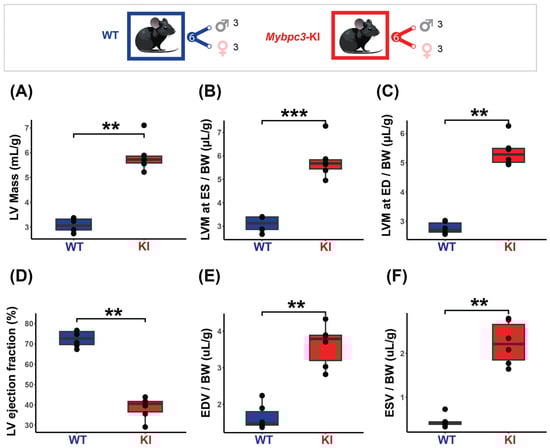
Figure 4.
Characterization of the mice cohort using in vivo cardiac MRI shows severe cardiac dysfunction in the HCM (Mybpc3-KI) mice. Top: Mice cohort included the Mybpc3-KI mice (male: n = 3, female: n = 3) that were compared to the WT mice (male: n = 3, female: n = 3). (A) LV mass normalized to body weight showing significant increase in the Mybpc3-KI mice compared to the WT mice. (B,C) LV mass comparison at both end systole (ES) and end diastole (ED) demonstrates severe hypertrophy in the Mybpc3-KI mice compared to the WT mice. (D) Cardiac chamber quantification and functional assessments, including left ventricular ejection fraction (LVEF), were conducted on a slice-by-slice basis using manually segmented endo- and epi-cardiac borders in end-systole and end-diastole obtained from short-axis 2D CINE images. LVEF assessment reveals a significant decrease in the Mybpc3-KI mice compared to the WT groups. (E,F) Higher ES and ED volumes in the Mybpc3-KI mice indicates reduced cardiac contractility and possible ventricular dilation. All data are presented as a mean ± standard error of the mean. Due to the relatively small sample size in this study, a non-parametric Mann–Whitney U test was used to compare differences in variable distributions between the HCM and the control groups. ** p < 0.01, *** p < 0.001. Abbreviations: LV: left ventricle; LVM: left ventricular mass; BW: body weight; ED: end diastole; ES: end systole; ESV: end systolic volume; EDV: end diastolic volume; KI: Mybpc3-KI; WT: wild type.
3.3. Cardiac Phase-Resolved T2* Mapping Detects Changes Across the Cardiac Phases
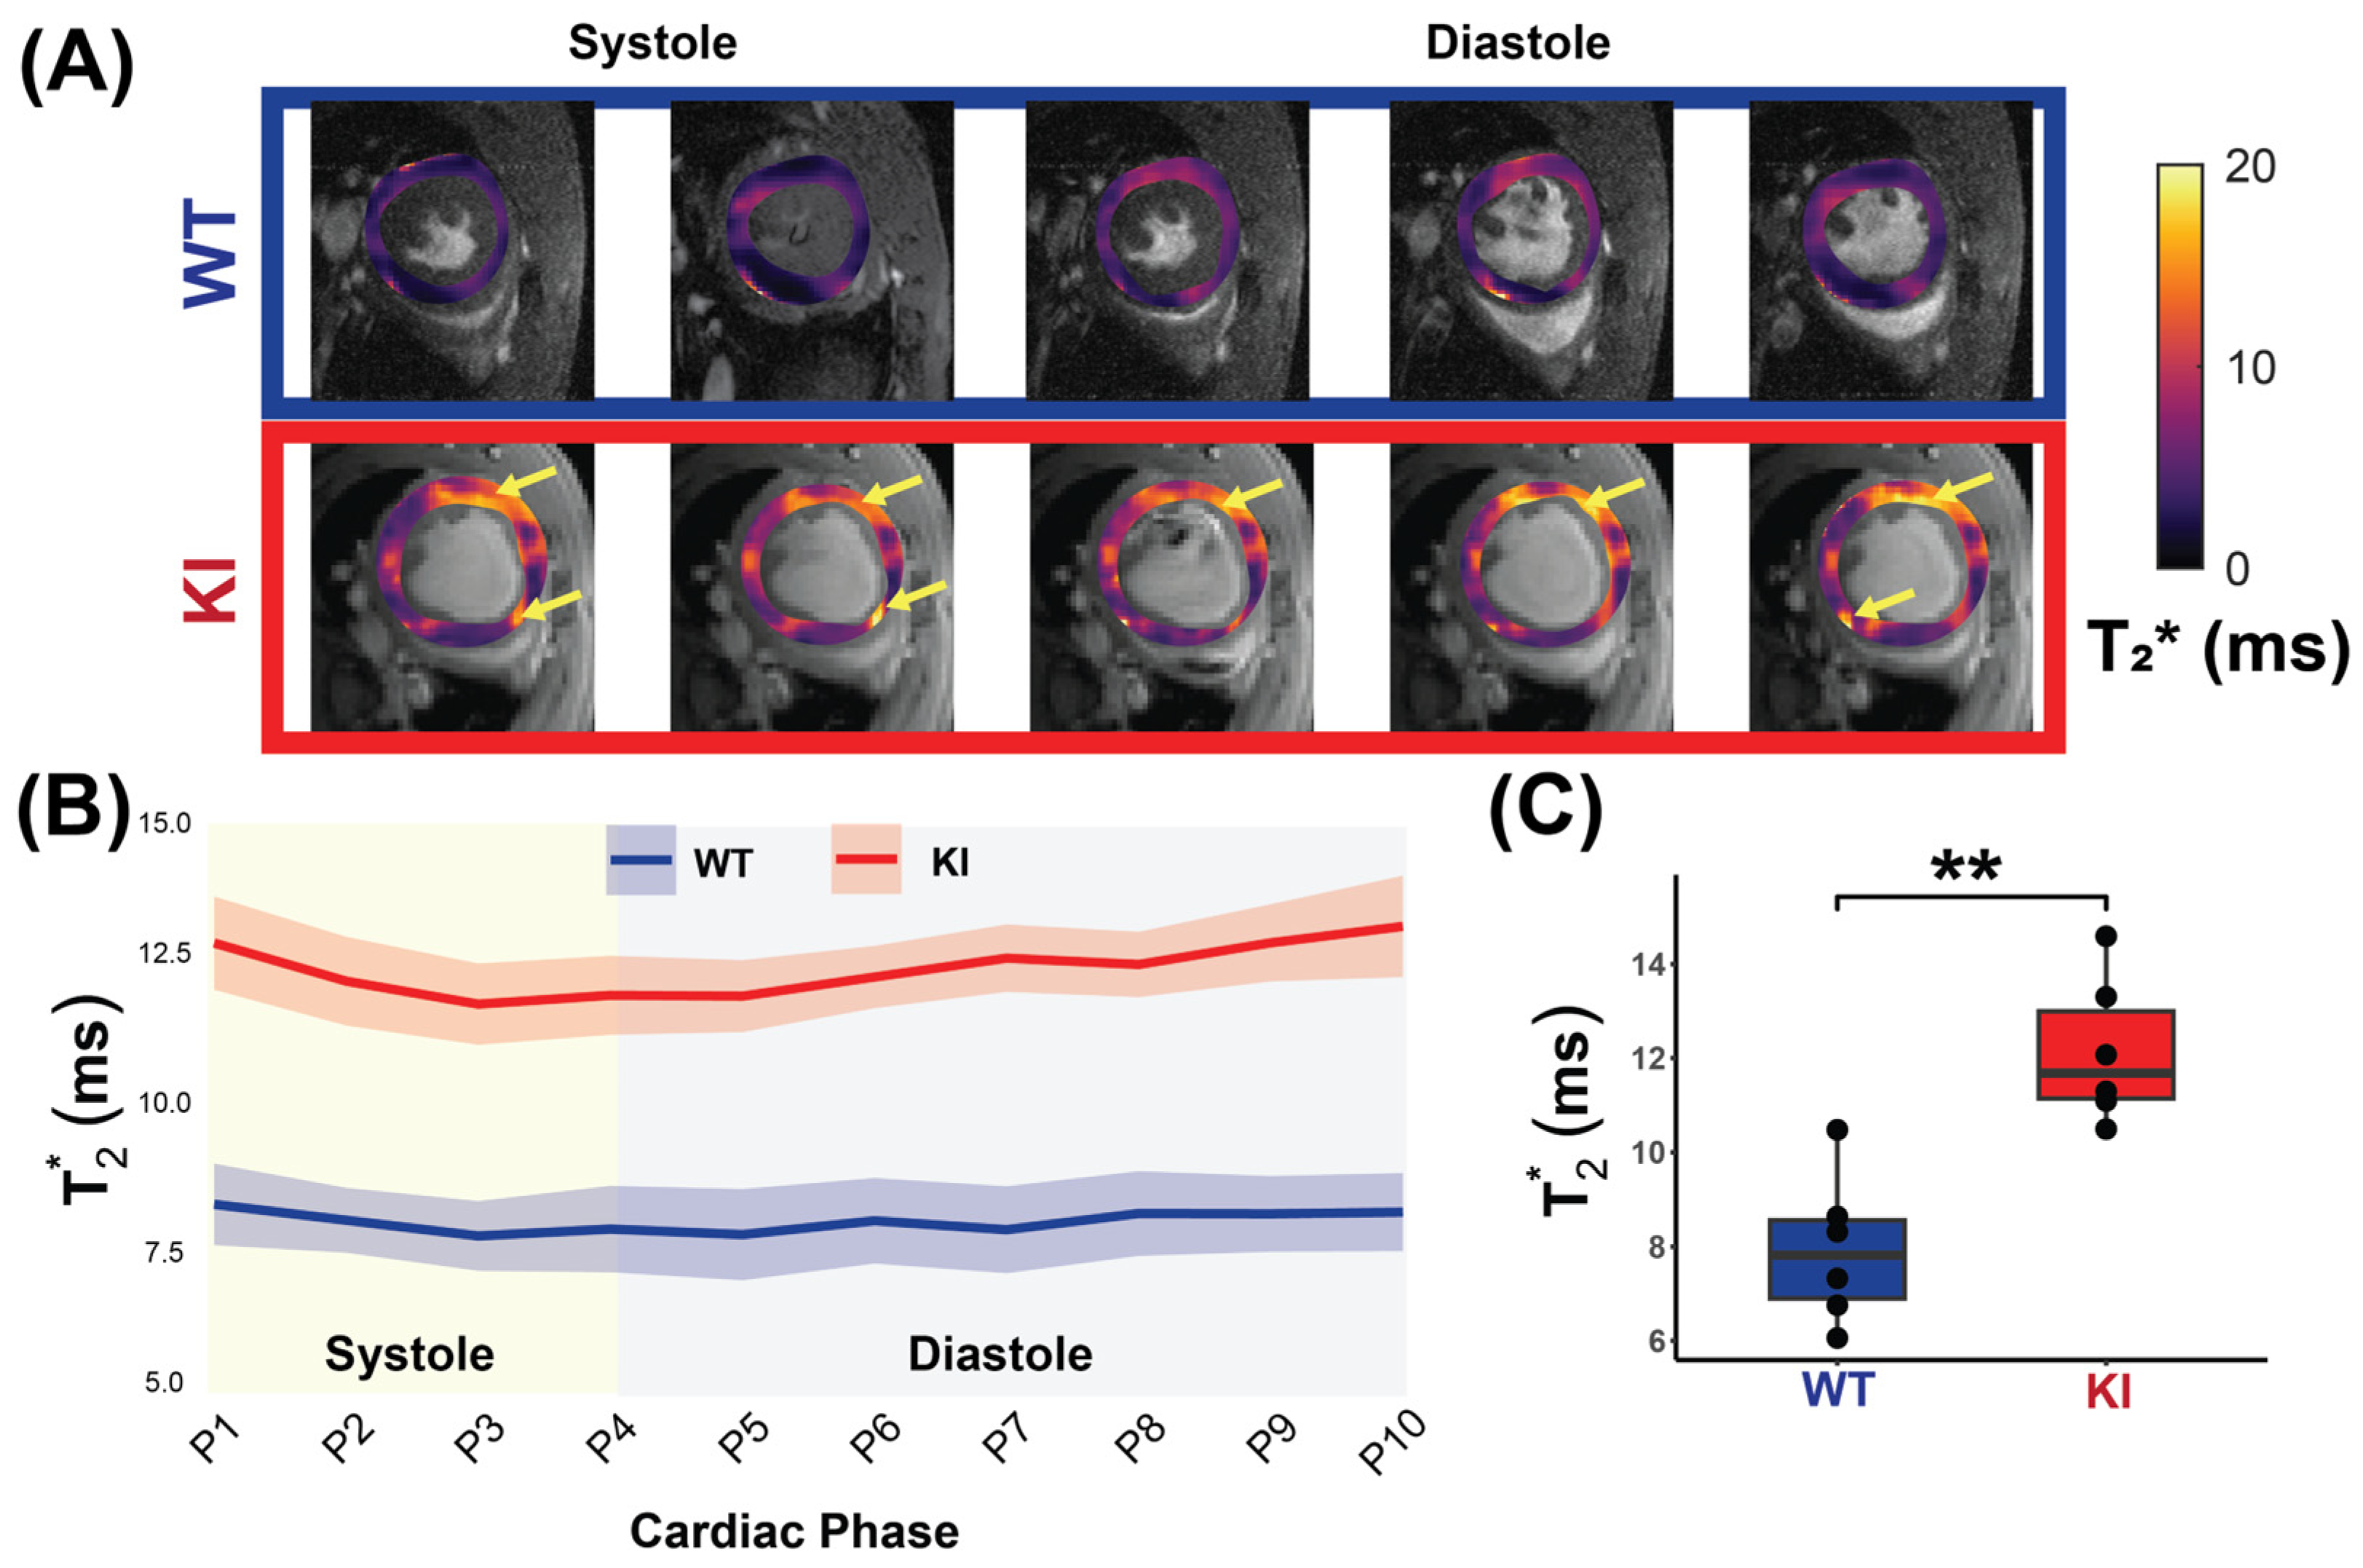
Figure 5A shows cardiac phase-resolved myocardial T2* maps overlaid on CINE images obtained for the WT and KI mice. Mean myocardial T2* values were calculated across the cardiac phases and averaged for each group to examine the T2* dynamics across the cardiac cycle (Figure 5B). The HCM mice had significantly higher mid-ventricular myocardial T2* values compared to the WT controls (KI T2* = 12.14 ± 1.54 ms vs. WT T2* = 7.93 ± 1.57 ms, p = 0.002; Figure 5C).

Figure 5.
In vivo myocardial T2* measurement covering the whole cardiac cycle in WT and in HCM mice. (A) Representative T2* maps superimposed to anatomic images obtained for 10 cardiac phases for a male WT control mouse (top) and a male Mybpc3-KI mouse (bottom) with yellow arrows showing regions of increased T2*. (B) Comparison of T2* between the WT controls and the Mybpc3-KI HCM mice reveals elevated T2* values in the HCM mice across all cardiac phases (P1-P10, n = 6 mice for each group). (C) Mean myocardial T2*, averaged over the cardiac cycle for each mouse is significantly higher in the HCM mice compared to controls (n = 6, 3 females). Mann–Whitney U test was used to compare differences in variable between the HCM and the control groups. ** p < 0.01. Abbreviations: KI: Mybpc3-KI; WT: wild type.
To investigate T2* changes across the cardiac cycle, the Friedman test was conducted. An analysis of all mice, regardless of genotype, revealed significant differences in T2* values across cardiac phases (χ2 = 23.436, p = 0.005). Stratified by genotype, no significant differences were detected in the WT mice (χ2 = 5.818, p = 0.758), whereas the HCM mice demonstrated significant differences across phases (χ2 = 27.818, p = 0.001). Comparing T2* variability (SD) across genotypes showed no significant difference (p = 0.471). These findings suggest a cardiac phase-dependent variability within the KI mice, but no significant difference in overall variability between the WT and the KI mice.
Significant strong correlations between myocardial T2*, averaged over all cardiac phases, and LV mass were found in the HCM mice (rho = 0.88, p = 0.03; Figure 6A), while no significant correlation was found in the WT group (rho = −0.6, p = 0.2; Figure 6A). A strong, though not statistically significant, negative correlation between T2* and LVEF was observed in the HCM mice (rho = −0.71, p = 0.1) (Figure 6B).
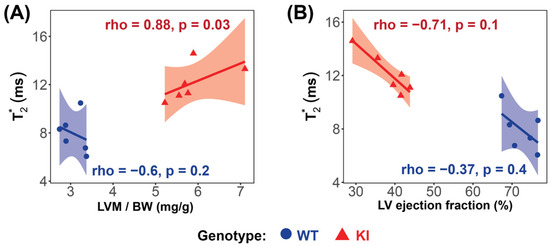
Figure 6.
Correlation analysis reveals significant relationships between LV mass and T2* in the Mybpc3-KI HCM mice. (A) A very strong, significant correlation was observed between T2* and LV mass in the Mybpc3-KI HCM mice (red  ), while no significant correlation was found in the Mybpc3-WT mice (blue
  ). (B) No significant correlation was detected between the T2* and the LV ejection fraction in either group. Associations were assessed using Spearman’s rank correlation coefficient (ρ), and were considered significant at p < 0.05. Abbreviations: LV: left ventricle; KI: Mybpc3-KI; WT: wild type.
), while no significant correlation was found in the Mybpc3-WT mice (blue ). (B) No significant correlation was detected between the T2* and the LV ejection fraction in either group. Associations were assessed using Spearman’s rank correlation coefficient (ρ), and were considered significant at p < 0.05. Abbreviations: LV: left ventricle; KI: Mybpc3-KI; WT: wild type.
4. Discussion
Our exploratory study demonstrates the feasibility of cardiac phase-resolved T2* mapping for detecting myocardial changes in HCM using a clinically relevant mouse model. We first validated the retrospective gating scheme used for cardiac phase-resolved image reconstruction on a calibrated static T2* phantom and selected the imaging parameters to ensure accurate T2* mapping in vivo. Using the retrospectively gated approach, we revealed a significant increase in T2* in the Mybpc3-KI mice across all cardiac phases.
Elevated T2* values have been observed in HCM patients [19], heart failure with preserved ejection fraction (HFpEF) [13], non-ischemic heart failure and dilated hypertrophies [33]. Although we did not find a statistically significant difference in the dynamics of T2* changes across the cardiac cycle between the WT control and HCM mouse, our data suggests that T2* tends to fluctuate across the cardiac cycle. Additionally, previous clinical findings, where cyclic T2* variations were documented in both healthy and HCM subjects, showed septal T2* decreasing in diastole and increasing in systole [19,20]. Conversely, studies capturing T2* at end-diastole [34], reported a decline in T2* in hypertensive patients with LVH, presenting a compelling case for examining the cardiac phase dependent variability of myocardial T2*.
The pathophysiological significance of our findings likely reflects variations in the blood volume fraction (BVF) between cardiac phases, which influence the amount of deoxygenated hemoglobin per myocardial tissue. In theory, T2* is expected to decrease with increased deoxygenated hemoglobin concentration per tissue volume. However, in HCM, the observed elevation in T2* suggests a lower deoxygenated hemoglobin effect, which may be linked to a reduced BVF. This reduction may result from microvascular dysfunction, impaired perfusion, and decreased capillary density, all of which can influence myocardial remodeling. Notably, BVF dynamics are closely linked to myocardial contractility—typically assessed through strain measurements—which is often impaired in HCM and correlates with myocardial mass [35]. Supporting this relationship, we observed a significant correlation between T2* and LV mass in our HCM mouse model, reinforcing the association between T2* changes and myocardial microstructural alterations [13].
Several factors can influence T2*, including tissue composition [20], myocardial oxygenation [36], diffuse myocardial fibrosis [37], or blood volume fraction [20]. In HCM, complex microvascular remodeling, including capillary rarefaction, altered oxygen extraction, and redistribution of intramyocardial blood volume may contribute to locally increased T2*, consistent with our observation. Importantly, T2* could provide valuable insights into ischemic injury in HCM, overlapping with features seen in chronic coronary syndromes [38]. Furthermore, reduced T2* has been associated with ventricular arrhythmias, independent of fibrosis [39,40]. Together, these findings underscore the importance of interpreting myocardial T2* in the context of underlying structural and functional microvascular alterations, rather than as a direct surrogate for deoxyhemoglobin content alone.
To better interpret the microstructural changes underlying our findings, it is essential to place our mouse model within the broader spectrum of HCM severity. This mouse model exhibits cardiac-specific expression of Mybpc3 in the KI mouse, with prior studies confirming markedly reduced mRNA and protein levels in the heart [29,41,42,43]. Consistent with the known phenotype of this model, our Mybpc3-KI mice demonstrated early-onset cardiac hypertrophy, typically developing shortly after birth [42,44]. LVEF declines significantly within days, suggesting that our 6–12-week-old mice may represent an intermediate stage of HCM [42,44]. To ensure comparability, normalization was performed using body weight within sex-matched groups, following validated protocols that account for developmental and sex-related variability. Consequently, the elevated T2* in our Mybpc3-KI mice may reflect early microstructural changes, including cellular hypertrophy, microvascular alterations, and impaired contractility, all of which may precede the development of advanced fibrosis. Further histological analysis is necessary to determine the nature and extent of these changes at this specific age. These would include myocardial fibrosis and capillary density assessments, to complement our imaging data. This will enhance the clinical relevance of our findings and provide a more comprehensive understanding of the myocardial changes associated with the observed T2* variations.
To summarize, our findings highlight the potential of cardiac phase-resolved T2* mapping to capture early myocardial alterations in HCM, offering insights into disease-related changes that may not be apparent with conventional single phase MRI approaches. While further validation is needed, our cardiac phase resolved approach may serve as a useful tool for investigating dynamic myocardial processes in preclinical models of cardiomyopathy.
Limitations
While this study demonstrates the utility of full cardiac cycle T2* mapping for HCM, several limitations warrant discussion. Our 2D acquisition approach was constrained to a single mid-ventricular short axis view slice of the heart, potentially missing the regional heterogeneity characteristics of HCM, which could be mitigated in future studies through 3D acquisitions with higher spatial resolution.
The discrepancy between our results and those observed in certain human studies regarding T2* values may arise from variations in methodology, such as imaging protocols, as well as the differing stages of disease progression in human cohorts compared to our animal model. Additionally, the number of cardiac phases affected the temporal resolution, which was on average around 12 ms, though the increased fat–water shift at higher magnetic fields provided a speed advantage for CINE T2* mapping.
This study’s sample size of Mybpc3 mutation mice was limited, though consistent myocardial changes support the method’s proof-of-concept. The size was guided by a rigorous a priori power analysis, informed by prior studies using similar experimental models [45,46,47].
The absence of histological validation and LGE comparison limits direct correlation with fibrosis; however, our focus was on temporal variations in myocardial T2* rather than fibrosis quantification. T2* mapping provides a dynamic, non-contrasting agent-based assessment of myocardial function and structure, capturing changes that LGE may overlook. Future research should expand to diverse animal models and human HCM cohorts, while focusing on technical improvements to enhance temporal resolution, spatial coverage, and clinical applicability, ultimately establishing T2* mapping as a valuable complement to conventional cardiac imaging for comprehensive HCM assessment.
5. Conclusions
This study represents a critical first step in validating human data, demonstrating that cardiac phase-resolved T2* mapping using retrospective gating at ultrahigh field MRI is feasible for detecting myocardial alterations in HCM. We observed elevated T2* across the cardiac cycle correlating with left ventricular mass in the HCM mice. These findings suggest that phase-resolved T2* mapping may offer improved sensitivity for detecting myocardial alterations beyond conventional single-phase approaches, though further validation and complementary molecular and histological assessments are needed to establish clinical relevance.
Author Contributions
Conceptualization, J.d.S.P. and A.P.; formal analysis, O.L. and S.S.; funding acquisition, M.-C.K.; investigation, O.L. and S.S.; methodology, S.S., S.L. (Sandra Lehmann), J.d.S.P. and A.P.; project administration, M.-C.K.; resources, M.-C.K.; software, J.d.S.P., A.P. and S.S.; supervision, M.-C.K. and T.N.; validation, O.L. and M.-C.K.; visualization, O.L.; writing—original draft, O.L., S.S. and M.-C.K.; writing—review and editing, O.L., S.S., S.L. (Siqin Liu), S.W., L.C., H.-J.Y., T.N. and M.-C.K. All authors have read and agreed to the published version of the manuscript.
Funding
This study is supported by German Research Foundation (DFG: CA 618/9-1; KU 3722/4-1; WA 2804/7-1).
Institutional Review Board Statement
All experimental procedures involving mice were approved by the local state review board “Landesamt fur Gesundheit und Soziales” (LaGeSo, Berlin, ethical approval number G0257/18 and approved on 23 April 2019).
Informed Consent Statement
Not applicable.
Data Availability Statement
The datasets generated for this study are available from the corresponding author upon reasonable request.
Acknowledgments
We thank Saskia Schlossarek (Pharmacology, University Medical Center Hamburg-Eppendorf, Hamburg, Germany) for providing the HCM mouse model.
Conflicts of Interest
The authors declare no conflicts of interest.
Abbreviations
The following abbreviations are used in this manuscript:
| MRI | Magnetic resonance imaging |
| CMR | Cardiovascular magnetic resonance |
| FLASH | Fast low angle shot |
| TR | Repetition time |
| TE | Echo time |
| FOV | Field-of-view |
| CINE | Cinematic |
| SAX | Short axis |
| EF | Ejection fraction |
| ED | End diastole |
| ES | End systole |
| HCM | Hypertrophic cardiomyopathy |
| LV | Left ventricle/left ventricular |
| LGE | Late gadolinium enhancement |
| Mybpc3 | Cardiac myosin-binding protein c |
| MYH7 | β-myosin heavy chain |
| OMIM | Online Mendelian Inheritance in Man |
| ECG | Electrocardiogram |
| SD | Standard deviation |
References
- Marian, A.J.; Braunwald, E. Hypertrophic Cardiomyopathy: Genetics, Pathogenesis, Clinical Manifestations, Diagnosis, and Therapy. Circ. Res. 2017, 121, 749–770. [Google Scholar] [CrossRef] [PubMed]
- Semsarian, C.; Ingles, J.; Maron, M.S.; Maron, B.J. New perspectives on the prevalence of hypertrophic cardiomyopathy. J. Am. Coll. Cardiol. 2015, 65, 1249–1254. [Google Scholar] [CrossRef] [PubMed]
- Olivotto, I.; Cecchi, F.; Poggesi, C.; Yacoub, M.H. Patterns of disease progression in hypertrophic cardiomyopathy: An individualized approach to clinical staging. Circ. Heart Fail. 2012, 5, 535–546. [Google Scholar] [CrossRef]
- Argiro, A.; Zampieri, M.; Marchi, A.; Cappelli, F.; Del Franco, A.; Mazzoni, C.; Cecchi, F.; Olivotto, I. Stage-specific therapy for hypertrophic cardiomyopathy. Eur. Heart J. Suppl. 2023, 25, C155–C161. [Google Scholar] [CrossRef] [PubMed]
- Gerull, B.; Klaassen, S.; Brodehl, A. The Genetic Landscape of Cardiomyopathies. In Genetic Causes of Cardiac Disease; Erdmann, J., Moretti, A., Eds.; Springer International Publishing: Cham, Switzerland, 2019; pp. 45–91. [Google Scholar]
- Motwani, M.; Kidambi, A.; Uddin, A.; Sourbron, S.; Greenwood, J.P.; Plein, S. Quantification of myocardial blood flow with cardiovascular magnetic resonance throughout the cardiac cycle. J. Cardiovasc. Magn. Reson. 2015, 17, 4. [Google Scholar] [CrossRef]
- Radjenovic, A.; Biglands, J.D.; Larghat, A.; Ridgway, J.P.; Ball, S.G.; Greenwood, J.P.; Jerosch-Herold, M.; Plein, S. Estimates of systolic and diastolic myocardial blood flow by dynamic contrast-enhanced MRI. Magn. Reson. Med. 2010, 64, 1696–1703. [Google Scholar] [CrossRef]
- Wassenaar, P.A.; Eleswarpu, C.N.; Schroeder, S.A.; Mo, X.; Raterman, B.D.; White, R.D.; Kolipaka, A. Measuring age-dependent myocardial stiffness across the cardiac cycle using MR elastography: A reproducibility study. Magn. Reson. Med. 2016, 75, 1586–1593. [Google Scholar] [CrossRef]
- Huang, X.; Yue, Y.; Wang, Y.; Deng, Y.; Liu, L.; Di, Y.; Sun, S.; Chen, D.; Fan, L.; Cao, J. Assessment of left ventricular systolic and diastolic abnormalities in patients with hypertrophic cardiomyopathy using real-time three-dimensional echocardiography and two-dimensional speckle tracking imaging. Cardiovasc. Ultrasound 2018, 16, 23. [Google Scholar] [CrossRef]
- Pelliccia, F.; Cecchi, F.; Olivotto, I.; Camici, P.G. Microvascular Dysfunction in Hypertrophic Cardiomyopathy. J. Clin. Med. 2022, 11, 6560. [Google Scholar] [CrossRef]
- Raphael, C.E.; Mitchell, F.; Kanaganayagam, G.S.; Liew, A.C.; Di Pietro, E.; Vieira, M.S.; Kanapeckaite, L.; Newsome, S.; Gregson, J.; Owen, R.; et al. Cardiovascular magnetic resonance predictors of heart failure in hypertrophic cardiomyopathy: The role of myocardial replacement fibrosis and the microcirculation. J. Cardiovasc. Magn. Reson. 2021, 23, 26. [Google Scholar] [CrossRef]
- Kellman, P.; Xue, H.; Spottiswoode, B.S.; Sandino, C.M.; Hansen, M.S.; Abdel-Gadir, A.; Treibel, T.A.; Rosmini, S.; Mancini, C.; Bandettini, W.P.; et al. Free-breathing T2* mapping using respiratory motion corrected averaging. J. Cardiovasc. Magn. Reson. 2015, 17, 3. [Google Scholar] [CrossRef]
- Juan, Y.H.; Huang, P.C.; Lin, G.; Liu, M.H.; Lin, Y.C.; Wang, J.J.; Ng, K.K.; Cheung, Y.C.; Wang, C.H.; Ng, S.H. Oxygen-sensitive T2* magnetic resonance imaging to correlate heart function and ischemic etiology of post-hospitalized chronic heart failure patients. Eur. J. Radiol. 2020, 128, 109036. [Google Scholar] [CrossRef] [PubMed]
- Ando, K.; Nagao, M.; Watanabe, E.; Sakai, A.; Suzuki, A.; Nakao, R.; Ishizaki, U.; Sakai, S.; Hagiwara, N. Association between myocardial hypoxia and fibrosis in hypertrophic cardiomyopathy: Analysis by T2* BOLD and T1 mapping MRI. Eur. Radiol. 2020, 30, 4327–4336. [Google Scholar] [CrossRef] [PubMed]
- van Nierop, B.J.; Bax, N.A.; Nelissen, J.L.; Arslan, F.; Motaal, A.G.; de Graaf, L.; Zwanenburg, J.J.; Luijten, P.R.; Nicolay, K.; Strijkers, G.J. Assessment of Myocardial Fibrosis in Mice Using a T2*-Weighted 3D Radial Magnetic Resonance Imaging Sequence. PLoS ONE 2015, 10, e0129899. [Google Scholar] [CrossRef] [PubMed]
- Robbers, L.; Nijveldt, R.; Beek, A.M.; Teunissen, P.F.A.; Hollander, M.R.; Biesbroek, P.S.; Everaars, H.; van de Ven, P.M.; Hofman, M.B.M.; van Royen, N.; et al. The influence of microvascular injury on native T1 and T2* relaxation values after acute myocardial infarction: Implications for non-contrast-enhanced infarct assessment. Eur. Radiol. 2018, 28, 824–832. [Google Scholar] [CrossRef]
- Zhang, M.K.; Zhang, Z.; Xue, H.; Fan, L.; Wen, Y. Microvascular Rarefaction and Myocardial Fibrosis in Hypertrophic Obstructive Cardiomyopathy: A Histopathological Comparison of Pediatric and Adult Patients. Heart Surg. Forum 2022, 25, E042–E047. [Google Scholar] [CrossRef]
- Snel, G.J.H.; van den Boomen, M.; Hernandez, L.M.; Nguyen, C.T.; Sosnovik, D.E.; Velthuis, B.K.; Slart, R.; Borra, R.J.H.; Prakken, N.H.J. Cardiovascular magnetic resonance native T2 and T2(*) quantitative values for cardiomyopathies and heart transplantations: A systematic review and meta-analysis. J. Cardiovasc. Magn. Reson. 2020, 22, 34. [Google Scholar] [CrossRef]
- Huelnhagen, T.; Ku, M.C.; Reimann, H.M.; Serradas Duarte, T.; Pohlmann, A.; Flemming, B.; Seeliger, E.; Eichhorn, C.; Ferrari, V.A.; Prothmann, M.; et al. Myocardial Effective Transverse Relaxation Time T 2(*) is Elevated in Hypertrophic Cardiomyopathy: A 7.0 T Magnetic Resonance Imaging Study. Sci. Rep. 2018, 8, 3974. [Google Scholar] [CrossRef]
- Huelnhagen, T.; Hezel, F.; Serradas Duarte, T.; Pohlmann, A.; Oezerdem, C.; Flemming, B.; Seeliger, E.; Prothmann, M.; Schulz-Menger, J.; Niendorf, T. Myocardial effective transverse relaxation time T2* Correlates with left ventricular wall thickness: A 7.0 T MRI study. Magn. Reson. Med. 2017, 77, 2381–2389. [Google Scholar] [CrossRef]
- Hezel, F.; Thalhammer, C.; Waiczies, S.; Schulz-Menger, J.; Niendorf, T. High spatial resolution and temporally resolved T2* mapping of normal human myocardium at 7.0 Tesla: An ultrahigh field magnetic resonance feasibility study. PLoS ONE 2012, 7, e52324. [Google Scholar] [CrossRef]
- Niendorf, T.; Schulz-Menger, J.; Paul, K.; Huelnhagen, T.; Ferrari, V.A.; Hodge, R. High Field Cardiac Magnetic Resonance Imaging. Circ. Cardiovasc. Imaging 2017, 10, e005460. [Google Scholar] [CrossRef] [PubMed]
- Becker, M.; Frauenrath, T.; Hezel, F.; Krombach, G.A.; Kremer, U.; Koppers, B.; Butenweg, C.; Goemmel, A.; Utting, J.F.; Schulz-Menger, J.; et al. Comparison of left ventricular function assessment using phonocardiogram- and electrocardiogram-triggered 2D SSFP CINE MR imaging at 1.5 T and 3.0 T. Eur. Radiol. 2010, 20, 1344–1355. [Google Scholar] [CrossRef] [PubMed]
- Lanzer, P.; Barta, C.; Botvinick, E.H.; Wiesendanger, H.U.; Modin, G.; Higgins, C.B. ECG-synchronized cardiac MR imaging: Method and evaluation. Radiology 1985, 155, 681–686. [Google Scholar] [CrossRef]
- Stab, D.; Roessler, J.; O’Brien, K.; Hamilton-Craig, C.; Barth, M. ECG Triggering in Ultra-High Field Cardiovascular MRI. Tomography 2016, 2, 167–174. [Google Scholar] [CrossRef] [PubMed]
- Frauenrath, T.; Hezel, F.; Heinrichs, U.; Kozerke, S.; Utting, J.F.; Kob, M.; Butenweg, C.; Boesiger, P.; Niendorf, T. Feasibility of cardiac gating free of interference with electro-magnetic fields at 1.5 Tesla, 3.0 Tesla and 7.0 Tesla using an MR-stethoscope. Investig. Radiol. 2009, 44, 539–547. [Google Scholar] [CrossRef]
- Oumaima, L. Full cardiac cycle coverage T2* mapping detects early myocardial changes in hypertrophic cardiomyopathy. In Proceedings of the International Society for Magnetic Resonance in Medicine Annual Meeting 31, Toronto, ON, Canada, 3–8 June 2023. [Google Scholar]
- Shalikar, S. Improving Cardiac Phase-Resolved T2*-Mapping of the Murine Heart: Artifact Reduction and Enhanced Accuracy. In Proceedings of the International Society for Magnetic Resonance in Medicine Annual Meeting 32, Singapore, 4–9 May 2024. [Google Scholar]
- Vignier, N.; Schlossarek, S.; Fraysse, B.; Mearini, G.; Kramer, E.; Pointu, H.; Mougenot, N.; Guiard, J.; Reimer, R.; Hohenberg, H.; et al. Nonsense-mediated mRNA decay and ubiquitin-proteasome system regulate cardiac myosin-binding protein C mutant levels in cardiomyopathic mice. Circ. Res. 2009, 105, 239–248. [Google Scholar] [CrossRef]
- National Electrical Manufacturers Association. Determination of Image uniformity in Diagnostic Magnetic Resonance Images; NEMA: Rosslyn, VA, USA, 2008. [Google Scholar]
- Di Sopra, L.; Piccini, D.; Coppo, S.; Stuber, M.; Yerly, J. An automated approach to fully self-gated free-running cardiac and respiratory motion-resolved 5D whole-heart MRI. Magn. Reson. Med. 2019, 82, 2118–2132. [Google Scholar] [CrossRef]
- Heiberg, E.; Sjogren, J.; Ugander, M.; Carlsson, M.; Engblom, H.; Arheden, H. Design and validation of Segment—Freely available software for cardiovascular image analysis. BMC Med. Imaging 2010, 10, 1. [Google Scholar] [CrossRef]
- Nagao, M.; Matsuo, Y.; Kamitani, T.; Yonezawa, M.; Yamasaki, Y.; Kawanami, S.; Abe, K.; Mukai, Y.; Higo, T.; Yabuuchi, H.; et al. Quantification of myocardial iron deficiency in nonischemic heart failure by cardiac T2* magnetic resonance imaging. Am. J. Cardiol. 2014, 113, 1024–1030. [Google Scholar] [CrossRef]
- Chen, B.H.; Wu, R.; An, D.A.; Shi, R.Y.; Yao, Q.Y.; Lu, Q.; Hu, J.; Jiang, M.; Deen, J.; Chandra, A.; et al. Oxygenation-sensitive cardiovascular magnetic resonance in hypertensive heart disease with left ventricular myocardial hypertrophy and non-left ventricular myocardial hypertrophy: Insight from altered mechanics and cardiac BOLD imaging. J. Magn. Reson. Imaging 2018, 48, 1297–1306. [Google Scholar] [CrossRef]
- Weise Valdes, E.; Barth, P.; Piran, M.; Laser, K.T.; Burchert, W.; Korperich, H. Left-Ventricular Reference Myocardial Strain Assessed by Cardiovascular Magnetic Resonance Feature Tracking and fSENC-Impact of Temporal Resolution and Cardiac Muscle Mass. Front. Cardiovasc. Med. 2021, 8, 764496. [Google Scholar] [CrossRef] [PubMed]
- Dendy, J.M.; Hughes, S.G.; Soslow, J.H.; Clark, D.E.; Paschal, C.B.; Gore, J.C. Myocardial Tissue Oxygenation and Microvascular Blood Volume Measurement Using a Contrast Blood Oxygenation Level-Dependent Imaging Model. Invest. Radiol. 2022, 57, 561–566. [Google Scholar] [CrossRef]
- Ellims, A.H.; Iles, L.M.; Ling, L.H.; Chong, B.; Macciocca, I.; Slavin, G.S.; Hare, J.L.; Kaye, D.M.; Marasco, S.F.; McLean, C.A.; et al. A comprehensive evaluation of myocardial fibrosis in hypertrophic cardiomyopathy with cardiac magnetic resonance imaging: Linking genotype with fibrotic phenotype. Eur. Heart J. Cardiovasc. Imaging 2014, 15, 1108–1116. [Google Scholar] [CrossRef]
- Morrone, D.; Gentile, F.; Aimo, A.; Cameli, M.; Barison, A.; Picoi, M.E.; Guglielmo, M.; Villano, A.; DeVita, A.; Mandoli, G.E.; et al. Perspectives in noninvasive imaging for chronic coronary syndromes. Int. J. Cardiol. 2022, 365, 19–29. [Google Scholar] [CrossRef] [PubMed]
- Gastl, M.; Gotschy, A.; von Spiczak, J.; Polacin, M.; Bonner, F.; Gruner, C.; Kelm, M.; Ruschitzka, F.; Alkadhi, H.; Kozerke, S.; et al. Cardiovascular magnetic resonance T2* mapping for structural alterations in hypertrophic cardiomyopathy. Eur. J. Radiol. Open 2019, 6, 78–84. [Google Scholar] [CrossRef] [PubMed]
- Gastl, M.; Gruner, C.; Labucay, K.; Gotschy, A.; Von Spiczak, J.; Polacin, M.; Boenner, F.; Kelm, M.; Ruschitzka, F.; Alkadhi, H.; et al. Cardiovascular magnetic resonance T2* mapping for the assessment of cardiovascular events in hypertrophic cardiomyopathy. Open Heart 2020, 7, e001152. [Google Scholar] [CrossRef]
- Mearini, G.; Stimpel, D.; Geertz, B.; Weinberger, F.; Kramer, E.; Schlossarek, S.; Mourot-Filiatre, J.; Stoehr, A.; Dutsch, A.; Wijnker, P.J.; et al. Mybpc3 gene therapy for neonatal cardiomyopathy enables long-term disease prevention in mice. Nat. Commun. 2014, 5, 5515. [Google Scholar] [CrossRef]
- Mearini, G.; Stimpel, D.; Kramer, E.; Geertz, B.; Braren, I.; Gedicke-Hornung, C.; Precigout, G.; Muller, O.J.; Katus, H.A.; Eschenhagen, T.; et al. Repair of Mybpc3 mRNA by 5′-trans-splicing in a Mouse Model of Hypertrophic Cardiomyopathy. Mol. Ther. Nucleic Acids 2013, 2, e102. [Google Scholar] [CrossRef]
- Carrier, L.; Mearini, G.; Stathopoulou, K.; Cuello, F. Cardiac myosin-binding protein C (MYBPC3) in cardiac pathophysiology. Gene 2015, 573, 188–197. [Google Scholar] [CrossRef]
- Farrell, E.T.; Grimes, A.C.; de Lange, W.J.; Armstrong, A.E.; Ralphe, J.C. Increased Postnatal Cardiac Hyperplasia Precedes Cardiomyocyte Hypertrophy in a Model of Hypertrophic Cardiomyopathy. Front. Physiol. 2017, 8, 414. [Google Scholar] [CrossRef]
- Pereda, D.; García-Lunar, I.; Sierra, F.; Sánchez-Quintana, D.; Santiago, E.; Ballesteros, C.; Encalada, J.F.; Sánchez-González, J.; Fuster, V.; Ibáñez, B.; et al. Magnetic Resonance Characterization of Cardiac Adaptation and Myocardial Fibrosis in Pulmonary Hypertension Secondary to Systemic-To-Pulmonary Shunt. Circ. Cardiovasc. Imaging 2016, 9, e004566. [Google Scholar] [CrossRef] [PubMed]
- Faragli, A.; Tanacli, R.; Kolp, C.; Lapinskas, T.; Stehning, C.; Schnackenburg, B.; Lo Muzio, F.P.; Perna, S.; Pieske, B.; Nagel, E.; et al. Cardiovascular magnetic resonance feature tracking in pigs: A reproducibility and sample size calculation study. Int. J. Cardiovasc. Imaging 2020, 36, 703–712. [Google Scholar] [CrossRef] [PubMed]
- Lapinskas, T.; Grune, J.; Zamani, S.M.; Jeuthe, S.; Messroghli, D.; Gebker, R.; Meyborg, H.; Kintscher, U.; Zaliunas, R.; Pieske, B.; et al. Cardiovascular magnetic resonance feature tracking in small animals—A preliminary study on reproducibility and sample size calculation. BMC Med. Imaging 2017, 17, 51. [Google Scholar] [CrossRef] [PubMed]

Disclaimer/Publisher’s Note: The statements, opinions and data contained in all publications are solely those of the individual author(s) and contributor(s) and not of MDPI and/or the editor(s). MDPI and/or the editor(s) disclaim responsibility for any injury to people or property resulting from any ideas, methods, instructions or products referred to in the content. |
© 2025 by the authors. Licensee MDPI, Basel, Switzerland. This article is an open access article distributed under the terms and conditions of the Creative Commons Attribution (CC BY) license (https://creativecommons.org/licenses/by/4.0/).