
Add-On Treatment with Gliclazide for Cancer Patients with Type 2 Diabetes Undergoing Cyclic Glucocorticoid-Containing Chemotherapy
 ,
,
Abstract
1. Introduction
2. Materials and Methods
2.1. Study Design
2.2. Treatment with Gliclazide
2.3. CGM and Self-Monitoring of Blood Glucose (SMBG)
2.4. Statistical Analysis
3. Results
4. Discussion
5. Conclusions
Supplementary Materials
Author Contributions
Funding
Institutional Review Board Statement
Informed Consent Statement
Data Availability Statement
Acknowledgments
Conflicts of Interest
References
- Gallagher, E.J.; LeRoith, D. Obesity and Diabetes: The Increased Risk of Cancer and Cancer-Related Mortality. Physiol. Rev. 2015, 95, 727–748. [Google Scholar] [CrossRef] [PubMed]
- Vissers, P.A.; Falzon, L.; van de Poll-Franse, L.V.; Pouwer, F.; Thong, M.S. The impact of having both cancer and diabetes on patient-reported outcomes: A systematic review and directions for future research. J. Cancer Surviv. 2016, 10, 406–415. [Google Scholar] [CrossRef]
- Ranc, K.; Jorgensen, M.E.; Friis, S.; Carstensen, B. Mortality after cancer among patients with diabetes mellitus: Effect of diabetes duration and treatment. Diabetologia 2014, 57, 927–934. [Google Scholar] [CrossRef]
- Lee, S.J.; Kim, J.H.; Park, S.J.; Ock, S.Y.; Kwon, S.K.; Choi, Y.S.; Kim, B.K. Optimal glycemic target level for colon cancer patients with diabetes. Diabetes Res. Clin. Pract. 2017, 124, 66–71. [Google Scholar] [CrossRef]
- Liu, X.X.; Zhu, X.M.; Miao, Q.; Ye, H.Y.; Zhang, Z.Y.; Li, Y.M. Hyperglycemia induced by glucocorticoids in nondiabetic patients: A meta-analysis. Ann. Nutr. Metab. 2014, 65, 324–332. [Google Scholar] [CrossRef] [PubMed]
- Burt, M.G.; Roberts, G.W.; Aguilar-Loza, N.R.; Frith, P.; Stranks, S.N. Continuous monitoring of circadian glycemic patterns in patients receiving prednisolone for COPD. J. Clin. Endocrinol. Metab. 2011, 96, 1789–1796. [Google Scholar] [CrossRef] [PubMed]
- Aberer, F.; Hochfellner, D.A.; Sourij, H.; Mader, J.K. A Practical Guide for the Management of Steroid Induced Hyperglycaemia in the Hospital. J. Clin. Med. 2021, 10, 2154. [Google Scholar] [CrossRef]
- Cho, J.H.; Suh, S. Glucocorticoid-Induced Hyperglycemia: A Neglected Problem. Endocrinol. Metab. 2024, 39, 222–238. [Google Scholar] [CrossRef]
- Yoo, J.H.; Kim, J.H. Time in Range from Continuous Glucose Monitoring: A Novel Metric for Glycemic Control. Diabetes Metab. J. 2020, 44, 828–839. [Google Scholar] [CrossRef]
- Kleinhans, M.; Albrecht, L.J.; Benson, S.; Fuhrer, D.; Dissemond, J.; Tan, S. Continuous Glucose Monitoring of Steroid-Induced Hyperglycemia in Patients With Dermatologic Diseases. J. Diabetes Sci. Technol. 2024, 18, 904–910. [Google Scholar] [CrossRef]
- Zhang, F.; Karam, J.G. Glycemic Profile of Intravenous Dexamethasone-Induced Hyperglycemia Using Continuous Glucose Monitoring. Am. J. Case Rep. 2021, 22, e930733. [Google Scholar] [CrossRef] [PubMed]
- Gerards, M.C.; de Maar, J.S.; Steenbruggen, T.G.; Hoekstra, J.B.; Vriesendorp, T.M.; Gerdes, V.E. Add-on treatment with intermediate-acting insulin versus sliding-scale insulin for patients with type 2 diabetes or insulin resistance during cyclic glucocorticoid-containing antineoplastic chemotherapy: A randomized crossover study. Diabetes Obes. Metab. 2016, 18, 1041–1044. [Google Scholar] [CrossRef] [PubMed]
- Veber, O.; Wilde, A.; Demeter, J.; Tamas, G.; Mucsi, I.; Tabak, A.G. The effect of steroid pulse therapy on carbohydrate metabolism in multiple myeloma patients: A randomized crossover observational clinical study. J. Endocrinol. Investig. 2014, 37, 345–351. [Google Scholar] [CrossRef]
- Legris, P.; Bouillet, B.; Pâris, J.; Pistre, P.; Devaux, M.; Bost, S.; Simoneau, I.; Manfredi, S.; Drouillard, A.; Bastie, J.N.; et al. Glycemic control in people with diabetes treated with cancer chemotherapy: Contribution of continuous glucose monitoring. Acta Diabetol. 2023, 60, 545–552. [Google Scholar] [CrossRef]
- Kasayama, S.; Tanaka, T.; Hashimoto, K.; Koga, M.; Kawase, I. Efficacy of glimepiride for the treatment of diabetes occurring during glucocorticoid therapy. Diabetes Care 2002, 25, 2359–2360. [Google Scholar] [CrossRef] [PubMed]
- Schopman, J.E.; Simon, A.C.; Hoefnagel, S.J.; Hoekstra, J.B.; Scholten, R.J.; Holleman, F. The incidence of mild and severe hypoglycaemia in patients with type 2 diabetes mellitus treated with sulfonylureas: A systematic review and meta-analysis. Diabetes Metab. Res. Rev. 2014, 30, 11–22. [Google Scholar] [CrossRef]
- Roberts, A.; James, J.; Dhatariya, K.; Joint British Diabetes Societies for Inpatient Care. Management of hyperglycaemia and steroid (glucocorticoid) therapy: A guideline from the Joint British Diabetes Societies (JBDS) for Inpatient Care group. Diabet. Med. 2018, 35, 1011–1017. [Google Scholar] [CrossRef]
- Efron, B.; Tibshirani, R. An Introduction to the Bootstrap; Monographs on statistics and applied probability; Chapman & Hall: New York, NY, USA, 1993; 436p. [Google Scholar]
- Elhakeem, A.; Hughes, R.A.; Tilling, K.; Cousminer, D.L.; Jackowski, S.A.; Cole, T.J.; Kwong, A.S.; Li, Z.; Grant, S.F.; Baxter-Jones, A.D.; et al. Using linear and natural cubic splines, SITAR, and latent trajectory models to characterise nonlinear longitudinal growth trajectories in cohort studies. BMC Med. Res. Methodol. 2022, 22, 68. [Google Scholar] [CrossRef]
- Suh, S.; Park, M.K. Glucocorticoid-Induced Diabetes Mellitus: An Important but Overlooked Problem. Endocrinol. Metab. 2017, 32, 180–189. [Google Scholar] [CrossRef]
- Battelino, T.; Danne, T.; Bergenstal, R.M.; Amiel, S.A.; Beck, R.; Biester, T.; Bosi, E.; Buckingham, B.A.; Cefalu, W.T.; Close, K.L.; et al. Clinical Targets for Continuous Glucose Monitoring Data Interpretation: Recommendations From the International Consensus on Time in Range. Diabetes Care 2019, 42, 1593–1603. [Google Scholar] [CrossRef]
- Yu, H.; Li, H.; Zuo, T.; Cao, L.; Bi, X.; Xing, H.; Cai, L.; Sun, J.; Liu, Y. Financial toxicity and psychological distress in adults with cancer: A treatment-based analysis. Asia-Pac. J. Oncol. Nurs. 2022, 9, 100069. [Google Scholar] [CrossRef] [PubMed]

| All Patients (n = 17) | Hyperglycemia After DXM (n = 11) | No Hyperglycemia After DXM (n = 6) | p-Value | |
|---|---|---|---|---|
| Age | 63.1 ± 10.7 | 64.2 ± 10.1 | 61.2 ± 12.4 | 0.594 |
| Male (%) | 11 (64.7) | 7 (63.6%) | 4 (66.7%) | 1.000 |
| Height (cm) | 162.5 ± 8.9 | 163.5 ± 9.8 | 160.7 ± 7.6 | 0.552 |
| Weight (kg) | 61.3 ± 9.8 | 62.3 ± 11.0 | 59.5 ± 7.8 | 0.584 |
| BMI (kg/m2) | 23.2 ± 2.9 | 23.3 ± 3.4 | 23.0 ± 1.6 | 0.813 |
| Waist circumference (cm) | 85.4 ± 8.0 | 83.6 ± 8.2 | 88.8 ± 6.8 | 0.212 |
| Cancer type | 0.329 | |||
| GI cancer | 8 (47.1) | 5 (45.5) | 3 (50) | |
| Lung cancer | 6 (35.3) | 3 (27.3) | 3 (50) | |
| GB–biliary cancer | 3 (17.6) | 3 (27.3) | 0 (0) | |
| Dexamethasone | ||||
| Dose (mg, per cycle) * | 6.5 [4.7, 9.0] | 6.7 [4.5, 9.0] | 5.6 [4.7, 9.0] | 0.648 |
| Duration (days, per cycle) * | 4.0 [3.0, 4.0] | 4.0 [3.5, 4.0] | 3.5 [3.0, 4.0] | 0.264 |
| HbA1c (%) | 7.5 ± 1.7 | 7.9 ± 1.7 | 6.8 ± 1.4 | 0.216 |
| FBS (mg/dL) * | 141.0 [120.5, 165.5] | 145.0 [131.0, 170.0] | 126.0 [111.0, 142.0] | 0.606 |
| Duration of diabetes (years) | 5.9 ± 6.9 | 8.4 ± 7.4 | 1.2 ± 1.4 | 0.009 |
| Number of antihyperglycemic agents | 0.193 | |||
| Monotherapy | 4 (23.5) | 1 (9.1) | 3 (50) | |
| Combination therapy | 13 (76.5) | 10 (90.9) | 3 (50) | |
| 7 (41.2) | 6 (54.5) | 1 (16.7) | |
| 6 (35.4) | 4 (36.4) | 2 (33.3) | |
| Insulin use | 2 (11.8) | 1 (9.1) | 1 (16.7) | 1.000 |
| AST (IU/L) * | 19.0 [17.0, 33.0] | 17.0 [15.5, 27.0] | 32.0 [19.0, 34.0] | 0.245 |
| ALT (IU/L) | 22.0 [13.0, 31.0] | 17.0 [12.0, 31.5] | 24.5 [18.3, 30.0] | 0.725 |
| eGFR (mL/min/1.73 m2) | 89.2 ± 17.9 | 87.2 ± 17.0 | 93.6 ± 21.1 | 0.524 |
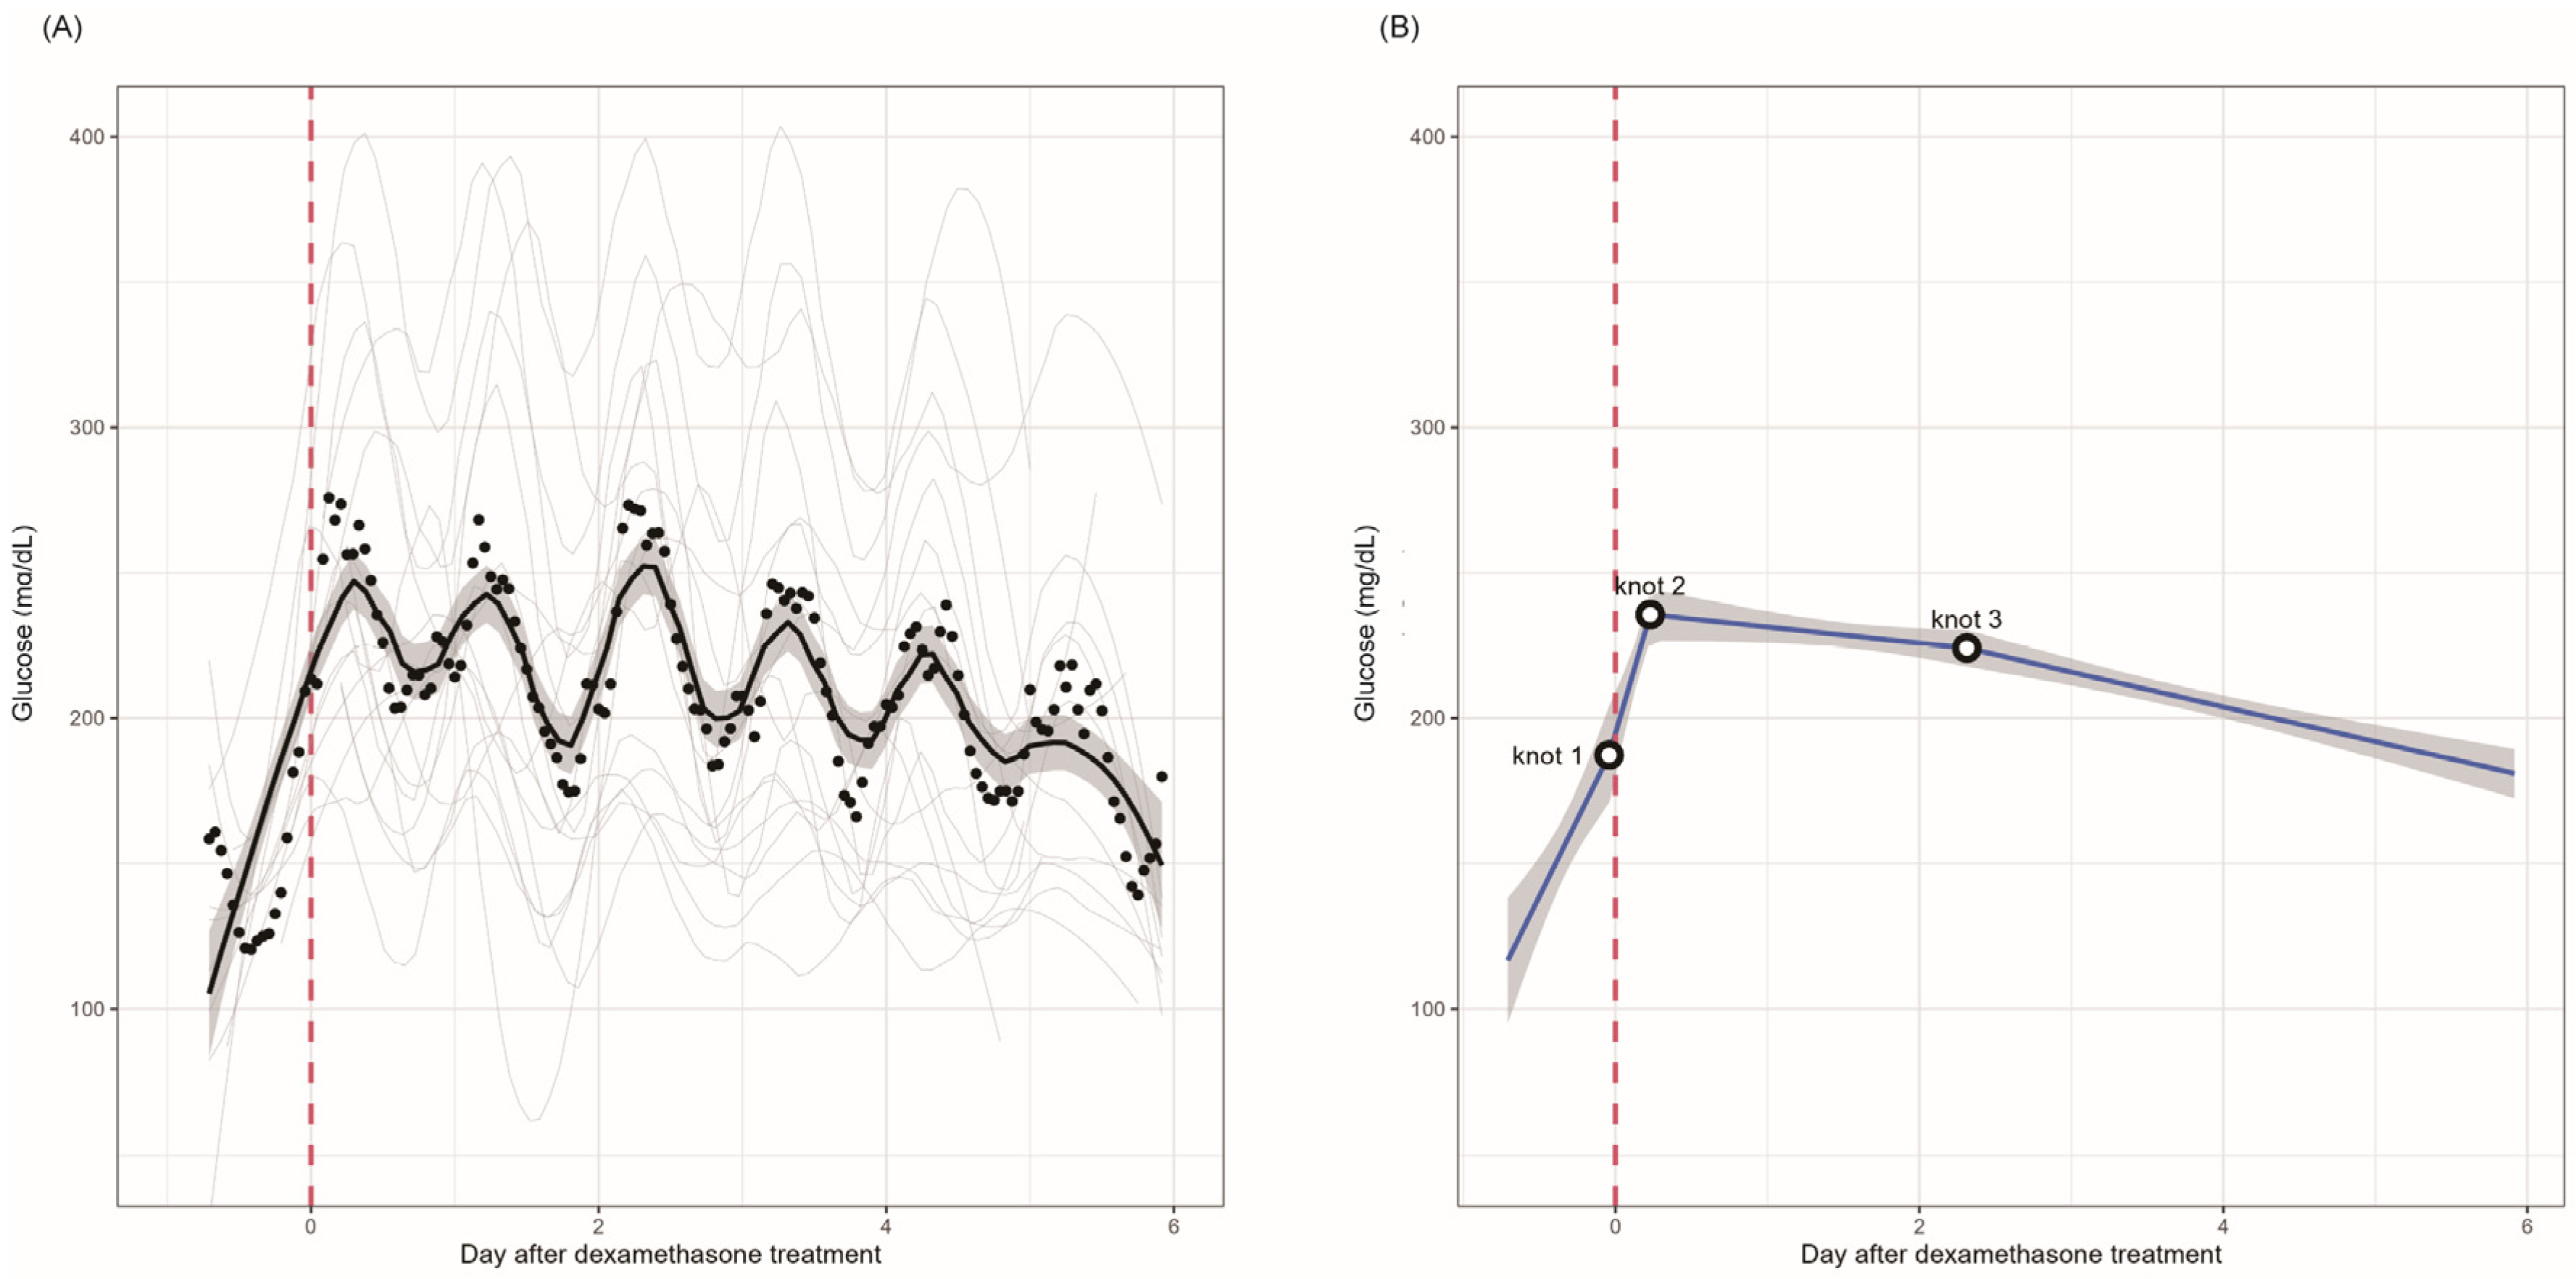
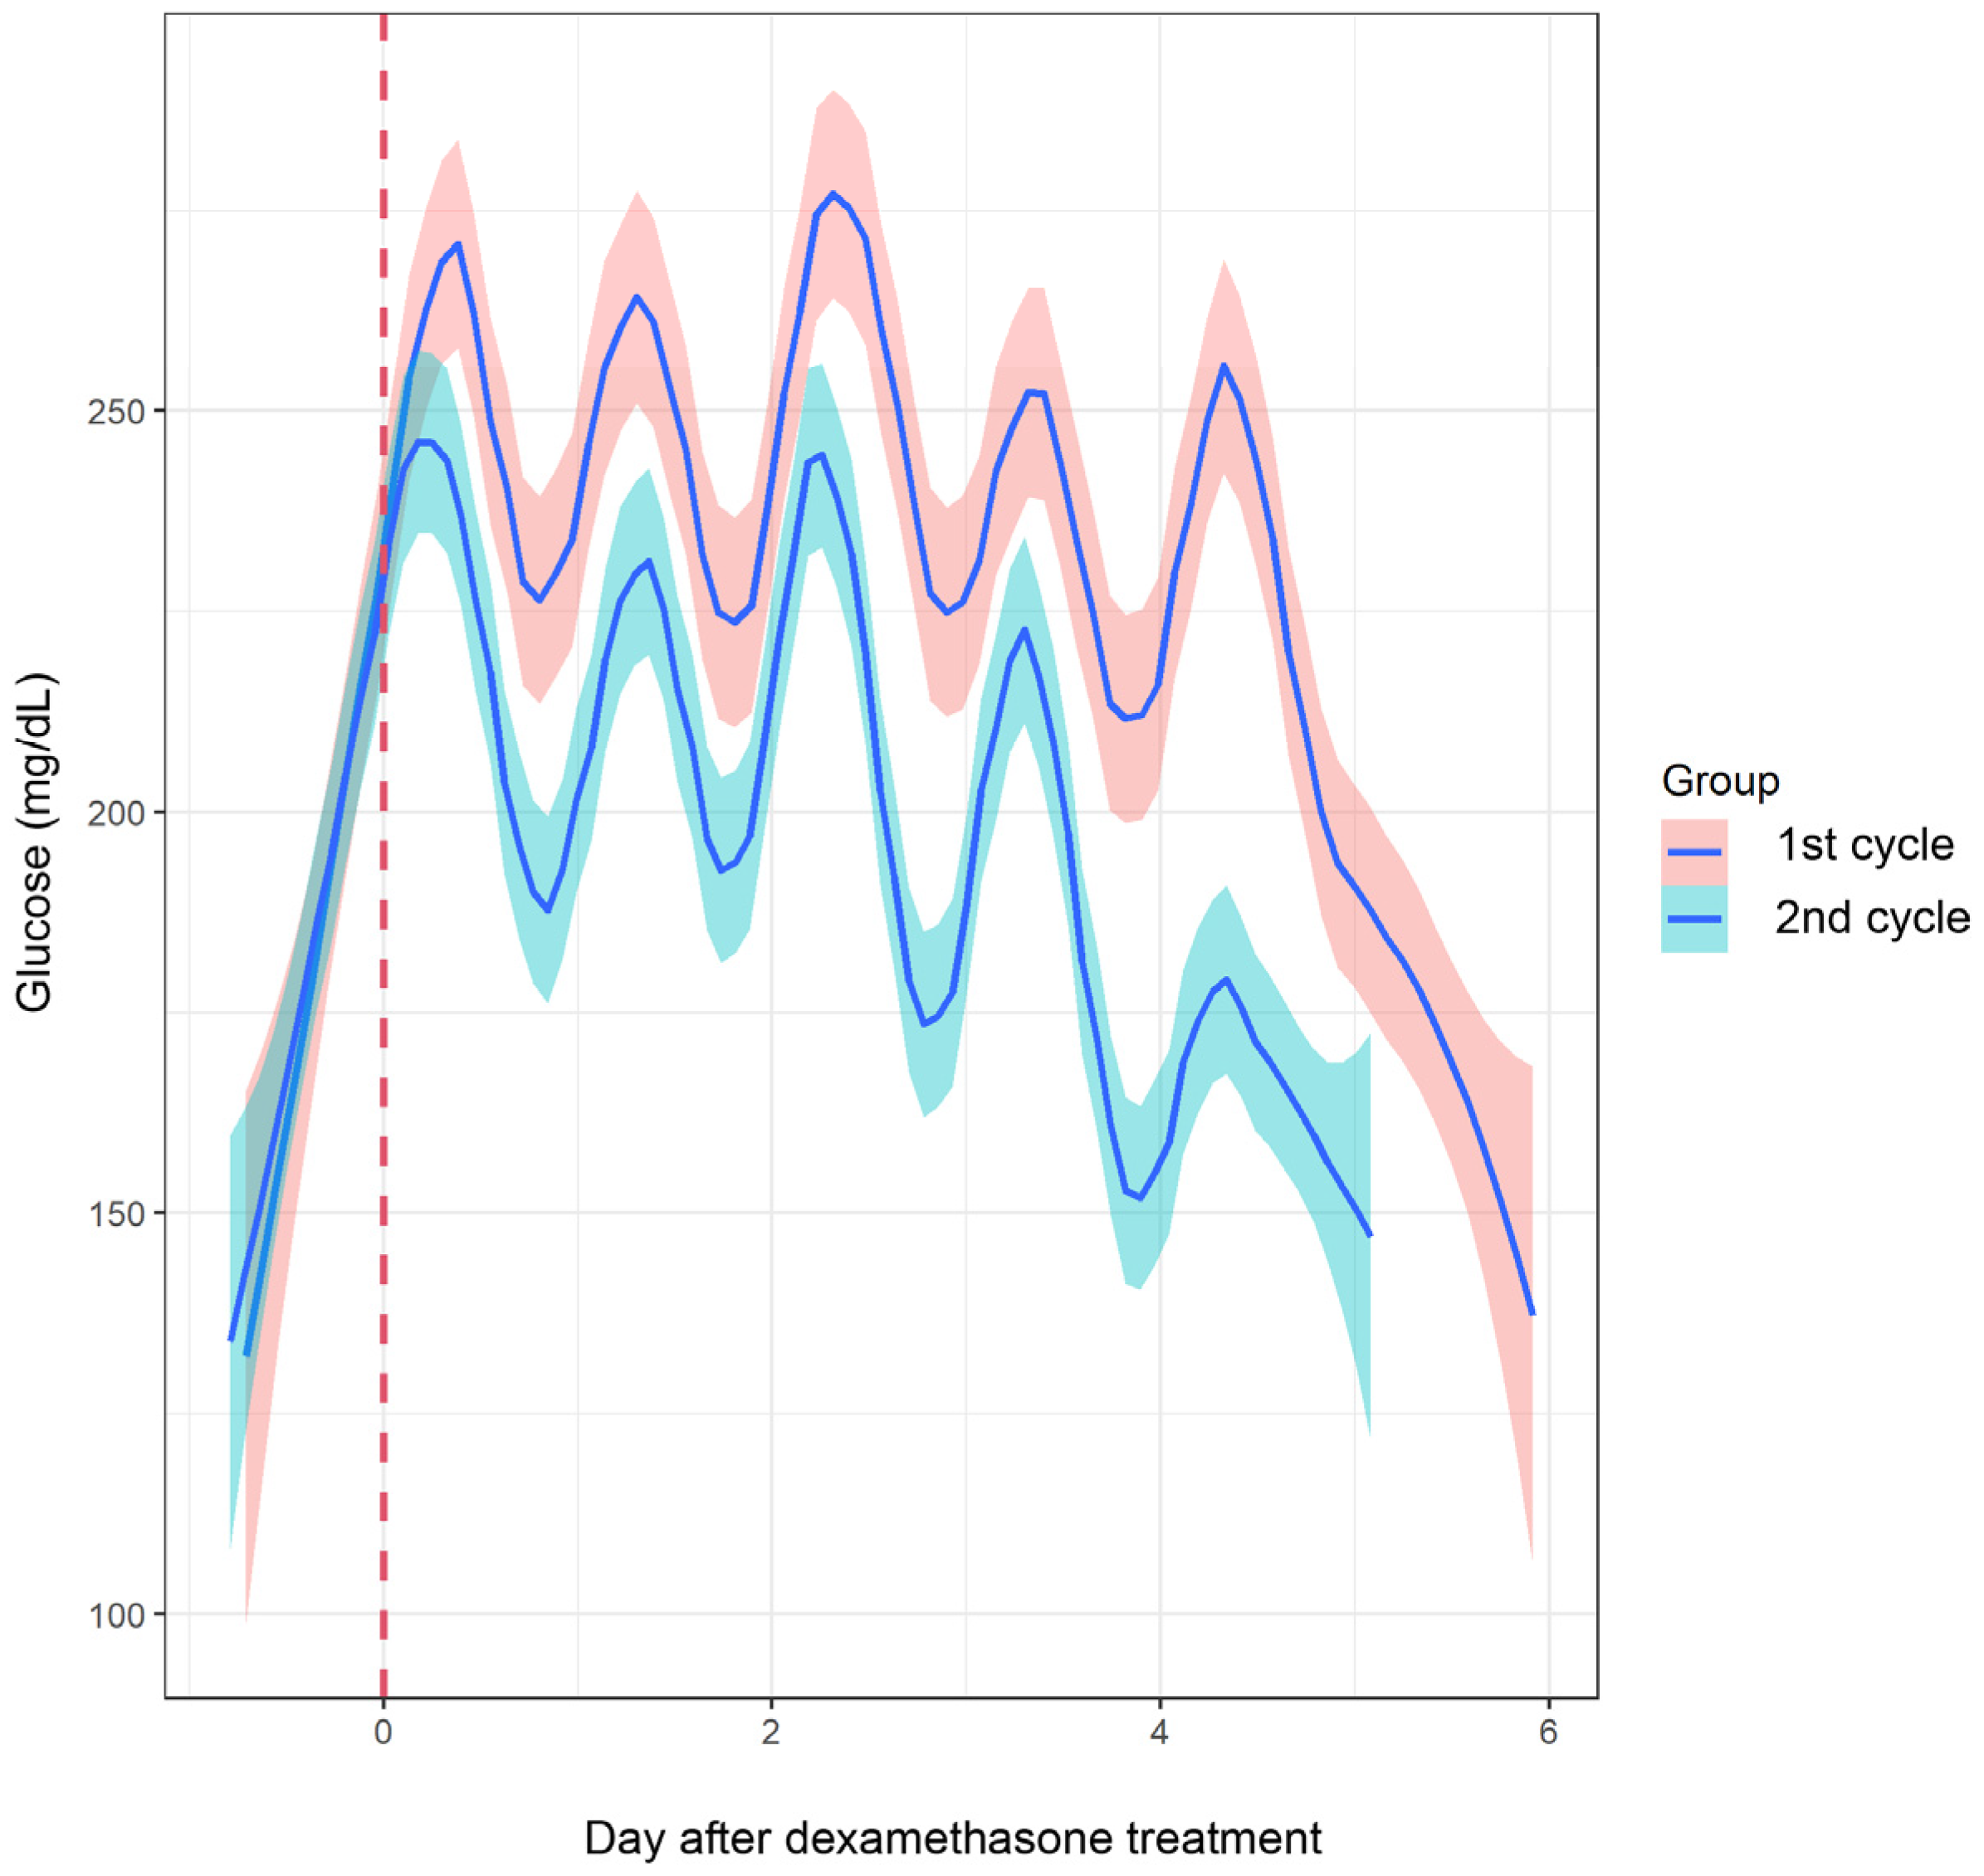
| First Cycle Estimate | p-Value | Second Cycle Estimate | p-Value | First to Second Cycle Difference | p-Value | |
|---|---|---|---|---|---|---|
| First cycle (n = 17) | ||||||
| (Intercept) | ||||||
| ~Knot 1 | 4.41 (2.39 to 6.43) | <0.001 | ||||
| Knot 1~knot 2 | 7.44 (4.36 to 10.52) | <0.001 | ||||
| Knot 2~knot 3 | −0.23 (−0.48 to 0.02) | 0.071 | ||||
| Knot 3~ | −0.50 (−0.64 to −0.35) | <0.001 | ||||
| First and second cycles (n = 9) | ||||||
| (Intercept) | ||||||
| ~Knot 1 | 2.61 (−0.21 to 5.43) | 0.070 | 4.71 (2.56 to 6.86) | <0.001 | −2.10 (−5.65 to 1.44) | 0.245 |
| Knot 1~knot 2 | 9.26 (5.31 to 13.22) | <0.001 | 0.82 (−2.91 to 4.56) | 0.666 | 8.44 (3.00 to 13.88) | 0.002 |
| Knot 2~knot 3 | 0.09 (−0.23 to 0.41) | 0.588 | −0.19 (−0.52 to 0.14) | 0.262 | 0.28 (−0.18 to 0.73) | 0.237 |
| Knot 3~ | −0.90 (−1.08 to −0.71) | <0.001 | −0.96 (−1.20 to −0.71) | <0.001 | 0.06 (−0.25 to 0.37) | 0.713 |
| First Cycle | Second Cycle | p-Value | |
|---|---|---|---|
| TIR (%) | 33.11 | 45.22 | 0.020 |
| TAR (%) | 66.89 | 52.78 | 0.003 |
| TBR (%) | 0.11 | 2.06 | 0.305 |
| GMI (%) | 9.52 | 8.40 | 0.020 |
| Mean glucose (mg/dL) | 226.67 | 194.33 | 0.022 |
| SD (mg/dL) | 60.44 | 62.67 | 0.691 |
Disclaimer/Publisher’s Note: The statements, opinions and data contained in all publications are solely those of the individual author(s) and contributor(s) and not of MDPI and/or the editor(s). MDPI and/or the editor(s) disclaim responsibility for any injury to people or property resulting from any ideas, methods, instructions or products referred to in the content. |
© 2025 by the authors. Licensee MDPI, Basel, Switzerland. This article is an open access article distributed under the terms and conditions of the Creative Commons Attribution (CC BY) license (https://creativecommons.org/licenses/by/4.0/).
Share and Cite
Lee, S.E.; Park, J.-H.; Kim, D.; Lee, H.-A.; Kang, Y.S.; Yoon, Y.S.; Jeong, Y.J.; Choi, H.S.; Kim, K.-A. Add-On Treatment with Gliclazide for Cancer Patients with Type 2 Diabetes Undergoing Cyclic Glucocorticoid-Containing Chemotherapy. Biomedicines 2025, 13, 1101. https://doi.org/10.3390/biomedicines13051101
Lee SE, Park J-H, Kim D, Lee H-A, Kang YS, Yoon YS, Jeong YJ, Choi HS, Kim K-A. Add-On Treatment with Gliclazide for Cancer Patients with Type 2 Diabetes Undergoing Cyclic Glucocorticoid-Containing Chemotherapy. Biomedicines. 2025; 13(5):1101. https://doi.org/10.3390/biomedicines13051101
Chicago/Turabian StyleLee, Seung Eun, Ju-Hyun Park, Dalyong Kim, Hyun-A Lee, Yun Seong Kang, Young Soon Yoon, Yun Jeong Jeong, Han Seok Choi, and Kyoung-Ah Kim. 2025. "Add-On Treatment with Gliclazide for Cancer Patients with Type 2 Diabetes Undergoing Cyclic Glucocorticoid-Containing Chemotherapy" Biomedicines 13, no. 5: 1101. https://doi.org/10.3390/biomedicines13051101
APA StyleLee, S. E., Park, J.-H., Kim, D., Lee, H.-A., Kang, Y. S., Yoon, Y. S., Jeong, Y. J., Choi, H. S., & Kim, K.-A. (2025). Add-On Treatment with Gliclazide for Cancer Patients with Type 2 Diabetes Undergoing Cyclic Glucocorticoid-Containing Chemotherapy. Biomedicines, 13(5), 1101. https://doi.org/10.3390/biomedicines13051101