

Polycystins Expression in Astrocytic Gliomas


Abstract
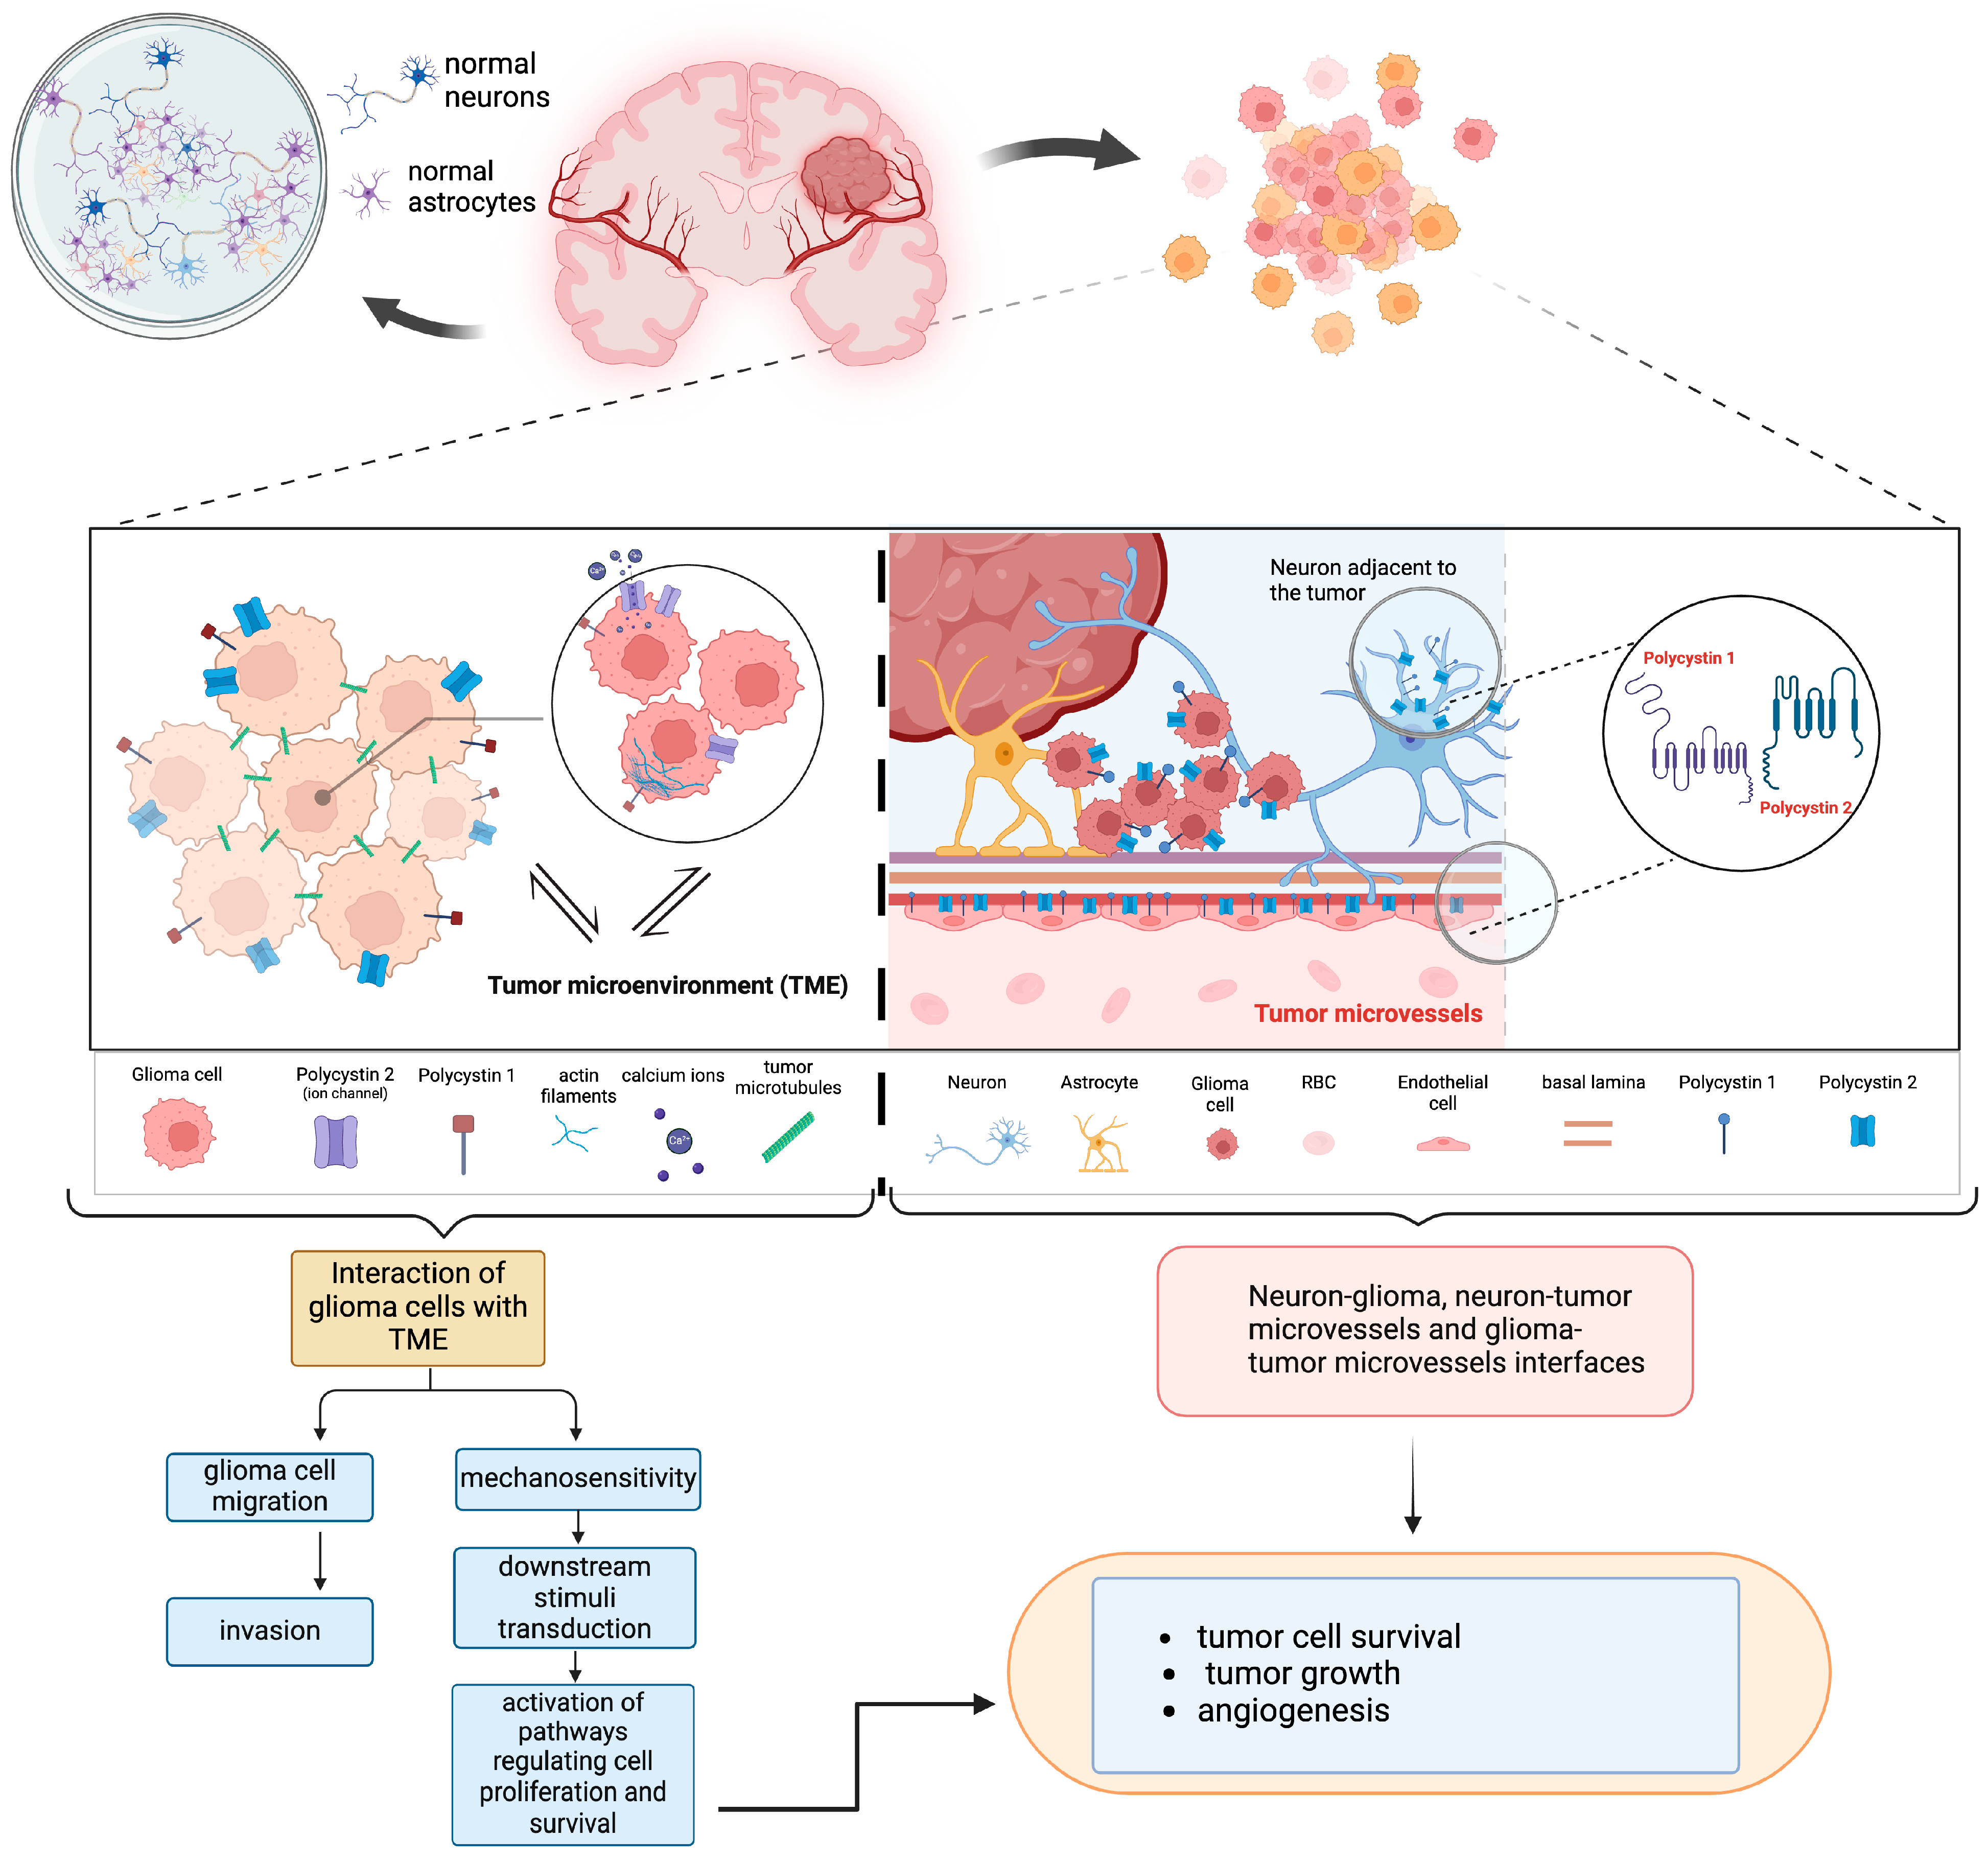
1. Introduction
2. Materials and Methods
2.1. Demographic Data and Neuropathology
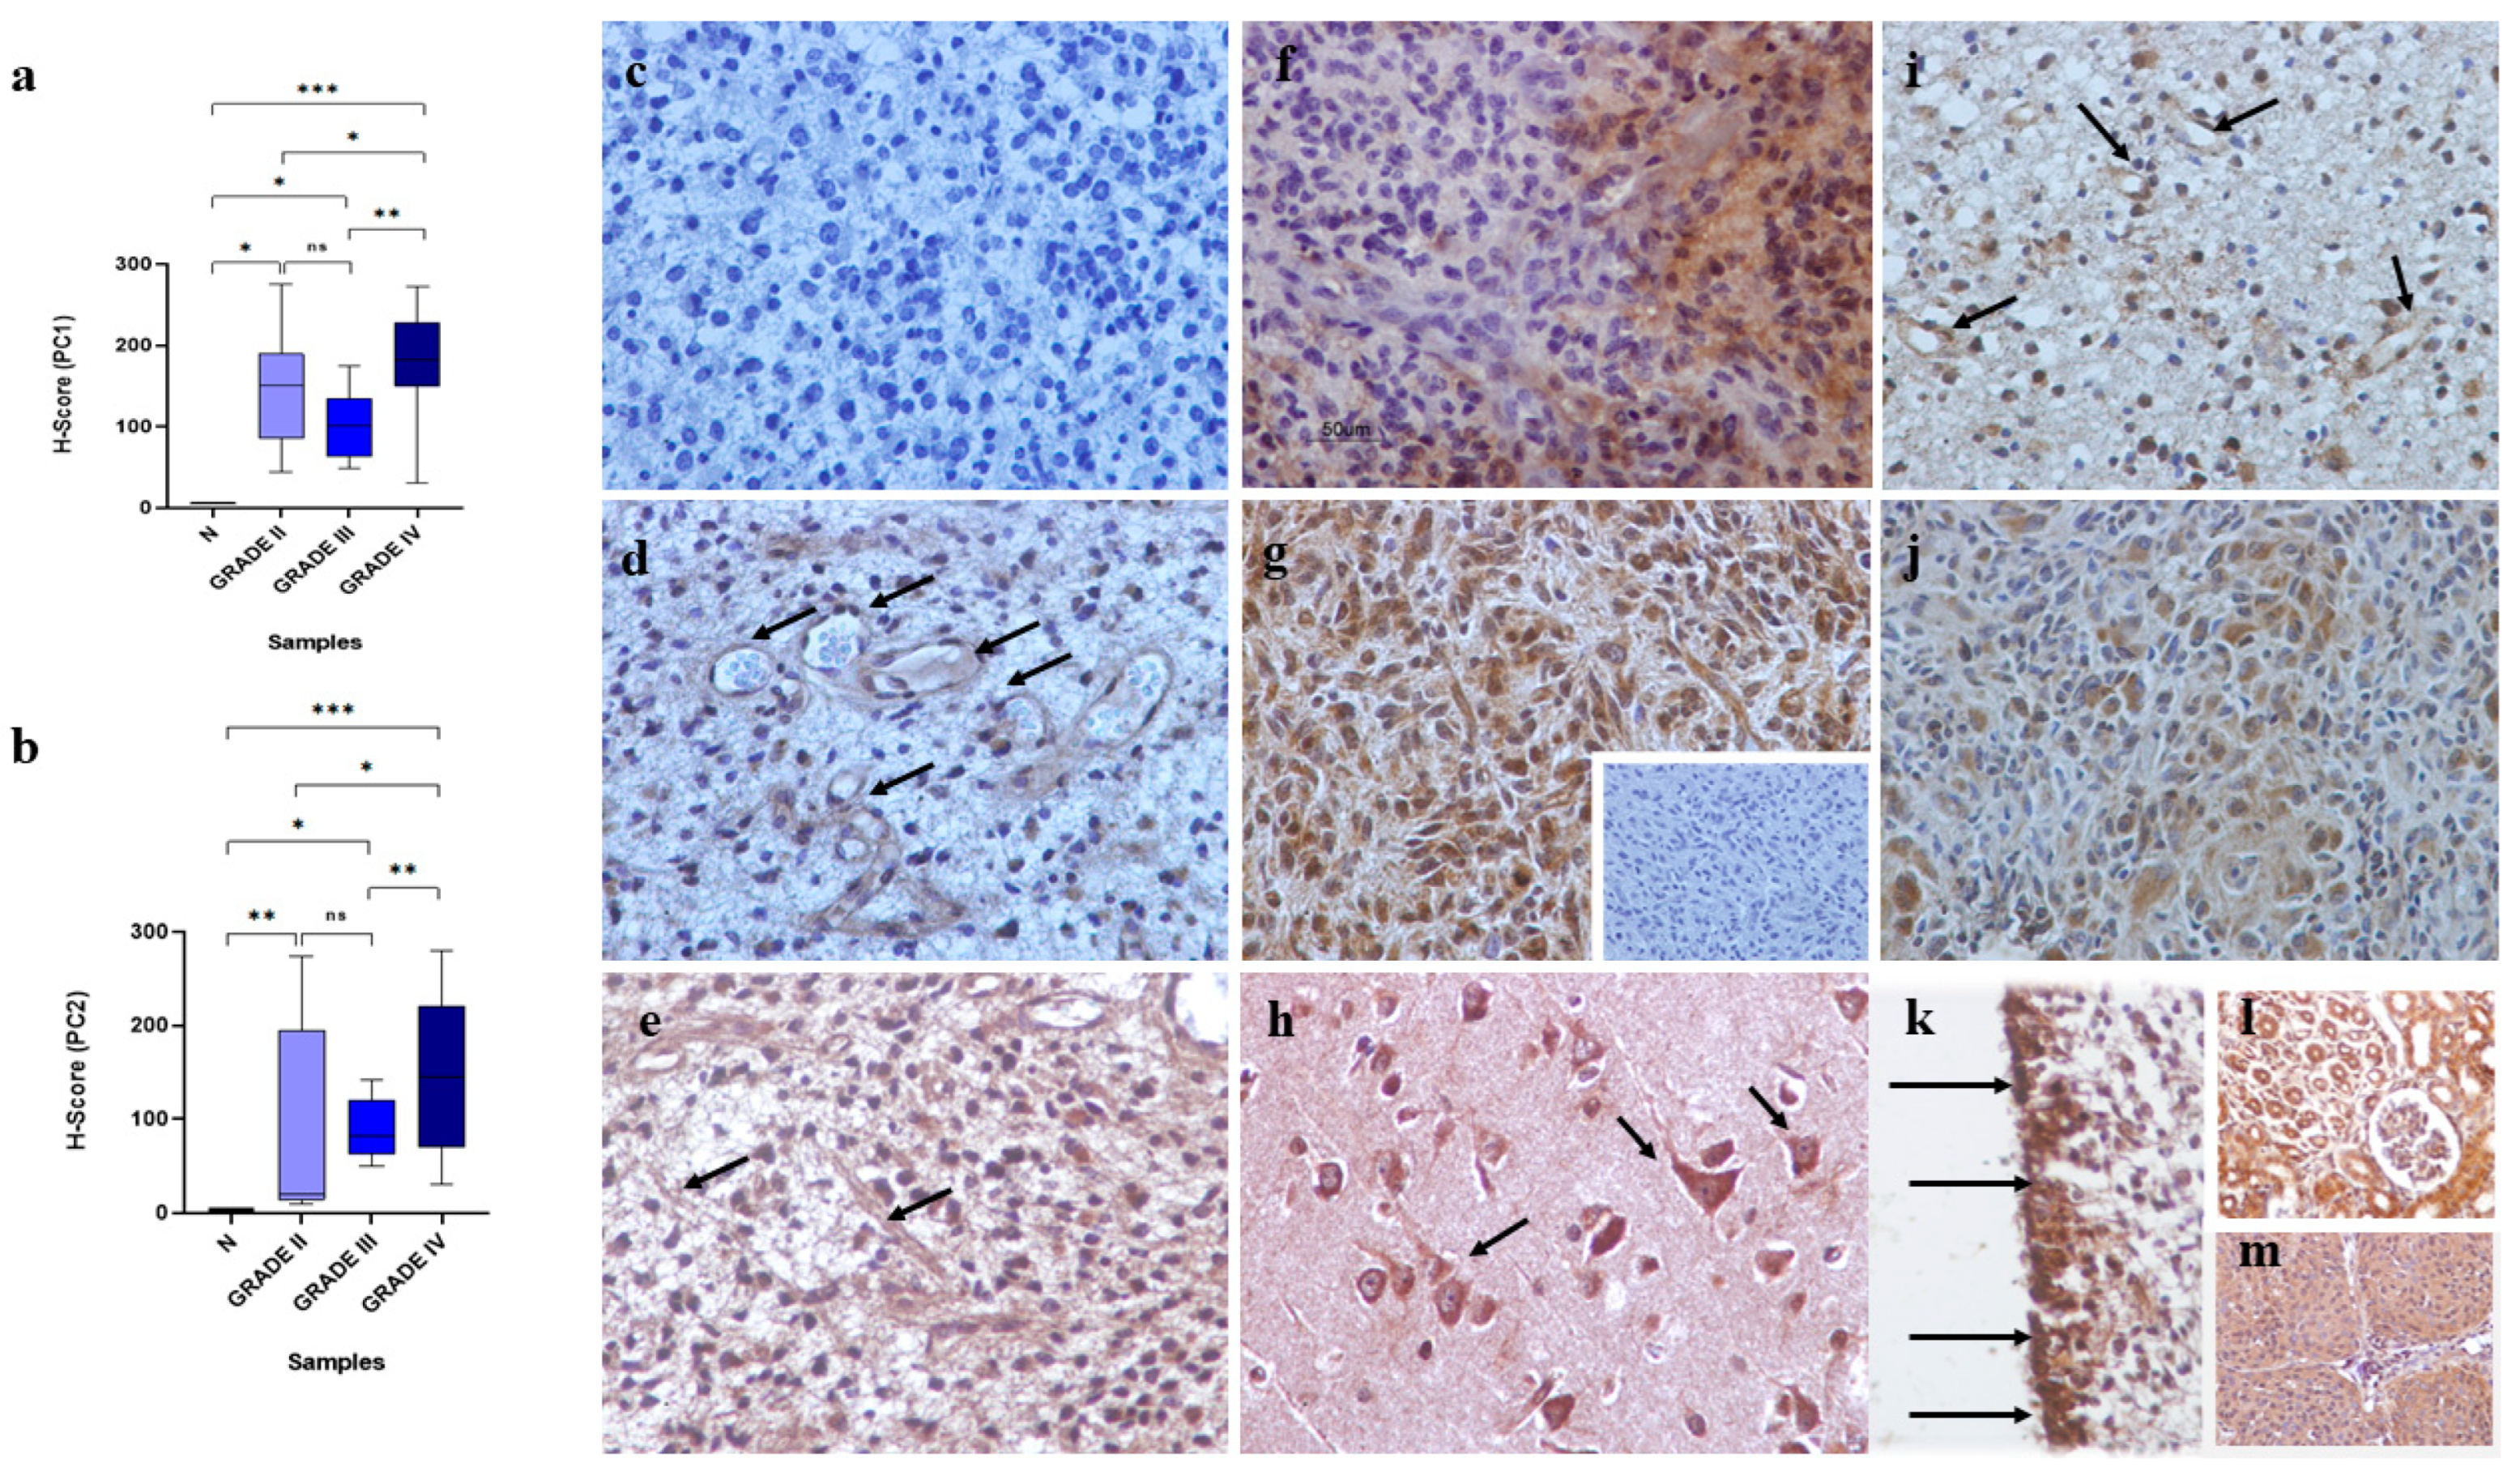
2.2. Immunohistochemistry
2.3. Scoring of Immunohistochemical Staining
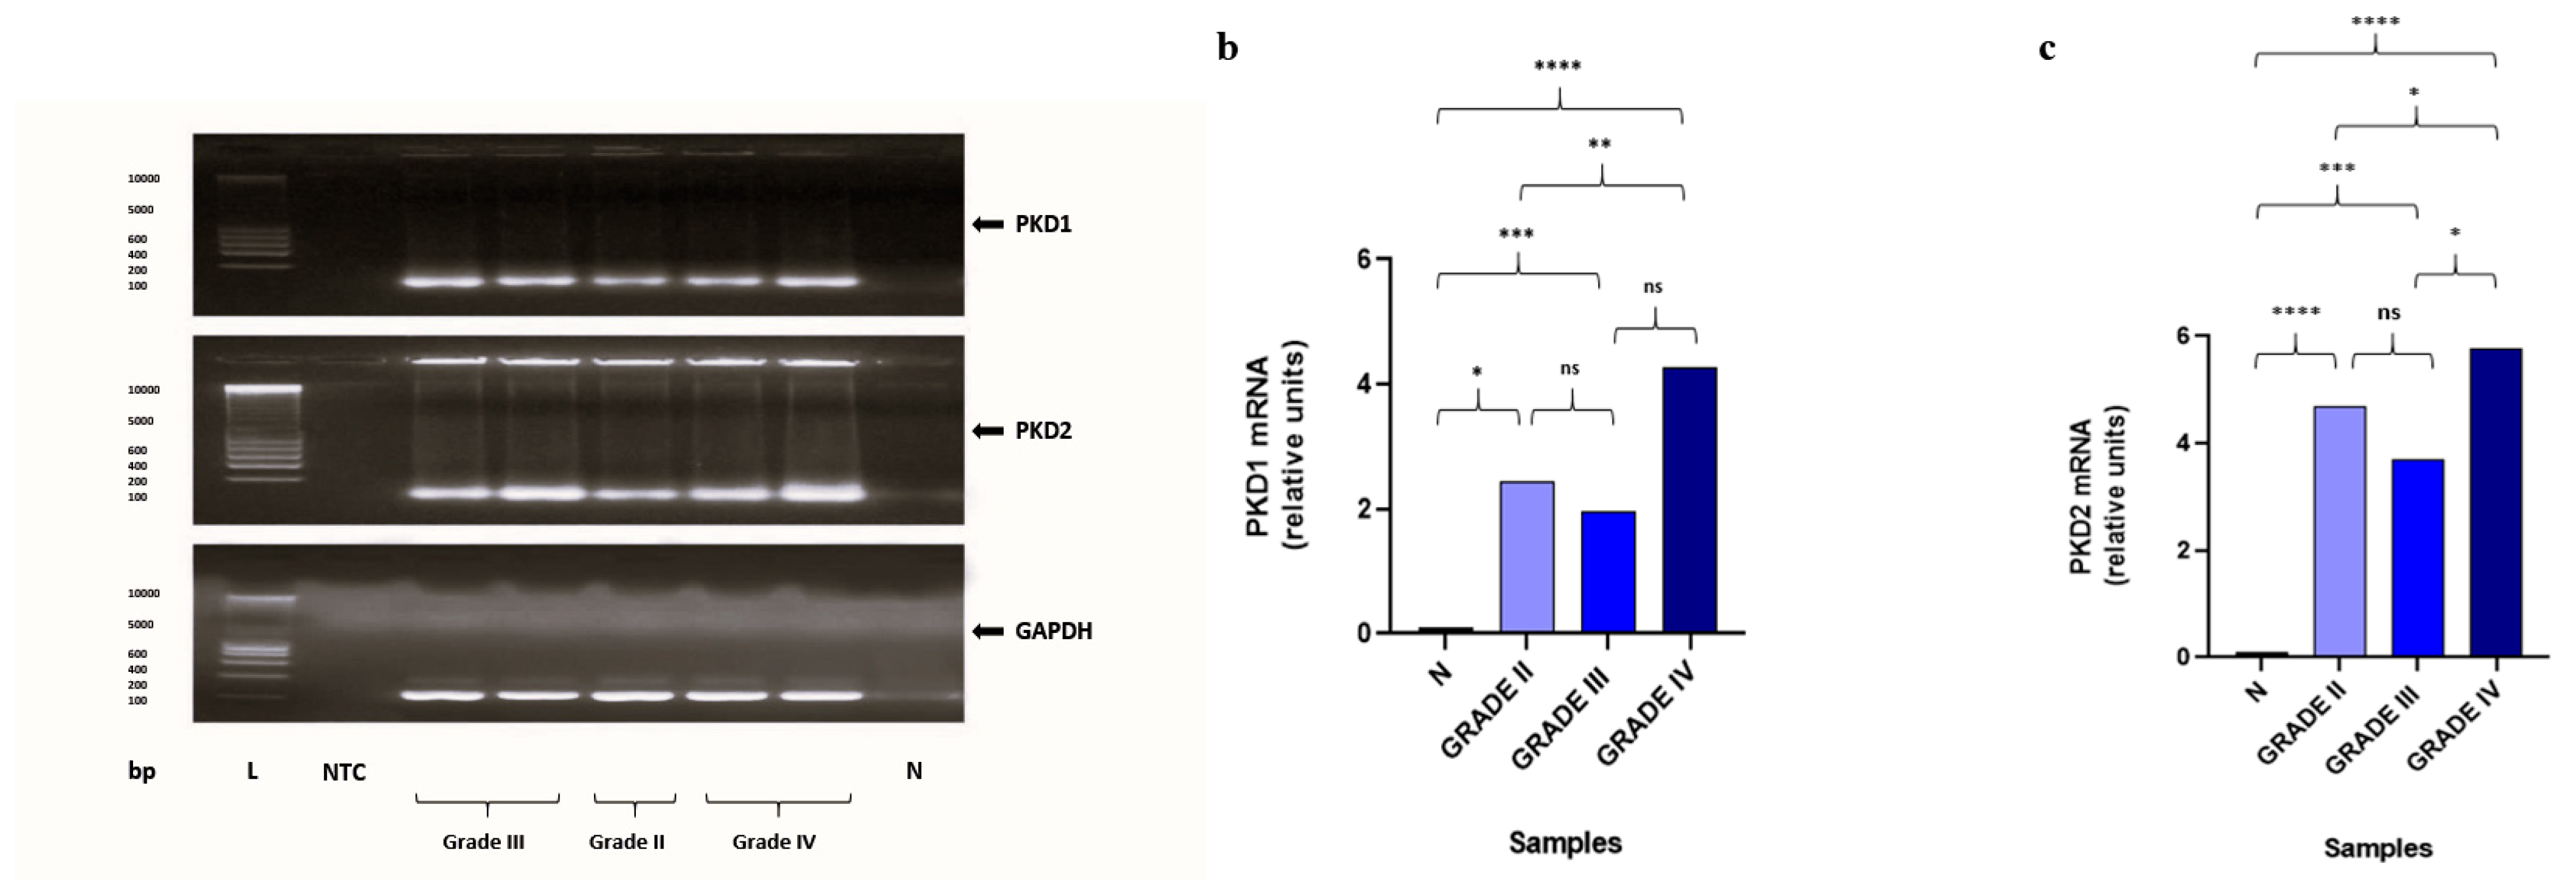
2.4. Gene Expression Analysis of PKD1 and PKD2 by Quantitative Real-Time PCR (qRT-PCR)
2.5. Statistical Analysis
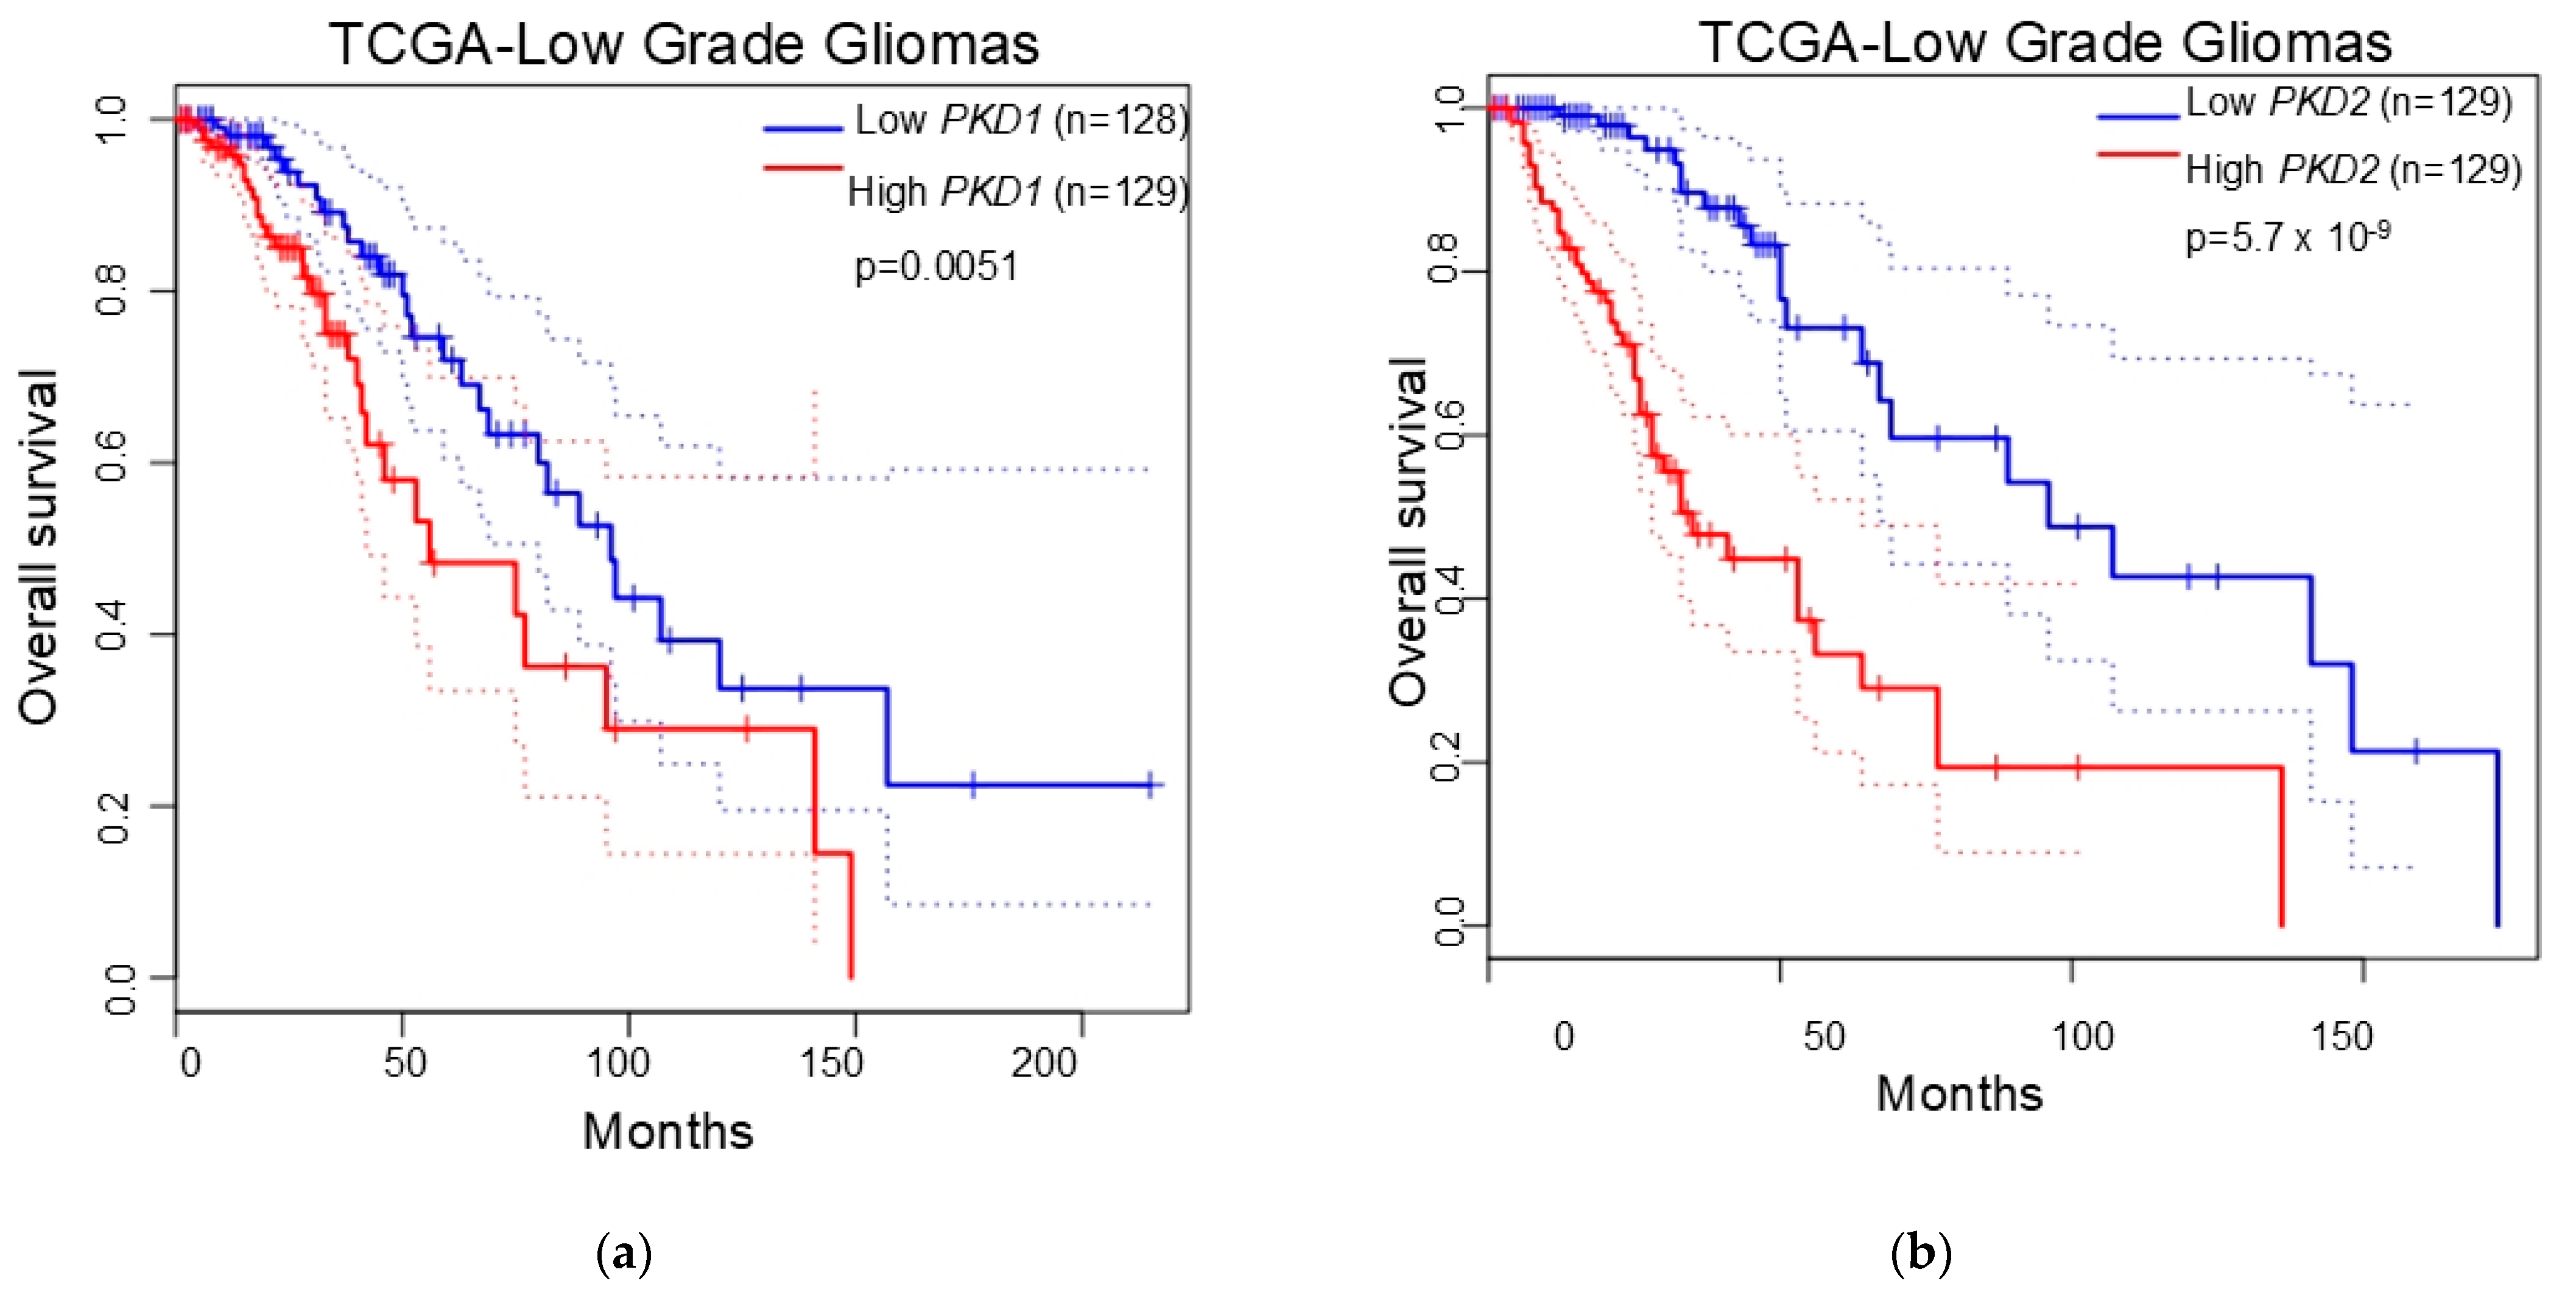
2.6. Survival Analysis
3. Results
3.1. Analysis of the Immunohistochemical and Gene Expression Findings
3.2. Polycystins Immunoexpression in “Normal” Brain Tissue Adjacent to Tumoral Tissue and Normal Brain Samples
3.3. Polycystins Immunoexpression in Association with Clinicopathological Characteristics of the Patients
3.4. Polycystins Expression as a Prognostic Marker in Gliomas
4. Discussion
5. Conclusions
Supplementary Materials
Author Contributions
Funding
Institutional Review Board Statement
Informed Consent Statement
Data Availability Statement
Acknowledgments
Conflicts of Interest
References
- Riemenschneider, M.J.; Guido Reifenberger, G. Astrocytic tumors. Recent Results Cancer Res. 2009, 171, 3–24. [Google Scholar] [CrossRef] [PubMed]
- Loras, A.; Gonzalez-Bonet, L.G.; Gutierrez-Arroyo, J.L.; Martinez-Cadenas, C.; Marques-Torrejon, M.A. Neural Stem Cells as Potential Glioblastoma Cells of Origin. Life 2023, 13, 905. [Google Scholar] [CrossRef]
- Mehrjardi, N.Z.; Hänggi, D.; Kahlert, U.D. Current biomarker-associated procedures of cancer modeling-a reference in the context of IDH1 mutant glioma. Cell Death Dis. 2020, 11, 998. [Google Scholar] [CrossRef]
- Louis, D.N.; Perry, A.; Reifenberger, G.; Von Deimling, A.; Figarella-Branger, D.; Cavenee, W.K.; Ohgaki, H.; Wiestler, O.D.; Kleihues, P.; Ellison, D.W. The 2016 World Health Organization classification of tumors of the central nervous system: A summary. Acta Neuropathol. 2016, 131, 803–820. [Google Scholar] [PubMed]
- Louis, D.N.; Ohgaki, H.; Wiestler, O.D.; Cavenee, W.K.; Burger, P.C.; Jouvet, A.; Scheithauer, B.W.; Kleihues, P. The 2007 WHO classification of tumours of the central nervous system. Acta Neuropathol. 2007, 114, 97–109. [Google Scholar] [CrossRef] [PubMed]
- Louis, D.N.; Perry, A.; Wesseling, P.; Brat, D.J.; Cree, I.A.; Figarella-Branger, D.; Hawkins, C.; Ng, H.K.; Pfister, S.M.; Reifenberger, G.; et al. The 2021 WHO Classification of Tumors of the Central Nervous System: A summary. Neuro-Oncology 2021, 23, 1231–1251. [Google Scholar]
- Berger, M.S.; Shawn Hervey-Jumper, S.; Wick, W. Astrocytic gliomas WHO grades II and III. Handb. Clin. Neurol. 2016, 134, 345–360. [Google Scholar] [CrossRef]
- Sharma, A.; Graber, J.J. Overview of prognostic factors in adult gliomas. Ann. Palliat. Med. 2021, 10, 863–874. [Google Scholar] [CrossRef]
- De Fazio, E.; Pittarello, M.; Gans, A.; Ghosh, B.; Slika, H.; Alimonti, P.; Tyler, B. Intrinsic and Microenvironmental Drivers of Glioblastoma Invasion. Int. J. Mol. Sci. 2024, 25, 2563. [Google Scholar] [CrossRef]
- Fabian, C.; Han, M.; Bjerkvig, R.; Niclou, S.P. Novel facets of glioma invasion. Int. Rev. Cell Mol. Biol. 2021, 360, 33–64. [Google Scholar] [CrossRef]
- Osswald, O.; Jung, E.; Felix Sahm, F.; Gergely Solecki, G.; Venkataramani, V.; Blaes, J.; Weil, S.; Horstmann, H.; Wiestler, B.; Syed, M.; et al. Brain tumour cells interconnect to a functional and resistant network. Nature 2015, 528, 93–98. [Google Scholar] [CrossRef] [PubMed]
- Parmigiani, E.; Scalera, M.; Mori, E.; Tantillo, E.; Vannini, E. Old Stars and New Players in the Brain Tumor Microenvironment. Front. Cell. Neurosci. 2021, 15, 709917. [Google Scholar] [CrossRef]
- Sharma, P.; Aaroe, A.; Liang, J.; Puduvalli, V.K. Tumor microenvironment in glioblastoma: Current and emerging concepts. Neuro-Oncol. Adv. 2023, 5, vdad009. [Google Scholar] [CrossRef]
- Ghata, J.; Cowley, B.D., Jr. Polycystic Kidney Disease. Compr. Physiol. 2017, 7, 945–975. [Google Scholar] [CrossRef]
- Wilson, P.D. Polycystin: New aspects of structure, function, and regulation. J. Am. Soc. Nephrol. 2001, 12, 834–845. [Google Scholar] [CrossRef]
- Drummond, I.A. Polycystins, focal adhesions and extracellular matrix interactions. Biochim. Biophys. Acta 2011, 1812, 1322–1326. [Google Scholar] [CrossRef] [PubMed]
- Castelli, M.; De Pascalis, C.; Distefano, G.; Ducano, N.; Oldani, A.; Lanzetti, L.; Boletta, A. Regulation of the microtubular cytoskeleton by Polycystin-1 favors focal adhesions turnover to modulate cell adhesion and migration. BMC Cell Biol. 2015, 16, 15. [Google Scholar] [CrossRef]
- Boca, M.; D’Amato, L.; Distefano, G.; Polishchuk, R.S.; Germino, G.G.; Boletta, A. Polycystin-1 induces cell migration by regulating phosphatidylinositol 3-kinase-dependent cytoskeletal rearrangements and GSK3β-dependent cell-cell mechanical adhesion. Mol. Biol. Cell 2007, 18, 4050–4061. [Google Scholar] [CrossRef]
- Retailleau, K.; Duprat, F. Polycystins and partners: Proposed role in mechanosensitivity. J. Physiol. 2014, 592, 2453–2471. [Google Scholar] [CrossRef]
- Nigro, E.A.; Boletta, A. Role of the polycystins as mechanosensors of extracellular stiffness. Am. J. Physiol. Ren. Physiol. 2021, 320, F693–F705. [Google Scholar] [CrossRef]
- Brill, A.L.; Ehrlich, B.E. Polycystin 2: A calcium channel, channel partner, and regulator of calcium homeostasis in ADPKD. Cell Signal. 2020, 66, 109490. [Google Scholar] [CrossRef] [PubMed]
- Hardy, E.; Tsiokas, L. Polycystins as components of large multiprotein complexes of polycystin interactors. Cell Signal. 2020, 72, 109640. [Google Scholar] [CrossRef]
- Gallagher, A.R.; Cedzich, A.; Gretz, N.; Somlo, S.; Witzgall, R. The polycystic kidney disease protein PKD2 interacts with Hax-1, a protein associated with the actin cytoskeleton. Proc. Natl. Acad. Sci. USA 2000, 97, 4017–4022. [Google Scholar] [CrossRef] [PubMed]
- Grimm, D.H.; Karihaloo, A.; Cai, Y.; Somlo, S.; Cantley, L.G.; Caplan, M.J. Polycystin-2 regulates proliferation and branching morphogenesis in kidney epithelial cells. J. Biol. Chem. 2006, 281, 137–144. [Google Scholar] [CrossRef]
- Zhong, T.; Zhang, W.; Guo, H.; Pan, X.; Chen, X.; He, Q.; Yang, B.; Ding, L. The regulatory and modulatory roles of TRP family channels in malignant tumors and relevant therapeutic strategies. Acta Pharm. Sin. B 2022, 12, 1761–1780. [Google Scholar] [CrossRef]
- Elias, A.F.; Lin, B.C.; Piggott, B.J. Ion Channels in Gliomas-From Molecular Basis to Treatment. Int. J. Mol. Sci. 2023, 24, 2530. [Google Scholar] [CrossRef] [PubMed]
- Zoi, I.; Gargalionis, A.N.; Papavassiliou, K.A.; Nasiri-Ansari, N.; Piperi, C.; Basdra, E.K.; Papavassiliou, A.G. Polycystin-1 and hydrostatic pressure are implicated in glioblastoma pathogenesis in vitro. J. Cell. Mol. Med. 2022, 26, 1699–1709. [Google Scholar] [CrossRef]
- Gargalionis, A.N.; Sarlani, E.; Stofas, A.; Malakou, L.S.; Adamopoulos, C.; Bamias, A.; Boutati, E.; Constantinides, C.A.; Stravodimos, K.G.; Piperi, C.; et al. Polycystin-1 induces activation of the PI3K/AKT/mTOR pathway and promotes angiogenesis in renal cell carcinoma. Cancer Lett. 2020, 489, 135–143. [Google Scholar] [CrossRef]
- Gargalionis, A.N.; Korkolopoulou, P.; Farmaki, E.; Piperi, C.; Dalagiorgou, G.; Adamopoulos, C.; Levidou, G.; Saetta, A.; Fragkou, P.; Tsioli, P.; et al. Polycystin-1 and polycystin-2 are involved in the acquisition of aggressive phenotypes in colorectal cancer. Int. J. Cancer 2015, 136, 1515–1527. [Google Scholar] [CrossRef]
- Wu, K.; Shen, B.; Jiang, F.; Xia, L.; Fan, T.; Qin, M.; Yang, L.; Guo, J.; Li, Y.; Zhu, M.; et al. TRPP2 enhances metastasis by regulating epithelial-mesenchymal transition in laryngeal squamous cell carcinoma. Cell Physiol. Biochem. 2016, 39, 2203–2215. [Google Scholar] [CrossRef]
- Zhang, T.; Yu, G.-D.; Ye, H.-P.; Jin, Y. TRPP2 promotes the proliferation of nasopharyngeal carcinoma through upregulating Skp2/c-Myc. Eur. Rev. Med. Pharmacol. Sci. 2020, 24, 8001–8007. [Google Scholar] [CrossRef] [PubMed]
- Assimakopoulou, M.; Christopoulou, M.-E.; Karamani, V.; Aletras, A.J.; Gatzounis, G. Polycystin-2 associates with malignancy in meningiomas. Appl. Immunohistochem. Mol. Morphol. 2023, 31, 239–244. [Google Scholar] [CrossRef] [PubMed]
- Altman, D.G. Practical Statistics for Medical Research; Chapman and Hall: London, UK, 1991. [Google Scholar]
- Jin, H.; Yu, Z.; Tian, T.; Shen, G.; Chen, W.; Fan, M.; He, Q.; Dai, D.; Zhang, X.; Liu, D. Integrative Genomic and Transcriptomic Analysis of Primary Malignant Gliomas Revealed Different Patterns Between Grades and Somatic Mutations Related to Glioblastoma Prognosis. Front. Mol. Biosci. 2022, 9, 873042. [Google Scholar] [CrossRef]
- Ma, Y.; Yuan, R.; Fan, S.; Hu, C.; Goldberg, I.D.; Laterra, J.J.; Rosen, E.M. Identification of genes that modulate sensitivity of U373MG glioblastoma cells to cis-platinum. Anti-Cancer Drugs 2006, 17, 733–751. [Google Scholar] [CrossRef]
- Venkataramani, V.; Tanev, D.I.; Strahle, C.; Studier-Fischer, A.; Fankhauser, L.; Kessler, T.; Körber, C.; Kardorff, M.; Ratliff, M.; Xie, R.; et al. Glutamatergic synaptic input to glioma cells drives brain tumour progression. Nature 2019, 573, 532–538. [Google Scholar]
- Venkataramani, V.; Yang, Y.; Schubert, M.C.; Reyhan, E.; Tetzlaff, S.K.; Wißmann, N.; Botz, M.; Soyka, S.J.; Beretta, C.A.; Pramatarov, R.L.; et al. Glioblastoma hijacks neuronal mechanisms for brain invasion. Cell 2022, 185, 2899–2917.e31. [Google Scholar]

| Clinical Characteristics | Histological Classification (WHO) | ||
|---|---|---|---|
| Diffuse Fibrillary Astrocytomas (WHO, Grade II) | Anaplastic Astrocytomas (WHO, Grade III) | Glioblastomas Multiforme (WHO, Grade IV) | |
| No. of patients | 8 | 12 | 50 |
| Age (years) | |||
| Mean ± SD (range) | 47.25 ± 12.61 (27–64) | 49.08 ± 18.32 (18–75) | 57.29 ± 13.47 (30–82) |
| ≥60 | 1 (12.50%) | 5 (41.66%) | 22 (44.00%) |
| Sex | |||
| Male | 5 (62.50%) | 8 (66.67%) | 26 (52%) |
| Female | 3 (37.5%) | 4 (33.33%) | 24 (48%) |
| Tumor location | |||
| supratentorial | 8 (100%) | 12 (100%) | 50 (100%) |
| not supratentorial | 0 (0%) | 0 (0%) | 0 (0%) |
| Prior treatment | 0 (0%) | 0 (%) | 2 (4%) |
| Primary/recurrent tumors | 1 (12.5%)/7 (87.5%) | 1 (8.33%)/11 (91.67%) | 10 (20%)/40 (80%) |
| Gene | Primer | Sequence 5′-3′ |
|---|---|---|
| PKD1 | Forward Reverse | CAAGACACCCACATGGAAACG CGCCAGCGTCTCTGTCTTCT |
| PKD2 | Forward Reverse | GCGAGGTCTCTGGGGAAC TACACATGGAGCTCATCATGC |
| GAPDH | Forward Reverse | GAGTCAAGCGATTTGGTCGT TTGATTTTGGAGGGATCTCG |
| Tumor Group | Diffuse Fibrillary Astrocytomas (WHO, Grade II) | Anaplastic Astrocytomas (WHO, Grade III) | Glioblastomas Multiforme (WHO, Grade IV) | |||
|---|---|---|---|---|---|---|
| PC1 | PC2 | PC1 | PC2 | PC1 | PC2 | |
| MLI, % | 150.00 a | 20.00 | 101.00 | 82.00 | 182.00 b | 130.00 |
| IQR, % | 85.00–190.00 | 13.50–195.00 | 63.00–135.00 | 62.50–120.50 | 149.25–228.25 | 50.50–220.50 |
| Minimum LI, % | 44.00 | 10.00 | 48.00 | 50.00 | 31.00 | 10.00 |
| Maximum LI, % | 275.00 | 274.00 | 175.00 | 141.00 | 272.00 | 280.00 |
Disclaimer/Publisher’s Note: The statements, opinions and data contained in all publications are solely those of the individual author(s) and contributor(s) and not of MDPI and/or the editor(s). MDPI and/or the editor(s) disclaim responsibility for any injury to people or property resulting from any ideas, methods, instructions or products referred to in the content. |
© 2025 by the authors. Licensee MDPI, Basel, Switzerland. This article is an open access article distributed under the terms and conditions of the Creative Commons Attribution (CC BY) license (https://creativecommons.org/licenses/by/4.0/).
Share and Cite
Assimakopoulou, M.; Soufli, K.; Melachrinou, M. Polycystins Expression in Astrocytic Gliomas. Biomedicines 2025, 13, 884. https://doi.org/10.3390/biomedicines13040884
Assimakopoulou M, Soufli K, Melachrinou M. Polycystins Expression in Astrocytic Gliomas. Biomedicines. 2025; 13(4):884. https://doi.org/10.3390/biomedicines13040884
Chicago/Turabian StyleAssimakopoulou, Martha, Konstantina Soufli, and Maria Melachrinou. 2025. "Polycystins Expression in Astrocytic Gliomas" Biomedicines 13, no. 4: 884. https://doi.org/10.3390/biomedicines13040884
APA StyleAssimakopoulou, M., Soufli, K., & Melachrinou, M. (2025). Polycystins Expression in Astrocytic Gliomas. Biomedicines, 13(4), 884. https://doi.org/10.3390/biomedicines13040884