Article

Integrative Bioinformatic Analysis of Cellular Senescence Genes in Ovarian Cancer: Molecular Subtyping, Prognostic Risk Stratification, and Chemoresistance Prediction

Department of Gynecology, The Affiliated Jiangning Hospital of Nanjing Medical University, Nanjing 211199, China
*
Author to whom correspondence should be addressed.
Biomedicines 2025, 13(4), 877; https://doi.org/10.3390/biomedicines13040877
Submission received: 23 February 2025 / Revised: 23 March 2025 / Accepted: 2 April 2025 / Published: 4 April 2025
(This article belongs to the Special Issue Advanced Research in Gynecologic Oncology)

Abstract

:
Background: Ovarian cancer (OC) is a heterogeneous malignancy associated with a poor prognosis, necessitating robust biomarkers for risk stratification and therapy optimization. Cellular senescence-related genes (CSGs) are emerging as pivotal regulators of tumorigenesis and immune modulation, yet their prognostic and therapeutic implications in OC remain underexplored. Methods: We integrated RNA-sequencing data from TCGA-OV (n = 376), GTEx (n = 88), and GSE26712 (n = 185) to identify differentially expressed CSGs (DE-CSGs). Consensus clustering, Cox regression, LASSO-penalized modeling, and immune infiltration analyses were employed to define molecular subtypes, construct a prognostic risk score, and characterize tumor microenvironment (TME) dynamics. Drug sensitivity was evaluated using the Genomics of Drug Sensitivity in Cancer (GDSC)-derived chemotherapeutic response profiles. Results: Among 265 DE-CSGs, 31 were prognostic in OC, with frequent copy number variations (CNVs) in genes such as STAT1, FOXO1, and CCND1. Consensus clustering revealed two subtypes (C1/C2): C2 exhibited immune-rich TME, elevated checkpoint expression (PD-L1, CTLA4), and poorer survival. A 19-gene risk model stratified patients into high-/low-risk groups, validated in GSE26712 (AUC: 0.586–0.713). High-risk patients showed lower tumor mutation burden (TMB), immune dysfunction, and resistance to Docetaxel/Olaparib. Six hub genes (HMGB3, MITF, CKAP2, ME1, CTSD, STAT1) were independently predictive of survival. Conclusions: This study establishes CSGs as critical determinants of OC prognosis and immune evasion. The molecular subtypes and risk model provide actionable insights for personalized therapy, while identified therapeutic vulnerabilities highlight opportunities to overcome chemoresistance through senescence-targeted strategies.

1. Introduction

Ovarian cancer (OC) ranks as the fifth leading cause of cancer-related mortality among women worldwide, with over 313,000 new cases annually and a five-year survival rate stagnating below 46% [1,2]. Late-stage diagnoses and intrinsic molecular heterogeneity contribute to therapeutic resistance and poor prognosis, underscoring the urgent need for biomarkers guiding personalized therapy [3]. While genomic studies have implicated dysregulated proliferation and apoptosis in OC pathogenesis [4], the role of cellular senescence—a state of irreversible cell cycle arrest—remains poorly defined, despite its dualistic role in both suppressing tumorigenesis and fostering pro-metastatic microenvironments [5,6,7,8,9].
Cellular senescence is triggered by diverse stressors, including DNA damage, oxidative stress, and telomere attrition [5,6]. Senescent cells secrete pro-inflammatory factors via the senescence-associated secretory phenotype (SASP), remodeling the tumor microenvironment (TME) to promote immune evasion, angiogenesis, and chemoresistance [7,8,9]. In OC, preclinical models suggest that senescent tumor-associated fibroblasts (TAFs) drive immunosuppression through SASP-mediated recruitment of myeloid-derived suppressor cells (MDSCs) [10,11,12]. Paradoxically, senescence induction in cancer cells may also enhance chemosensitivity, highlighting context-dependent roles that warrant systematic exploration [13].
Despite these advances, no study has comprehensively mapped the landscape of senescence-related genes (CSGs) in OC or evaluated their clinical utility for prognosis prediction and therapy selection. This study aims to (1) identify CSGs with prognostic significance through multi-omics data integration; (2) delineate CSG-driven molecular subtypes and their immune microenvironment features; and (3) uncover CSG-associated therapeutic vulnerabilities using drug sensitivity profiling. Our findings provide a framework for targeting senescence-immune crosstalk to overcome treatment resistance in OC.

2. Materials and Methods

2.1. Data Acquisition and Preprocessing

The analytical workflow is illustrated in Figure 1. RNA-sequencing raw count matrices from 379 OC samples (TCGA-OV) and 88 normal ovarian tissues (GTEx) were downloaded from the UCSC Xena platform [14]. After merging the datasets and removing duplicate genes, we unified gene symbols to Ensembl IDs, retaining only intersecting genes across both platforms. Samples with incomplete clinical annotations were excluded, retaining 376 OC cases for downstream analyses. To address batch effects inherent in integrating distinct genomic datasets (TCGA vs. GTEx), raw counts were harmonized using the ComBat-seq algorithm [15]. Normalization was then performed via DESeq2 [16]: (1) median-of-ratios normalization for library size adjustment. (2) Variance-stabilizing transformation (VST) to stabilize expression variance across dynamic ranges. Somatic mutation spectra, copy number variation (CNV) landscapes, and clinicopathological metadata were concurrently extracted from TCGA. An independent validation cohort (GSE26712, n = 185 serous ovarian carcinoma patients) was procured from the GEO database. We obtained 866 CSGs from the CellAge database (Table S1), which exclusively includes genes with experimental evidence of regulating cellular senescence [17]. This ensures high-confidence selection of biologically relevant targets.

2.2. Differential Expression Profiling

To delineate senescence-associated transcriptional alterations, we applied the limma framework [18] for comparative analysis between OC and normal tissues, adopting thresholds of |log2FoldChange (FC)| > 1.5 and adjusted p < 0.05. Intersection of differentially expressed genes (DEGs) with the CSGs identified senescence-related DEGs (DE-CSGs). Prognostically significant DE-CSGs were further selected through univariate Cox regression (p < 0.05). Functional annotation of these genes leveraged Gene Ontology (GO) profiling and Kyoto Encyclopedia of Genes and Genomes (KEGG) enrichment analyses (“ClusterProfiler” (version 4.10.1) and “org.Hs.eg.db” (version 3.18.0) packages) [19], complemented by genome-wide CNV aberration mapping.

2.3. Molecular Subtyping Driven by Senescence Signatures

Consensus clustering (“ConsensusClusterPlus” package (version 1.66.0), K-means algorithm) partitioned OC patients into senescence-defined subtypes [20]. Inter-subtype transcriptomic divergence was validated via principal component analysis (PCA). Subsequent Gene Set Enrichment Analysis (GSEA) (“ClusterProfiler” package) using the C2 curated gene sets (MSigDB c2.cp.all.v2022.1.Hs) decoded pathway-level disparities, while survival disparities were quantified using Kaplan–Meier (K–M) curves (“survival” (version 3.5.8), and “survminer” (version 0.4.9) packages). The ESTIMATE algorithm deconvoluted TME scores [21], and ssGSEA (“GSVA” package (version 1.50.5)) enumerated infiltrating immune cell fractions across subtypes [22]. Immune checkpoint genes expression patterns were comparatively assessed.

2.4. Prognostic Model Construction

The least absolute shrinkage and selection operator (LASSO)-penalized Cox regression (“glmnet” package (version 4.1.8)) with 10-fold cross-validation was applied to select optimal DE-CSGs and construct a composite risk score: risk score = ∑ (expr_genei × coefficient_genei). Patients were dichotomized into high-/low-risk cohorts by median score. Survival disparities were evaluated via log-rank testing (“survminer” package), with risk–clinicopathological correlations visualized through “ggplot2”.

2.5. Hub Genes Identification and Nomogram Construction

A multivariable Cox regression analysis identified six hub CSGs (HMGB3, MITF, CKAP2, ME1, CTSD, STAT1) as independent prognostic factors for overall survival (OS) (p < 0.05). These were integrated into a nomogram (“rms” package (version 6.7.1)) predicting 1-, 3-, and 5-year survival probabilities. The model discrimination was evaluated through time-dependent operating characteristic (ROC) and calibration curves, with external validation performed in GSE26712.

2.6. Functional and Genomic Characterization of Risk Groups

GSEA was performed to identify significantly enriched biological pathways distinguishing high- and low-risk groups. Tumor mutation burden (TMB) was quantified via “maftools” package (version 2.18.0), correlating mutational landscapes with risk stratification.

2.7. Immune Infiltration

The ssGSEA algorithm was employed to quantify enrichment scores of 24 functionally distinct immune cell populations across risk-stratified cohorts, while ESTIMATE analysis was concurrently performed to compute comprehensive stromal and immune scores characterizing the TME landscape in ovarian cancer patients.

2.8. Drug Sensitivity Analysis

Pharmacogenomic analysis utilizing the Genomics of Drug Sensitivity in Cancer (GDSC) database (https://www.cancerrxgene.org/, accessed on 27 December 2024) was conducted with “oncoPredict” (version 0.2) and “pRRophetic” (version 0.5) R packages to quantify therapeutic responses through half-maximal inhibitory concentration (IC50) measurements [23,24]. Comparative analysis between risk-stratified cohorts revealed ovarian cancer agents with distinct drug sensitivity profiles.

2.9. Statistical Methods

The statistical analysis was implemented in R (version 4.3.3). Continuous variables with normal distribution were analyzed using Student’s t-test, while non-parametric comparisons employed the Wilcoxon rank-sum test. Categorical variable analyses utilized χ² tests or Fisher’s exact tests as appropriate. Data visualization was created with “ggplot2” (version 3.5.1), “ggpubr” (version 0.6.0), and “enrichplot” (version 1.20.0) packages.

3. Results

3.1. Transcriptomic Landscape of DE-CSGs

Comparative transcriptomic analysis of OC tissues versus normal tissues identified 4247 DEGs. Intersection of these DEGs with the 866 CSGs yielded 265 DE-CSGs, including 134 upregulated and 131 downregulated candidates (Figure 2A and Table S2). Univariate Cox regression analysis identified 31 DE-CSGs significantly associated with OS in the TCGA cohort, whose distinct expression profiles between OC and normal ovarian tissues are visually demonstrated in the hierarchically clustered heatmap (Figure 2B). Functional annotation of the 31 prognostic DE-CSGs revealed distinct pathway preferences (Figure 2C). Biological processes centered on immunoregulation (B cell activation suppression), developmental signaling modulation (Wnt pathway inhibition), and senescence dynamics (epithelial proliferation control, replicative/cellular senescence). Molecular functions predominantly involved transcriptional regulation (coregulator/corepressor binding) and post-translational modification machinery (serine kinase/PP2A phosphatase activity, ubiquitin-like ligase interactions). KEGG pathway enrichment underscored their roles in cancer biology through three axes: signal transduction (FoxO and NOD-like receptor pathways), senescence and microenvironment modulation (cellular senescence, proteoglycan networks), and oncogenic transformation (transcriptional deregulation).

3.2. CNV Analysis of DE-CSGs

Genomic instability analysis of the 31 prognostic DE-CSGs revealed clinically relevant copy number alterations (Figure 2D,E). CNV data profiling identified recurrent genomic events, with chromosome 1q (TXNIP, RNASEL), 2q (STAT1, PLA2R1), 7q (MET), and 19q (ZFP36) harboring recurrent amplifications (frequency > 40%), while 13q (FOXO1, CKAP2), 17q (MINK1, KRT19, SREBF1), and 19q (MATK) exhibited prevalent deletions (frequency > 50%). These loci represent potential therapeutic vulnerabilities linked to OC pathogenesis.

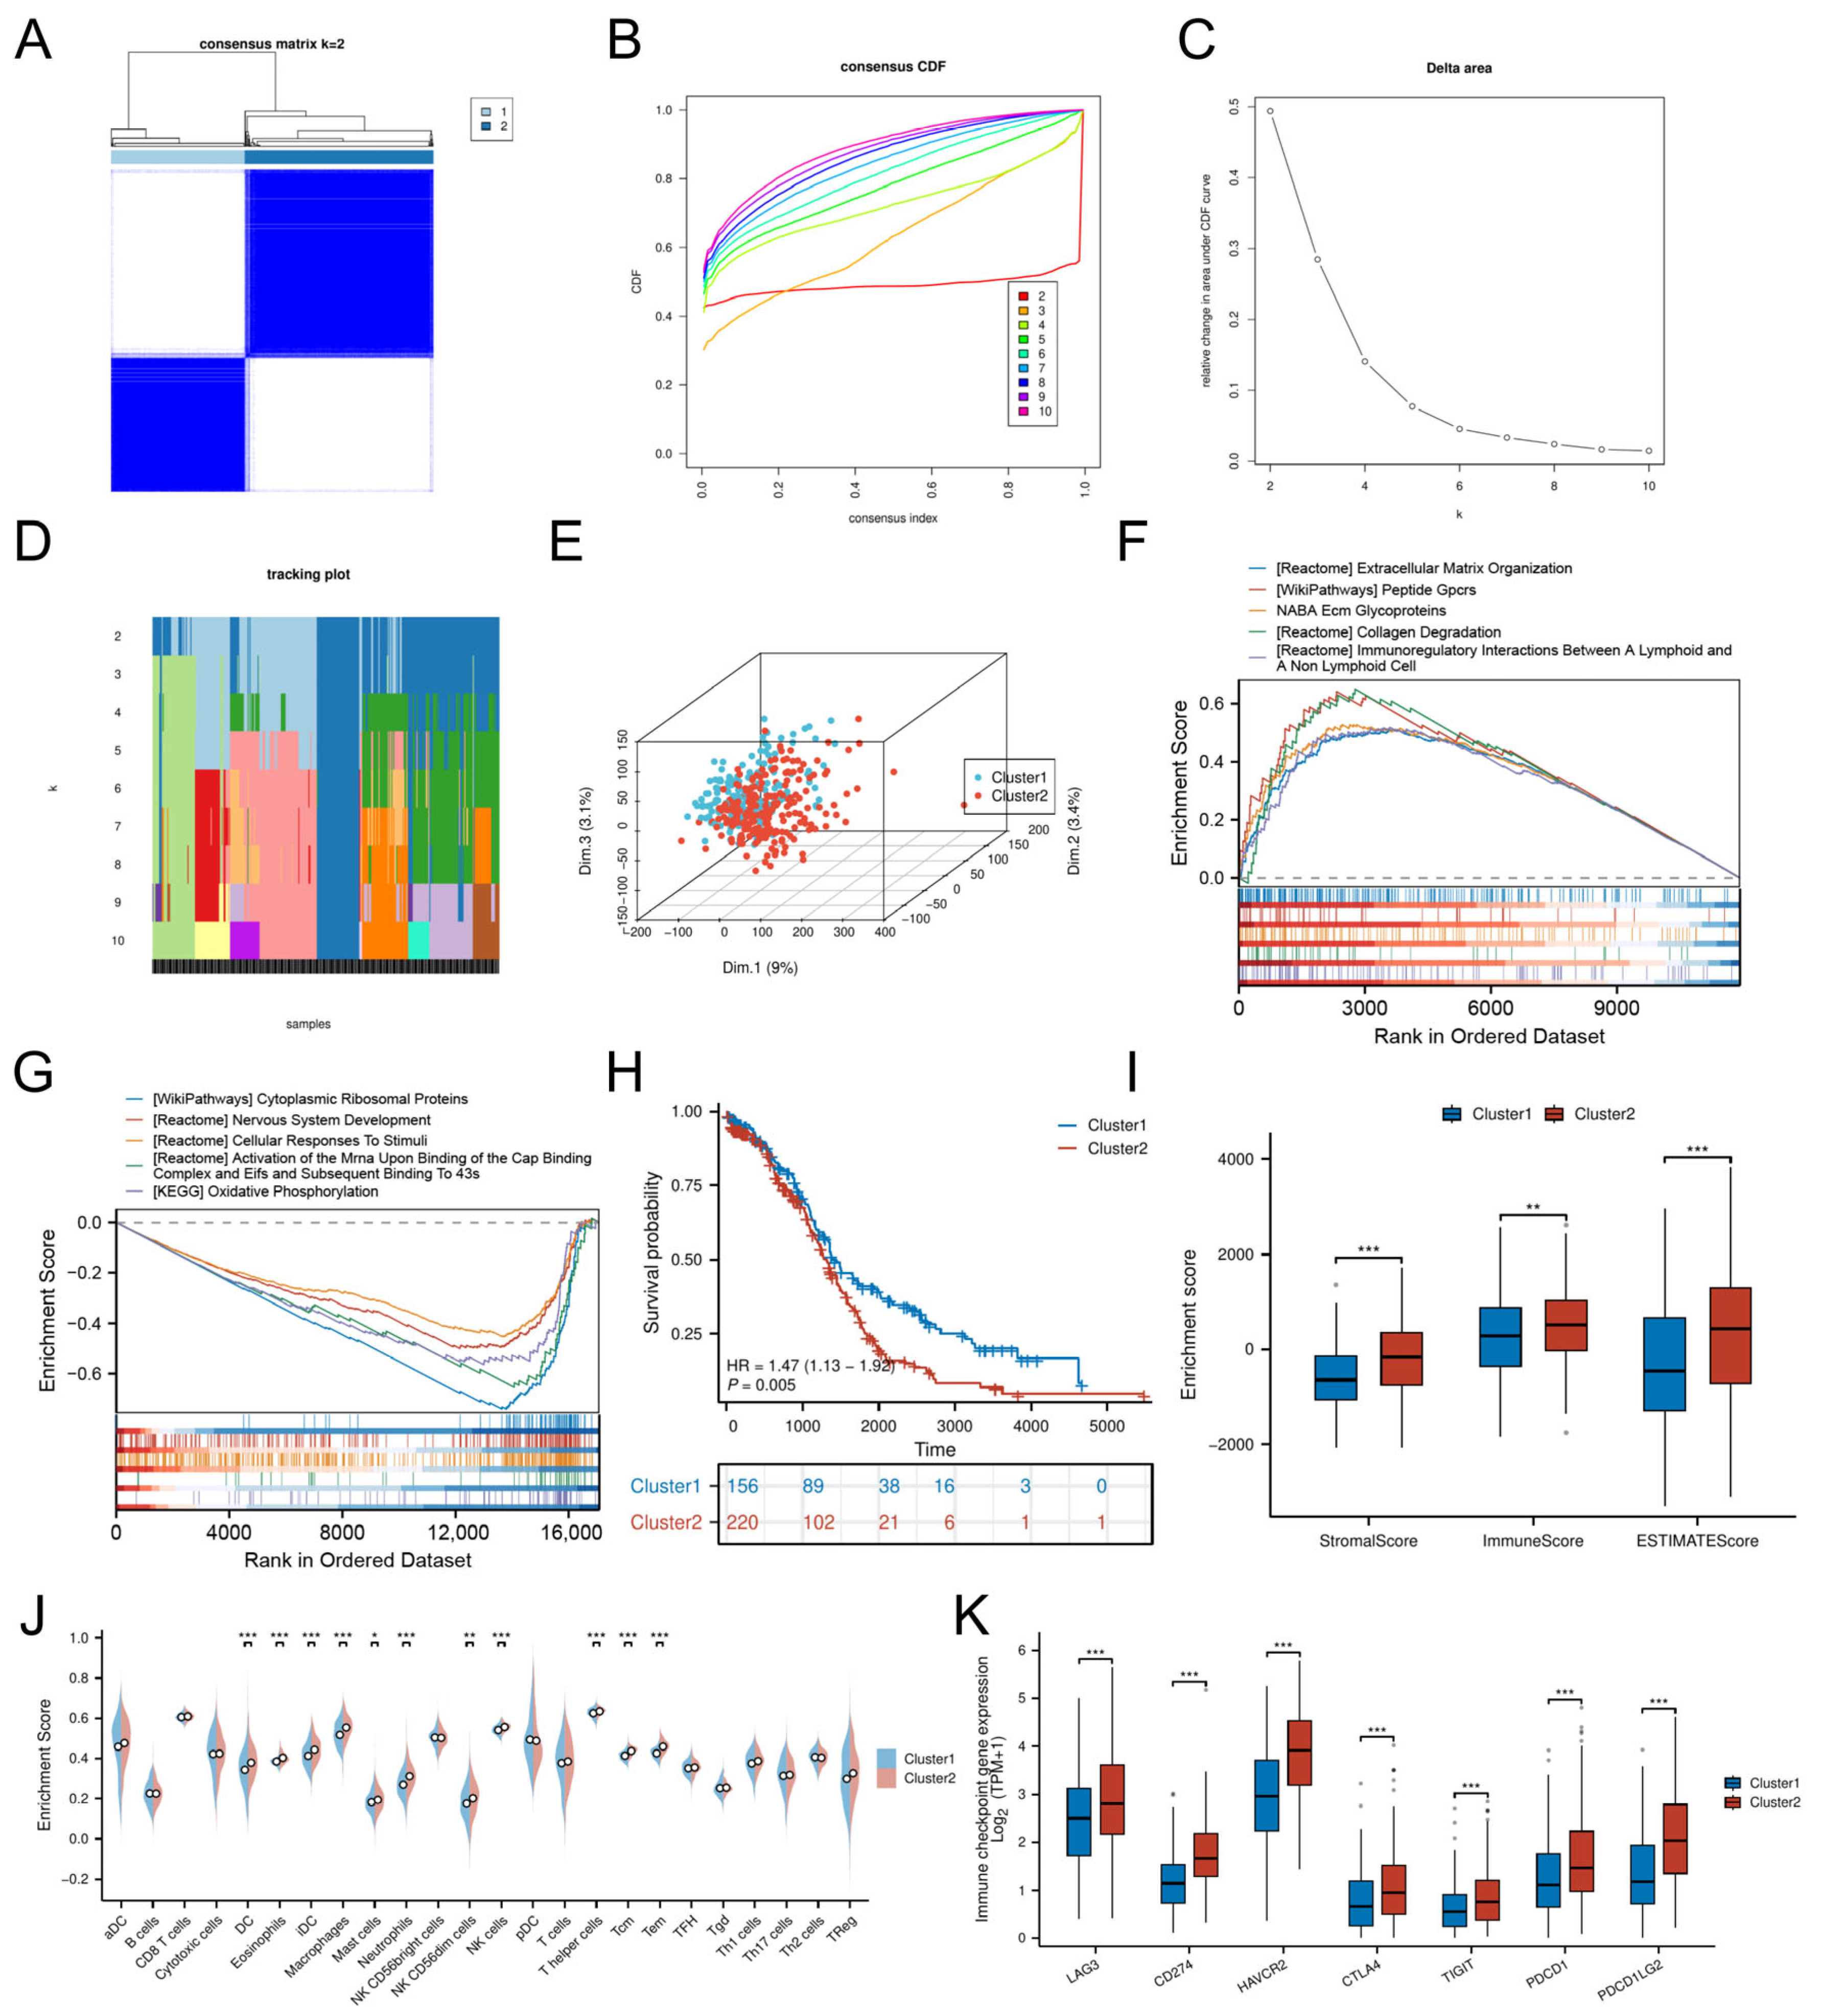
3.3. Cellular Senescence-Driven Molecular Subtyping

Consensus clustering of DE-CSGs stratified OC patients into two molecular subtypes, Cluster 1 (C1, n = 156) and Cluster 2 (C2, n = 220) (Table S3), with optimal cluster stability at k = 2 (Figure 3A–D). PCA confirmed distinct transcriptional landscapes between subtypes (Figure 3E). The GSEA revealed subtype-specific pathway activation: the C2 subtype exhibited immune–stromal crosstalk involving extracellular matrix (ECM) glycoproteins, collagen degradation, and lymphoid-non-lymphoid cell interactions, while C1 was enriched for cytoplasmic ribosomal proteins and oxidative phosphorylation (Figure 3F,G).
Despite heightened infiltration of dendritic cells (DCs, iDCs), eosinophils, macrophages, mast cells, neutrophils, NK cells (CD56dim, CD56bright), and T lymphocytes (T helper, central memory T cells [Tcm], effector memory T cells [Tem]) in C2 (Figure 3J), this subtype demonstrated significantly worse OS (HR = 1.47, p = 0.005; Figure 3H) and lower stromal/immune/ESTIMATE scores compared to C1 (Figure 3I). The adverse prognosis of C2 correlated with coordinated upregulation of immune checkpoint molecules, including LAG3, HAVCR2 (TIM-3), CD274 (PD-L1), CTLA4, PDCD1LG2 (PD-L2), TIGIT, and PDCD1 (PD-1) (Figure 3K), suggesting potential immune evasion mechanisms.
To evaluate the relationship between CSG subtypes and TCGA classifications [25], we generated a Sankey diagram illustrating the distribution of C1/C2 tumors across TCGA subtypes (Figure S1). C2 tumors were evenly distributed among all four TCGA categories (Proliferative: 23.5%, Immunoreactive: 22.4%, Differentiated: 26.4%, Mesenchymal: 27.7%), yet exhibited uniformly poor survival in the overall cohort. Stratified survival analysis within individual TCGA subtypes revealed no significant differences between C1 and C2 (all p > 0.15, Figure S2), suggesting that the prognostic power of CSG subtyping arises from its ability to transcend—rather than refine—traditional molecular categories.

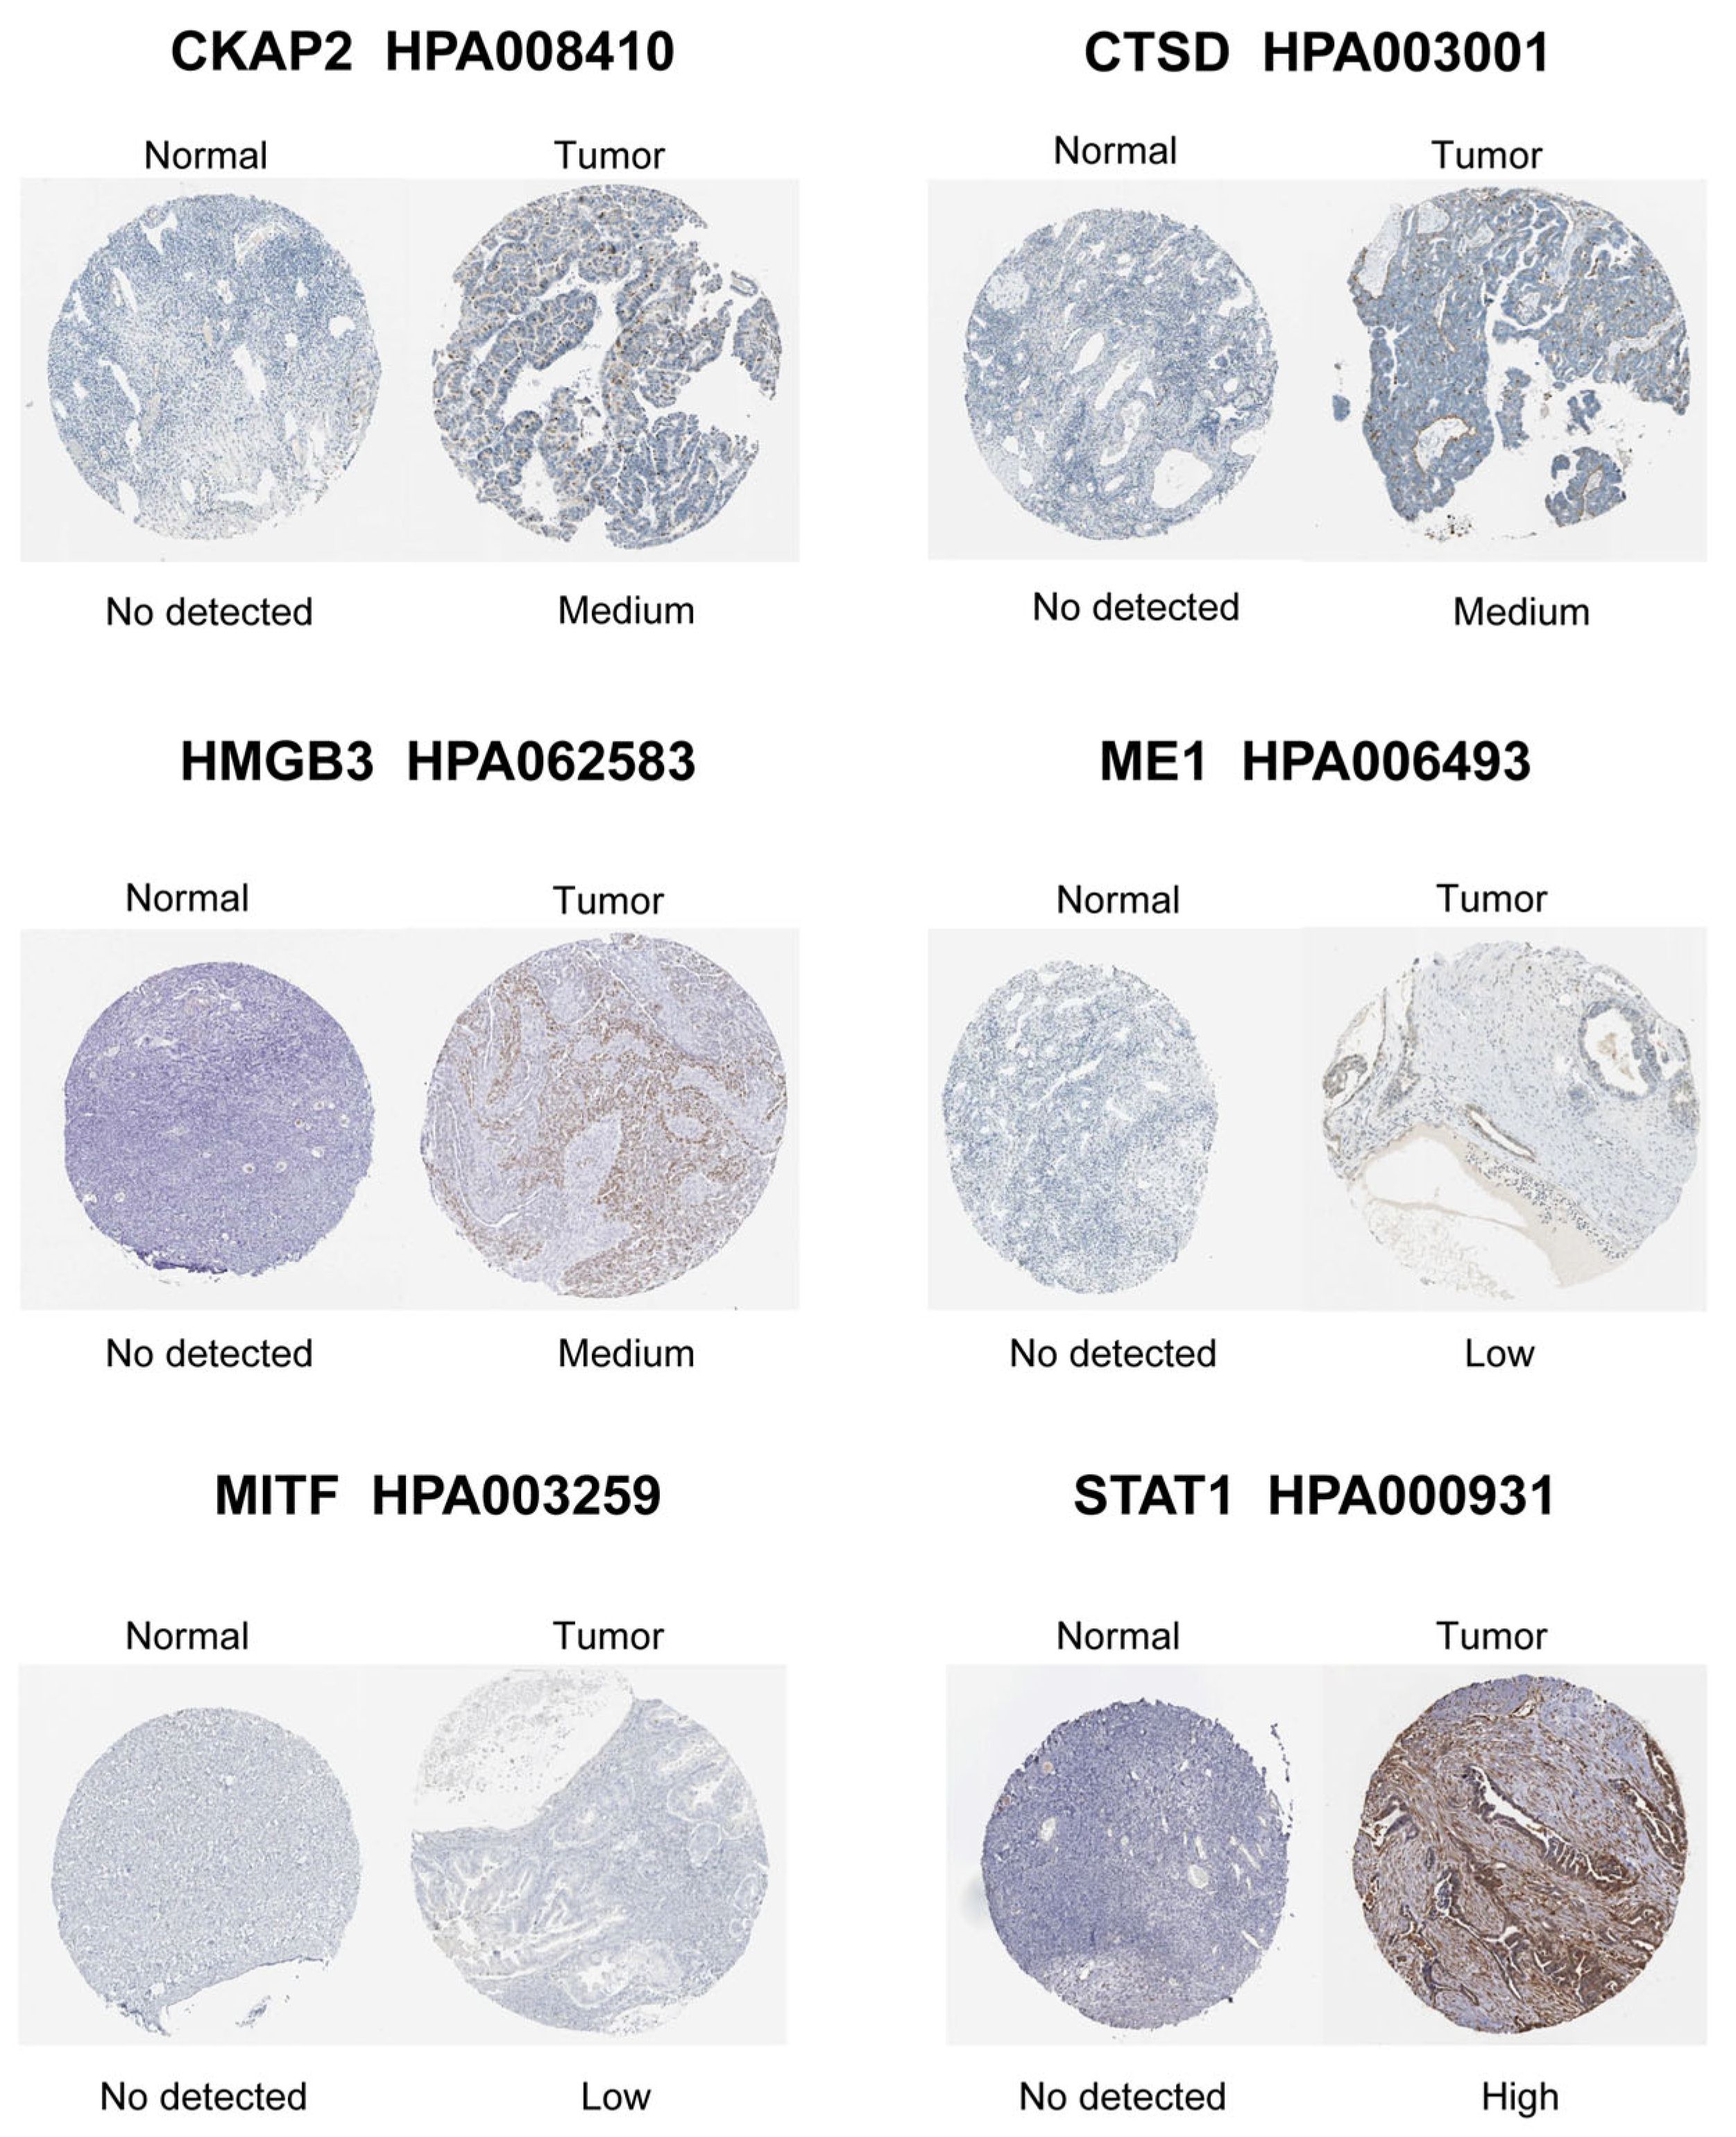
3.4. Identification and Validation of Hub CSGs

LASSO-penalized Cox regression distilled 19 prognostic DE-CSGs from the initial 31 candidates: IGFBP1, SFRP1, PLA2R, HMGB3, CCND1, FOXO1, SGK1, MITF, CHD5, CKAP2, ME1, NEK6, AAK1, LAYN, CTSD, SREBF1, STAT1, MATK, ZFP36 (Figure 4A,B). Patients were dichotomized into high-risk (n = 188) and low-risk (n = 188) cohorts by median risk score (Figure 4C). The high-risk group exhibited significantly poorer OS compared to the low-risk group (HR = 2.05, p < 0.001; Figure 4D). Multivariable Cox analysis prioritized six hub genes—HMGB3, MITF, CKAP2, ME1, CTSD, STAT1—as independent OS predictors (all p < 0.05; Figure 4E). Immunohistochemical validation via the Human Protein Atlas (HPA) confirmed significant overexpression of these hub genes in OC tissues versus normal controls (Figure 5).

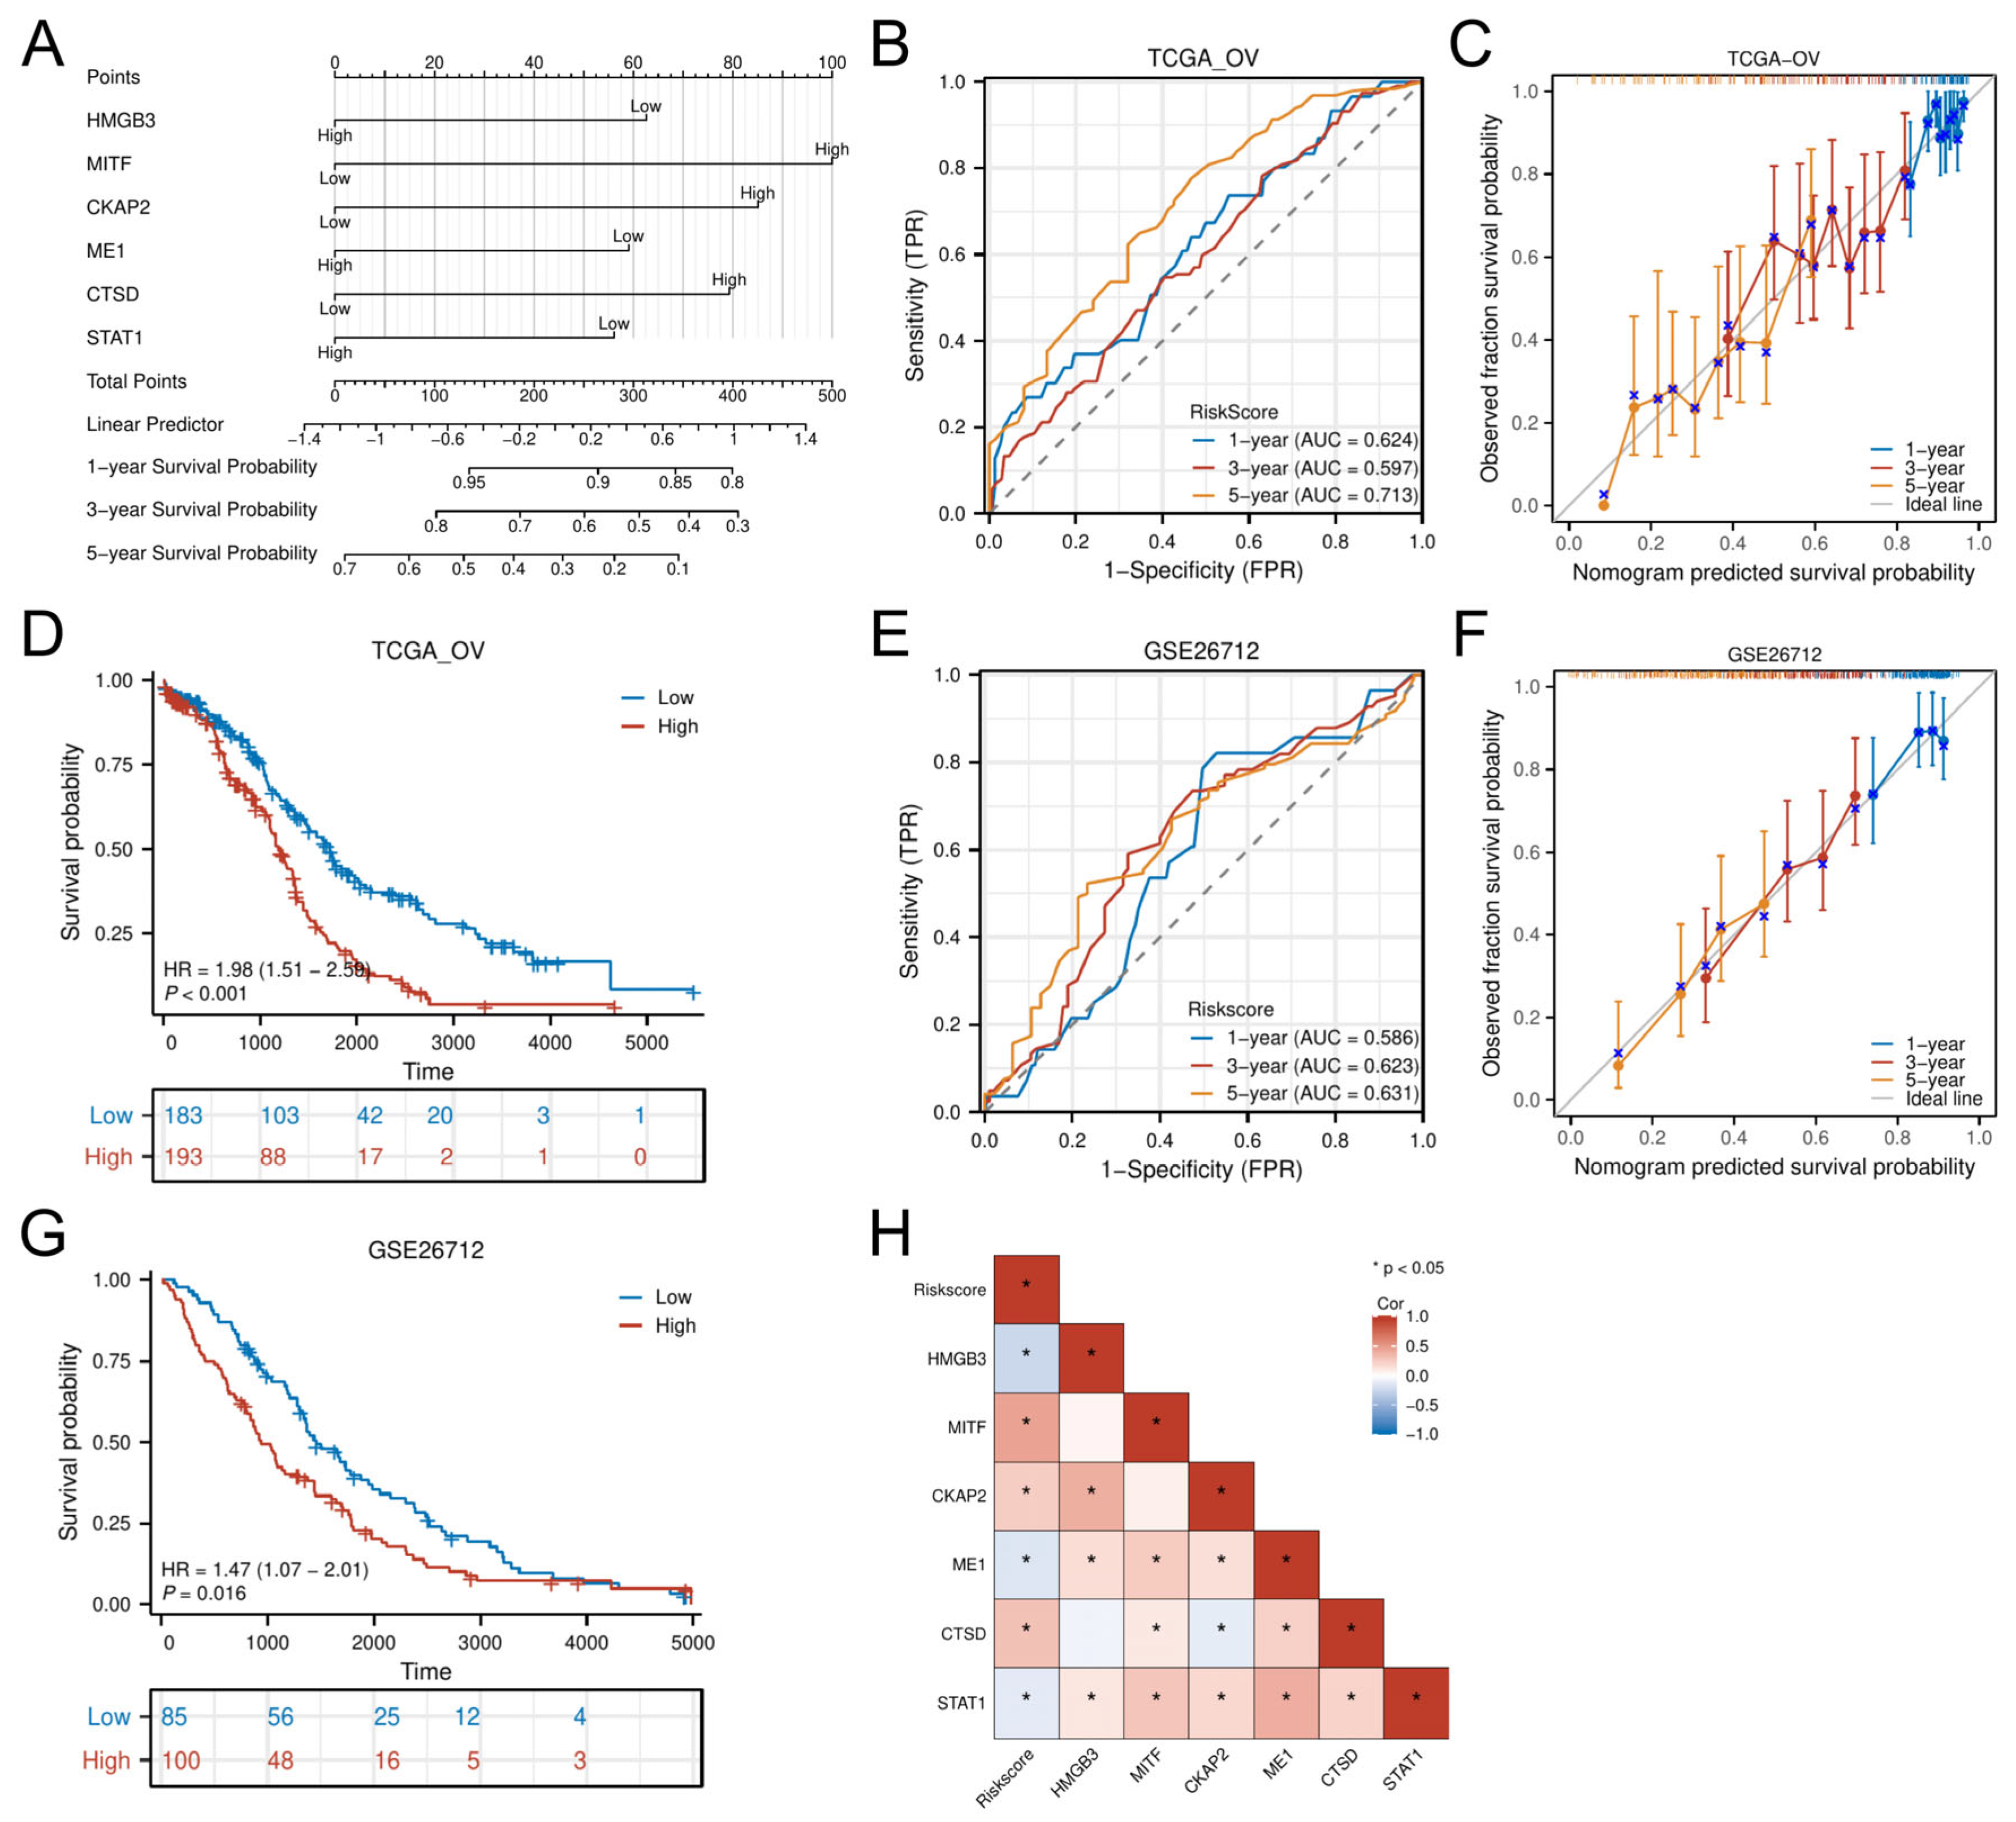
3.5. Nomogram Development and External Validation

A multigene-integrated nomogram was constructed to predict OC outcomes, incorporating the six hub genes (Figure 6A). Time-dependent ROC analysis demonstrated moderate predictive accuracy in the TCGA-OV cohort, with AUC values of 0.624 (1 year), 0.597 (3 years), and 0.713 (5 years) (Figure 6B). Calibration curves confirmed close alignment between predicted and observed survival probabilities across all timepoints (Figure 6C). Multivariable Cox-derived risk stratification robustly discriminated patient outcomes, with the high-risk group showing significantly reduced OS (HR = 1.98, p < 0.001; Figure 6D).
External validation using the GSE26712 cohort replicated these findings, achieving comparable AUCs (1-year: 0.586; 3-year: 0.623; 5-year: 0.631) (Figure 6E) and well-calibrated prediction curves (Figure 6F). Survival patterns remained consistent, with high-risk patients demonstrating poorer prognosis (HR = 1.47, p = 0.016; Figure 6G). Correlation analysis further linked the six hub genes to risk scores: MITF, CKAP2, and CTSD showed positive associations (p < 0.05), while HMGB3, ME1, and STAT1 displayed negative correlations (p < 0.05) (Figure 6H).

3.6. Mutational Landscape and TMB-Driven Prognostic Stratification

Analysis of somatic mutation profiles from the TCGA cohort revealed distinct mutational landscapes between risk groups (Figure 7A,B). The low-risk group exhibited a significantly higher TMB compared to the high-risk group (p < 0.05; Figure 7C).
Survival analysis demonstrated that patients with high TMB had better OS than those with low TMB (Figure 7D). Further stratification combining TMB and risk classification showed that the low-risk group with high TMB had the most favorable prognosis, outperforming all other subgroups (Figure 7E). This synergistic effect suggests TMB may enhance prognostic discrimination within the senescence-related risk framework.

3.7. Functional Pathway Enrichment in Risk Groups

GSEA revealed distinct biological pathways associated with each risk group. The high-risk group was significantly enriched in pathways related to ECM protein regulation, ECM degradation, and immune modulation between lymphoid and non-lymphoid cells (Figure 8A). In contrast, the low-risk group showed prominent activation of G-protein-coupled receptor (GPCR) ligand binding, GPCR signaling pathways, and interactions between neuroactive ligands and receptors (Figure 8B). These findings collectively suggest that the high-risk phenotype is driven by stromal co-option and immune evasion, whereas low-risk tumors may retain GPCR-mediated growth control and neuronal signaling-mediated tumor surveillance.

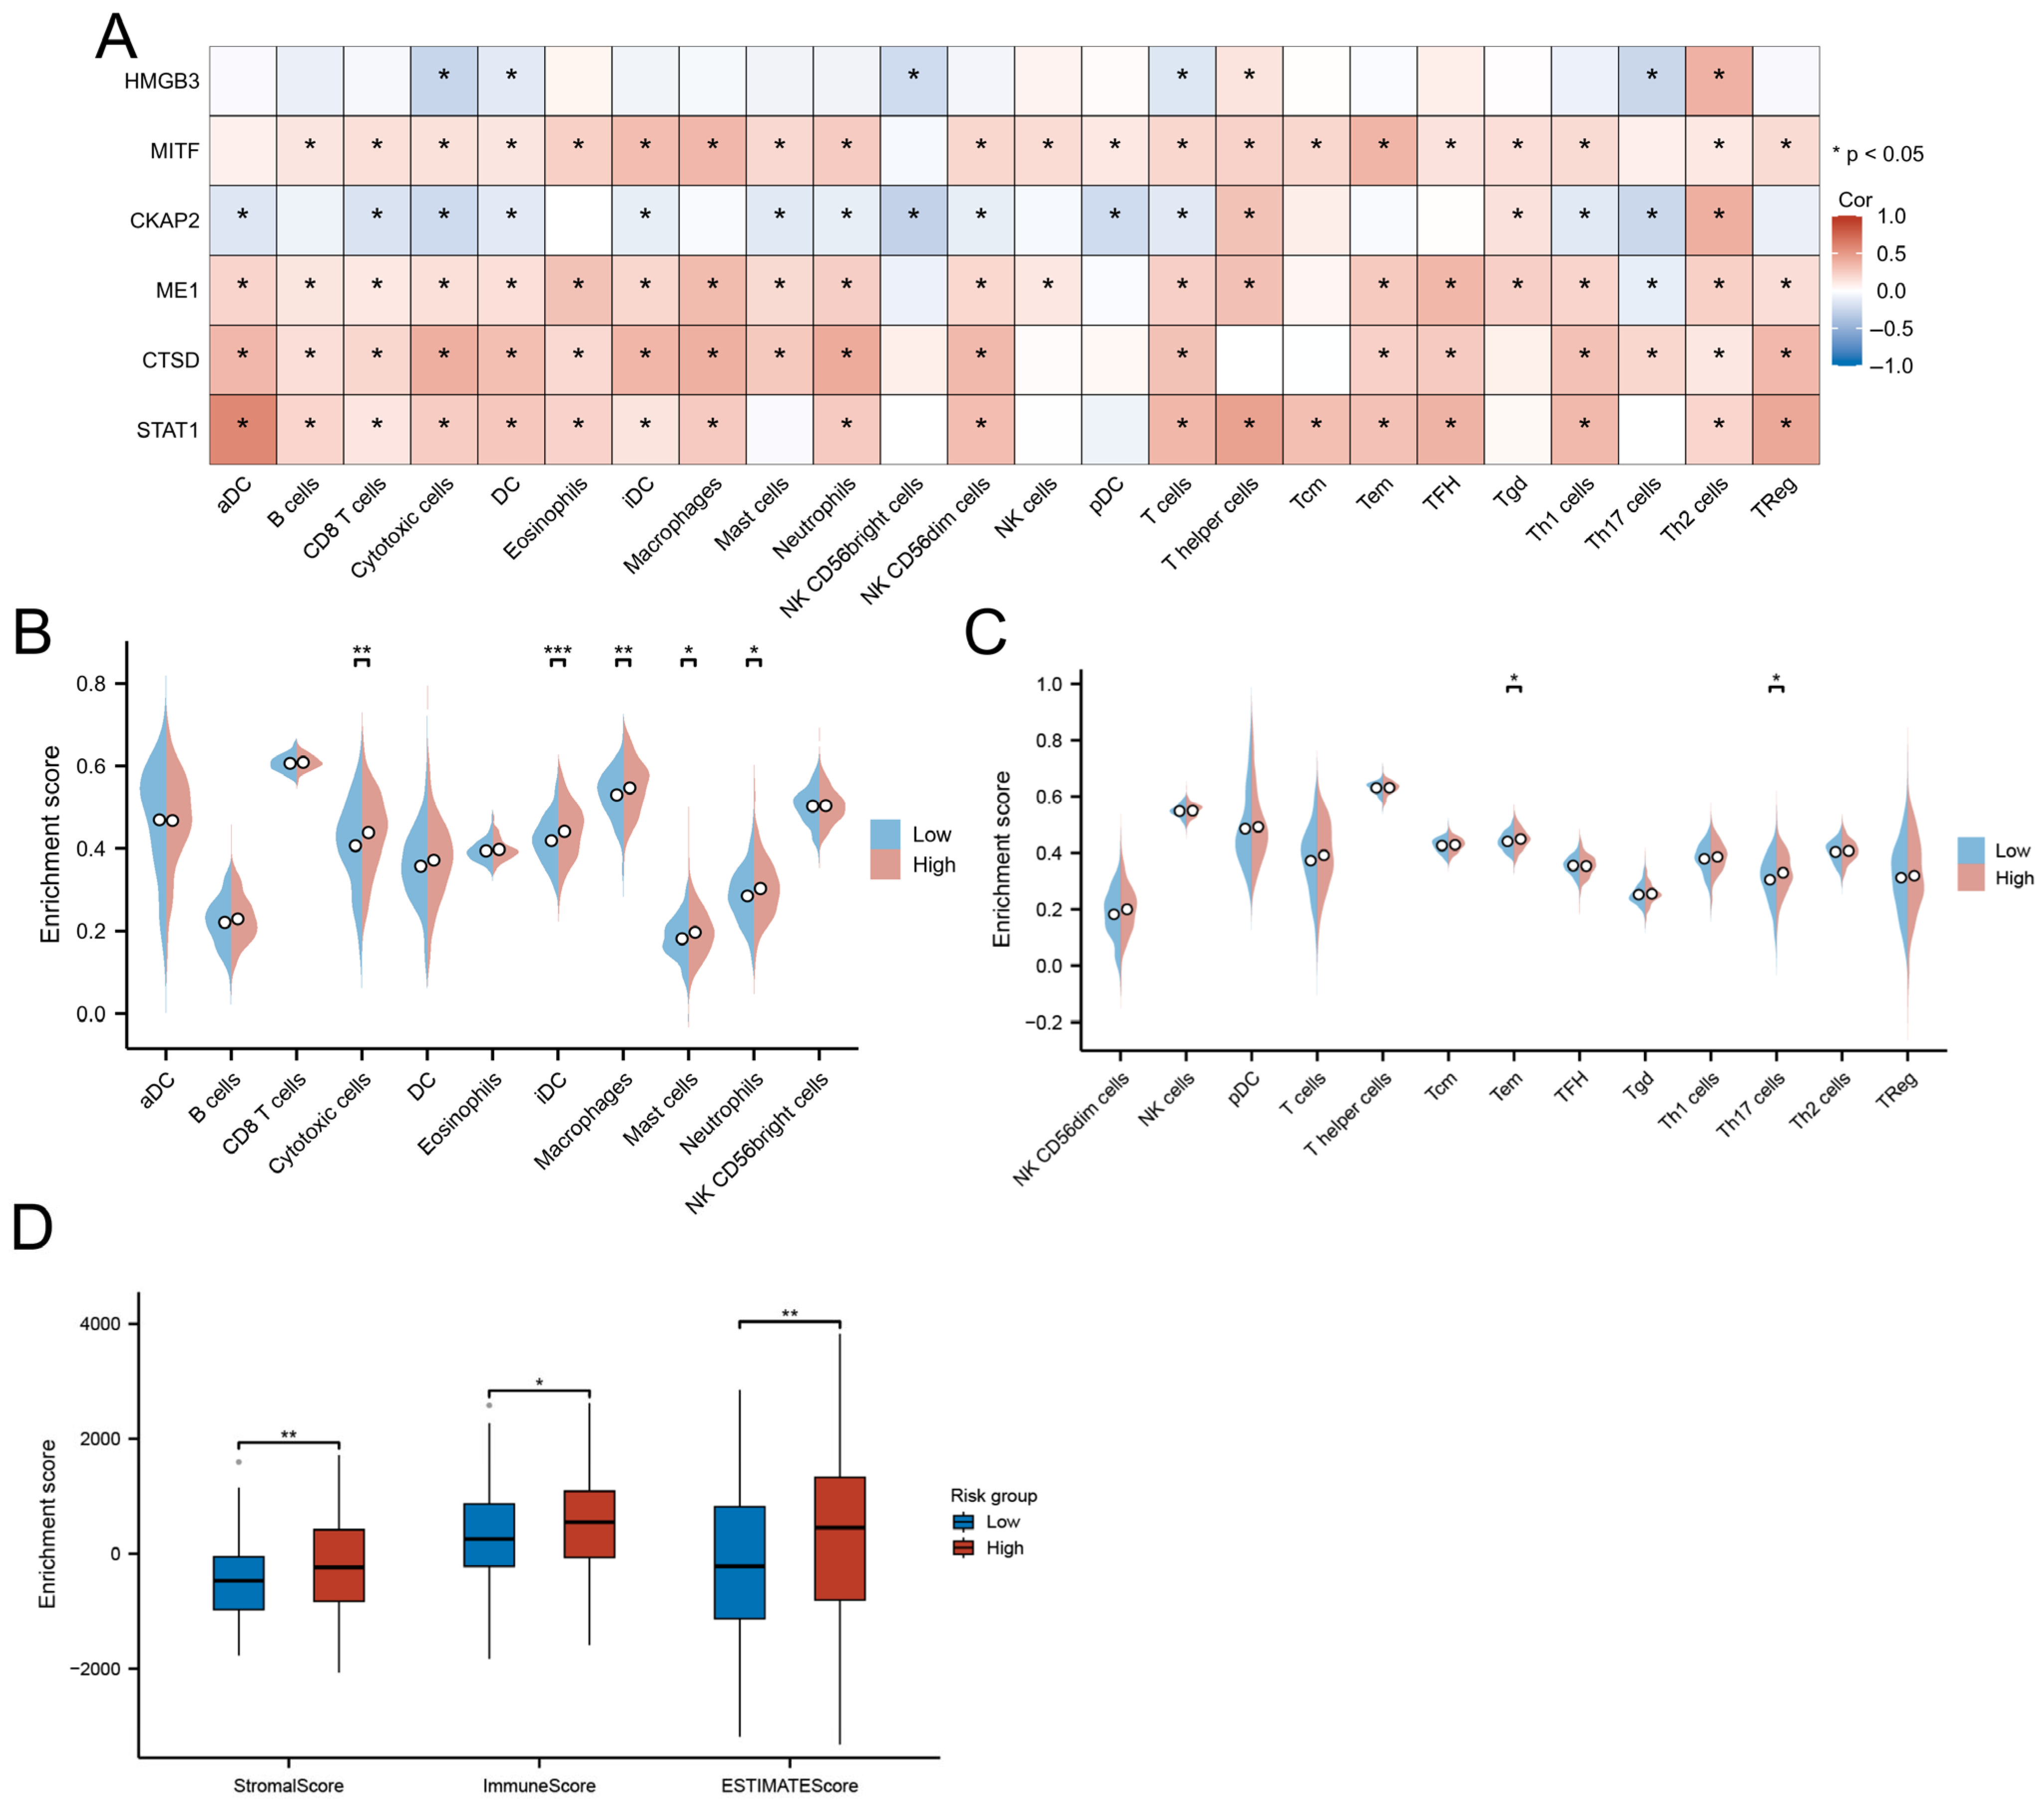
3.8. Immune Landscape and TME Characteristics

Correlation analysis of hub gene expression with immune infiltration patterns revealed distinct immunobiological associations. STAT1, CTSD, ME1, and MITF exhibited broad positive correlations with cytotoxic effectors (CD8+ T/NK cells), antigen-presenting cells (activated/immature DCs), and granulocytic lineages (neutrophils/mast cells). In contrast, CKAP2 showed significant negative associations with these immune populations (p < 0.05) but demonstrated selective positive correlation with Th2-polarized lymphocytes (Figure 9A).
The high-risk group displayed enhanced infiltration of functionally divergent immune subsets, including cytotoxic T cells (effector memory, Th17), myeloid cells (neutrophils, macrophages), and iDCs (p < 0.05; Figure 9B,C). Paradoxically, these immunologically active tumors concurrently exhibited elevated stromal remodeling activity, as evidenced by significantly higher ESTIMATE scores (immune: p < 0.05; stromal: p < 0.01) compared to low-risk counterparts (Figure 9D).

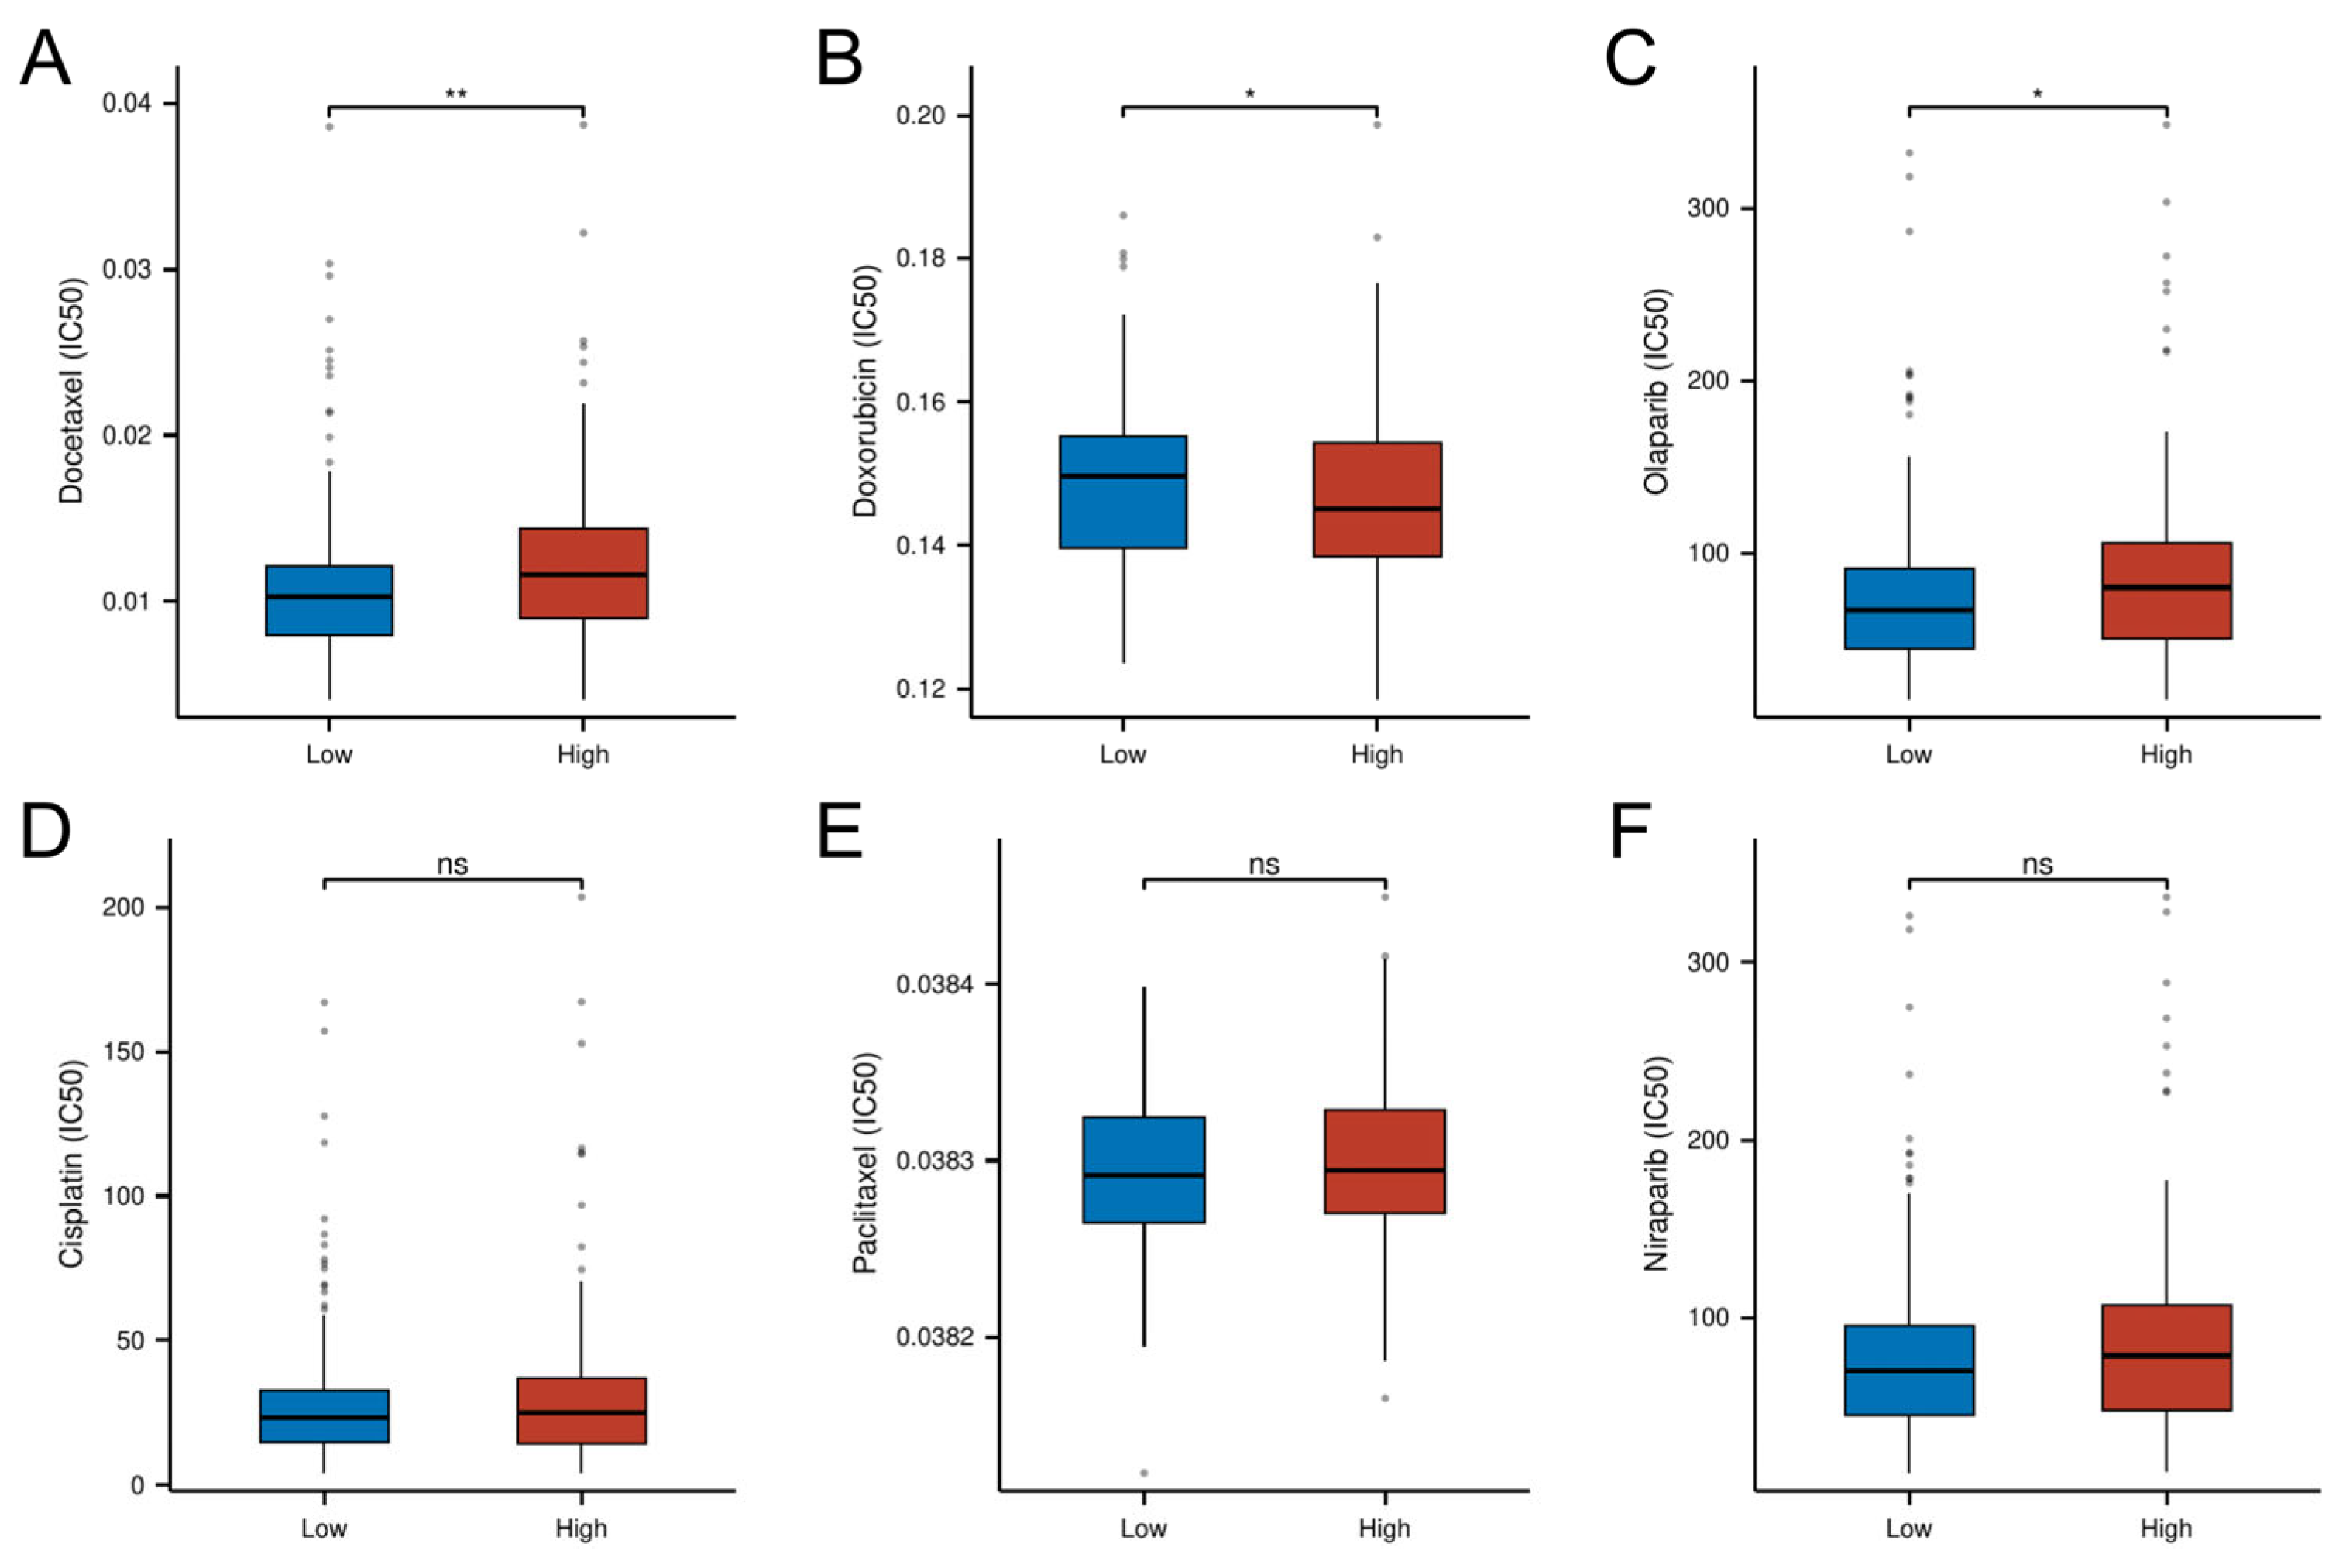
3.9. Risk-Stratified Drug Sensitivity Patterns

Pharmacogenomic analysis revealed distinct drug sensitivity patterns between risk subgroups, with high-risk tumors demonstrating increased resistance to conventional chemotherapeutics. Specifically, the high-risk group exhibited significantly higher IC50 values for Docetaxel (p < 0.01) and the PARP inhibitor Olaparib (p < 0.05), suggesting potential cross-resistance to microtubule-targeting agents and DNA damage response inhibitors. Conversely, the low-risk group showed enhanced chemoresistance to doxorubicin (p < 0.05). No significant intergroup differences were observed for cisplatin, paclitaxel, or the second-generation PARP inhibitor niraparib (p > 0.05; Figure 10). These findings position the cellular senescence-related risk model as a predictive biomarker for optimizing chemotherapy selection.

4. Discussion

This study presents the first multi-omics integration to delineate the molecular features of CSGs in OC, uncovering their roles in TME heterogeneity, metabolic adaptation, and clinical outcomes. We identified CSG-driven molecular subtypes (C1/C2) with distinct survival patterns and constructed a multi-gene risk model highlighting therapeutic vulnerabilities.
Cellular senescence exhibits dualistic roles in cancer progression that are highly context-dependent. While acute senescence acts as a tumor-suppressive mechanism by irreversibly arresting damaged cells, chronic senescence promotes tumorigenesis through SASP mediated microenvironment remodeling [26]. Key senescence regulators maintain genomic stability in pre-malignant lesions [27], whereas SASP factors facilitate angiogenesis, immune evasion, and therapy resistance in established tumors [28]. In ovarian cancer, this duality is particularly complex due to unique peritoneal dissemination patterns and stromal crosstalk. Our work bridges this gap by linking CSGs to prognostic stratification and therapy resistance, positioning them as novel biomarkers for personalized treatment strategies.
The identification of 265 DE-CSGs, including 31 prognostic candidates, underscores the functional relevance of senescence pathways in OC biology. Notably, GO enrichment revealed strong associations with Wnt signaling inhibition—a pathway critical for stemness maintenance and differentiation [29]. This suggests that CSG-mediated Wnt suppression may enforce senescence barriers against malignant transformation, while its dysregulation could license senescence bypass, a hallmark of OC aggressiveness [30]. Molecular function analyses highlighted protein kinase activity modulation, aligning with evidence that kinase-driven signaling cascades govern senescence entry and escape [31]. KEGG pathway analysis highlighted enrichment in the FoxO signaling pathway, a key regulatory hub for cellular stress, senescence, and apoptosis [32]. The observed FoxO dysregulation may represent a molecular switch enabling OC cells to evade growth arrest, thereby offering a therapeutic leverage point.
CNV profiling of DE-CSGs uncovered genomic instability hotspots linked to OC pathogenesis. High-frequency amplifications (e.g., TXNIP, RNASEL) and deletions (e.g., MATK, SREBF1) suggest selective pressure to modulate senescence-associated proliferation control and metabolic adaptation [33,34]. For instance, TXNIP amplification may hyperactivate redox-sensitive senescence checkpoints, while SREBF1 loss could disrupt lipid homeostasis, creating a permissive niche for tumor survival [35,36].
By integrating Consensus Clustering with the K-means algorithm, we stratified the TCGA-OV cohort into two molecular subtypes (C1 and C2) with distinct clinical outcomes. Patients in the C2 subtype exhibited significantly shorter OS, suggesting a molecular phenotype conducive to aggressive tumor progression. The even distribution of C2 tumors across TCGA subtypes, combined with their consistent poor prognosis, indicates that CSG subtyping identifies a pan-TCGA high-risk phenotype driven by senescence-immune interactions. This phenotype may override subtype-specific biology, regardless of their TCGA classification. Clinically, this suggests that CSG subtyping could guide therapeutic strategies for high-risk patients overlooked by TCGA classification alone. GSEA revealed that C2 tumors were enriched in pathways associated with extracellular matrix (ECM) remodeling and immune regulation, indicating dual mechanisms of microenvironmental adaptation and immune evasion. For instance, ECM glycoprotein alterations may foster a tumor-supportive niche [37,38], while immune dysregulation—marked by upregulated checkpoint molecules such as PD-L1 and CTLA-4—could enable tumor cells to escape immune surveillance [39,40]. In contrast, the C1 subtype was linked to pathways involving cytosolic ribosomal proteins and oxidative phosphorylation, reflecting a metabolic state associated with restrained tumor aggressiveness [41]. TME analysis further corroborated these differences: C1 displayed lower immune, stromal, and ESTIMATE scores, indicative of an “immune-cold” microenvironment with limited immune infiltration and tumor-stroma interactions. Conversely, C2 exhibited pronounced infiltration of DCs, eosinophils, and cytotoxic lymphocytes, coupled with heightened expression of immune checkpoint genes, forming an immunosuppressive network. Although robust immune infiltration in C2 reflects host antitumor responses [42], concurrent checkpoint activation likely impairs effector cell functionality, permitting tumor persistence [39,40]. These findings underscore the therapeutic potential of immune checkpoint inhibitors for C2 patients, offering a strategy to alleviate immunosuppression and enhance antitumor immunity [43].
Our integrated analysis identified six hub CSGs (HMGB3, MITF, CKAP2, STAT1, ME1, CTSD) that exhibit dual roles in OC progression through senescence–immunometabolic crosstalk. Emerging experimental evidence delineates their functional specificities. HMGB3 acts as a molecular rheostat balancing genomic stability and stemness. In OC models, HMGB3 knockdown triggers PARP1 trapping at DNA damage sites, suppressing its auto-PARylation activity and enhancing replication stress-induced apoptosis [44]. Conversely, HMGB3 overexpression activates MAPK/ERK signaling to promote cancer stemness and chemoresistance [45], suggesting a dosage-dependent role in senescence escape. Mechanistically, HMGB3 maintains ATR/CHK1-mediated DNA damage response [46], potentially explaining its protective association in low-risk tumors. MITF drives OC stemness by hijacking senescence checkpoints. Functional studies demonstrate MITF upregulates CDK2/Cyclin D1 while suppressing E-cadherin, enabling unrestricted proliferation and epithelial–mesenchymal transition [47]. This aligns with our observation of MITF’s positive correlation with high-risk scores, where tumors exhibit stem-like transcriptional programs. CKAP2 promotes cytoskeletal remodeling linked to aggressive phenotypes. OC-specific studies confirm CKAP2 overexpression activates FAK-ERK2 signaling to enhance proliferation/migration [48]. Though direct OC evidence is limited, CKAP2’s mitotic regulatory role (microtubule dynamics/chromosome segregation) [49,50] suggests potential synergy with senescence bypass mechanisms—a hypothesis requiring OC-specific validation. STAT1 exhibits context-dependent immunoregulatory functions. While high STAT1 expression correlates with favorable prognosis in OC [51], its activation upregulates PD-L1 via IFN-γ/STAT1 signaling [52], potentially contributing to the immune-evasive TME observed in C2 subtypes. This dual role underscores the need for spatial characterization of STAT1+ cell populations. ME1 modulates metabolic adaptation in therapy resistance. OC transcriptomics links ME1 downregulation to platinum resistance through altered glycolysis–OXPHOS balance [53]. Its co-expression with antioxidant/STEMness genes in fallopian tube epithelia [54] suggests ME1 may preserve redox homeostasis to counteract senescence-associated oxidative stress. CTSD lysosomal activity facilitates protumorigenic microenvironment remodeling. Though OC-specific data are lacking, breast cancer studies show CTSD promotes mTOR-driven proliferation and M2 macrophage polarization, mechanisms compatible with the pro-metastatic TME features of our high-risk cohort [55,56]. Targeted inhibition studies in OC models are urgently needed.
TMB, defined as the total somatic mutations within a tumor genome [57], serves as a critical determinant of tumorigenesis, progression, and therapy response [58]. Contrary to the conventional paradigm linking high TMB to improved survival via enhanced immunogenicity [59], our senescence-centric risk stratification revealed a counterintuitive TMB-prognosis relationship in OC. The low-risk cohort exhibited significantly higher TMB levels than the high-risk group (p < 0.05), with elevated TMB correlating with favorable outcomes. This paradox suggests that low-risk tumors may harbor a unique “immunogenic fingerprint” that augments neoantigen presentation and immune recognition—a phenomenon potentially mediated by GPCR and neuroendocrine pathway activation, which could synergize with TMB-driven immunogenicity to suppress malignancy [60,61]. Conversely, high-risk tumors, characterized by ECM remodeling and immune dysregulation, likely evade TMB-related immune surveillance through stromal barrier formation and checkpoint-mediated T-cell exhaustion [62,63]. These findings redefine TMB’s contextual role in OC, positioning it as a biomarker whose prognostic value is modulated by senescence-related microenvironmental cues. Targeting ECM-immune crosstalk in high-risk tumors or leveraging GPCR/neuroendocrine signaling in TMB-high low-risk cases may unlock novel therapeutic avenues.
In the exploration of the immune landscape, we detected that the high-risk patient cohort manifested a significant elevation in the infiltration levels of a diverse array of immune cell populations, particularly iDCs and cytotoxic cells (p < 0.05). Moreover, TME scoring indicated that the high-risk cohort exhibited elevated immune, stromal, and ESTIMATE scores. While high immune infiltration is often considered indicative of anti-tumor activity, it may, in fact, reflect tumor-driven inflammatory responses [64]. The infiltrating immune cells may not effectively target and kill the tumor; rather, they could be co-opted by cancer cells to promote tumor proliferation and metastasis [65,66]. Therefore, it is crucial to precisely analyze the functional state of immune cells, block pro-tumor signals, and reshape the immune microenvironment.
The drug sensitivity analysis underscores the guiding value of risk stratification in medication selection. Docetaxel and Olaparib exhibited higher IC50 values in the high-risk group, suggesting a potential risk of drug resistance, which may be linked to specific gene expression patterns and pathway activation. Risk-based drug selection could help avoid ineffective treatments and reduce patient burden. In the future, drug-gene interaction networks could be developed to predict individual drug responses, facilitating personalized chemotherapy and targeted therapies.
Despite these advances, limitations warrant consideration. While external validation in GSE26712 supports generalizability, prospective multi-omics cohorts are needed to control for batch effects and therapy heterogeneity. The model’s moderate AUC reflects challenges in capturing senescence heterogeneity through bulk RNA-seq—a limitation addressable via spatial transcriptomics or single-cell sequencing. Furthermore, while computational drug sensitivity analysis provides mechanistic hypotheses, ex vivo validation using patient-derived organoids remains essential.

5. Conclusions

Our study establishes cellular senescence as a pivotal regulator of OC progression, with CSGs influencing TME remodeling, metabolic adaptation, and therapeutic response. The risk-stratified model and molecular subtyping framework provide actionable insights for personalized therapy: C2/high-risk patients may benefit from combined immune checkpoint blockade and stromal-targeting agents, while low-risk patients could leverage GPCR-targeted immunomodulation. Prospective validation of these findings in clinical trials is warranted to translate senescence biology into precision oncology.

Supplementary Materials

The following supporting information can be downloaded at: https://www.mdpi.com/article/10.3390/biomedicines13040877/s1. Table S1: Cellular senescence-related genes. Table S2: Differentially expressed cellular senescence-related genes. Table S3: TCGA_OV patients’ IDs for molecular subtypes of cellular senescence. Figure S1: Distribution of CSG subtypes (C1/C2) across TCGA molecular classifications. Figure S2: Stratified survival analysis of C1 versus C2 within TCGA subtypes.

Author Contributions

A.L. and D.X. conceived the manuscript. D.X. collected data. D.X. and A.L. analyzed the data and wrote the manuscript. All authors have read and agreed to the published version of the manuscript.

Funding

This research received no external funding.

Institutional Review Board Statement

Not applicable.

Informed Consent Statement

Not applicable.

Data Availability Statement

The TCGA and GTEx integrated data were downloaded from Xena (https://xenabrowser.net/datapages/) (accessed on 22 December 2024). The CSGs were downloaded from the CellAge database (https://genomics.senescence.info/cells/index.html) (accessed on 22 December 2024). Immunostaining images were collected from the Human Protein Atlas (https://proteinatlas.org/) (accessed on 28 December 2024). The GSE26712 dataset was downloaded from GEO (https://ncbi.nlm.nih.gov/geo/) (accessed on 22 December 2024).

Acknowledgments

We thank the TCGA and GEO databases for providing valuable open-access data resources, which have significantly contributed to the findings of this study. We thank Jiaoyu Deng for their assistance with language editing.

Conflicts of Interest

The authors declare no conflicts of interest.

Abbreviations

The following abbreviations are used in this manuscript:
OCOvarian cancer
SASPSenescence-associated secretory phenotype
TMETumor microenvironment
CSGsCellular senescence-related genes
CNVCopy number variation
FCFoldChange
DEGsDifferentially expressed genes
OSOverall survival
GOGene Ontology (GO)
KEGGKyoto Encyclopedia of Genes and Genomes
DE-CSGsDifferentially expressed cellular senescence-related genes
PCAPrincipal component analysis
GSEAGene Set Enrichment Analysis
LASSOLeast Absolute Shrinkage and Selection Operator
K–MKaplan–Meier
TMBTumor mutation burden
IC50Half-maximal inhibitory concentration
ECMExtracellular matrix
DCDendritic cell
iDCImmature dendritic cell
AUCArea under curve
GPCRsG-protein-coupled receptors

References

  1. Siegel, R.L.; Miller, K.D.; Fuchs, H.E.; Jemal, A. Cancer Statistics, 2021. CA Cancer J. Clin. 2021, 71, 7–33. [Google Scholar] [CrossRef] [PubMed]
  2. Sung, H.; Ferlay, J.; Siegel, R.L.; Laversanne, M.; Soerjomataram, I.; Jemal, A.; Bray, F. Global Cancer Statistics 2020: GLOBOCAN Estimates of Incidence and Mortality Worldwide for 36 Cancers in 185 Countries. CA Cancer J. Clin. 2021, 71, 209–249. [Google Scholar] [CrossRef]
  3. Lheureux, S.; Braunstein, M.; Oza, A.M. Epithelial ovarian cancer: Evolution of management in the era of precision medicine. CA Cancer J. Clin. 2019, 69, 280–304. [Google Scholar] [CrossRef] [PubMed]
  4. Nagasawa, S.; Ikeda, K.; Horie-Inoue, K.; Sato, S.; Itakura, A.; Takeda, S.; Hasegawa, K.; Inoue, S. Systematic Identification of Characteristic Genes of Ovarian Clear Cell Carcinoma Compared with High-Grade Serous Carcinoma Based on RNA-Sequencing. Int. J. Mol. Sci. 2019, 20, 4330. [Google Scholar] [CrossRef] [PubMed]
  5. Wang, B.; Kohli, J.; Demaria, M. Senescent Cells in Cancer Therapy: Friends or Foes? Trends Cancer 2020, 6, 838–857. [Google Scholar] [CrossRef]
  6. Kuilman, T.; Michaloglou, C.; Mooi, W.J.; Peeper, D.S. The essence of senescence. Genes Dev. 2010, 24, 2463–2479. [Google Scholar] [CrossRef]
  7. Laberge, R.M.; Awad, P.; Campisi, J.; Desprez, P.Y. Epithelial-mesenchymal transition induced by senescent fibroblasts. Cancer Microenviron. Off. J. Int. Cancer Microenviron. Soc. 2012, 5, 39–44. [Google Scholar] [CrossRef]
  8. Faget, D.V.; Ren, Q.; Stewart, S.A. Unmasking senescence: Context-dependent effects of SASP in cancer. Nat. Rev. Cancer 2019, 19, 439–453. [Google Scholar] [CrossRef]
  9. Gorgoulis, V.; Adams, P.D.; Alimonti, A.; Bennett, D.C.; Bischof, O.; Bishop, C.; Campisi, J.; Collado, M.; Evangelou, K.; Ferbeyre, G.; et al. Cellular Senescence: Defining a Path Forward. Cell 2019, 179, 813–827. [Google Scholar] [CrossRef]
  10. Wang, T.; Notta, F.; Navab, R.; Joseph, J.; Ibrahimov, E.; Xu, J.; Zhu, C.Q.; Borgida, A.; Gallinger, S.; Tsao, M.S. Senescent Carcinoma-Associated Fibroblasts Upregulate IL8 to Enhance Prometastatic Phenotypes. Mol. Cancer Res. MCR 2017, 15, 3–14. [Google Scholar] [CrossRef]
  11. Capparelli, C.; Guido, C.; Whitaker-Menezes, D.; Bonuccelli, G.; Balliet, R.; Pestell, T.G.; Goldberg, A.F.; Pestell, R.G.; Howell, A.; Sneddon, S.; et al. Autophagy and senescence in cancer-associated fibroblasts metabolically supports tumor growth and metastasis via glycolysis and ketone production. Cell Cycle 2012, 11, 2285–2302. [Google Scholar] [CrossRef] [PubMed]
  12. Chatterjee, A.; Jana, S.; Chatterjee, S.; Wastall, L.M.; Mandal, G.; Nargis, N.; Roy, H.; Hughes, T.A.; Bhattacharyya, A. MicroRNA-222 reprogrammed cancer-associated fibroblasts enhance growth and metastasis of breast cancer. Br. J. Cancer 2019, 121, 679–689. [Google Scholar] [CrossRef] [PubMed]
  13. Lee, S.; Schmitt, C.A. The dynamic nature of senescence in cancer. Nat. Cell Biol. 2019, 21, 94–101. [Google Scholar] [CrossRef] [PubMed]
  14. Goldman, M.J.; Craft, B.; Hastie, M.; Repečka, K.; McDade, F.; Kamath, A.; Banerjee, A.; Luo, Y.; Rogers, D.; Brooks, A.N.; et al. Visualizing and interpreting cancer genomics data via the Xena platform. Nat. Biotechnol. 2020, 38, 675–678. [Google Scholar] [CrossRef]
  15. Zhang, Y.; Parmigiani, G.; Johnson, W.E. ComBat-seq: Batch effect adjustment for RNA-seq count data. NAR Genom. Bioinform. 2020, 2, lqaa078. [Google Scholar] [CrossRef]
  16. Love, M.I.; Huber, W.; Anders, S. Moderated estimation of fold change and dispersion for RNA-seq data with DESeq2. Genome Biol. 2014, 15, 550. [Google Scholar] [CrossRef]
  17. Avelar, R.A.; Ortega, J.G.; Tacutu, R.; Tyler, E.J.; Bennett, D.; Binetti, P.; Budovsky, A.; Chatsirisupachai, K.; Johnson, E.; Murray, A.; et al. A multidimensional systems biology analysis of cellular senescence in aging and disease. Genome Biol. 2020, 21, 91. [Google Scholar] [CrossRef]
  18. Ritchie, M.E.; Phipson, B.; Wu, D.; Hu, Y.; Law, C.W.; Shi, W.; Smyth, G.K. limma powers differential expression analyses for RNA-sequencing and microarray studies. Nucleic Acids Res. 2015, 43, e47. [Google Scholar] [CrossRef]
  19. Wu, T.; Hu, E.; Xu, S.; Chen, M.; Guo, P.; Dai, Z.; Feng, T.; Zhou, L.; Tang, W.; Zhan, L.; et al. clusterProfiler 4.0: A universal enrichment tool for interpreting omics data. Innovation 2021, 2, 100141. [Google Scholar] [CrossRef]
  20. Wilkerson, M.D.; Hayes, D.N. ConsensusClusterPlus: A class discovery tool with confidence assessments and item tracking. Bioinformatics 2010, 26, 1572–1573. [Google Scholar] [CrossRef]
  21. Yoshihara, K.; Shahmoradgoli, M.; Martínez, E.; Vegesna, R.; Kim, H.; Torres-Garcia, W.; Treviño, V.; Shen, H.; Laird, P.W.; Levine, D.A.; et al. Inferring tumour purity and stromal and immune cell admixture from expression data. Nat. Commun. 2013, 4, 2612. [Google Scholar] [CrossRef] [PubMed]
  22. Hänzelmann, S.; Castelo, R.; Guinney, J. GSVA: Gene set variation analysis for microarray and RNA-seq data. BMC Bioinform. 2013, 14, 7. [Google Scholar] [CrossRef] [PubMed]
  23. Maeser, D.; Gruener, R.F.; Huang, R.S. oncoPredict: An R package for predicting in vivo or cancer patient drug response and biomarkers from cell line screening data. Brief. Bioinform. 2021, 22, bbab260. [Google Scholar] [CrossRef]
  24. Yang, W.; Soares, J.; Greninger, P.; Edelman, E.J.; Lightfoot, H.; Forbes, S.; Bindal, N.; Beare, D.; Smith, J.A.; Thompson, I.R.; et al. Genomics of Drug Sensitivity in Cancer (GDSC): A resource for therapeutic biomarker discovery in cancer cells. Nucleic Acids Res. 2013, 41, D955–D961. [Google Scholar] [CrossRef]
  25. Cancer Genome Atlas Research Network. Integrated genomic analyses of ovarian carcinoma. Nature 2011, 474, 609–615. [Google Scholar] [CrossRef] [PubMed]
  26. Correia-Melo, C.; Marques, F.D.; Anderson, R.; Hewitt, G.; Hewitt, R.; Cole, J.; Carroll, B.M.; Miwa, S.; Birch, J.; Merz, A.; et al. Mitochondria are required for pro-ageing features of the senescent phenotype. EMBO J. 2016, 35, 724–742. [Google Scholar] [CrossRef]
  27. Gundem, G.; Lopez-Bigas, N. Sample-level enrichment analysis unravels shared stress phenotypes among multiple cancer types. Genome Med. 2012, 4, 28. [Google Scholar] [CrossRef]
  28. Kim, Y.H.; Choi, Y.W.; Lee, J.; Soh, E.Y.; Kim, J.H.; Park, T.J. Senescent tumor cells lead the collective invasion in thyroid cancer. Nat. Commun. 2017, 8, 15208. [Google Scholar] [CrossRef]
  29. Liu, Z.; Chen, T.; Zhang, S.; Yang, T.; Gong, Y.; Deng, H.W.; Bai, D.; Tian, W.; Chen, Y. Discovery and functional assessment of a novel adipocyte population driven by intracellular Wnt/β-catenin signaling in mammals. eLife 2022, 11, e77740. [Google Scholar] [CrossRef]
  30. Zheng, J.H.; Lin, S.R.; Tseng, F.J.; Tsai, M.J.; Lue, S.I.; Chia, Y.C.; Woon, M.; Fu, Y.S.; Weng, C.F. Clerodane Diterpene Ameliorates Inflammatory Bowel Disease and Potentiates Cell Apoptosis of Colorectal Cancer. Biomolecules 2019, 9, 762. [Google Scholar] [CrossRef]
  31. Rao, S.; Gurbani, D.; Du, G.; Everley, R.A.; Browne, C.M.; Chaikuad, A.; Tan, L.; Schröder, M.; Gondi, S.; Ficarro, S.B.; et al. Leveraging Compound Promiscuity to Identify Targetable Cysteines within the Kinome. Cell Chem. Biol. 2019, 26, 818–829.e819. [Google Scholar] [CrossRef] [PubMed]
  32. Chen, X.; Hu, J.; Wang, Y.; Lee, Y.; Zhao, X.; Lu, H.; Zhu, G.; Wang, H.; Jiang, Y.; Liu, F.; et al. The FoxO4/DKK3 axis represses IFN-γ expression by Th1 cells and limits antimicrobial immunity. J. Clin. Investig. 2022, 132, e147566. [Google Scholar] [CrossRef] [PubMed]
  33. Zhu, G.; Zhou, L.; Liu, H.; Shan, Y.; Zhang, X. MicroRNA-224 Promotes Pancreatic Cancer Cell Proliferation and Migration by Targeting the TXNIP-Mediated HIF1α Pathway. Cell. Physiol. Biochem. Int. J. Exp. Cell. Physiol. Biochem. Pharmacol. 2018, 48, 1735–1746. [Google Scholar] [CrossRef] [PubMed]
  34. Fei, Q.; Jin, K.; Shi, S.; Li, T.; Guo, D.; Lin, M.; Yu, X.; Wu, W.; Ye, L. Suppression of pancreatic cancer proliferation through TXNIP-mediated inhibition of the MAPK signaling pathway. Acta Biochim. Biophys. Sin. 2024, 56, 513–524. [Google Scholar] [CrossRef]
  35. Uota, A.; Okuno, Y.; Fukuhara, A.; Sasaki, S.; Kobayashi, S.; Shimomura, I. ARMC5 selectively degrades SCAP-free SREBF1 and is essential for fatty acid desaturation in adipocytes. J. Biol. Chem. 2024, 300, 107953. [Google Scholar] [CrossRef]
  36. Cao, Y.; Wang, X.; Liu, Y.; Liu, P.; Qin, J.; Zhu, Y.; Zhai, S.; Jiang, Y.; Liu, Y.; Han, L.; et al. BHLHE40 Inhibits Ferroptosis in Pancreatic Cancer Cells via Upregulating SREBF1. Adv. Sci. 2024, 11, e2306298. [Google Scholar] [CrossRef]
  37. Seager, R.J.; Hajal, C.; Spill, F.; Kamm, R.D.; Zaman, M.H. Dynamic interplay between tumour, stroma and immune system can drive or prevent tumour progression. Converg. Sci. Phys. Oncol. 2017, 3, 034002. [Google Scholar] [CrossRef]
  38. Alonso-Nocelo, M.; Raimondo, T.M.; Vining, K.H.; López-López, R.; de la Fuente, M.; Mooney, D.J. Matrix stiffness and tumor-associated macrophages modulate epithelial to mesenchymal transition of human adenocarcinoma cells. Biofabrication 2018, 10, 035004. [Google Scholar] [CrossRef]
  39. Wang, Y.; Peng, B.; Ning, C.; He, S.; Yang, H.; Mao, Y.; Sun, L. Characterization of immune features and immunotherapy response in subtypes of hepatocellular carcinoma based on mitophagy. Front. Immunol. 2022, 13, 966167. [Google Scholar] [CrossRef]
  40. Berraondo, P.; Sanmamed, M.F.; Ochoa, M.C.; Etxeberria, I.; Aznar, M.A.; Pérez-Gracia, J.L.; Rodríguez-Ruiz, M.E.; Ponz-Sarvise, M.; Castañón, E.; Melero, I. Cytokines in clinical cancer immunotherapy. Br. J. Cancer 2019, 120, 6–15. [Google Scholar] [CrossRef]
  41. van der Reest, J.; Lilla, S.; Zheng, L.; Zanivan, S.; Gottlieb, E. Proteome-wide analysis of cysteine oxidation reveals metabolic sensitivity to redox stress. Nat. Commun. 2018, 9, 1581. [Google Scholar] [CrossRef] [PubMed]
  42. Wang, Y.; Zhang, S.; Bai, Y.; Li, G.; Wang, S.; Chen, J.; Liu, X.; Yin, H. Development and Validation of Ferroptosis-Related LncRNA Biomarker in Bladder Carcinoma. Front. Cell Dev. Biol. 2022, 10, 809747. [Google Scholar] [CrossRef]
  43. Wang, J.J.; Siu, M.K.; Jiang, Y.X.; Leung, T.H.; Chan, D.W.; Wang, H.G.; Ngan, H.Y.; Chan, K.K. A Combination of Glutaminase Inhibitor 968 and PD-L1 Blockade Boosts the Immune Response against Ovarian Cancer. Biomolecules 2021, 11, 1749. [Google Scholar] [CrossRef] [PubMed]
  44. Ma, H.; Qi, G.; Han, F.; Lu, W.; Peng, J.; Li, R.; Yan, S.; Yuan, C.; Kong, B. HMGB3 promotes PARP inhibitor resistance through interacting with PARP1 in ovarian cancer. Cell Death Dis. 2022, 13, 263. [Google Scholar] [CrossRef]
  45. Ma, H.; Qi, G.; Han, F.; Gai, P.; Peng, J.; Kong, B. HMGB3 promotes the malignant phenotypes and stemness of epithelial ovarian cancer through the MAPK/ERK signaling pathway. Cell Commun. Signal. CCS 2023, 21, 144. [Google Scholar] [CrossRef]
  46. Mukherjee, A.; Huynh, V.; Gaines, K.; Reh, W.A.; Vasquez, K.M. Targeting the High-Mobility Group Box 3 Protein Sensitizes Chemoresistant Ovarian Cancer Cells to Cisplatin. Cancer Res. 2019, 79, 3185–3191. [Google Scholar] [CrossRef]
  47. Kitami, K.; Yoshihara, M.; Koya, Y.; Sugiyama, M.; Iyoshi, S.; Uno, K.; Mogi, K.; Tano, S.; Fujimoto, H.; Nawa, A.; et al. Microphthalmia-Associated Transcription Factor-Dependent Melanoma Cell Adhesion Molecule Activation Promotes Peritoneal Metastasis of Ovarian Cancer. Int. J. Mol. Sci. 2020, 21, 9776. [Google Scholar] [CrossRef]
  48. Zhang, M.; Zhao, L. CKAP2 Promotes Ovarian Cancer Proliferation and Tumorigenesis Through the FAK-ERK Pathway. DNA Cell Biol. 2017, 36, 983–990. [Google Scholar] [CrossRef]
  49. Liu, X.; Zhang, W.; Wang, H.; Yang, W. Identification of CKAP2 as a Potential Target for Prevention of Gastric Cancer Progression: A Multi-Omics Study. Int. J. Mol. Sci. 2025, 26, 1557. [Google Scholar] [CrossRef]
  50. Paim, L.M.G.; Lopez-Jauregui, A.A.; McAlear, T.S.; Bechstedt, S. The spindle protein CKAP2 regulates microtubule dynamics and ensures faithful chromosome segregation. Proc. Natl. Acad. Sci. USA 2024, 121, e2318782121. [Google Scholar] [CrossRef]
  51. Zhang, J.; Wang, F.; Liu, F.; Xu, G. Predicting STAT1 as a prognostic marker in patients with solid cancer. Ther. Adv. Med. Oncol. 2020, 12, 1758835920917558. [Google Scholar] [CrossRef] [PubMed]
  52. Padmanabhan, S.; Gaire, B.; Zou, Y.; Uddin, M.M.; Vancurova, I. IFNγ-induced PD-L1 expression in ovarian cancer cells is regulated by JAK1, STAT1 and IRF1 signaling. Cell. Signal. 2022, 97, 110400. [Google Scholar] [CrossRef] [PubMed]
  53. Wang, M.; Xu, S.; Xu, J.; Wei, J.; Wu, Y. WTAP contributes to platinum resistance in high-grade serous ovarian cancer by up-regulating malic acid: Insights from liquid chromatography and mass spectrometry analysis. Cancer Metab. 2025, 13, 14. [Google Scholar] [CrossRef] [PubMed]
  54. Sowamber, R.; Nelson, O.; Dodds, L.; DeCastro, V.; Paudel, I.; Milea, A.; Considine, M.; Cope, L.; Pinto, A.; Schlumbrecht, M.; et al. Integrative Transcriptome Analyses of the Human Fallopian Tube: Fimbria and Ampulla-Site of Origin of Serous Carcinoma of the Ovary. Cancers 2020, 12, 1090. [Google Scholar] [CrossRef]
  55. Ketterer, S.; Mitschke, J.; Ketscher, A.; Schlimpert, M.; Reichardt, W.; Baeuerle, N.; Hess, M.E.; Metzger, P.; Boerries, M.; Peters, C.; et al. Cathepsin D deficiency in mammary epithelium transiently stalls breast cancer by interference with mTORC1 signaling. Nat. Commun. 2020, 11, 5133. [Google Scholar] [CrossRef]
  56. Scheidemann, E.R.; Demas, D.M.; Hou, C.; Ma, J.; He, W.; Sharma, G.; Schultz, E.; Weilbaecher, K.N.; Shajahan-Haq, A.N. Resistance to abemaciclib is associated with increased metastatic potential and lysosomal protein deregulation in breast cancer cells. Mol. Carcinog. 2024, 63, 209–223. [Google Scholar] [CrossRef]
  57. Taraszka, K.; Groha, S.; King, D.; Tell, R.; White, K.; Ziv, E.; Zaitlen, N.; Gusev, A. A comprehensive analysis of clinical and polygenic germline influences on somatic mutational burden. Am. J. Hum. Genet. 2024, 111, 242–258. [Google Scholar] [CrossRef]
  58. Stenzinger, A.; Allen, J.D.; Maas, J.; Stewart, M.D.; Merino, D.M.; Wempe, M.M.; Dietel, M. Tumor mutational burden standardization initiatives: Recommendations for consistent tumor mutational burden assessment in clinical samples to guide immunotherapy treatment decisions. Genes Chromosomes Cancer 2019, 58, 578–588. [Google Scholar] [CrossRef]
  59. Wang, X.; Li, M. Correlate tumor mutation burden with immune signatures in human cancers. BMC Immunol. 2019, 20, 4. [Google Scholar] [CrossRef]
  60. Qiu, G.H.; Yu, B.; Ma, M. G protein-coupled receptor-mediated signaling of immunomodulation in tumor progression. FASEB J. Off. Publ. Fed. Am. Soc. Exp. Biol. 2024, 38, e23829. [Google Scholar] [CrossRef]
  61. Liu, Y.; An, S.; Ward, R.; Yang, Y.; Guo, X.X.; Li, W.; Xu, T.R. G protein-coupled receptors as promising cancer targets. Cancer Lett. 2016, 376, 226–239. [Google Scholar] [CrossRef] [PubMed]
  62. Ray, S.K.; Mukherjee, S. Consequences of Extracellular Matrix Remodeling in Headway and Metastasis of Cancer along with Novel Immunotherapies: A Great Promise for Future Endeavor. Anti-Cancer Agents Med. Chem. 2022, 22, 1257–1271. [Google Scholar] [CrossRef]
  63. Du, W.; Xia, X.; Hu, F.; Yu, J. Extracellular matrix remodeling in the tumor immunity. Front. Immunol. 2023, 14, 1340634. [Google Scholar] [CrossRef]
  64. Scott, E.N.; Gocher, A.M.; Workman, C.J.; Vignali, D.A.A. Regulatory T Cells: Barriers of Immune Infiltration Into the Tumor Microenvironment. Front. Immunol. 2021, 12, 702726. [Google Scholar] [CrossRef]
  65. Lorusso, G.; Rüegg, C. The tumor microenvironment and its contribution to tumor evolution toward metastasis. Histochem. Cell Biol. 2008, 130, 1091–1103. [Google Scholar] [CrossRef]
  66. Huang, Y.K.; Busuttil, R.A.; Boussioutas, A. The Role of Innate Immune Cells in Tumor Invasion and Metastasis. Cancers 2021, 13, 5885. [Google Scholar] [CrossRef]
Figure 1. Study flowchart.
Biomedicines 13 00877 g001
Figure 2. Genomic and transcriptomic profiling of DE-CSGs. (A) Volcano plot of DE-CSGs between tumor and normal tissues. (B) Heatmap showing expression patterns of 31 prognostic DE-CSGs. (C) Functional enrichment analysis of DE-CSGs using GO and KEGG. BP: biological process; MF: molecular function. (D) Chromosomal distribution of DE-CSGs. (E) CNV frequency analysis of DE-CSGs in OC.
Biomedicines 13 00877 g002
Figure 3. Molecular subtyping based on DE-CSGs. (A) Consensus clustering analysis defining two molecular subtypes (k = 2). (B) Cumulative distribution function (C,D,F) curves for cluster number determination. (C) Delta area analysis for optimal cluster selection. (D) Tracking plot validation of cluster stability. (E) PCA visualization of subtype separation. (F,G) GSEA of biological pathways in (F) C1 and (G) C2 subtypes. (H) K–M survival curves comparing OS between subtypes. (I,J) TME scores and immune cell infiltration levels across subtypes. (K) Differential expression of immune checkpoint molecules between subtypes. (* p < 0.05; ** p < 0.01; *** p < 0.001).
Biomedicines 13 00877 g003
Figure 4. Construction of the risk score model and identification of the hub CSGs. (A) LASSO coefficient profiles for feature selection. (B) Partial likelihood deviance curve for optimal λ selection. (C) Distribution of risk scores across patients. (D) K–M analysis of survival outcomes by risk group. (E) Multivariate Cox regression analysis of prognostic DE-CSGs.
Biomedicines 13 00877 g004
Figure 5. Immunohistochemical staining validation of hub gene protein expression using the HPA database.
Biomedicines 13 00877 g005
Figure 6. Development and evaluation of the prognostic nomogram. (A) Nomogram integrating risk scores for 1-, 3-, and 5-year survival prediction. (B,C) Time-dependent ROC curves and calibration plots in the training cohort. (E,F) External validation of the nomogram in the GSE26712 cohort. (D,G) K–M analysis by risk stratification in training and validation sets. (H) Correlation heatmap between hub genes and risk scores. * p < 0.05.
Biomedicines 13 00877 g006
Figure 7. TMB analysis. (A,B) Mutational landscape of (A) high-risk and (B) low-risk groups. (C) TMB differences between risk groups. (D,E) K–M analysis stratified by TMB levels and combined risk–TMB status.
Biomedicines 13 00877 g007
Figure 8. GSEA analyses of high- (A) and low-risk group (B).
Biomedicines 13 00877 g008
Figure 9. Immune microenvironment characterization. (A) Correlation between hub genes and immune cell infiltration. (B,C) Immune cell abundance differences between risk groups. (D) Comparative TME scores across risk groups. (* p < 0.05; ** p < 0.01; *** p < 0.001).
Biomedicines 13 00877 g009
Figure 10. Differential drug response profiles between risk-stratified OC patients. (A) IC50 of Docetaxel. (B) IC50 of Doxorubicin. (C) IC50 of Olaparib. (D) IC50 of Cisplatin. (E) IC50 of Paclitaxel. (F) IC50 of Niraparib. (* p < 0.05; ** p < 0.01; ns, not significant)
Biomedicines 13 00877 g010
Disclaimer/Publisher’s Note: The statements, opinions and data contained in all publications are solely those of the individual author(s) and contributor(s) and not of MDPI and/or the editor(s). MDPI and/or the editor(s) disclaim responsibility for any injury to people or property resulting from any ideas, methods, instructions or products referred to in the content.

