

Genetic Evidence Supporting the Repurposing of mTOR Inhibitors for Reducing BMI

Abstract
1. Introduction
2. Methods
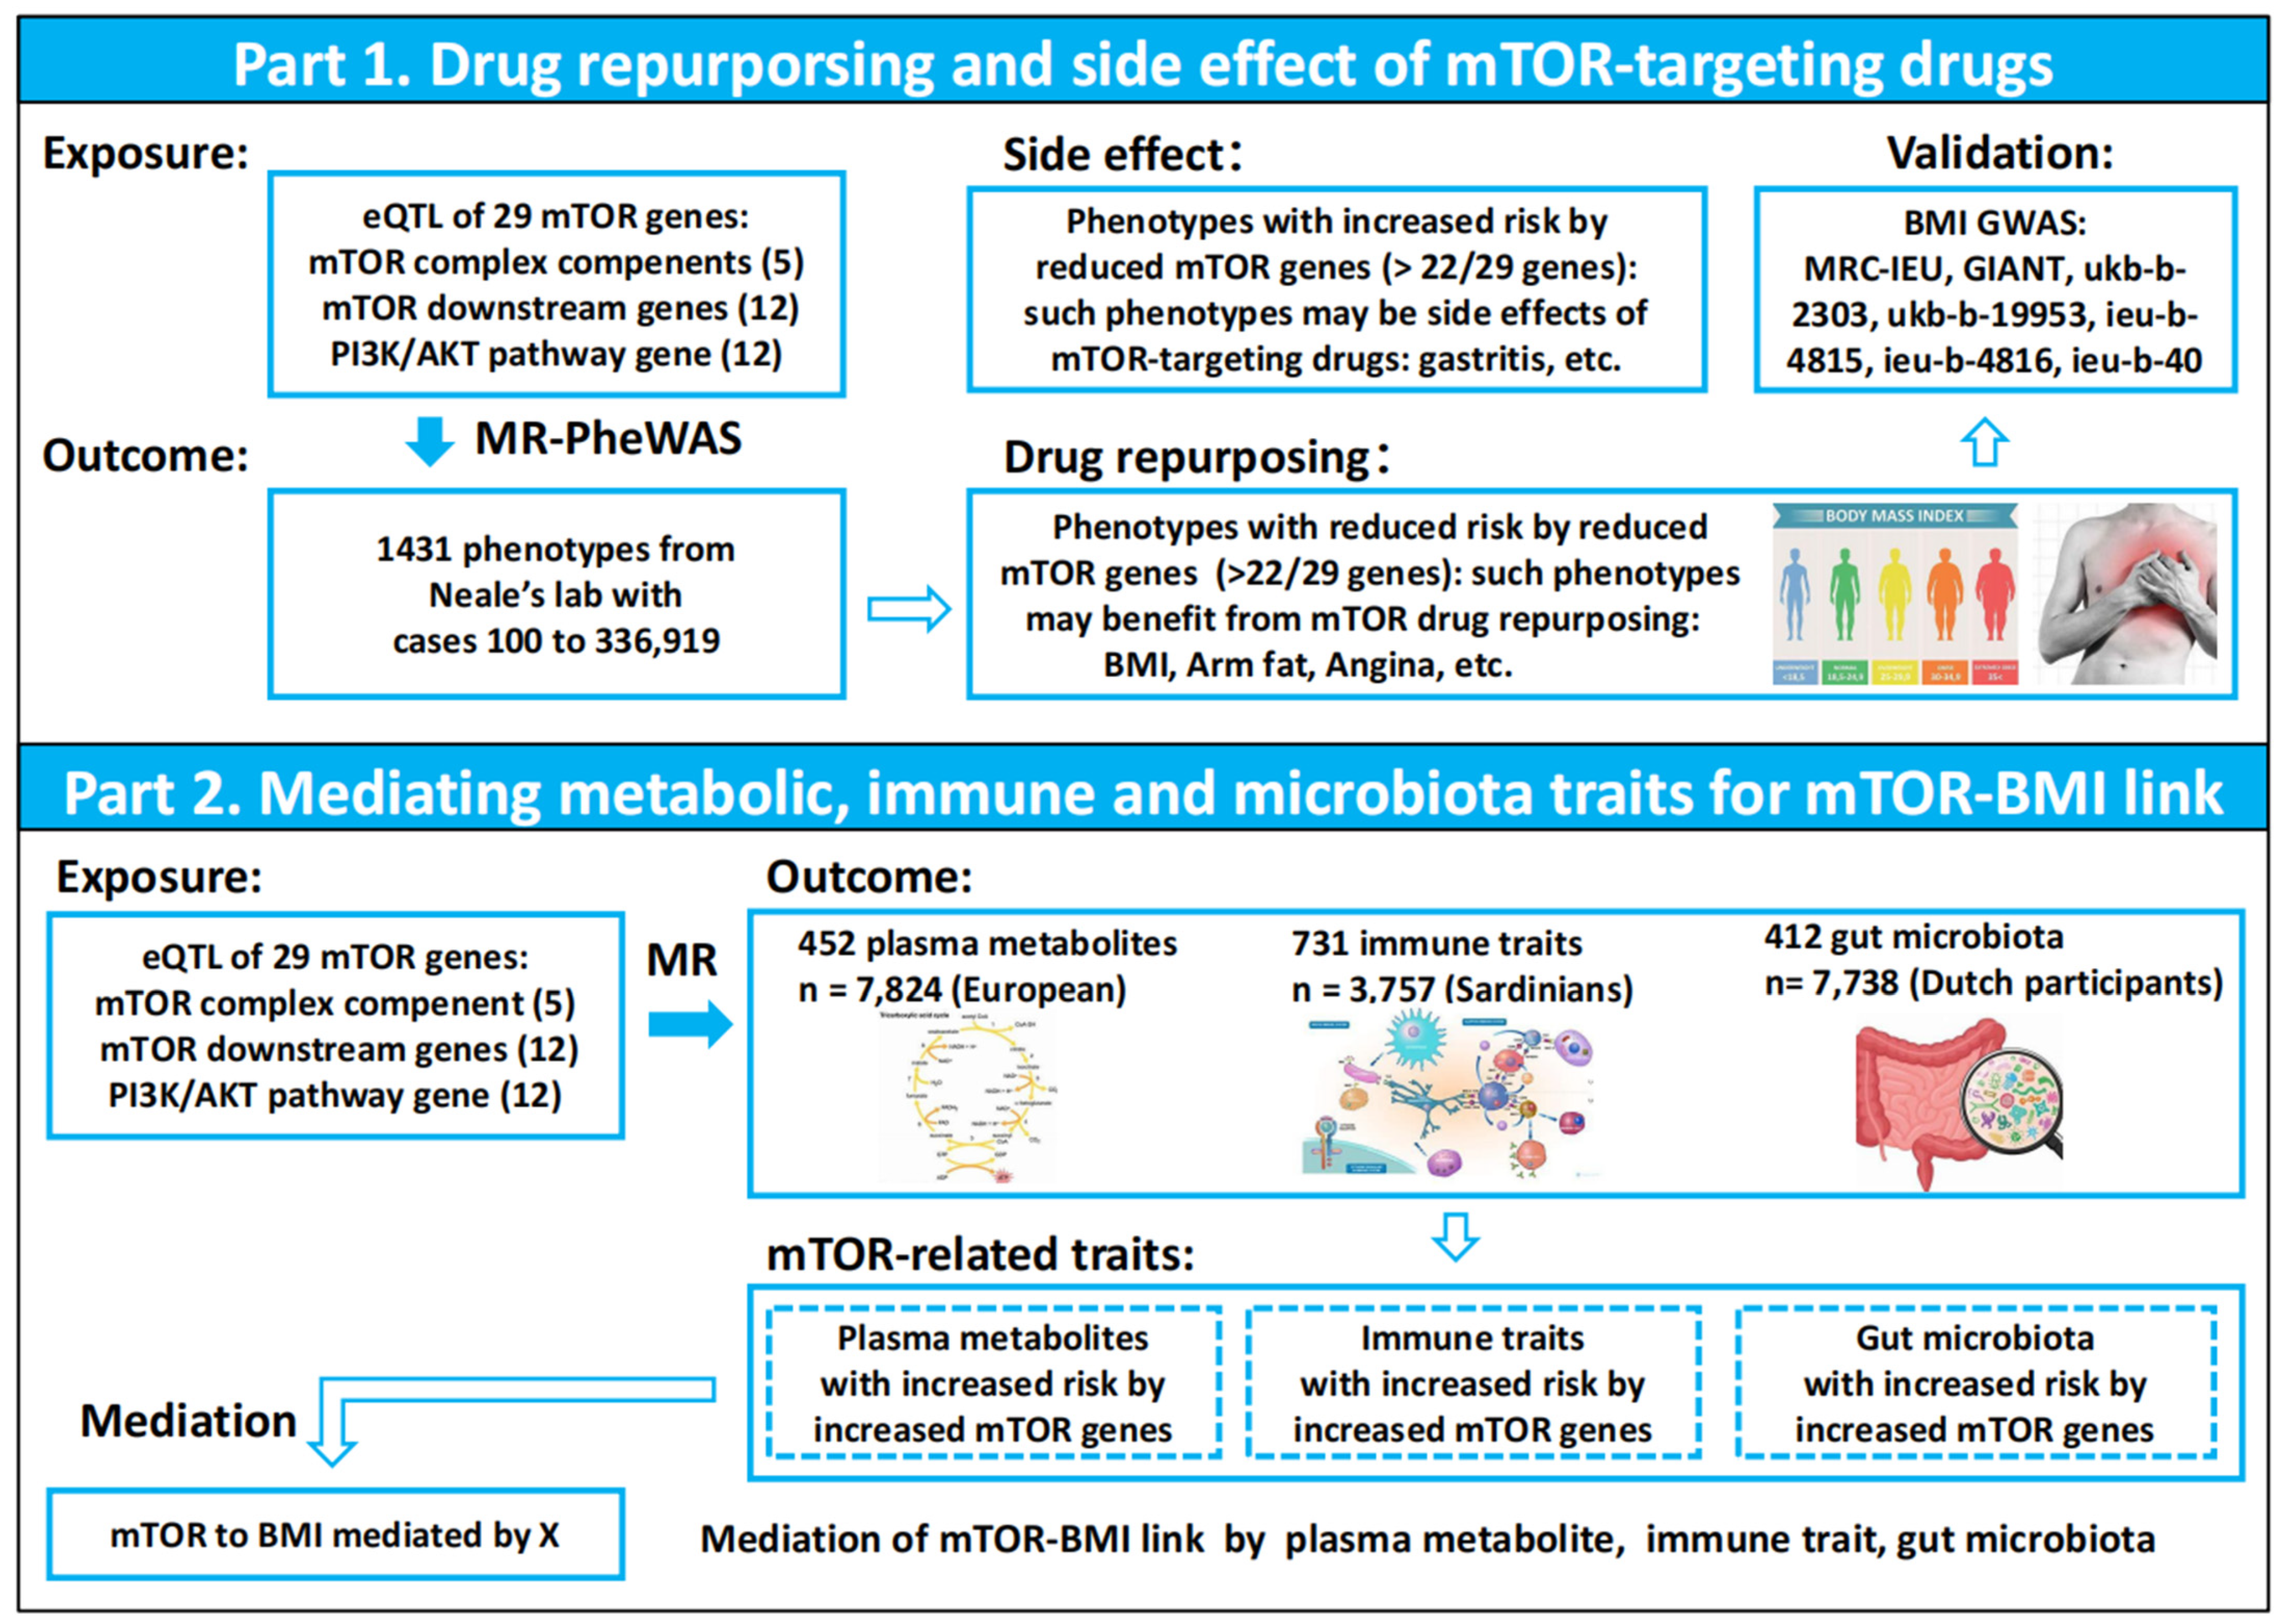
2.1. Study Design
2.2. Phenotype Data Source and MR-PheWAS Analysis
2.3. 452 Plasma Metabolites GWAS Data Source
2.4. 731 Immune Cell Phenotype GWAS Data Source
2.5. 412 Gut Microbiota GWAS Data Source
2.6. Mediation Analysis
2.7. Role of the Funding Source
2.8. Ethics
3. Results
3.1. MR-PheWAS Analysis Identified a Causal Relationship Between mTOR and BMI, Highlighting Potential Opportunities for Drug Repurposing
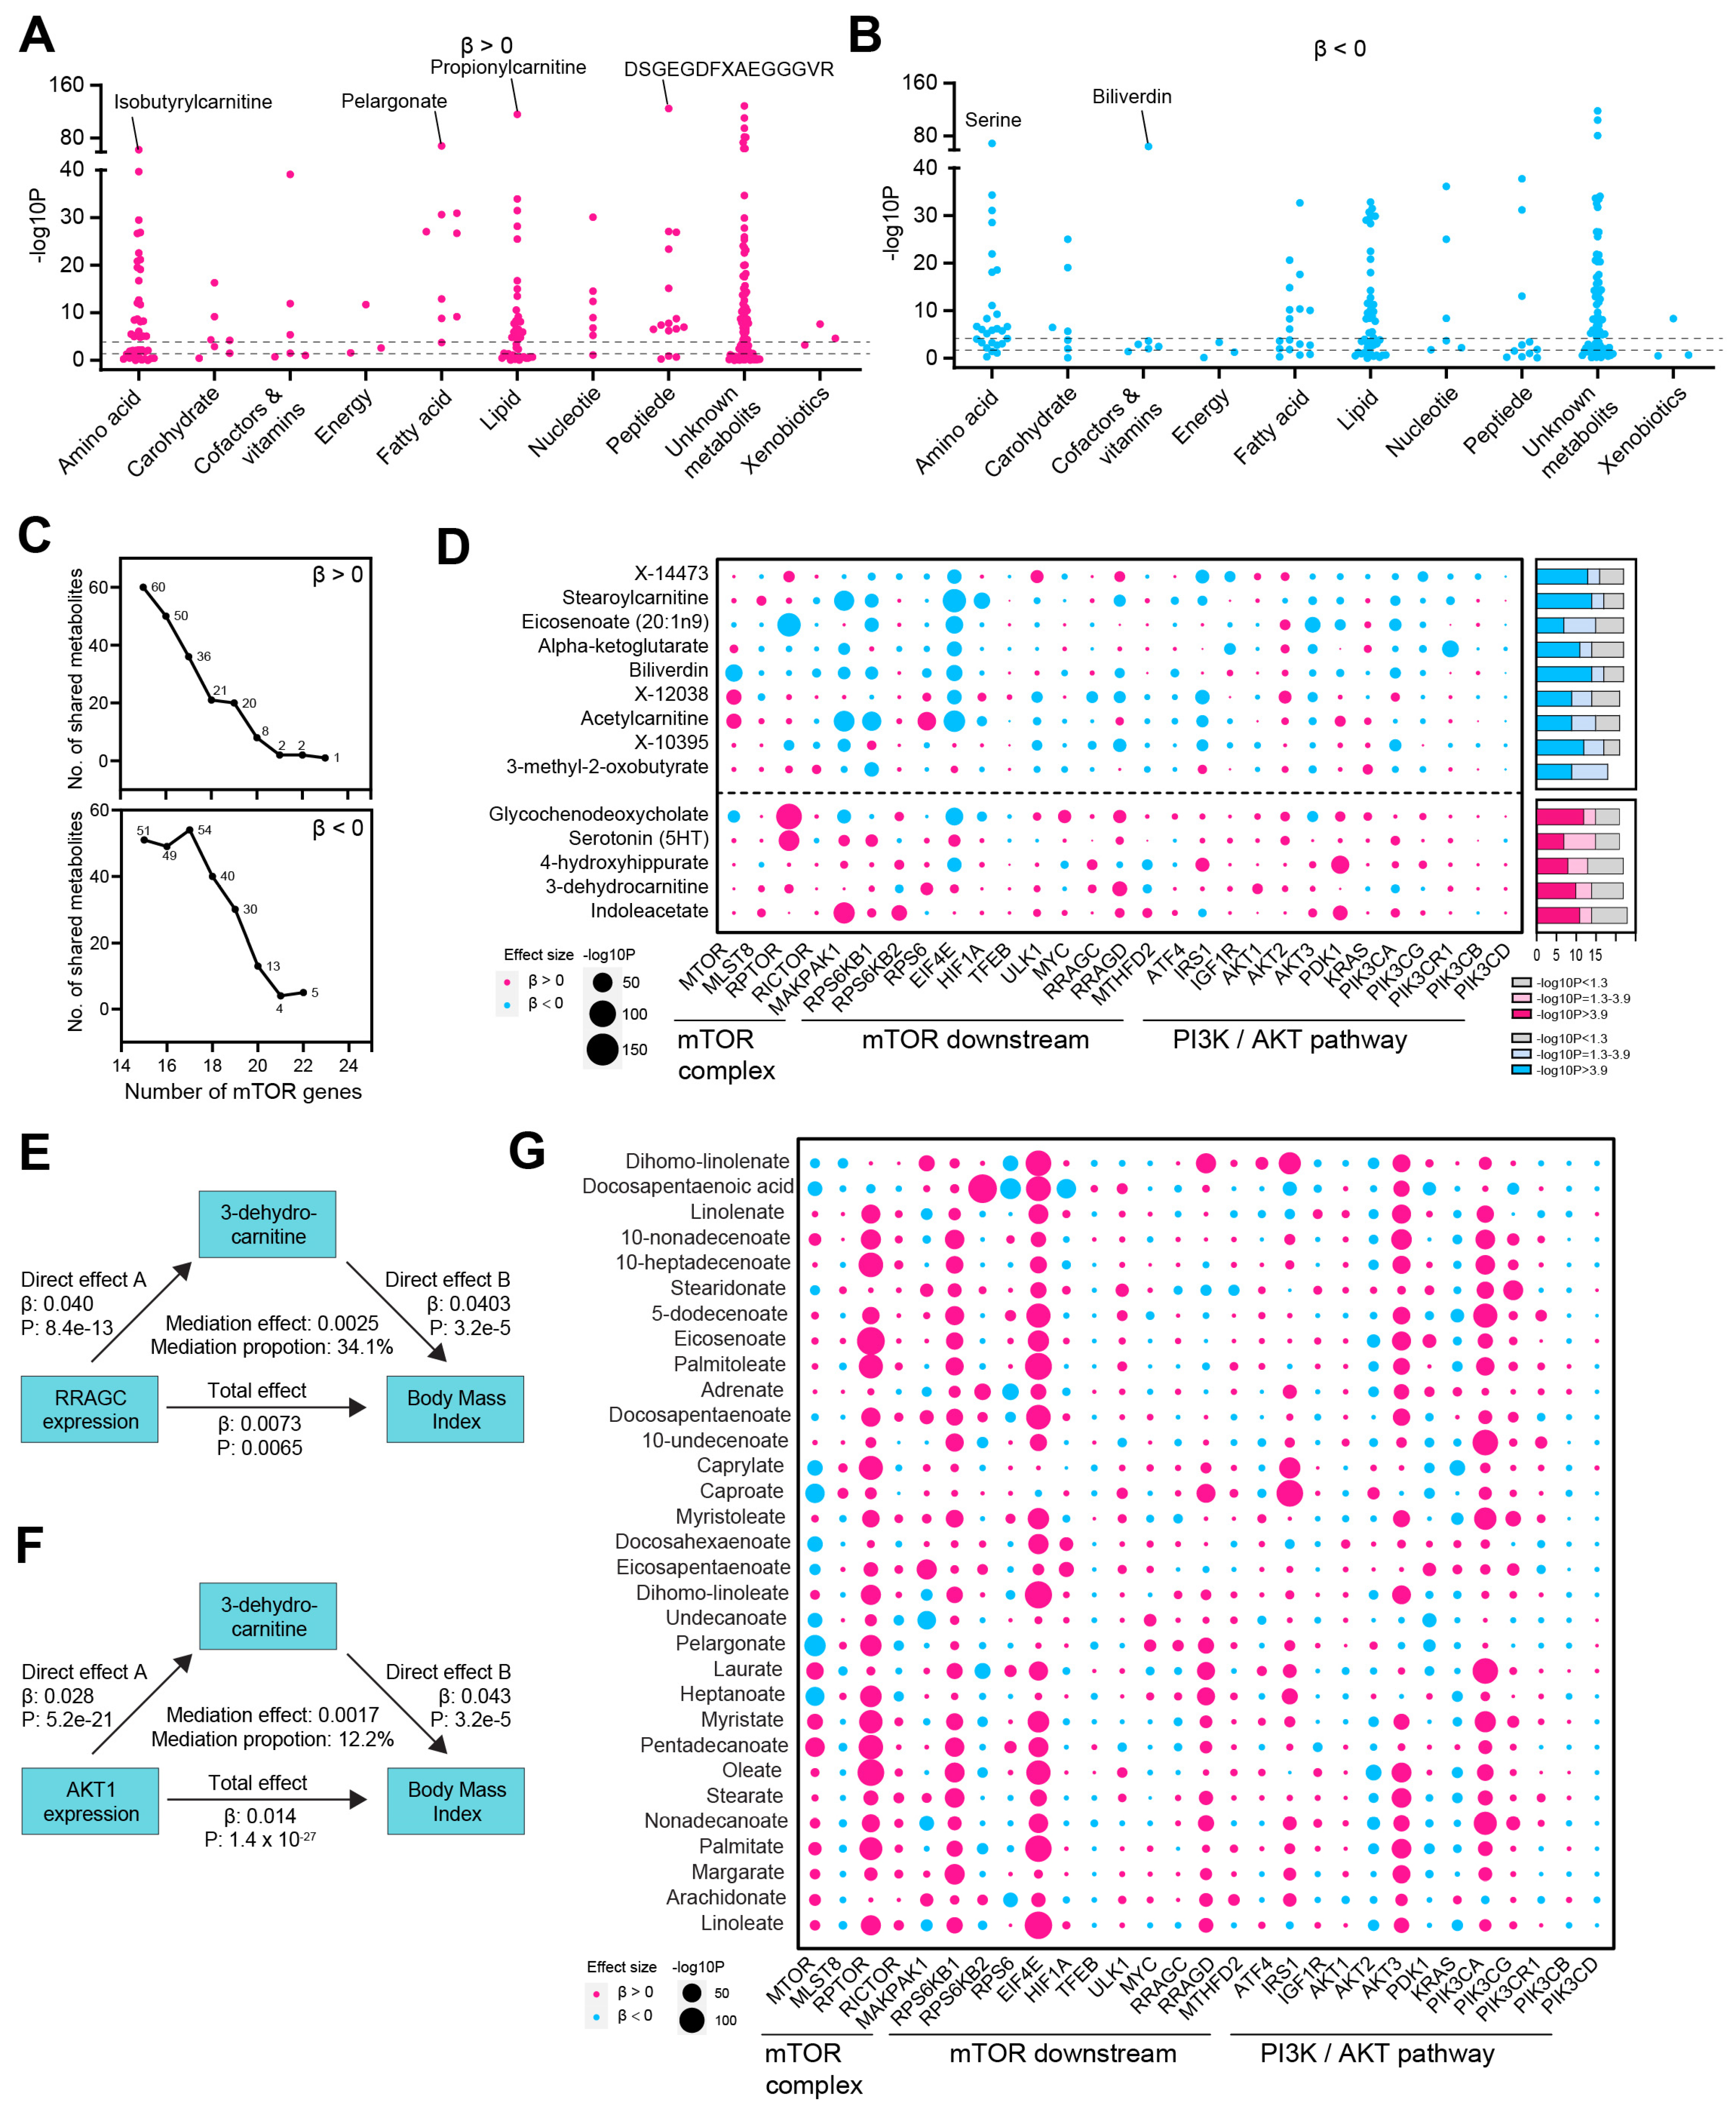
3.2. mTOR-Related Metabolites and Their Mediating Role in the mTOR-BMI Link
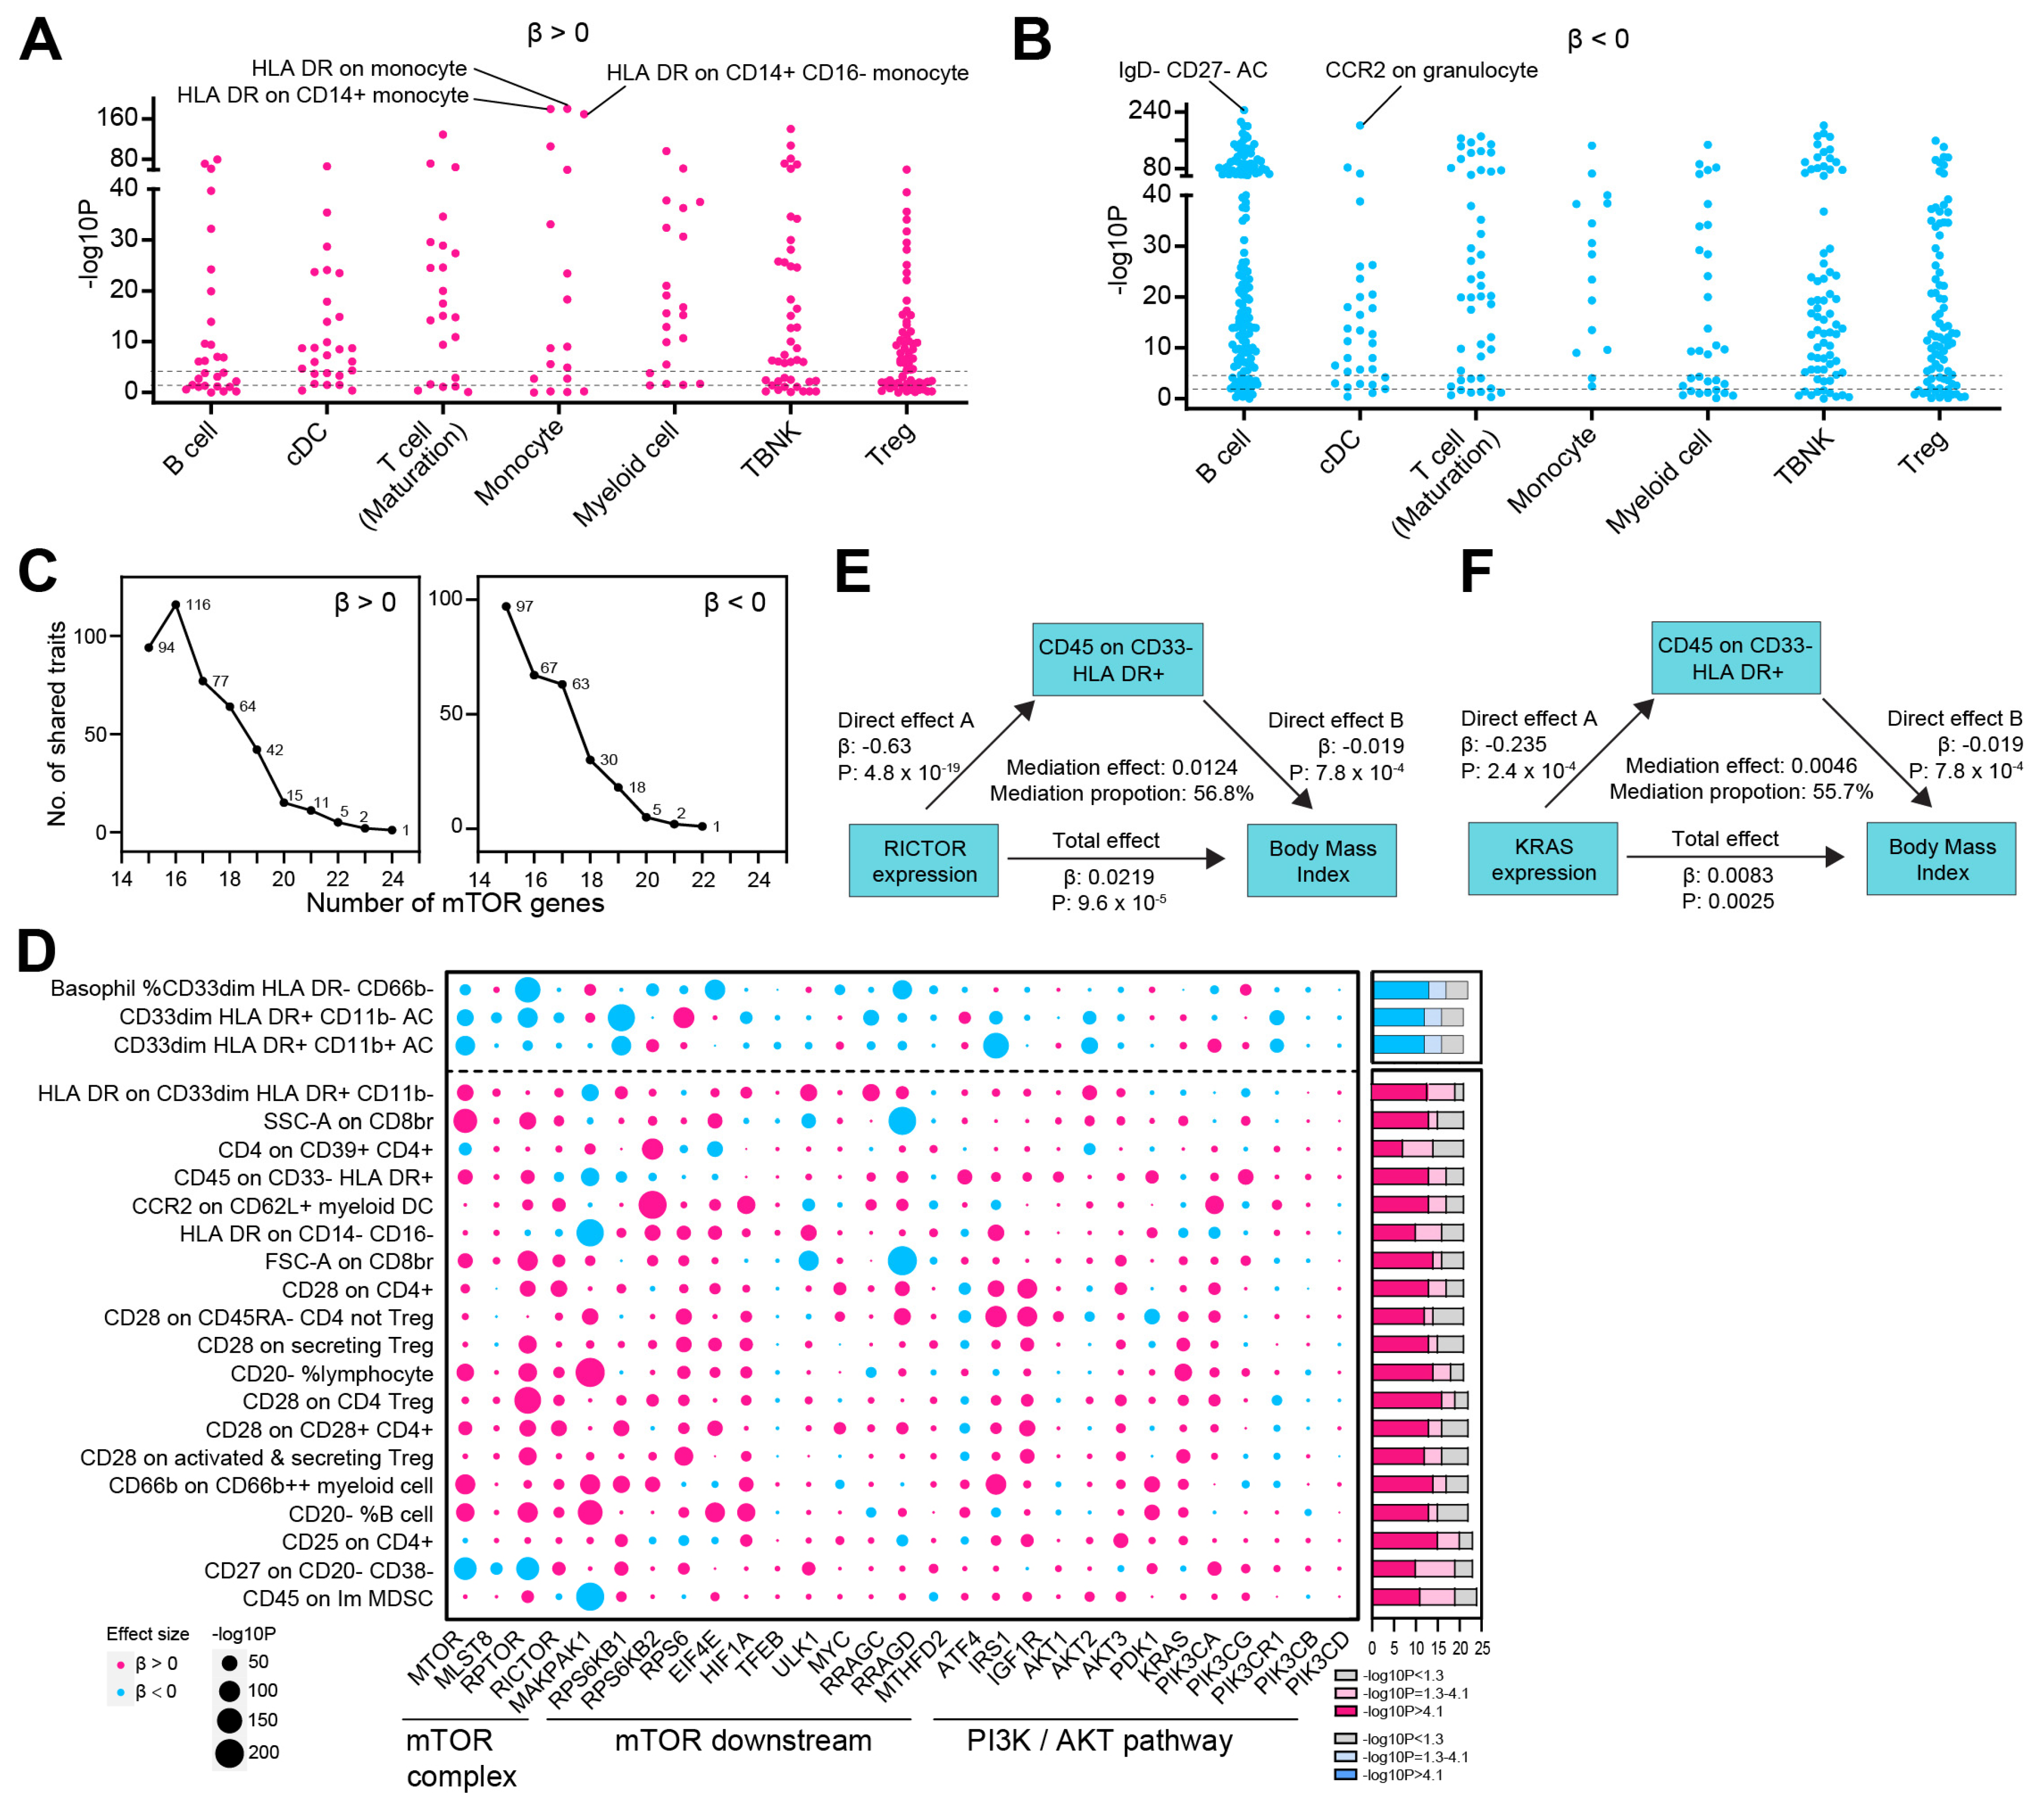
3.3. The mTOR-BMI Association Was Partially Mediated by Immune Traits
3.4. Identification of mTOR-Related Gut Microbiota and Its Role in Mediating the mTOR-BMI Connection
4. Discussion
Limitations of This Study
5. Conclusions
Supplementary Materials
Author Contributions
Funding
Institutional Review Board Statement
Informed Consent Statement
Data Availability Statement
Conflicts of Interest
References
- Eng, C.P.; Sehgal, S.N.; Vézina, C. Activity of rapamycin (AY-22,989) against transplanted tumors. J. Antibiot. 1984, 37, 1231–1237. [Google Scholar] [CrossRef] [PubMed]
- Brown, E.J.; Albers, M.W.; Bum Shin, T.; Ichikawa, K.; Keith, C.T.; Lane, W.S.; Schreiber, S.L. A mammalian protein targeted by G1-arresting rapamycin-receptor complex. Nature 1994, 369, 756–758. [Google Scholar] [CrossRef] [PubMed]
- Tian, T.; Li, X.; Zhang, J. mTOR Signaling in Cancer and mTOR Inhibitors in Solid Tumor Targeting Therapy. Int. J. Mol. Sci. 2019, 20, 755. [Google Scholar] [CrossRef]
- Park, I.H.; Kong, S.Y.; Kwon, Y.; Kim, M.K.; Sim, S.H.; Joo, J.; Lee, K.S. Phase I/II clinical trial of everolimus combined with gemcitabine/cisplatin for metastatic triple-negative breast cancer. J. Cancer 2018, 9, 1145–1151. [Google Scholar] [CrossRef]
- Taylor, S.E.; Chu, T.; Elvin, J.A.; Edwards, R.P.; Zorn, K.K. Phase II study of everolimus and bevacizumab in recurrent ovarian, peritoneal, and fallopian tube cancer. Gynecol. Oncol. 2020, 156, 32–37. [Google Scholar] [CrossRef]
- Javle, M.M.; Shroff, R.T.; Xiong, H.; Varadhachary, G.A.; Fogelman, D.; Reddy, S.A.; Davis, D.; Zhang, Y.; Wolff, R.A.; Abbruzzese, J.L. Inhibition of the mammalian target of rapamycin (mTOR) in advanced pancreatic cancer: Results of two phase II studies. BMC Cancer 2010, 10, 368. [Google Scholar] [CrossRef]
- Grignani, G.; Palmerini, E.; Ferraresi, V.; D’Ambrosio, L.; Bertulli, R.; Asaftei, S.D.; Tamburini, A.; Pignochino, Y.; Sangiolo, D.; Marchesi, E.; et al. Sorafenib and everolimus for patients with unresectable high-grade osteosarcoma progressing after standard treatment: A non-randomised phase 2 clinical trial. Lancet Oncol. 2015, 16, 98–107. [Google Scholar] [CrossRef] [PubMed]
- Adib, E.; Klonowska, K.; Giannikou, K.; Do, K.T.; Pruitt-Thompson, S.; Bhushan, K.; Milstein, M.I.; Hedglin, J.; Kargus, K.E.; Sholl, L.M.; et al. Phase II Clinical Trial of Everolimus in a Pan-Cancer Cohort of Patients with mTOR Pathway Alterations. Clin. Cancer Res. 2021, 27, 3845–3853. [Google Scholar] [CrossRef]
- Zhao, H.; Swanson, K.D.; Zheng, B. Therapeutic Repurposing of Biguanides in Cancer. Trends Cancer 2021, 7, 714–730. [Google Scholar]
- Burgess, S.; Mason, A.M.; Grant, A.J.; Slob, E.A.; Gkatzionis, A.; Zuber, V.; Patel, A.; Tian, H.; Liu, C.; Haynes, W.G.; et al. Using genetic association data to guide drug discovery and development: Review of methods and applications. Am. J. Hum. Genet. 2023, 110, 195–214. [Google Scholar]
- Võsa, U.; Claringbould, A.; Westra, H.J.; Bonder, M.J.; Deelen, P.; Zeng, B.; Kirsten, H.; Saha, A.; Kreuzhuber, R.; Yazar, S.; et al. Large-scale cis- and trans-eQTL analyses identify thousands of genetic loci and polygenic scores that regulate blood gene expression. Nat. Genet. 2021, 53, 1300–1310. [Google Scholar]
- Shin, S.Y.; Fauman, E.B.; Petersen, A.K.; Krumsiek, J.; Santos, R.; Huang, J.; Arnold, M.; Erte, I.; Forgetta, V.; Yang, T.P.; et al. An atlas of genetic influences on human blood metabolites. Nat. Genet. 2014, 46, 543–550. [Google Scholar] [CrossRef]
- Orrù, V.; Steri, M.; Sidore, C.; Marongiu, M.; Serra, V.; Olla, S.; Sole, G.; Lai, S.; Dei, M.; Mulas, A.; et al. Complex genetic signatures in immune cells underlie autoimmunity and inform therapy. Nat. Genet. 2020, 52, 1036–1045. [Google Scholar]
- Lopera-Maya, E.A.; Kurilshikov, A.; van der Graaf, A.; Hu, S.; Andreu-Sánchez, S.; Chen, L.; Vila, A.V.; Gacesa, R.; Sinha, T.; Collij, V.; et al. Effect of host genetics on the gut microbiome in 7,738 participants of the Dutch Microbiome Project. Nat. Genet. 2022, 54, 143–151. [Google Scholar]
- Stangl, T.A.; Wiepjes, C.M.; Smit, R.A.; van Hylckama Vlieg, A.; Lamb, H.J.; van der Velde, J.H.; Winters-van Eekelen, E.; Boone, S.C.; Brouwers, M.C.; Rosendaal, F.R.; et al. The association between low sex hormone binding globulin and increased risk of type 2 diabetes is mediated by increased visceral and liver fat: Results from observational and Mendelian randomization analyses. Diabetes 2024, 73, db23098. [Google Scholar]
- Saxton, R.A.; Sabatini, D.M. mTOR Signaling in Growth, Metabolism, and Disease. Cell 2017, 169, 361–371. [Google Scholar]
- Bader, J.E.; Voss, K.; Rathmell, J.C. Targeting Metabolism to Improve the Tumor Microenvironment for Cancer Immunotherapy. Mol. Cell 2020, 78, 1019–1033. [Google Scholar] [CrossRef]
- Jia, D.; Kuang, Z.; Wang, L. The role of microbial indole metabolites in tumor. Gut Microbes 2024, 16, 2409209. [Google Scholar]
- Hua, H.; Kong, Q.; Zhang, H.; Wang, J.; Luo, T.; Jiang, Y. Targeting mTOR for cancer therapy. J. Hematol. Oncol. 2019, 12, 71. [Google Scholar]
- Liu, Y.; Peng, B.; Chen, Z.; Shen, Y.; Zhang, J.; Yuan, X. Pan-cancer transcriptional atlas of minimal residual disease links DUSP1 to chemotherapy persistence. Exp. Hematol. Oncol. 2024, 13, 42. [Google Scholar]
- Nikanjam, M.; Wells, K.; Kato, S.; Adashek, J.J.; Block, S.; Kurzrock, R. Reverse repurposing: Potential utility of cancer drugs in nonmalignant illnesses. Med 2024, 5, 689–717. [Google Scholar]
- He, L.; Cho, S.; Blenis, J. mTORC1, the maestro of cell metabolism and growth. Genes Dev. 2024, 39, 109–131. [Google Scholar]
- Rovira, J.; Marcelo Arellano, E.; Burke, J.T.; Brault, Y.; Moya-Rull, D.; Bañón-Maneus, E.; Ramírez-Bajo, M.J.; Gutiérrez-Dalmau, A.; Revuelta, I.; Quintana, L.F.; et al. Effect of mTOR inhibitor on body weight: From an experimental rat model to human transplant patients. Transpl. Int. 2008, 21, 992–998. [Google Scholar]
- Pan, X.; Zhang, Z.; Liu, C.; Zhao, M.; Wang, X.; Zhai, J.; Wang, C.; Song, G. Circulating levels of DDIT4 and mTOR, and contributions of BMI, inflammation and insulin sensitivity in hyperlipidemia. Exp. Ther. Med. 2022, 24, 666. [Google Scholar]
- Tan, B.; Hedbacker, K.; Kelly, L.; Zhang, Z.; Moura-Assis, A.; Luo, J.D.; Rabinowitz, J.D.; Friedman, J.M. A cellular and molecular basis of leptin resistance. Cell Metab. 2025, 37, 723–741.e6. [Google Scholar] [CrossRef]
- Yang, S.B.; Tien, A.C.; Boddupalli, G.; Xu, A.W.; Jan, Y.N.; Jan, L.Y. Rapamycin ameliorates age-dependent obesity associated with increased mTOR signaling in hypothalamic POMC neurons. Neuron 2012, 75, 425–436. [Google Scholar] [CrossRef]


Disclaimer/Publisher’s Note: The statements, opinions and data contained in all publications are solely those of the individual author(s) and contributor(s) and not of MDPI and/or the editor(s). MDPI and/or the editor(s) disclaim responsibility for any injury to people or property resulting from any ideas, methods, instructions or products referred to in the content. |
© 2025 by the authors. Licensee MDPI, Basel, Switzerland. This article is an open access article distributed under the terms and conditions of the Creative Commons Attribution (CC BY) license (https://creativecommons.org/licenses/by/4.0/).
Share and Cite
Peng, P.; Shen, F.; Peng, B.; Chen, Z.; Zhou, L.; Hao, X.; Liu, Y. Genetic Evidence Supporting the Repurposing of mTOR Inhibitors for Reducing BMI. Biomedicines 2025, 13, 839. https://doi.org/10.3390/biomedicines13040839
Peng P, Shen F, Peng B, Chen Z, Zhou L, Hao X, Liu Y. Genetic Evidence Supporting the Repurposing of mTOR Inhibitors for Reducing BMI. Biomedicines. 2025; 13(4):839. https://doi.org/10.3390/biomedicines13040839
Chicago/Turabian StylePeng, Ping, Fan Shen, Bi Peng, Ziqi Chen, Lei Zhou, Xingjie Hao, and Yuanhui Liu. 2025. "Genetic Evidence Supporting the Repurposing of mTOR Inhibitors for Reducing BMI" Biomedicines 13, no. 4: 839. https://doi.org/10.3390/biomedicines13040839
APA StylePeng, P., Shen, F., Peng, B., Chen, Z., Zhou, L., Hao, X., & Liu, Y. (2025). Genetic Evidence Supporting the Repurposing of mTOR Inhibitors for Reducing BMI. Biomedicines, 13(4), 839. https://doi.org/10.3390/biomedicines13040839