

Prognostic Significance of Visit-to-Visit Ultrafiltration Volume Variability in Hemodialysis Patients


Abstract
1. Introduction
2. Materials and Methods
2.1. Study Subjects
2.2. Definitions of UV Variability
2.3. Conventional Echocardiography Measurement
2.4. Statistical Analysis
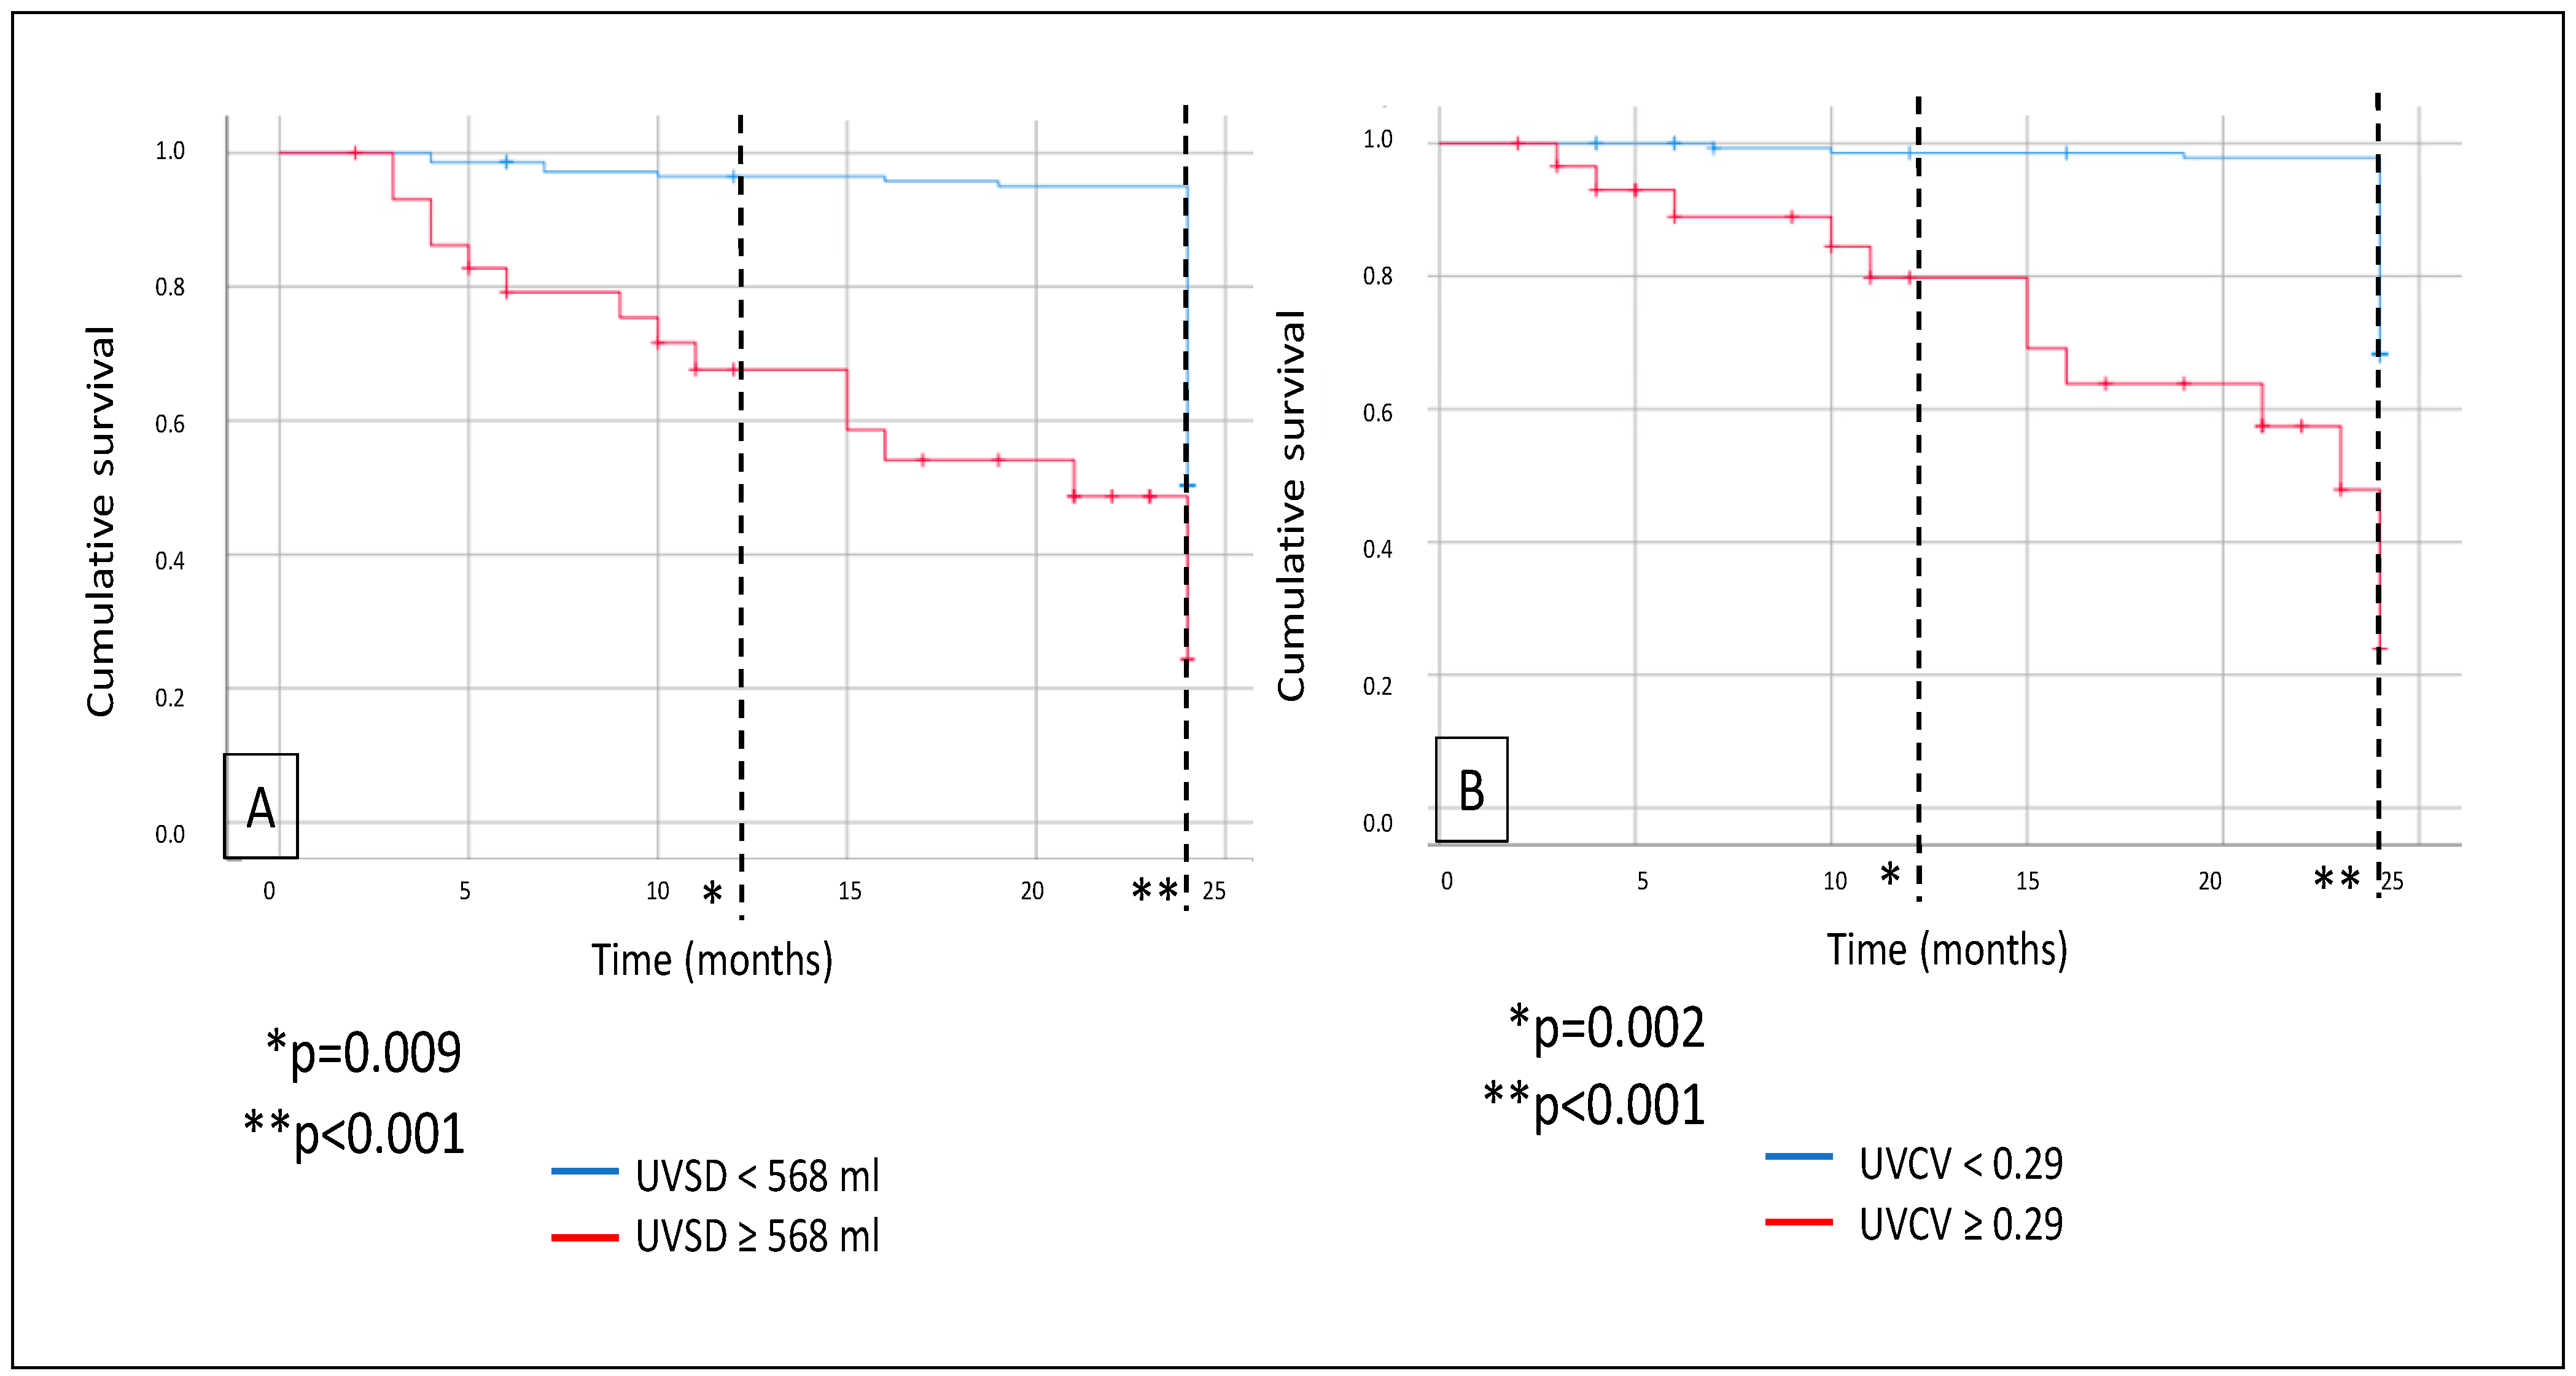
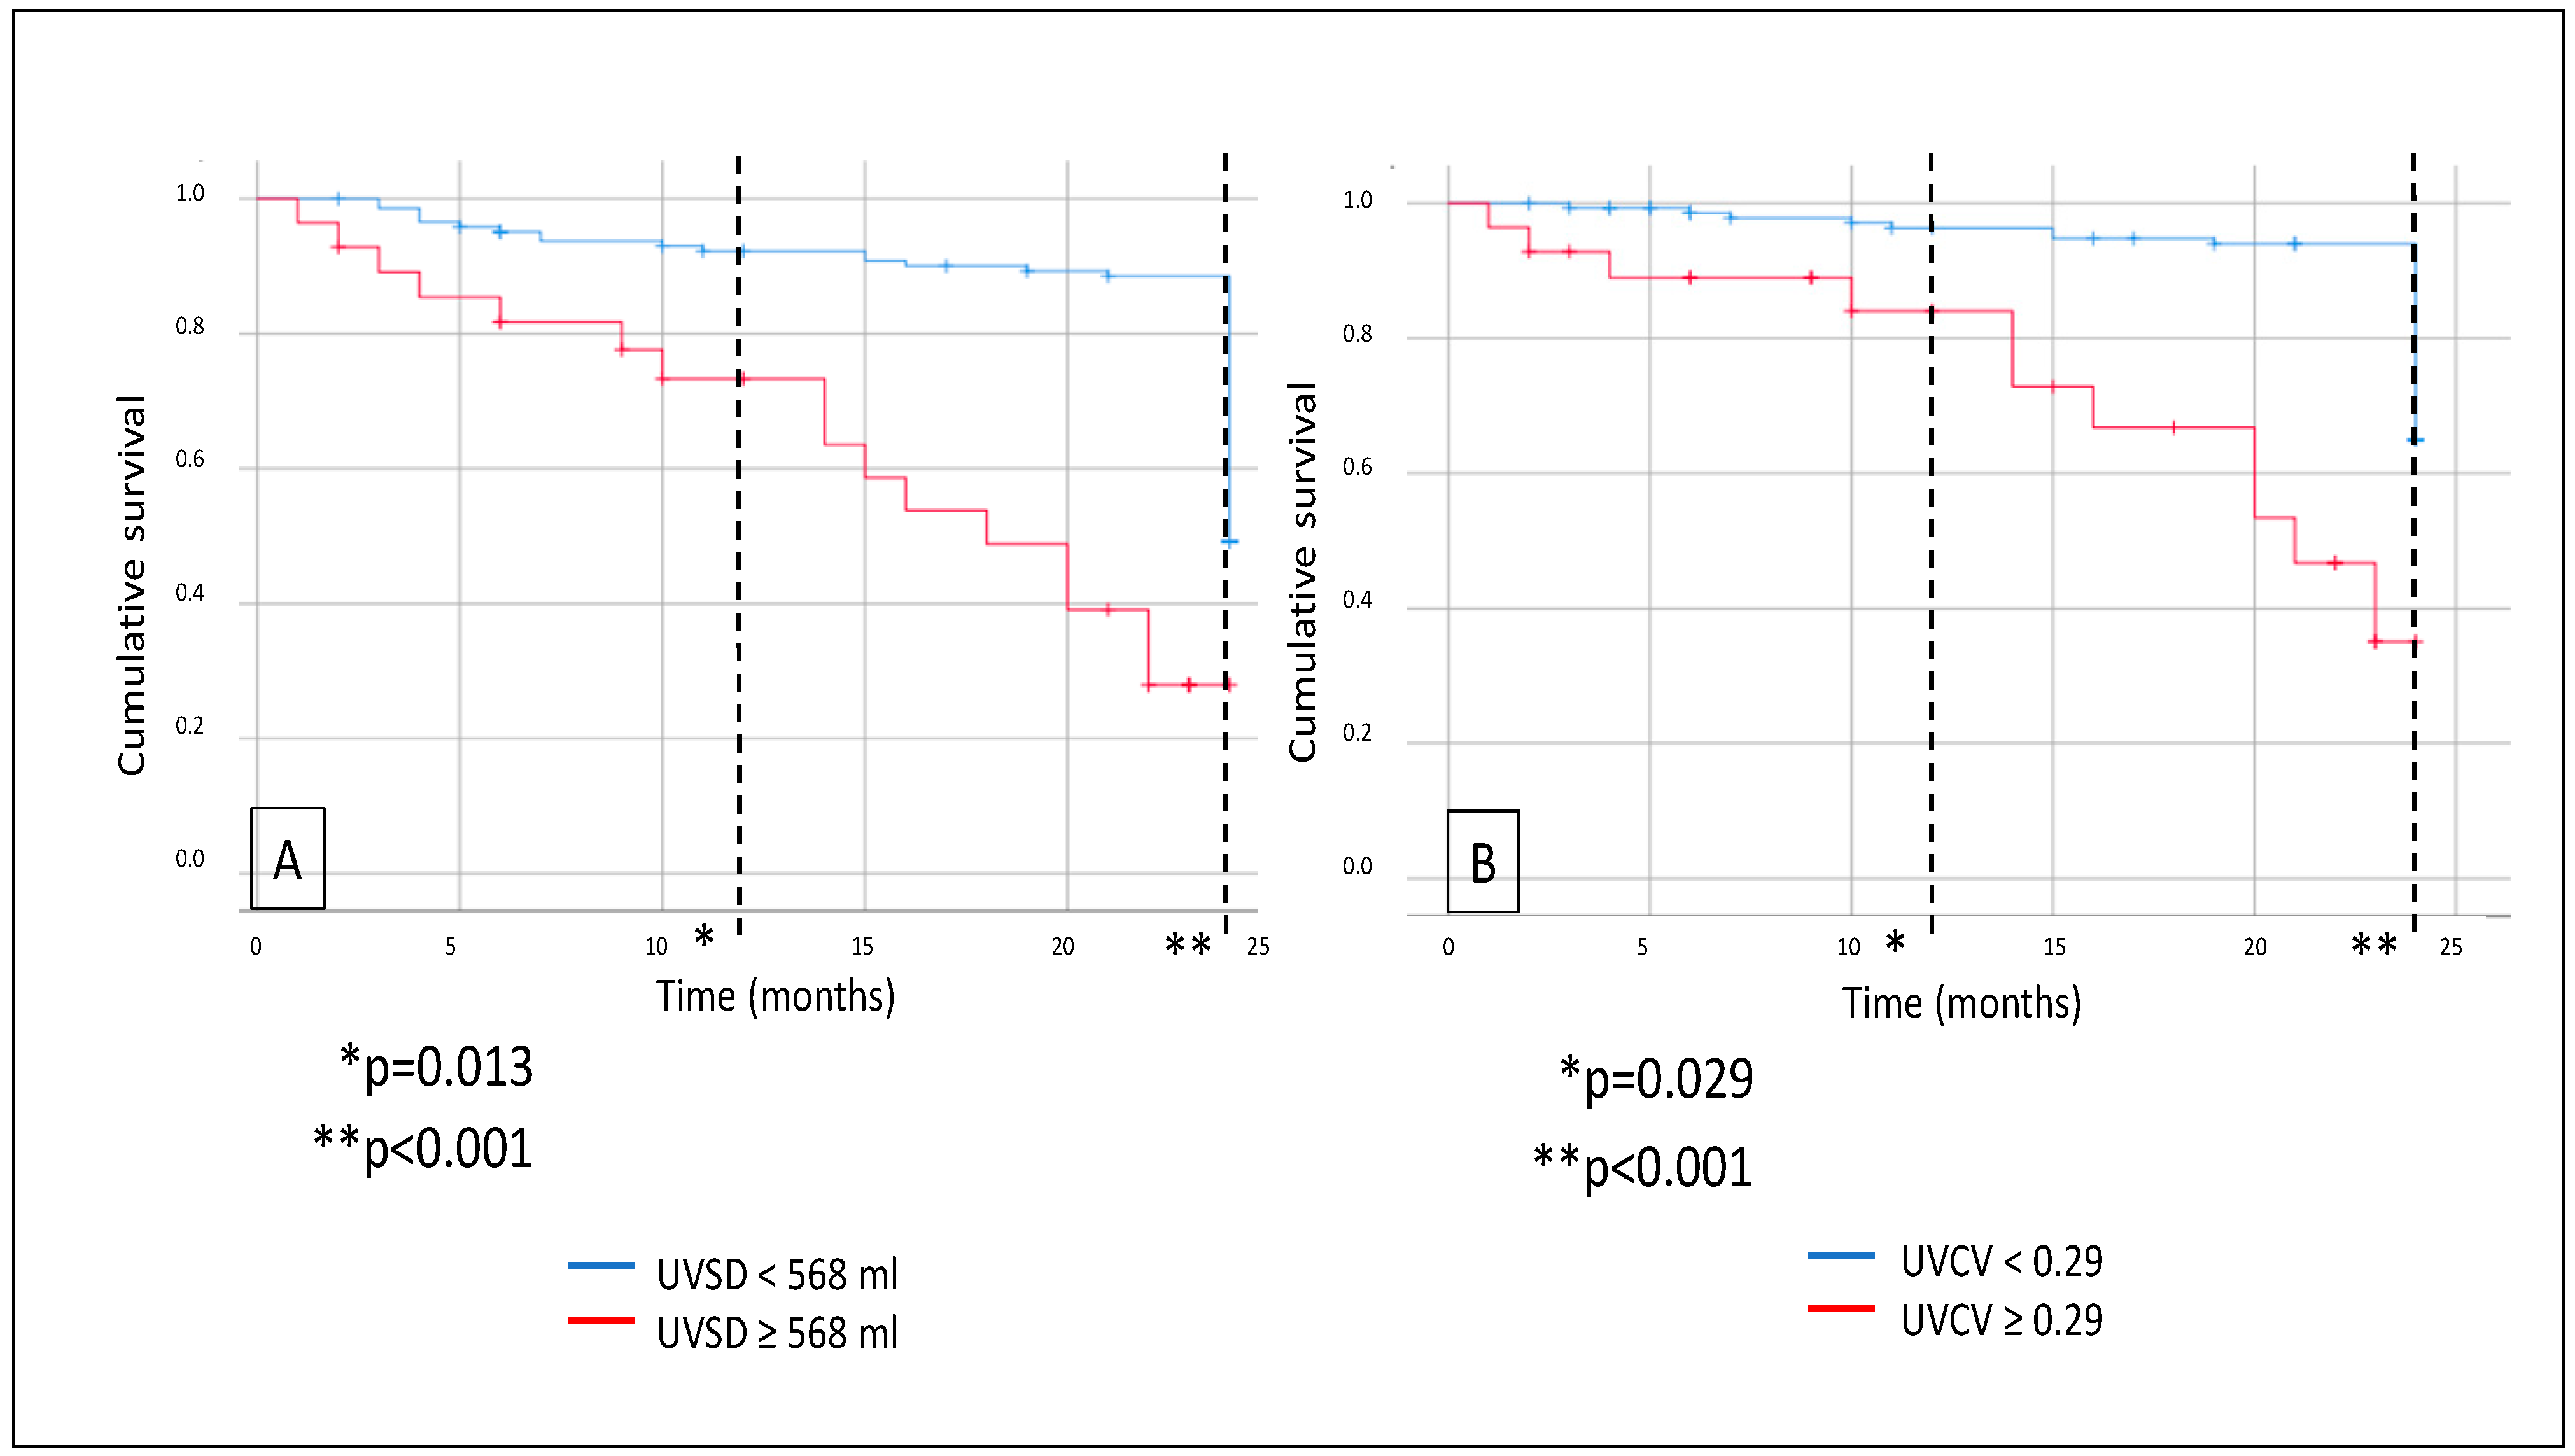
3. Results
4. Discussion
5. Conclusions
Author Contributions
Funding
Institutional Review Board Statement
Informed Consent Statement
Data Availability Statement
Acknowledgments
Conflicts of Interest
References
- Bello, A.K.; Okpechi, I.G.; Osman, M.A.; Cho, Y.; Htay, H.; Jha, V.; Wainstein, M.; Johnson, D.W. Epidemiology of haemodialysis outcomes. Nat. Rev. Nephrol. 2022, 18, 378–395. [Google Scholar] [CrossRef] [PubMed]
- Lai, A.C.; Bienstock, S.W.; Sharma, R.; Skorecki, K.; Beerkens, F.; Samtani, R.; Coyle, A.; Kim, T.; Baber, U.; Camaj, A.; et al. A personalized approach to chronic kidney disease and cardiovascular disease: JACC review topic of the week. J. Am. Coll. Cardiol. 2021, 77, 1470–1479. [Google Scholar] [CrossRef] [PubMed]
- Ma, L.; Zhao, S. Risk factors for mortality in patients undergoing hemodialysis: A systematic review and meta-analysis. Int. J. Cardiol. 2017, 238, 151–158. [Google Scholar] [CrossRef] [PubMed]
- Loutradis, C.; A Sarafidis, P.; Ferro, C.J.; Zoccali, C. Volume overload in hemodialysis: Diagnosis, cardiovascular consequences, and management. Nephrol. Dial. Transplant. 2021, 36, 2182–2193. [Google Scholar] [CrossRef]
- Zoccali, C.; Mallamaci, F. Mapping progress in reducing cardiovascular risk with kidney disease: Managing volume overload. Clin. J. Am. Soc. Nephrol. 2018, 13, 1432–1434. [Google Scholar] [CrossRef]
- Ok, E.; Asci, G.; Chazot, C.; Ozkahya, M.; Mees, E.J.D. Controversies and problems of volume control and hypertension in haemodialysis. Lancet 2016, 388, 285–293. [Google Scholar] [CrossRef]
- Canaud, B.; Chazot, C.; Koomans, J.; Collins, A. Fluid and hemodynamic management in hemodialysis patients: Challenges and opportunities. Braz. J. Nephrol. 2019, 41, 550–559. [Google Scholar] [CrossRef]
- Keane, D.F.; Raimann, J.G.; Zhang, H.; Willetts, J.; Thijssen, S.; Kotanko, P. The time of onset of intradialytic hypotension during a hemodialysis session associated with clinical parameters and mortality. Kidney Int. 2021, 99, 1408–1417. [Google Scholar] [CrossRef]
- Ohashi, Y.; Sakai, K.; Hase, H.; Joki, N. Dry weight targeting: The art and science of conventional hemodialysis. Semin. Dial. 2018, 31, 551–556. [Google Scholar] [CrossRef]
- Kramer, H.; Yee, J.; Weiner, D.E.; Bansal, V.; Choi, M.J.; Brereton, L.; Berns, J.S.; Samaniego-Picota, M.; Scheel, P.; Rocco, M. Ultrafiltration rate thresholds in maintenance hemodialysis: An NKF KDOQI controversies report. Am. J. Kidney Dis. 2016, 68, 522–532. [Google Scholar] [CrossRef]
- Lee, Y.; Okuda, Y.; Sy, J.; Kim, S.R.; Obi, Y.; Kovesdy, C.P.; Rhee, C.M.; Streja, E.; Kalantar-Zadeh, K. Ultrafiltration rate effects declines in residual kidney function in hemodialysis patients. Am. J. Nephrol. 2019, 50, 481–488. [Google Scholar] [CrossRef] [PubMed]
- Sági, B.; Vas, T.; Jakabfi-Csepregi, R.K.; Sulyok, E.; Csiky, B. Association between Visit-to-Visit Ultrafiltration Volume Variability, Vascular Biomarkers and Cardiovascular Parameters in Chronic Hemodialysis Patients. J. Clin. Med. 2024, 13, 5958. [Google Scholar] [CrossRef] [PubMed]
- Zhang, Q.; Wang, N.; Nie, L.; Lu, C.; Chen, H.; He, W.; Li, M.; Wang, Y.; Zhao, J.; Xiong, J. Visit-to-visit ultrafiltration volume variability predicts all-cause mortality in patients receiving hemodialysis. Ren. Fail. 2023, 45, 2194439. [Google Scholar] [CrossRef] [PubMed]
- Loutradis, C.N.; Tsioufis, C.; Sarafidis, P.A. The clinical problems of hypertension treatment in hemodialysis patients. Curr. Vasc. Pharmacol. 2017, 16, 54–60. [Google Scholar] [CrossRef]
- Loutradis, C.; Sarafidis, P.A.; Papadopoulos, C.E.; Papagianni, A.; Zoccali, C. The Ebb and flow of echocardiographic cardiac function parameters in relationship to hemodialysis treatment in patients with ESRD. J. Am. Soc. Nephrol. 2018, 29, 1372–1381. [Google Scholar] [CrossRef]
- Ozdogan, O.; Kayikcioglu, M.; Asci, G.; Ozkahya, M.; Toz, H.; Sezis, M.; Can, L.H.; Ok, E. Left atrial volume predicts mortality in low-risk dialysis population on long-term low-salt diet. Am. Heart J. 2010, 159, 1089–1094. [Google Scholar] [CrossRef]
- Sarafidis, P.A.; Kamperidis, V.; Loutradis, C.; Tsilonis, K.; Mpoutsiouki, F.; Saratzis, A.; Giannakoulas, G.; Sianos, G.; Karvounis, H. Haemodialysis acutely deteriorates left and right diastolic function and myocardial performance: An effect related to high ultrafiltration volumes? Nephrol. Dial. Transplant. 2017, 32, 1402–1409. [Google Scholar] [CrossRef]
- Han, B.-G.; Lee, J.Y.; Kim, M.R.; Shin, H.; Kim, J.-S.; Yang, J.-W.; Kim, J.Y. Fluid overload is a determinant for cardiac structural and functional impairments in type 2 diabetes mellitus and chronic kidney disease stage 5 not undergoing dialysis. PLoS ONE 2020, 15, e0235640. [Google Scholar] [CrossRef]
- Charra, B. Fluid balance, dry weight, and blood pressure in dialysis. Hemodial. Int. 2007, 11, 21–31. [Google Scholar] [CrossRef]
- Hecking, M.; Madero, M.; Port, F.K.; Schneditz, D.; Wabel, P.; Chazot, C. Fluid volume management in hemodialysis: Never give up! Kidney Int. 2023, 103, 2–5. [Google Scholar] [CrossRef]
- Wizemann, V.; Wabel, P.; Chamney, P.; Zaluska, W.; Moissl, U.; Rode, C.; Malecka-Masalska, T.; Marcelli, D. The mortality risk of overhydration in haemodialysis patients. Nephrol. Dial. Transplant. 2009, 24, 1574–1579. [Google Scholar] [CrossRef] [PubMed]
- Mendoza, J.M.; Sun, S.; Chertow, G.M.; Moran, J.; Doss, S.; Schiller, B. Dialysate sodium and sodium gradient in maintenance hemodialysis: A neglected sodium restriction approach? Nephrol. Dial. Transplant. 2011, 26, 1281–1287. [Google Scholar] [CrossRef] [PubMed]
- Zoccali, C.; Torino, C.; Tripepi, R.; Tripepi, G.; D’arrigo, G.; Postorino, M.; Gargani, L.; Sicari, R.; Picano, E.; Mallamaci, F. Pulmonary congestion predicts cardiac events and mortality in ESRD. J. Am. Soc. Nephrol. 2013, 24, 639–646. [Google Scholar] [CrossRef] [PubMed]
- Assimon, M.M.; Wenger, J.B.; Wang, L.; Flythe, J.E. Ultrafiltration rate and mortality in maintenance hemodialysis patients. Am. J. Kidney Dis. 2016, 68, 911–922. [Google Scholar] [CrossRef]
- Kim, T.W.; Chang, T.I.; Kim, T.H.; Chou, J.A.; Soohoo, M.; Ravel, V.A.; Kovesdy, C.P.; Kalantar-Zadeh, K.; Streja, E. Association of ultrafiltration rate with mortality in incident hemodialysis patients. Nephron 2018, 139, 13–22. [Google Scholar] [CrossRef]
- Navarrete, J.E.; Rajabalan, A.; Cobb, J.; Lea, J.P. Proportion of Hemodialysis Treatments with High Ultrafiltration Rate and the Association with Mortality. Kidney360 2022, 3, 1359–1366. [Google Scholar] [CrossRef]
- Hu, L.; Napoletano, A.; Provenzano, M.; Garofalo, C.; Bini, C.; Comai, G.; La Manna, G. Mineral Bone Disorders in Kidney Disease Patients: The Ever-Current Topic. Int. J. Mol. Sci. 2022, 23, 12223. [Google Scholar] [CrossRef]
- Aquino, H.B.S.; Canziani, M.E.F.; Barra, A.B.L.; Roque-da-Silva, A.P.; Strogoff-de-Matos, J.P.; Dalboni, M.A.; Moyses, R.M.A.; Elias, R.M. PTH may predict early mortality in incident patients on hemodialysis: Results from a large cohort. Int. Urol. Nephrol. 2024, 57, 545–551. [Google Scholar] [CrossRef]
- Huang, Y.; Zhong, Q.; Chen, J.; Qin, X.; Yang, Y.; He, Y.; Lin, Z.; Li, Y.; Yang, S.; Lu, Y.; et al. Relationship of serum total cholesterol and triglyceride with risk of mortality in aintenance hemodialysis patients: A multicenter prospective cohort study. Ren. Fail. 2024, 46, 2334912. [Google Scholar] [CrossRef]
- Doğan, İ.; Eser, B.; Özkurt, S.; Yayar, Ö.; Özgür, B.; Kayadibi, H.; Doğan, T.; Muşmul, A.; Soydan, M. Serum ADMA, endothelial dysfunction, and atherosclerosis in hypervolemic hemodialysis patients. Turk. J. Med. Sci. 2018, 48, 1041–1047. [Google Scholar] [CrossRef]
- Amari, Y.; Morimoto, S.; Iida, T.; Yurugi, T.; Oyama, Y.; Aoyama, N.; Nakajima, F.; Shimizu, S.; Ichihara, A. Characteristics of visit-to-visit blood pressure variability in hemodialysis patients. Hypertens. Res. 2019, 42, 1036–1048. [Google Scholar] [CrossRef] [PubMed]
- Huang, J.-T.; Cheng, H.-M.; Yu, W.-C.; Lin, Y.-P.; Sung, S.-H.; Chen, C.-H. Increased nighttime pulse pressure variability but not ambulatory blood pressure levels predicts 14-year all-cause mortality in patients on hemodialysis. Hypertension 2019, 74, 660–668. [Google Scholar] [CrossRef] [PubMed]
- Liao, R.; Li, J.; Lin, L.; Sun, S.; Wang, L.; Xiong, Y.; Li, Y.; Han, M.; Liu, Q.; Su, B. The association between longand intra-dialytic blood pressure variability with all-cause mortality in hemodialysis patients. Blood Purif. 2019, 48, 43–50. [Google Scholar] [CrossRef]
- Hastie, C.E.; Jeemon, P.; Coleman, H.; McCallum, L.; Patel, R.; Dawson, J.; Sloan, W.; Meredith, P.; Jones, G.C.; Muir, S.; et al. Long-term and ultra long-term blood pressure variability during follow-up and mortality in 14,522 patients with hypertension. Hypertension 2013, 62, 698–705. [Google Scholar] [CrossRef]
- Zhao, Y.; Yang, L.; Yu, S.; Salerno, S.; Li, Y.; Cui, T.; Zhang, L.; Fu, P. Blood pressure variability and prognosis in hemodialysis patients: A systematic review and meta-analysis. Kidney Dis. 2021, 7, 411–424. [Google Scholar] [CrossRef]
- Yang, J.; Huang, J.; Yu, B.; Zhang, Q.; Zhang, S.; Wu, L.; Luo, L.; Li, L.; Li, L.; Han, F.; et al. Long-term predialysis blood pressure variability and outcomes in hemodialysis patients. J. Clin. Hypertens. 2022, 24, 148–155. [Google Scholar] [CrossRef]
- Zhou, T.L.; Henry, R.M.A.; Stehouwer, C.D.A.; Van Sloten, T.T.; Reesink, K.D.; Kroon, A.A. Blood Pressure Variability, Arterial Stiffness, and Arterial Remodeling. Hypertension 2018, 72, 1002–1010. [Google Scholar] [CrossRef]
- Zhu, M.; Dou, L.; Zhu, M.; Liu, S.; Zhan, Y.; Lu, J.; Ni, Z.; Qian, J.; Cai, H.; Zhang, W. Variability of serum phosphorus and its association with mortality among hemodialysis patients. Clin. Nephrol. 2018, 90, 79–86. [Google Scholar] [CrossRef]
- Chen, C.; Zhang, J.; Zhou, Z.; Liu, J.; Li, C.; Liu, C. Impact of serum albumin level and variability on short-term cardiovascular related and all-cause mortality in patients on maintenance hemodialysis. Medicine 2021, 100, e27666. [Google Scholar] [CrossRef]
- Lin, F.-J.; Zhang, X.; Huang, L.-S.; Ji, G.; Huang, H.-D.; Xie, Y.; Jiang, G.-R.; Zhou, X.; Lu, W. Impact of hemoglobin variability on cardiovascular mortality in maintenance hemodialysis patients. Int. Urol. Nephrol. 2018, 50, 1703–1712. [Google Scholar] [CrossRef]
- Chang, Y.-M.; Huang, Y.-T.; Chen, I.-L.; Yang, C.-L.; Leu, S.-C.; Su, H.-L.; Kao, J.-L.; Tsai, S.-C.; Jhen, R.-N.; Shiao, C.-C. Heart rate variability as an independent predictor for 8-year mortality among chronic hemodialysis patients. Sci. Rep. 2020, 10, 881. [Google Scholar] [CrossRef] [PubMed]
- Habib, A.N.; Baird, B.C.; Leypoldt, J.K.; Cheung, A.K.; Goldfarb-Rumyantzev, A.S. The association of lipid levels with mortality in patients on chronic peritoneal dialysis. Nephrol. Dial. Transplant. 2006, 21, 2881–2892. [Google Scholar] [CrossRef] [PubMed]
- Matias, P.J.; Azevedo, A.; Laranjinha, I.; Navarro, D.; Mendes, M.; Ferreira, C.; Amaral, T.; Jorge, C.; Aires, I.; Gil, C.; et al. Lower serum magnesium is associated with cardiovascular risk factors and mortality in haemodialysis patients. Blood Purif. 2014, 38, 244–252. [Google Scholar] [CrossRef]
- Moradi, H.; Streja, E.; Kashyap, M.L.; Vaziri, N.D.; Fonarow, G.C.; Kalantar-Zadeh, K. Elevated high density lipoprotein cholesterol and cardiovascular mortality in maintenance hemodialysis patients. Nephrol. Dial. Transplant. 2014, 29, 1554–1562. [Google Scholar] [CrossRef]
- Park, K.S.; Ryu, G.W.; Jhee, J.H.; Kim, H.W.; Park, S.; Lee, A.S.; Kwon, Y.E.; Kim, Y.L.; Ryu, H.J.; Lee, M.J.; et al. Serum ferritin predicts mortality regardless of inflammatory and nutritional status in patients starting dialysis: A prospective cohort study. Blood Purif. 2015, 40, 209–217. [Google Scholar] [CrossRef]
- Han, B.G.; Pak, D.; Kim, J.S.; Sohn, Y. The moderating effect of fluid overload is the relationship between the augmentation index and left ventricular diastolic function in patients with CKD. Sci. Rep. 2024, 14, 480. [Google Scholar] [CrossRef]
- Ogawa, T.; Nitta, K. Clinical impact of left ventricular diastolic dysfunction in chronic kidney disease. Contrib. Nephrol. 2018, 195, 81–91. [Google Scholar] [CrossRef]
- Panuccio, V.; Tripepi, R.; Tripepi, G.; Mallamaci, F.; Benedetto, F.A.; Cataliotti, A.; Bellanuova, I.; Giacone, G.; Malatino, L.S.; Zoccali, C. Heart valve calcifications, survival, and cardiovascular risk in hemodialysis patients. Am. J. Kidney Dis. 2004, 43, 479–484. [Google Scholar] [CrossRef]


| Inclusion Criteria | Exclusion Criteria |
|---|---|
| Age ≥ 18 years | Any unstable condition |
| On regular hemodialysis, three times a week for >3 months | Having less than 3 HD sessions/week |
| With a single-pool Kt/V ≥ 1.2 | Active infection or malignancy |
| Pregnancy or lactating | |
| Known alcohol or drug abuse | |
| Immunosuppressive drug use | |
| Major visual or hearing impairments | |
| Kidney transplantation during the observation period | |
| Having unclear medical history or missing clinical information. |
| Clinical Data | HD Patients (n = 173) | UVSD < 568 mL (n = 89) | UVSD ≥ 568 mL (n = 84) | p | UVCV < 0.29 (n = 95) | UVCV ≥ 0.29 (n = 78) | p/NS |
|---|---|---|---|---|---|---|---|
| Man/woman (n/%) | 91/82 (53/47) | 38/51 (43/57) | 53/31 (63/37) | 0.003 * | 57/38 (60/40) | 33/45 (42/58) | 0.01 * |
| Age (year) | 63 ± 13 | 59 ± 12.5 | 67 ± 12.5 | 0.001 * | 64 ± 13.4 | 62 ± 12.3 | NS |
| Duration of kidney disease (year) | 10.8 ± 9.4 | 11.5 ± 10 | 10 ± 9 | NS | 11.2 ± 10 | 10.4 ± 9 | NS |
| Dialysis vintage (months) | 224 ± 34 | 168 ± 30 | 143 ± 27 | NS | 165 ± 28 | 145 ± 27 | NS |
| EPO usage (n/%) | 108 (62) | 45 (53) | 63 (71) | 0.009 * | 69 (73) | 38 (49) | 0.003 * |
| Metabolic parameters | |||||||
| Hypertension (n, %) | 168 (97) | 82 (98) | 86 (97) | NS | 93 (98) | 75 (96) | NS |
| BMI (kg/m2) | 27.7 ± 4.6 | 26.9 ± 4.5 | 28.5 ± 4.7 | NS | 27.8 ± 5.8 | 27.5 ± 6.3 | NS |
| Dyslipidemia (n, %) | 72 (42) | 36 (43) | 38 (43) | NS | 34 (36) | 38 (49) | NS |
| Diabetes (n, %) | 36 (21) | 17 (20) | 19 (21) | NS | 23 (24) | 13 (17) | NS |
| Ultrafiltration parameters | |||||||
| Ultrafiltration volume (single HD) | 2355.66 ± 718.26 | 2331.58 ± 826.65 | 2381.19 ± 580.7 | NS | 2681.62 ± 626.6 | 1854.64 ± 547.7 | 0.01 |
| Echocardiographic parameters | |||||||
| LVEF (%) | 56.61 ± 8.81 | 57.04 ± 7.78 | 56.19 ± 9.7 | NS | 56.06 ± 8.9 | 57.5 ± 8.5 | NS |
| LVMI (g/m2) | 142.62 ± 39.36 | 137.63 ± 37.43 | 147.8 ± 40.67 | 0.019 * | 133.83 ± 42.5 | 147.44 ± 36.2 | 0.023 * |
| LVM (g) | 253.70 (129.3–418.1) | 259.2 (137.25–427.42) | 253.39 (129.33–420.2) | NS | 248.18 (119.3–395.61) | 266.94 (147.83–556.99) | NS |
| LVEDD (mm) | 51.24 ± 5.8 | 50.96 ± 5.95 | 51.53 ± 5.64 | NS | 49.95 ± 5.99 | 52.08 ± 5.54 | 0.013 * |
| LVESD (mm) | 32 (20–56) | 33 (22–55) | 31 (20–56) | NS | 30 (20–50) | 34 (23–56) | 0.034 * |
| E/A | 0.78 (0.34–2.3) | 0.75 (0.35–2.21) | 0.83 (0.36–2.30) | NS | 0.79 (0.35–2.20) | 0.79 (0.36–1.69) | NS |
| DD (n/%) | 94 (54) | 44 (52) | 50 (56) | NS | 51 (54) | 42 (54) | NS |
| RAV (mL/m2) | 45.3 (10.4–138.7) | 42.6 (10.42–109.54) | 45.2 (18.04–118.13) | NS | 49.92 (14.94–118.14) | 41.6 (10.42–95.76) | 0.001 * |
| LAV (mL/m2) | 54.6 (15.2–115.0) | 53.0 (16.03–155.01) | 55.94 (15.2–125.75) | NS | 50.85 (15.2–112.53) | 54.08 (20.69–115.01) | <0.001 * |
| RVP (mmHg) | 33.44 ± 8.2 | 33.48 ± 7.44 | 33.4 ± 8.91 | NS | 34.04 ± 8.32 | 32.71 ± 8.0 | NS |
| Laboratory results | |||||||
| Hb (g/dL) | 13.6 ± 1.53 | 13.6 ± 1.54 | 13.7 ± 1.56 | NS | 10.84 ± 1.04 | 11.26 ± 1.38 | 0.012 * |
| TP (g/L) | 64.36 ± 4.97 | 63.25 ± 4.76 | 65.54 ± 4.91 | NS | 63.93 ± 4.65 | 65.03 ± 5.39 | NS |
| Albumin (g/L) | 39.3 (15.4–45.3) | 40.1 (31.8–44.8) | 39.7 (15.4–45.3) | NS | 40.3 (33.3–44.4) | 39.3 (15.5–45.3) | NS |
| Ca (mmol/L) | 2.22 ± 0.18 | 2.21 ± 0.16 | 2.42 ± 0.19 | NS | 2.22 ± 0.18 | 2.24 ± 0.17 | NS |
| P (mmol/L) | 1.68 (0.34–3.1) | 1.56 (0.77–2.40) | 1.87 (0.95–3.50) | <0.001 * | 1.69 (0.77–3.23) | 1.75 (0.92–2.4) | NS |
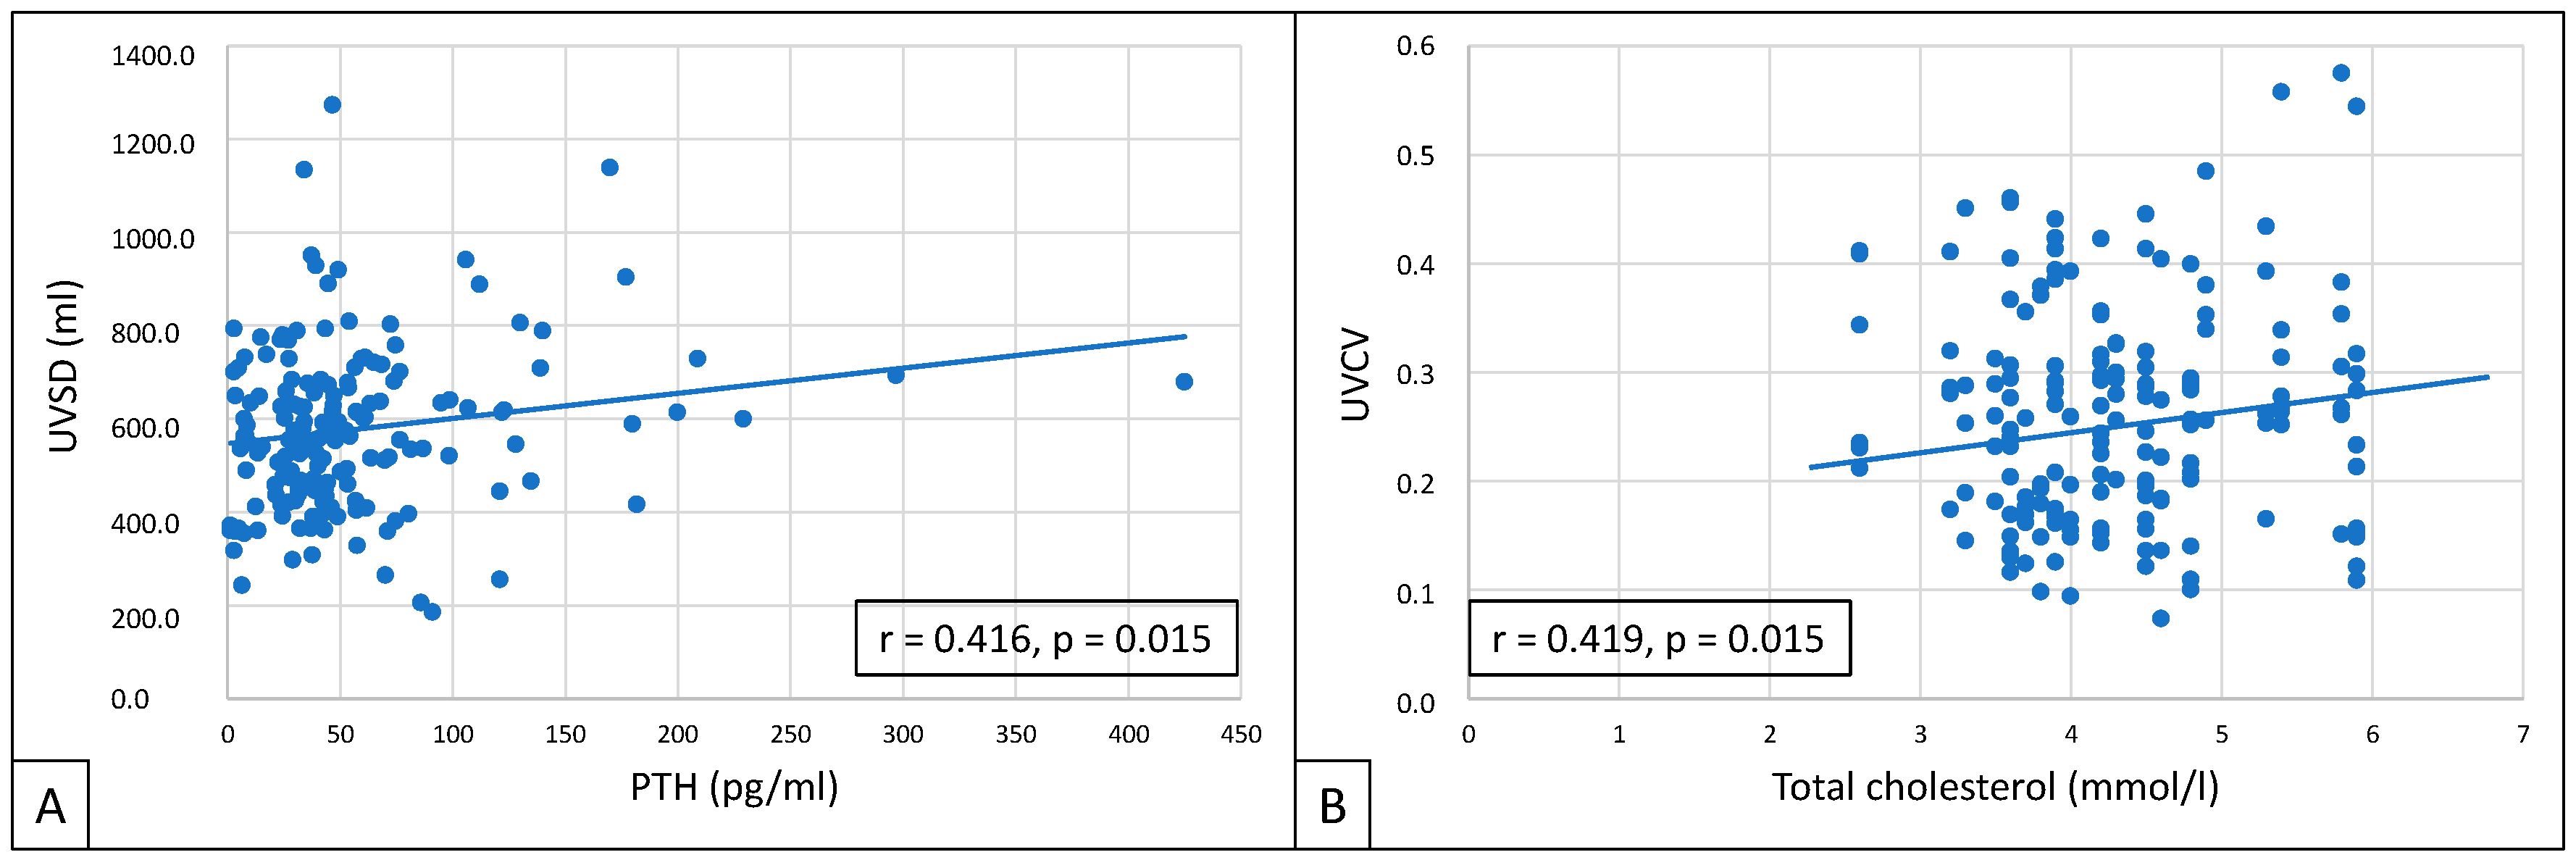
| PTH (pg/mL) | 42.6 (1.4–297) | 37 (1.40–182) | 46.9 (3.09–297) | 0.027 * | 46.1 (1.4–229) | 39.5 (3.09–297) | NS |
| CRP (mg/L) | 4.6 (3.3–16.68) | 3.5 (0.30–16.10) | 5.8 (0.30–52.10) | 0.033 * | 4.1 (0.40–16.10) | 5.10 (0.30–42.60) | NS |
| Creatinine (umol/L) | 856.98 ± 184.3 | 832.22 ± 165.8 | 976.12 ± 205.04 | NS | 849.1 ± 187.6 | 897.3 ± 199.34 | NS |
| Cardiovascular disease in the history | |||||||
| Total | 42 (24) | 20 (24) | 22 (25) | NS | 18 (19) | 24 (31) | NS |
| Myocardial infarction (n, %) | 10 (6) | 4 (5) | 6 (7) | NS | 5 (5) | 5 (6) | NS |
| Stroke (n, %) | 8 (5) | 3 (4) | 5 (6) | NS | 3 (3) | 5 (6) | NS |
| Peripheral artery disease (n, %) | 12 (7) | 4 (5) | 8 (9) | NS | 5 (5) | 7 (9) | NS |
| Revascularization (n, %) | 12 (7) | 4 (5) | 8 (9) | NS | 5 (5) | 7 (9) | NS |
| Kidney disease | |||||||
| Hypertensive nephropathy (n, %) | 82 (47) | 45 (53) | 35 (39) | 0.043 * | 48 (50) | 34 (43) | NS |
| Diabetic nephropathy (n, %) | 34 (20) | 15 (18) | 19 (21) | NS | 19 (20) | 15 (19) | NS |
| Glomerulonephritis (n, %) | 19 (11) | 4 (5) | 13 (14) | 0.040 * | 14 (15) | 5 (6) | 0.045 * |
| ADPKD (n, %) | 20 (11) | 9 (11) | 8 (9) | NS | 10 (10) | 10 (13) | NS |
| Other (n, %) | 18 10) | 11 (13) | 14 (16) | NS | 16 (17) | 2 (2) | 0.01 * |
| Total HD Patients (n = 173) | UVSD High (≥568 mL) (n = 84) | UVSD Low (<568 mL) (n = 89) | UVCV High (≥0.29) (n = 78) | UVSD Low (<0.29) (n = 95) | |
|---|---|---|---|---|---|
| After 12 months of follow-up | |||||
| All-cause mortality events (n/%) | 15 (9) | 11 (13) | 4 (4) | 9 (11) | 6 (6) |
| CV mortality events (n/%) | 7 (4) | 4 (5) | 3 (3) | 4 (5) | 3 (3) |
| MACE (n/%) | 14 (8) | 10 (12) | 4 (4) | 9 (11) | 5 (5) |
| After 24 months of follow-up | |||||
| All-cause mortality events (n/%) | 30 (17) | 21 (25) | 9 (10) | 18 (23) | 12 (12.6) |
| CV mortality events (n/%) | 17 (9.8) | 10 (12) | 7 (7.8) | 10 (13) | 7 (7) |
| MACE (n/%) | 28 (16) | 20 (24) | 8 (9) | 15 (17) | 13 (13.6) |
| UVSD | UVCV | |||||||
|---|---|---|---|---|---|---|---|---|
| B | Std. Errors | Confidence Interval 95% | p | B | Std. Errors | Confidence Interval 95% | p | |
| Age | 1.295 | 0.104 | 1.090–1.490 | * 0.019 | 0.251 | 0.013 | 0.219–1.283 | 0.287 |
| Gender | 1.361 | 0.146 | 1.193–1.639 | * 0.046 | 1.153 | 0.024 | 1.283–1.584 | * 0.024 |
| BMI | 1.288 | 0.017 | 1.094–1.483 | * 0.045 | 0.527 | 0.436 | 0.106–1.948 | 0.544 |
| HT | 0.332 | 0.076 | 0.025–2.740 | 0.066 | 7.469 | 1.407 | 3.366–10.738 | * 0.001 |
| LVMI | 0.871 | 0.191 | 0.816–1.075 | 0.155 | 1.602 | 0.225 | 1.218–1.782 | * 0.003 |
| LVEDD | 0.473 | 0.354 | 0.131–1.809 | 0.253 | 1.211 | 0.079 | 1.182–1.318 | * 0.028 |
| E/A | 0.860 | 0.176 | 0.678–1.959 | 0.057 | 0.374 | 0.166 | 0.204–1.482 | 0.420 |
| CRP | 0.732 | 0.145 | 0.486–1.949 | 0.703 | 0.498 | 0.198 | 0.257–1.526 | 0.471 |
| P | 1.691 | 0.117 | 1.192–1.837 | * 0.011 | 0.050 | 0.011 | 0.031–1.071 | 0.733 |
| Albumin | 0.258 | 0.192 | 0.205–1.991 | 0.822 | 1.126 | 0.102 | 1.102–2.331 | * 0.005 |
| PTH | 1.698 | 0.258 | 1.389–1.890 | * 0.004 | 0.030 | 0.027 | 0.024–0.084 | 0.279 |
| All-Cause Mortality (r = 0.390, r2 = 0.153) | Exp (B) (OR) | 95% CI for Exp (B) Lower–Upper | p |
|---|---|---|---|
| UVSD | 1.108 | 1.001–1.191 | * 0.046 |
| UVCV | 1.394 | 1.278–1.568 | * 0.042 |
| Gender | 0.074 | 0.047–1.115 | 0.675 |
| HT | 0.146 | 0.033–2.292 | 0.344 |
| DM | 0.076 | 0.067–3.231 | 0.201 |
| BMI | 0.007 | 0.004–1.017 | 0.466 |
| RVP | 0.547 | 0.137–1.812 | 0.061 |
| E/A | 0.051 | 0.037–1.094 | 0.760 |
| Hb | 0.033 | 0.010–1.051 | 0.598 |
| CRP | 0.002 | 0.001–1.008 | 0.320 |
| Albumin | 0.007 | 0.005–1.011 | 0.254 |
| PTH | 0.002 | 0.001–1.781 | 0.740 |
| MACE (r = 0.473, r2 = 0.224) | Exp (B) | 95% CI for Exp (B) Lower-Upper | p |
| UVSD | 0.747 | 0.269–1.867 | 0.083 |
| UVCV | 2.160 | 1.340–2.256 | * 0.033 |
| Gender | 0.011 | 0.065–1.130 | 0.478 |
| HT | 0.214 | 0.005–1.439 | 0.289 |
| DM | 1.277 | 1.060–2.494 | * 0.001 |
| BMI | 0.011 | 0.006–1.013 | 0.641 |
| RVP | 0.687 | 0.183–1.220 | 0.095 |
| E/A | 0.092 | 0.022–1.147 | 0.591 |
| Hb | 0.059 | 0.030–1.198 | 0.122 |
| CRP | 1.220 | 1.145–1.254 | * 0.011 |
| Albumin | 0.013 | 0.003–1.144 | 0.196 |
| PTH | 1.005 | 1.003–1.255 | * 0.003 |
Disclaimer/Publisher’s Note: The statements, opinions and data contained in all publications are solely those of the individual author(s) and contributor(s) and not of MDPI and/or the editor(s). MDPI and/or the editor(s) disclaim responsibility for any injury to people or property resulting from any ideas, methods, instructions or products referred to in the content. |
© 2025 by the authors. Licensee MDPI, Basel, Switzerland. This article is an open access article distributed under the terms and conditions of the Creative Commons Attribution (CC BY) license (https://creativecommons.org/licenses/by/4.0/).
Share and Cite
Sági, B.; Vas, T.; Fejes, É.; Csiky, B. Prognostic Significance of Visit-to-Visit Ultrafiltration Volume Variability in Hemodialysis Patients. Biomedicines 2025, 13, 717. https://doi.org/10.3390/biomedicines13030717
Sági B, Vas T, Fejes É, Csiky B. Prognostic Significance of Visit-to-Visit Ultrafiltration Volume Variability in Hemodialysis Patients. Biomedicines. 2025; 13(3):717. https://doi.org/10.3390/biomedicines13030717
Chicago/Turabian StyleSági, Balázs, Tibor Vas, Éva Fejes, and Botond Csiky. 2025. "Prognostic Significance of Visit-to-Visit Ultrafiltration Volume Variability in Hemodialysis Patients" Biomedicines 13, no. 3: 717. https://doi.org/10.3390/biomedicines13030717
APA StyleSági, B., Vas, T., Fejes, É., & Csiky, B. (2025). Prognostic Significance of Visit-to-Visit Ultrafiltration Volume Variability in Hemodialysis Patients. Biomedicines, 13(3), 717. https://doi.org/10.3390/biomedicines13030717