Abstract
Background/Objectives: Benign prostatic hyperplasia (BPH) is a common condition in older men and represents a major contributor to lower urinary tract symptoms, prostate enlargement, and features of metabolic syndrome (MetS). Androgen receptor (AR) signaling and extracellular matrix (ECM) remodeling play central roles in BPH pathology, yet the clinical relevance of AR coactivators and structural genes remains incompletely understood. Methods: Prostate tissues from 76 BPH patients and five non-hyperplastic controls were analyzed by quantitative PCR to assess AR coactivators (SRC-1, SRC-2, SRC-3, PCAF, p300) and ECM-related genes (COL1A1, COL3A1). Results: BPH tissues showed marked overexpression of AR coactivators and collagen genes compared to controls (fold changes ≥ 7.8). Higher prostate-specific antigen (PSA) levels (≥10 ng/mL) and enlarged prostate volumes (≥100 mL) were associated with increased expression of PCAF, p300, SRC-1, and COL1A1. PSA and prostate volume correlated positively with triglycerides and VLDL, and inversely with HDL. Strong associations between collagen genes and p160 coactivators suggest coordinated androgenic and stromal remodeling activity. COL1A1 expression was reduced in patients under pharmacological treatment, particularly with alpha-blockers or combination therapies. PCAF and p300 were elevated in patients with MetS, hyperlipidemia, or hyperglycemia. Conclusions: These findings define a molecular signature in BPH linking androgenic, metabolic, and stromal pathology. SRC-1, PCAF, p300, and COL1A1 emerge as potential biomarkers and therapeutic targets, providing new insights into the molecular mechanisms of BPH progression.
1. Introduction
Benign prostatic hyperplasia (BPH) is a common condition of the male lower urinary tract, and its clinical impact is expected to increase due to the global rise in life expectancy [1]. Although androgens, particularly dihydrotestosterone (DHT), play a central role in BPH pathophysiology, the molecular mechanisms underlying disease progression remain poorly understood [2]. Current treatments, whether surgical or pharmacological, are often associated with significant side effects, such as sexual dysfunction and perioperative morbidity [3,4,5], highlighting the need for less invasive and more targeted therapeutic strategies.
In this context, understanding the molecular and metabolic pathways involved in BPH has become essential. The Androgen receptor (AR) is a key mediator of the DHT response, and its inhibition has been associated with symptom improvement in BPH [6]. However, for full transcriptional activity, AR depends on nuclear coactivators, including the p160 family members, SRC-1, SRC-2, and SRC-3, as well as acetyltransferase coregulators such as p300 and PCAF [7,8]. These factors are linked to several essential biological processes, such as proliferation, differentiation, and hormone-mediated signaling, and their imbalance has been associated with prostate cancer [8].
Previous studies have also shown that lipid metabolism, particularly cholesterol, the primary substrate for DHT synthesis, can modulate the activity of these coactivators [9]. The presence of metabolic syndrome (MetS) and elevated cholesterol levels has been associated with worsened BPH symptoms [10,11,12], suggesting a potential crosstalk between metabolic processes and androgen signaling. Preliminary findings from our group indicate that cholesterol can enhance AR expression by modulating p160 coactivators, supporting the hypothesis of an interface between metabolic and epigenetic factors in BPH pathophysiology [13].
Moreover, posttranslational modifications, such as AR acetylation mediated by p300 and PCAF, have been associated with enhanced receptor transcriptional activity and increased prostate cell proliferation [9,14,15]. Although these mechanisms are better characterized in prostate cancer, their role in BPH remains largely unexplored. In parallel, genes involved in extracellular matrix remodeling and stromal fibrosis, such as COL1A1 and COL1A3, which may be regulated via the TGF-β1 pathway, may contribute to hyperplasia development [16].
Therefore, this study aims to investigate the expression of the p160, p300, and PCAF coactivators in patients with BPH and to examine their possible associations with clinical and metabolic indicators. The integrated study of hormonal, metabolic, and epigenetic parameters may provide new insights into the pathogenesis of BPH and identify possible biomarkers and new therapeutic targets.
2. Methods
2.1. Patients
Tissue samples were collected from patients with BPH who underwent surgical treatment between 2010 and 2013, with a median follow-up time of 43.75 months (Table 1 and Table S1). Procedures were performed at the Urology Department of the Hospital das Clinicas of the University of São Paulo Medical School (HCFMUSP). Surgical specimens were used for molecular analyses, and those with prostate cancer were excluded. Control tissues were collected from the healthy peripheral zone (PZ) of five patients who underwent screening of transrectal prostate biopsies. A pathologist confirmed that all samples were free from glandular hyperplasia or carcinoma. The choice of these biopsies is based on the fact that BPH typically affects the central and transitional zones of the prostate. Therefore, these control tissues were used for comparison with the BPH samples.

Table 1.
Demographic characteristics.
Clinical data were retrieved from medical records. The following variables were included: age, preoperative PSA levels (ng/mL), prostatic volume (mL), prior pharmacologic treatment for BPH, type and classification of the previous pharmacologic treatment, type of surgery performed, presence of comorbidities, and laboratory biochemical parameters. The laboratory assessments included serum levels of glucose (mg/dL), total cholesterol (mg/dL), HDL (mg/dL), triglycerides (TGL, mg/dL), VLDL (mg/dL), and LDL (mg/dL). The PSA cutoff was set at 10 ng/mL, a value commonly used in prostate cancer screening. Prostatic volume was based on the last ultrasound performed before BPH surgery, with a cutoff of 100 mL, as reported in previous studies [17]. Patients were allocated to subgroups based on their clinical-pathological data for subsequent analyses. To classify patients with MetS, we used the criteria defined by the Adult Treatment Panel III of the U.S. National Cholesterol Education Program (NCEP-ATPIII) [13], including dyslipidemia, use of antihypertensive medication, and a clinical diagnosis of systemic arterial hypertension (SAH). The latter criterion was adopted due to the lack of complete blood pressure data in electronic medical records.
2.2. Extraction of RNA and Quantitative Real-Time Polymerase Chain Reaction
To extract RNA, we used the SV Total RNA isolation System (Promega, Madison, WI, USA) according to the manufacturer’s instructions. RNA integrity was assessed by agarose gel (0.8%) electrophoresis in three randomly selected samples to check the 28S and 18S bands (Figure S1). Complementary DNA (cDNA) from the total RNA was generated using a High-Capacity cDNA Reverse Transcription Kit (Applied Biosystems, Foster City, CA, USA). The target sequence was amplified in a 10 µL reaction mixture containing 5 µL of HOT FIREPol Probe Universal qPCR Mix (Solis BioDyne, Tartu, Estonia), 0.5 µL of TaqMan (Table S2), and 3.5 µL of nuclease-free water. B2M was used as an endogenous control for gene expression analysis of clinical specimens. Data were analyzed using DataAssist software V3.01 (Applied Biosystems, USA) [8].
2.3. Statistical Analysis
For descriptive analysis, we used the mean with standard deviation (SD) for continuous variables and percentages (%) for categorical variables. Graphs and statistical analysis were performed using GraphPad Prism 10.6.1 for Windows, with a significance level of p ≤ 0.05. To compare gene expression levels based on disease status and patient clinical characteristics, we used the Mann–Whitney test, Student’s t-test, analysis of variance (ANOVA), or the Kruskal–Wallis test. The Shapiro–Wilk test was used to assess the normality of the samples. Spearman’s test was used to analyze correlations between the expression levels of collagen genes and RA co-regulatory genes, and Fisher’s exact test was used to analyze contingency tables of the study cohort’s clinical characteristics.
3. Results
3.1. BPH Genetic Profile
After statistical analysis, all genes except p300 (Figure S2) were significantly associated with the BPH group. Compared with the healthy peripheral zones, they showed superexpression in the BPH samples (p < 0.005). The mean concentration levels were at least 7.8-fold higher (Figure 1A–F).

Figure 1.
Expression profile of BPH samples. (A) Expression of SRC-1 in the PZ and BPH groups, t-test. (B) Expression of SRC-2 in the PZ and BPH groups. (C) Expression of SRC-3 in the PZ and BPH groups. (D) Expression of COL1A1 in the PZ and BPH groups. (E) Expression of COL3A1 in the PZ and BPH groups. (F) Expression of PCAF in the PZ and BPH groups. PZ, peripheral zone; BPH, benign prostatic hyperplasia. The Mann–Whitney test was applied for all comparisons. The p-values obtained from the statistical analyses are shown above the bars in each panel. The error bar corresponds to the standard deviation of the samples. The circles and squares in different colors represent individual patients. The color coding was used solely to distinguish the two comparison groups (PZ and BPH) in each panel.
3.2. PSA Levels and Their Association with Gene Expression and Metabolic Parameters
Regarding PSA levels, the acetyltransferases PCAF and p300 were upregulated in patients with PSA ≥ 10 ng/mL, with mean expression levels 3.7 times higher than in patients with PSA < 10 ng/mL (p < 0.05; Figure 2A,B). Similarly, COL1A1 and COL3A1 were 3.9- and 1.9-fold higher, respectively, in patients with elevated PSA (p < 0.05; Figure 2C,D). No significant associations were observed between PSA and the p160 coactivator family genes.
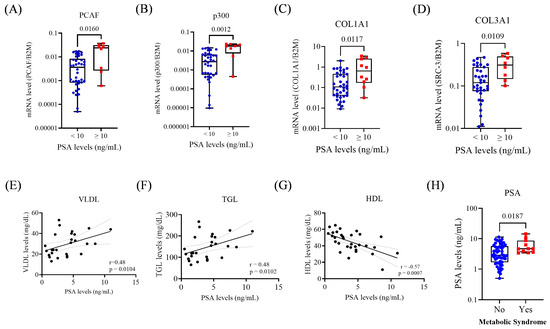
Figure 2.
Gene expression and metabolic parameters according to PSA < 10 and ≥10 ng/mL. (A) Expression of PCAF in the PSA groups. (B) Expression of p300 in the PSA groups. (C) Expression of COL1A1 in the PSA groups. (D) Expression of COL3A1 in the PSA groups. (E) Correlation between serum VLDL and PSA levels. (F) Correlation between serum TGL and PSA levels. (G) Correlation between serum HDL and PSA levels. (H) PSA levels and MetS status. For group comparisons in the remaining panels, statistical significance was assessed using the Mann–Whitney test. A simple linear regression analysis was performed to evaluate the association between metabolic parameters and PSA levels. The p-values obtained from the statistical analyses are shown above the bars in each panel. The error bar corresponds to the standard deviation of the samples.
Concerning metabolic markers, PSA levels showed significant positive correlations with VLDL (r = 0.48; p = 0.01) and TGL (r = 0.48; p = 0.01), and a negative correlation with HDL (r = −0.57; p < 0.0007). Additionally, patients with MetS exhibited higher PSA levels (p = 0.018; Figure 2E–H).
3.3. Prostate Volume: Associations with Gene Expression and Lipid Metabolism
Among the p160 family, only SRC-1 was overexpressed in prostates ≥ 100 mL (1.6-fold increase; p < 0.05; Figure 3A). PCAF and p300 were also significantly upregulated (5-fold and 2.5-fold, respectively; p < 0.05; Figure 3B,C). COL1A1 showed statistically significant upregulation in the ≥100 mL group, while COL3A1 showed a non-significant trend (p = 0.049; p = 0.064; Figure 3D,E).
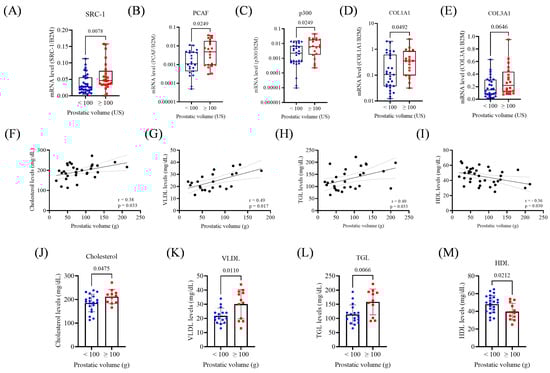
Figure 3.
Gene expression and metabolic parameters according to prostatic volume (<100 or ≥100 mL). (A) Expression of SRC-1 in the prostate volume groups. (B) Expression of PCAF in the prostatic volume groups. (C) Expression of p300 in the prostatic volume groups (D). Expression of COL1A1 in the prostatic volume groups. (E) Expression of COL3A1 in prostatic volume groups. (F) Correlation between cholesterol levels and prostatic volume. (G) Correlation between VLDL levels and prostatic volume. (H) Correlation between TGL levels and prostatic volume. (I) Correlation between HDL levels and prostatic volume. (J) Cholesterol levels in prostatic volume groups. (K) VLDL levels in prostatic volume groups. (L) TGL levels in prostatic volume groups. (M) HDL levels in prostatic volume groups. US, ultrasound; g, gram. The Mann–Whitney test and unpaired t-test were applied depending on data distribution. A simple linear regression analysis was conducted to evaluate the association between metabolic parameters and prostatic volume. The p-values obtained from the statistical analyses are shown above the bars in each panel. The error bars represent the standard deviation of the samples.
Prostate volume positively correlated with total cholesterol (r = 0.38; p = 0.033), VLDL (r = 0.49; p = 0.017), and TGL (r = 0.40; p = 0.033), and negatively with HDL (r = −0.36; p = 0.030; Figure 3F–I). No correlation was found with glucose levels. Patients with prostate volumes ≥100 mL had higher serum levels of total cholesterol (p = 0.0475), VLDL (p = 0.0110), and TGL (p = 0.0066), and lower HDL (p = 0.02, Figure 3J–M).
3.4. Correlation Between Collagen and AR Coregulators-Positive Association with the p160 Family
After the Spearman analysis, COL1A1 correlated with SRC-1 (r = 0.436 [95% CI 0.221–0.611]; p < 0.0005), SRC-2 (r = 0.437 [95% CI 0.217–0.615]; p < 0.0005), and SRC-3 (r = 0.501 [95% CI 0.300–0.659]; p < 0.0005). A significant correlation was also established between COL3A1 and SRC-1 (r = 0.553 [95% CI 0.367–0.696]; p < 0.0005), SRC-2 (r = 0.495 [95% CI 0.291–0.656]; p < 0.0005), and SRC-3 (r = 0.570 [95% CI 0.390–0.708]; p < 0.0005) (Table 2). Both collagen genes showed no significant associations with p300 or PCAF.
Table 2.
Correlation analysis between collagen genes and nuclear receptor coactivators.
3.5. Gene Expression and Its Association with BPH Treatment and Metabolic Status
Patients receiving pharmacologic BPH treatment exhibited 4.8 times lower COL1A1 expression compared to those untreated (p = 0.007; Figure 4A). When stratified by treatment type, patients without treatment expressed COL1A1 at levels 4.7-fold and 8.2-fold higher than those treated with alpha-1 blockers (p = 0.018) or alpha-1 blockers plus PDE5 inhibitors (p = 0.012; Figure 4B). No significant associations were observed with COL3A1 or coactivators. Patients with MetS showed significantly higher expression of PCAF (p = 0.004) and p300 (p = 0.0356; Figure 4C,D), but no significant differences for SRC-1, SRC-2, or SRC-3.
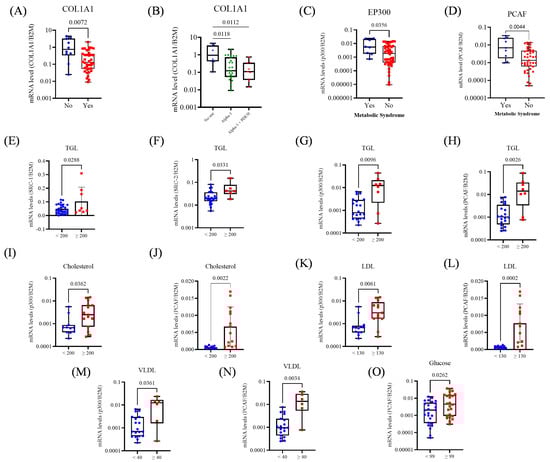
Figure 4.
Expression of collagen genes and transcriptional coactivators in prostate tissue from BPH patients, according to pharmacologic treatment and metabolic alterations. (A) Comparison of COL1A1 expression between untreated patients and those receiving pharmacologic treatment for BPH. (B) COL1A1 expression according to treatment type: no therapy, alpha-1 blockers, alpha-1 blockers combined with PDE5 inhibitors. (C) Expression of PCAF and MetS status. (D) Expression of p300 and MetS status. (E) Expression of SRC-1 and TGL levels. (F) Expression of SRC-2 and TGL levels. (G) Expression of p300 and TGL levels. (H) Expression of PCAF and TGL levels. (I) Expression of p300 and Cholesterol levels. (J) Expression of PCAF and Cholesterol levels. (K) Expression of p300 and VLDL levels. (L) Expression of PCAF and LDL levels. (M) Expression of p300 and VLDL levels. (N) Expression of PCAF and VLDL levels. (O) Expression of PCAF and Glucose levels. The Mann–Whitney test, unpaired t-test, and Kruskal–Wallis (Dunn’s test correction) were applied depending on data distribution. The p-values obtained from the statistical analyses are shown above the bars in each panel. The error bar corresponds to the standard deviation of the samples.
Regarding metabolic parameters, elevated TGL levels (≥200) were associated with higher expression of SRC-1 (p = 0.028), SRC-2 (p = 0.033), p300 (p = 0.009), and PCAF (p = 0.002; Figure 4E–H). Total cholesterol ≥ 200 was also associated with increased expression of p300 (p = 0.03) and PCAF (p = 0.002; Figure 4I,J). Patients with LDL ≥ 130 showed upregulation of p300 (p = 0.006) and PCAF (p = 0.002; Figure 4K,L), and VLDL ≥ 40 was similarly associated with elevated p300 (p = 0.036) and PCAF (p = 0.003; Figure 4M,N). Hyperglycemia (glucose ≥ 99) was linked to increased PCAF expression (p = 0.026; Figure 4O).
4. Discussion
It is well known that age is the leading risk factor for the incidence of BPH and LUTS. Therefore, with the aging population, the prevalence of elderly BPH patients requiring treatment is rising. Consequently, most will start with pharmacologic therapy, and a significant proportion will eventually require surgical management [2,3,18,19]. However, these individuals of advanced age are more likely to have comorbidities, which have been proven to increase perioperative morbidity and mortality [20]. In addition to age itself, several commonly observed metabolic and endocrine disorders, such as insulin resistance, central obesity, changes in sex hormone levels, and low-grade chronic inflammation, have been increasingly recognized as factors contributing to the pathophysiology of BPH [21].
These interconnected processes may be related to prostatic enlargement and symptom severity. In this context, developing less invasive treatments remains relevant, and BPH genetic profiling may help identify future therapeutic avenues. In our cohort, we observed increased expression of selected genes in BPH samples and identified associations with clinical parameters, including prostate volume and PSA. Furthermore, preliminary correlations between metabolic indicators (dyslipidemia, hyperglycemia, components of MetS) and genes involved in androgen signaling and extracellular matrix remodeling suggest a potential interaction between systemic metabolic status and prostatic molecular features.
Patients with prostate volume ≥ 100 mL showed higher total cholesterol and VLDL and lower HDL. These findings are compatible with previous hypotheses linking metabolic alterations, chronic inflammation, and endothelial dysfunction to prostatic enlargement [21]. PSA levels correlated positively with VLDL and triglycerides and negatively with HDL, suggesting that lipid metabolism may contribute to PSA variability. Although other studies did not report similar findings, differences in cohort composition, especially the focus on BPH, may partially explain the discrepancy [22,23].
The association between the androgen pathway and BPH pathogenesis has been described in the literature, although the exact mechanisms remain to be elucidated. In addition, it is well known that the AR coregulators have essential roles in androgen downstream actions, including the p160 family, as well as the acetyltransferases PCAF and p300 [24,25]. Our data showed overexpression of AR coregulators (except p300) in BPH samples relative to controls, consistent with their importance in androgen signaling. Notably, PCAF expression was higher in patients with altered metabolic indicators. Although PCAF has been associated with metabolic pathways in other tissues, its role in BPH and systemic MetS remains insufficiently explored. The observed correlations raise the hypothesis that PCAF may participate in the metabolic androgen interface in prostatic tissue; however, this possibility requires functional validation. [21,26].
Youn et al. established a murine BPH model to test the anti-androgenic effects of berberine, observing suppression of androgen-regulated genes, including SRC-1 [27]. In our study, we also identified elevated SRC-1 expression in BPH patients, particularly those with larger prostate volumes. However, like in our previous studies in PCa, no significant association was found between p160 expression and PSA, suggesting that these coregulators may not directly influence PSA levels in BPH [8].
To our knowledge, no papers have investigated the acetylators p300 and PCAF in BPH. However, BPH samples are commonly used as controls for PCa studies. One example is the pre-clinical trial by Linja MJ et al., which assessed 16 AR coregulators in PCa hormone-naïve, PCa hormone-refractory, and BPH samples. Despite the small number of controls, there was no discernible difference in p300 and SRC-1 expression between the BPH group and the other groups [28]. The lack of difference in the analysis between the BPH group and the well-known role of AR coregulators in PCa may suggest that these coregulators also participate in BPH physiopathology. The present paper corroborates that the expression of p300 and PCAF was upregulated among BPH patients with higher PSA levels and bulkier prostates. Therefore, the participation of these genes in BPH pathogenesis should be increasingly studied.
Our work shows that collagen genes were positively associated with BPH, PSA, and prostate volume. These findings are consistent with the concept that extracellular matrix remodeling accompanies BPH progression. Previous studies have demonstrated that interactions between macrophages and epithelial cells can enhance TGF-β signaling and EMT, thereby promoting collagen expression. Our findings, although not mechanistic, are compatible with these observations [24,29,30,31]. The correlations between collagen genes and p160 cofactors raise the possibility of an androgen-related regulatory axis; however, confirmatory functional studies are needed to clarify these interactions [32].
Comparisons with previous pharmacological studies in animal models revealed mixed directional effects, likely reflecting species-specific differences and treatment duration [33,34]. In our dataset, patients under combined therapy displayed lower COL1A1 levels, although the small sample size precludes mechanistic interpretation. Therefore, while pharmacological modulation of androgen or inflammatory pathways may influence collagen expression, the present findings are insufficient to determine causality, and larger functional studies will be needed to clarify these interactions.
Prostatic baseline volume and PSA levels are established predictors of BPH progression, with larger prostates and higher PSA values associated with increased risks of acute urinary retention, surgery, and reduced treatment response [35,36,37]. In this context, our findings indicate that SRC-1, PCAF, p300, COL1A1, and COL3A1 are associated with higher prostatic volumes or PSA levels, suggesting that these genes may serve as molecular predictors for disease progression. Further studies are warranted to validate their clinical utility.
A significant limitation of the present study is the relatively small number of control samples and the restricted power for subgroup analyses. Importantly, though, obtaining truly normal prostate tissue is inherently challenging. Despite their limited number, our control samples underwent strict histological evaluation. They represented peripheral-zone regions without hyperplastic changes, which is generally considered the closest approximation to non-hyperplastic prostate tissue available from living patients.
The use of in silico genomic datasets for experimental validation should be interpreted with caution. Although tools such as GTEx, GEPIA2, or cBioPortal are often used for exploratory comparisons, they do not include ideal controls for various diseases, including HBP. GTEx tissues come from deceased organ donors and are classified as “normal” in relation to age, meaning that mild benign hyperplasia is often considered acceptable within pathology review guidelines [38]. Similarly, TCGA PRAD contains mostly tumor-adjacent tissue rather than histologically normal prostate. These intrinsic limitations reduce the suitability of such datasets as strict controls for BPH and help explain the difficulty in integrating our findings with public data without introducing bias. Consistent with these limitations, our exploratory in silico comparisons are provided only as Supplementary Material (Figures S3–S5) and were not used for validation.
Given our results, further functional studies are needed to validate the causal relationships between the genes investigated and the clinical characteristics of BPH. Additional analyses of protein profile, duration, and treatment adherence would be essential to validate the translational relevance of our findings and to improve the interpretation of pharmacological influences on gene expression. Despite these limitations, this study is among those that integrate clinical, metabolic, and transcriptional profiles specifically in BPH. Future studies that provide more clinical information will enable a more robust, refined comparative analysis. Such efforts will ultimately deepen our understanding of the molecular determinants that underlie BPH pathophysiology. Our findings provide a descriptive overview of androgen-related coactivators and extracellular matrix genes in the context of benign prostatic disease and may help guide future mechanistic and translational investigations.
5. Conclusions
This study integrates clinical, metabolic, and transcriptional data to characterize molecular patterns associated with BPH. We identified correlations between metabolic dysfunction and increased expression of the epigenetic coactivators PCAF and p300, as well as between extracellular matrix genes and AR coregulators. Although these findings do not establish mechanistic links, they suggest potential interactions between metabolic status, androgen-related transcription, and tissue remodeling. Future functional studies will be required to determine whether these associations reflect causal biological pathways.
Supplementary Materials
The following supporting information can be downloaded at: https://www.mdpi.com/article/10.3390/biomedicines13122896/s1, Figure S1: Representative image of the electrophoretic profile of the RNA samples on agarose gel; Table S1: Clinical Characteristics of the Study Cohort: Age and PSA Distribution; Table S2: TaqMan™ Assay tables were used in the study; Figure S2: Expression of p300 in the BPH group; Figure S3: In silico analysis using the GTEx dataset showing expression levels of COL1A1, COL3A1, EP300, KAT2B (PCAF), NCOA1 (SRC-1), NCOA2 (SRC-2), and NCOA3 (SRC-3) in BPH samples across the four Hardy Scale categories; Figure S4: Gene expression across age brackets in an in-silico analysis using the GTEx dataset. Boxplots showing expression levels of COL1A1, COL3A1, EP300, KAT2B (PCAF), NCOA1 (SRC-1), NCOA2 (SRC-2), and NCOA3 (SRC-3) in BPH samples across different age brackets (20–29, 30–39, 40–49, and 50–59); Figure S5: Gene expression across age brackets in an in-silico analysis using the GTEx dataset. Boxplots showing expression levels of COL1A1, COL3A1, EP300, KAT2B (PCAF), NCOA1 (SRC-1), NCOA2 (SRC-2), and NCOA3 (SRC-3) in BPH samples across different age brackets (60–69 and 70–79).
Author Contributions
F.C.M. methodology, data curation, and writing—original draft; K.S.d.S. methodology and writing—original draft; G.V.B.C. methodology and data curation; P.H.S.B. methodology, data curation, and writing—original draft; P.C. methodology; G.A.d.S. methodology; V.G. methodology; I.A.S. methodology; A.A.A. supervision; K.L. supervision; M.S. supervision; W.N. supervision; R.P. conceptualization, methodology, formal analysis, and writing—review and editing; S.R. supervision. All authors have read and agreed to the published version of the manuscript.
Funding
This research received no external funding.
Institutional Review Board Statement
The study was conducted in accordance with the Declaration of Helsinki and approved by the Ethics Committee of the HCFMUSP (approval no. 6.499.557 on 10 November 2023).
Informed Consent Statement
Informed consent was obtained from all subjects involved in the study.
Data Availability Statement
The data presented in this study are available on request from the corresponding author due to ethical reasons.
Acknowledgments
We thank the Laboratório de Investigação Médica 55 (LIM55), HCFMUSP, and the Instituto D’Or de Pesquisa e Educação (ID’Or) for providing their computing equipment for analyses.
Conflicts of Interest
The authors declare no conflicts of interest.
References
- GBD 2019 Benign Prostatic Hyperplasia Collaborators. The global, regional, and national burden of benign prostatic hyperplasia in 204 countries and territories from 2000 to 2019: A systematic analysis for the Global Burden of Disease Study 2019. Lancet Healthy Longev. 2022, 3, e754–e776. [Google Scholar] [CrossRef]
- Vickman, R.E.; Franco, O.E.; Moline, D.C.; Vander Griend, D.J.; Thumbikat, P.; Hayward, S.W. The role of the androgen receptor in prostate development and benign prostatic hyperplasia: A review. Asian J. Urol. 2020, 7, 191–202. [Google Scholar] [CrossRef]
- McConnell, J.D.; Roehrborn, C.G.; Bautista, O.M.; Andriole, G.L.; Dixon, C.M.; Kusek, J.W.; Lepor, H.; McVary, K.T.; Nyberg, L.M.J.; Clarke, H.S.; et al. The long-term effect of doxazosin, finasteride, and combination therapy on the clinical progression of benign prostatic hyperplasia. N. Engl. J. Med. 2003, 349, 2387–2398. [Google Scholar] [CrossRef]
- Roehrborn, C.G.; Siami, P.; Barkin, J.; Damião, R.; Major-Walker, K.; Nandy, I.; Morrill, B.B.; Gagnier, R.P.; Montorsi, F. The effects of combination therapy with dutasteride and tamsulosin on clinical outcomes in men with symptomatic benign prostatic hyperplasia: 4-year results from the CombAT study. Eur. Urol. 2010, 57, 123–131, Erratum in Eur. Urol. 2010, 58, 801. [Google Scholar] [CrossRef]
- Fogaing, C.; Alsulihem, A.; Campeau, L.; Corcos, J. Is Early Surgical Treatment for Benign Prostatic Hyperplasia Preferable to Prolonged Medical Therapy: Pros and Cons. Medicina 2021, 57, 368. [Google Scholar] [CrossRef] [PubMed]
- Chatterjee, B. The role of the androgen receptor in the development of prostatic hyperplasia and prostate cancer. Mol. Cell. Biochem. 2003, 253, 89–101. [Google Scholar] [CrossRef] [PubMed]
- Culig, Z. Androgen Receptor Coactivators in Regulation of Growth and Differentiation in Prostate Cancer. J. Cell. Physiol. 2016, 231, 270–274. [Google Scholar] [CrossRef]
- Pimenta, R.; Malulf, F.C.; Romão, P.; Caetano, G.V.B.; da Silva, K.S.; Ghazarian, V.; dos Santos, G.A.; Guimarães, V.; Silva, I.A.; de Camargo, J.A.; et al. Evaluation of AR, AR-V7, and p160 family as biomarkers for prostate cancer: Insights into the clinical significance and disease progression. J. Cancer Res. Clin. Oncol. 2024, 150, 70. [Google Scholar] [CrossRef] [PubMed]
- Pimenta, R.; Camargo, J.A.; Candido, P.; Ghazarian, V.; Gonçalves, G.L.; Guimarães, V.R.; Romão, P.; Chiovatto, C.; Mioshi, C.M.; dos Santos, G.A.; et al. Cholesterol Triggers Nuclear Co-Association of Androgen Receptor, p160 Steroid Coactivators, and p300/CBP-Associated Factor Leading to Androgenic Axis Transactivation in Castration-Resistant Prostate Cancer. Cell. Physiol. Biochem. 2022, 56, 1–15. [Google Scholar]
- Chughtai, B.; Forde, J.C.; Thomas, D.D.; Laor, L.; Hossack, T.; Woo, H.H.; Te, A.E.; Kaplan, S.A. Benign prostatic hyperplasia. Nat. Rev. Dis. Primers 2016, 2, 16031. [Google Scholar] [CrossRef]
- Daher, M.; Saqer, T.; Jabr, M.; Al-Mousa, S. Benign prostatic hyperplasia and metabolic syndrome; prevalence and association: A cross-sectional study in Syria. BMC Urol. 2023, 23, 187. [Google Scholar] [CrossRef]
- Hammarsten, J.; Högstedt, B.; Holthuis, N.; Mellström, D. Components of the metabolic syndrome-risk factors for the development of benign prostatic hyperplasia. Prostate Cancer Prostatic Dis. 1998, 1, 157–162. [Google Scholar] [CrossRef]
- Pimenta, R.; Mioshi, C.M.; Gonçalves, G.L.; Candido, P.; Camargo, J.A.; Guimarães, V.R.; Chiovatto, C.; Ghazarian, V.; Romão, P.; da Silva, K.S.; et al. Intratumoral Restoration of miR-137 Plus Cholesterol Favors Homeostasis of the miR-137/Coactivator p160/AR Axis and Negatively Modulates Tumor Progression in Advanced Prostate Cancer. Int. J. Mol. Sci. 2023, 24, 9633. [Google Scholar] [CrossRef] [PubMed]
- Jaiswal, B.; Agarwal, A.; Gupta, A. Lysine Acetyltransferases and Their Role in AR Signaling and Prostate Cancer. Front. Endocrinol. 2022, 13, 886594. [Google Scholar] [CrossRef] [PubMed]
- Zhong, J.; Ding, L.; Bohrer, L.R.; Pan, Y.; Liu, P.; Zhang, J.; Sebo, T.J.; Karnes, R.J.; Tindall, D.J.; van Deursen, J.; et al. p300 acetyltransferase regulates androgen receptor degradation and PTEN-deficient prostate tumorigenesis. Cancer Res. 2014, 74, 1870–1880. [Google Scholar] [CrossRef] [PubMed]
- Wang, R.; Zhang, M.; Ou, Z.; He, W.; Chen, L.; Zhang, J.; He, Y.; Xu, R.; Jiang, S.; Qi, L.; et al. Long noncoding RNA DNM3OS promotes prostate stromal cells transformation via the miR-29a/29b/COL3A1 and miR-361/TGFβ1 axes. Aging 2019, 11, 9442–9460. [Google Scholar] [CrossRef]
- Hueber, P.A.; Ben-Zvi, T.; Liberman, D.; Bhojani, N.; Gautam, G.; Deklaj, T.; Katz, M.; Zorn, K.C. Mid term outcomes of initial 250 case experience with GreenLight 120W-HPS photoselective vaporization prostatectomy for benign prostatic hyperplasia: Comparison of prostate volumes < 60 cc, 60 cc–100 cc and >100 cc. Can. J. Urol. 2012, 19, 6450–6458. [Google Scholar]
- Litman, H.J.; McKinlay, J.B. The future magnitude of urological symptoms in the USA: Projections using the Boston Area Community Health survey. BJU Int. 2007, 100, 820–825, Erratum in BJU Int. 2007, 100, 97. [Google Scholar] [CrossRef]
- Bortnick, E.; Brown, C.; Simma-Chiang, V.; Kaplan, S.A. Modern best practice in the management of benign prostatic hyperplasia in older people. Ther. Adv. Urol. 2020, 12, 1756287220929486. [Google Scholar] [CrossRef]
- Marmiroli, R.; Antunes, A.A.; Reis, S.T.; Nakano, E.; Srougi, M. Standard surgical treatment for benign prostatic hyperplasia is safe for patients over 75 years: Analysis of 100 cases from a high-volume urologic center. Clinics 2012, 67, 1415–1418. [Google Scholar] [CrossRef]
- Ngai, H.Y.; Yuen, K.S.; Ng, C.M.; Cheng, C.H.; Chu, S.P. Metabolic syndrome and benign prostatic hyperplasia: An update. Asian J. Urol. 2017, 4, 164–173. [Google Scholar] [CrossRef]
- Zamani, A.; Rafiee, M.; Alikhani, M.Y.; Mohagheghi, S.; Pakrad, B.; Borzouei, S. Serum Interleukin-17, Carcinoembryonic Antigen, and Prostate-Specific Antigen in High Lipid Profile Individuals. J. Interferon. Cytokine Res. 2020, 40, 218–224. [Google Scholar] [CrossRef]
- Arab, D.; Ardestani Zadeh, A.; Mirmohammadkhani, M.; Beiglarzadeh, A. Prostate-specific antigen rising in Iranian men in correlation with body mass index, fasting blood sugar and blood lipid profile. J. Nephropathol. 2016, 5, 134–138. [Google Scholar] [CrossRef] [PubMed][Green Version]
- Izumi, K.; Mizokami, A.; Lin, W.J.; Lai, K.P.; Chang, C. Androgen receptor roles in the development of benign prostate hyperplasia. Am. J. Pathol. 2013, 182, 1942–1949. [Google Scholar] [CrossRef]
- Heemers, H.V.; Tindall, D.J. Androgen receptor (AR) coregulators: A diversity of functions converging on and regulating the AR transcriptional complex. Endocr. Rev. 2007, 28, 778–808. [Google Scholar] [CrossRef]
- Wang, T.; Yao, W.; Shao, Y.; Zheng, R.; Huang, F. PCAF fine-tunes hepatic metabolic syndrome, inflammatory disease, and cancer. J. Cell. Mol. Med. 2018, 22, 5787–5800. [Google Scholar] [CrossRef] [PubMed]
- Youn, D.H.; Park, J.; Kim, H.L.; Jung, Y.; Kang, J.; Lim, S.; Song, G.; Kwak, H.J.; Um, J.-Y. Berberine Improves Benign Prostatic Hyperplasia via Suppression of 5 Alpha Reductase and Extracellular Signal-Regulated Kinase in Vivo and in Vitro. Front. Pharmacol. 2018, 9, 773. [Google Scholar] [CrossRef]
- Linja, M.J.; Porkka, K.P.; Kang, Z.; Savinainen, K.J.; Jänne, O.A.; Tammela, T.L.; Vessella, R.L.; Palvimo, J.J.; Visakorpi, T. Expression of androgen receptor coregulators in prostate cancer. Clin. Cancer Res. 2004, 10, 1032–1040. [Google Scholar] [CrossRef]
- Biernacka, A.; Dobaczewski, M.; Frangogiannis, N.G. TGF-β signaling in fibrosis. Growth Factors. 2011, 29, 196–202. [Google Scholar] [CrossRef] [PubMed]
- Wu, Z.L.; Yuan, Y.; Geng, H.; Xia, S.J. Influence of immune inflammation on androgen receptor expression in benign prostatic hyperplasia tissue. Asian J. Androl. 2012, 14, 316–319. [Google Scholar] [CrossRef]
- Lu, T.; Lin, W.J.; Izumi, K.; Wang, X.; Xu, D.; Fang, L.Y.; Li, L.; Jiang, Q.; Jin, J.; Chang, C. Targeting androgen receptor to suppress macrophage-induced EMT and benign prostatic hyperplasia (BPH) development. Mol. Endocrinol. 2012, 26, 1707–1715. [Google Scholar] [CrossRef]
- Schneider, A.J.; Serrell, E.C.; Grimes, M.; Wang, S.; Bushman, W. Histologic inflammation and collagen content are not positively correlated in human BPH. Prostate 2023, 83, 1529–1536. [Google Scholar] [CrossRef]
- Delella, F.K.; de Almeida, F.L.A.; Nunes, H.C.; Rinaldi, J.C.; Felisbino, S.L. Fibrillar collagen genes are not coordinately upregulated with TGF β1 expression in finasteride-treated prostate. Cell Biol. Int. 2017, 41, 1214–1222. [Google Scholar] [CrossRef]
- Delella, F.K.; Lacorte, L.M.; Almeida, F.L.; Pai, M.D.; Felisbino, S.L. Fibrosis-related gene expression in the prostate is modulated by doxazosin treatment. Life Sci. 2012, 91, 1281–1287. [Google Scholar] [CrossRef] [PubMed]
- Jacobsen, S.J.; Jacobson, D.J.; Girman, C.J.; Roberts, R.O.; Rhodes, T.; Guess, H.A.; Lieber, M.M. Natural history of prostatism: Risk factors for acute urinary retention. J. Urol. 1997, 158, 481–487. [Google Scholar] [CrossRef] [PubMed]
- Roehrborn, C.G.; McConnell, J.D.; Lieber, M.; Kaplan, S.; Geller, J.; Malek, G.H.; Castellanos, R.; Coffield, S.; Saltzman, B.; Resnick, M.; et al. Serum prostate-specific antigen concentration is a powerful predictor of acute urinary retention and need for surgery in men with clinical benign prostatic hyperplasia. PLESS Study Group. Urology 1999, 53, 473–480. [Google Scholar] [CrossRef]
- Nickel, J.C. Benign prostatic hyperplasia: Does prostate size matter? Rev. Urol. 2003, 5, S12–S17. [Google Scholar]
- Carithers, L.J.; Ardlie, K.; Barcus, M.; Branton, P.A.; Britton, A.; Buia, S.A.; Compton, C.C.; DeLuca, D.S.; Peter-Demchok, J.; Gelfand, E.T.; et al. A Novel Approach to High-Quality Postmortem Tissue Procurement: The GTEx Project. Biopreserv. Biobank. 2015, 13, 311–319. [Google Scholar] [CrossRef] [PubMed]
Disclaimer/Publisher’s Note: The statements, opinions and data contained in all publications are solely those of the individual author(s) and contributor(s) and not of MDPI and/or the editor(s). MDPI and/or the editor(s) disclaim responsibility for any injury to people or property resulting from any ideas, methods, instructions or products referred to in the content. |
© 2025 by the authors. Licensee MDPI, Basel, Switzerland. This article is an open access article distributed under the terms and conditions of the Creative Commons Attribution (CC BY) license (https://creativecommons.org/licenses/by/4.0/).