
Inflammatory Biomarkers and Lipid Parameters May Predict an Increased Risk for Atrial Arrhythmias in Patients with Systemic Sclerosis
 , ,
, ,  ,
,  ,
,  and
and
Abstract
1. Introduction
2. Materials and Methods
2.1. Patients
2.2. Echocardiography
2.3. Electrocardiography
2.4. Laboratory Parameters
2.5. Statistical Analysis
3. Results
3.1. Clinical Parameters
3.2. Electrocardiographic Findings
3.3. Echocardiographic Results
3.4. Laboratory Results
3.5. Correlations Between Parameters
4. Discussion
5. Conclusions
Supplementary Materials
Author Contributions
Funding
Institutional Review Board Statement
Informed Consent Statement
Data Availability Statement
Acknowledgments
Conflicts of Interest
References
- Geyer, M.; Muller-Ladner, U. The pathogenesis of systemic sclerosis revisited. Clin. Rev. Allergy Immunol. 2011, 40, 92–103. [Google Scholar] [CrossRef]
- Peoples, C.; Medsger, T.A., Jr.; Lucas, M.; Rosario, B.L.; Feghali-Bostwick, C.A. Gender differences in systemic sclerosis: Relationship to clinical features, serologic status and outcomes. J. Scleroderma Relat. Disord. 2016, 1, 177–240. [Google Scholar] [CrossRef]
- Tzelepis, G.E.; Kelekis, N.L.; Plastiras, S.C.; Mitseas, P.; Economopoulos, N.; Kampolis, C.; Gialafos, E.J.; Moyssakis, I.; Moutsopoulos, H.M. Pattern and distribution of myocardial fibrosis in systemic sclerosis: A delayed enhanced magnetic resonance imaging study. Arthritis Rheum. 2007, 56, 3827–3836. [Google Scholar] [CrossRef] [PubMed]
- Bruni, C.; Buch, M.H.; Furst, D.E.; De Luca, G.; Djokovic, A.; Dumitru, R.B.; Giollo, A.; Polovina, M.; Steelandt, A.; Bratis, K.; et al. Primary systemic sclerosis heart involvement: A systematic literature review and preliminary data-driven, consensus-based WSF/HFA definition. J. Scleroderma Relat. Disord. 2022, 7, 24–32. [Google Scholar] [CrossRef] [PubMed]
- Gawalko, M.; Balsam, P.; Lodzinski, P.; Grabowski, M.; Krzowski, B.; Opolski, G.; Kosiuk, J. Cardiac Arrhythmias in Autoimmune Diseases. Circ. J. 2020, 84, 685–694. [Google Scholar] [CrossRef]
- Fernandez-Codina, A.; Simeon-Aznar, C.P.; Pinal-Fernandez, I.; Rodriguez-Palomares, J.; Pizzi, M.N.; Hidalgo, C.E.; Guillen-Del Castillo, A.; Prado-Galbarro, F.J.; Sarria-Santamera, A.; Fonollosa-Pla, V.; et al. Cardiac involvement in systemic sclerosis: Differences between clinical subsets and influence on survival. Rheumatol. Int. 2017, 37, 75–84. [Google Scholar] [CrossRef] [PubMed]
- Bournia, V.K.; Tountas, C.; Protogerou, A.D.; Panopoulos, S.; Mavrogeni, S.; Sfikakis, P.P. Update on assessment and management of primary cardiac involvement in systemic sclerosis. J. Scleroderma Relat. Disord. 2018, 3, 53–65. [Google Scholar] [CrossRef]
- Tilly, M.J.; Geurts, S.; Zhu, F.; Bos, M.M.; Ikram, M.A.; de Maat, M.P.M.; de Groot, N.M.S.; Kavousi, M. Autoimmune diseases and new-onset atrial fibrillation: A UK Biobank study. Europace 2023, 25, 804–811. [Google Scholar] [CrossRef] [PubMed]
- Vrancianu, C.A.; Gheorghiu, A.M.; Popa, D.E.; Chan, J.S.K.; Satti, D.I.; Lee, Y.H.A.; Hui, J.M.H.; Tse, G.; Ancuta, I.; Ciobanu, A.; et al. Arrhythmias and Conduction Disturbances in Patients with Systemic Sclerosis—A Systematic Literature Review. Int. J. Mol. Sci. 2022, 11, 12963. [Google Scholar] [CrossRef]
- Fairley, J.L.; Ross, L.; Quinlivan, A.; Hansen, D.; Paratz, E.; Stevens, W.; Kistler, P.M.; McLellan, A.; La Gerche, A.; Nikpour, M. Sudden cardiac death, arrhythmias and abnormal electrocardiography in systemic sclerosis: A systematic review and meta-analysis. Semin. Arthritis Rheum. 2023, 62, 152229. [Google Scholar] [CrossRef]
- Edigin, E.; Ojemolon, P.E.; Eseaton, P.O.; Shaka, H.; Akuna, E.; Asemota, I.R.; Manadan, A. Systemic Sclerosis Is Associated With Increased Inpatient Mortality in Patients Admitted for Atrial Fibrillation: Analysis of the National Inpatient Sample. J. Clin. Rheumatol. 2021, 27, e477–e481. [Google Scholar] [CrossRef]
- Radwan, Y.A.; Kurmann, R.D.; Sandhu, A.S.; El-Am, E.A.; Crowson, C.S.; Matteson, E.L.; Osborn, T.G.; Warrington, K.J.; Mankad, R.; Makol, A. Systemic Sclerosis Portends Increased Risk of Conduction and Rhythm Abnormalities at Diagnosis and During Disease Course: A US Population-Based Cohort. J. Scleroderma Relat. Disord. 2021, 6, 277–285. [Google Scholar] [CrossRef] [PubMed]
- Aktoz, M.; Yilmaztepe, M.; Tatli, E.; Turan, F.N.; Umit, E.G.; Altun, A. Assessment of ventricular and left atrial mechanical functions, atrial electromechanical delay and P wave dispersion in patients with scleroderma. Cardiol. J. 2011, 18, 261–269. [Google Scholar] [PubMed]
- Wokhlu, N.; Hsu, V.M.; Wilson, A.; Moreyra, A.E.; Shindler, D. P-wave amplitude and pulmonary artery pressure in scleroderma. J. Electrocardiol. 2006, 39, 385–388. [Google Scholar] [CrossRef] [PubMed]
- Sharifkazemi, M.; Nazarinia, M.; Arjangzade, A.; Goldust, M.; Hooshanginezhad, Z. Diagnosis of Simultaneous Atrial and Ventricular Mechanical Performance in Patients with Systemic Sclerosis. Biology 2022, 11, 305. [Google Scholar] [CrossRef] [PubMed]
- Agoston, G.; Gargani, L.; Miglioranza, M.H.; Caputo, M.; Badano, L.P.; Moreo, A.; Muraru, D.; Mondillo, S.; Moggi Pignone, A.; Matucci Cerinic, M.; et al. Left atrial dysfunction detected by speckle tracking in patients with systemic sclerosis. Cardiovasc. Ultrasound 2014, 12, 30. [Google Scholar] [CrossRef] [PubMed]
- Durmus, E.; Sunbul, M.; Tigen, K.; Kivrak, T.; Ozen, G.; Sari, I.; Direskeneli, H.; Basaran, Y. Right ventricular and atrial functions in systemic sclerosis patients without pulmonary hypertension. Speckle-tracking echocardiographic study. Herz 2015, 40, 709–715. [Google Scholar] [CrossRef] [PubMed]
- Barsotti, S.S.C.; d’Ascanio, A.; Parma, A.; Emdin, M.; Conti, U.; Mosca, M.; Della Rossa, A. High sensitivity troponin might be a marker of subclinical scleroderma heart involvement: A preliminary study. J. Scleroderma. Relat. Disord. 2017, 2, 183–187. [Google Scholar] [CrossRef]
- Ferraz-Amaro, I.; Delgado-Frias, E.; Hernandez-Hernandez, V.; Sanchez-Perez, H.; de Armas-Rillo, L.; Armas-Gonzalez, E.; Machado, J.D.; Diaz-Gonzalez, F. HDL cholesterol efflux capacity and lipid profile in patients with systemic sclerosis. Arthritis Res. Ther. 2021, 23, 62. [Google Scholar] [CrossRef] [PubMed]
- Kotyla, P.J.; Gozdzik, J.; Lewicki, M.; Kotulska, A.T.; Kucharz, E.J. Serum lipid profile in patients with systemic sclerosis: Relationship to the thyreometabolic state. Rheumatol. Int. 2006, 26, 583–584. [Google Scholar] [CrossRef] [PubMed]
- Lippi, G.; Caramaschi, P.; Montagnana, M.; Salvagno, G.L.; Volpe, A.; Guidi, G. Lipoprotein[a] and the lipid profile in patients with systemic sclerosis. Clin. Chim. Acta 2006, 364, 345–348. [Google Scholar] [CrossRef] [PubMed]
- Gonzalez-Gay, M.A.; Gonzalez-Juanatey, C. Inflammation and lipid profile in rheumatoid arthritis: Bridging an apparent paradox. Ann. Rheum. Dis. 2014, 73, 1281–1283. [Google Scholar] [CrossRef]
- Matsuura, E.; Kobayashi, K.; Inoue, K.; Lopez, L.R.; Shoenfeld, Y. Oxidized LDL/beta2-glycoprotein I complexes: New aspects in atherosclerosis. Lupus 2005, 14, 736–741. [Google Scholar] [CrossRef] [PubMed]
- Rabquer, B.J.; Hou, Y.; Del Galdo, F.; Kenneth Haines, G., 3rd; Gerber, M.L.; Jimenez, S.A.; Seibold, J.R.; Koch, A.E. The proadhesive phenotype of systemic sclerosis skin promotes myeloid cell adhesion via ICAM-1 and VCAM-1. Rheumatology 2009, 48, 734–740. [Google Scholar] [CrossRef]
- Denton, C.P.; Bickerstaff, M.C.; Shiwen, X.; Carulli, M.T.; Haskard, D.O.; Dubois, R.M.; Black, C.M. Serial circulating adhesion molecule levels reflect disease severity in systemic sclerosis. Br. J. Rheumatol. 1995, 34, 1048–1054. [Google Scholar] [CrossRef] [PubMed]
- Snarskaya, E.S.; Vasileva, K.D. Localized scleroderma: Actual insights and new biomarkers. Int. J. Dermatol. 2022, 61, 667–674. [Google Scholar] [CrossRef] [PubMed]
- Zhao, J.H.; Huang, X.L.; Duan, Y.; Wang, Y.J.; Chen, S.Y.; Wang, J. Serum adipokines levels in patients with systemic sclerosis: A meta-analysis. Mod. Rheumatol. 2017, 27, 298–305. [Google Scholar] [CrossRef]
- Lorincz, H.; Somodi, S.; Ratku, B.; Harangi, M.; Paragh, G. Crucial Regulatory Role of Organokines in Relation to Metabolic Changes in Non-Diabetic Obesity. Metabolites 2023, 13, 270. [Google Scholar] [CrossRef]
- Michalska-Jakubus, M.; Sawicka, K.; Potembska, E.; Kowal, M.; Krasowska, D. Clinical associations of serum leptin and leptin/adiponectin ratio in systemic sclerosis. Postep. Dermatol. Alergol. 2019, 36, 325–338. [Google Scholar] [CrossRef] [PubMed]
- Ferri, C.; Valentini, G.; Cozzi, F.; Sebastiani, M.; Michelassi, C.; La Montagna, G.; Bullo, A.; Cazzato, M.; Tirri, E.; Storino, F.; et al. Systemic sclerosis: Demographic, clinical, and serologic features and survival in 1,012 Italian patients. Medicine 2002, 81, 139–153. [Google Scholar] [CrossRef]
- Magnani, J.W.; Williamson, M.A.; Ellinor, P.T.; Monahan, K.M.; Benjamin, E.J. P wave indices: Current status and future directions in epidemiology, clinical, and research applications. Circ. Arrhythm. Electrophysiol. 2009, 2, 72–79. [Google Scholar] [CrossRef]
- Varro, A.; Baczko, I. Possible mechanisms of sudden cardiac death in top athletes: A basic cardiac electrophysiological point of view. Pflug. Arch. 2010, 460, 31–40. [Google Scholar] [CrossRef] [PubMed]
- Issa, M.F.; Yousry, A.; Tuboly, G.; Juhasz, Z.; AbuEl-Atta, A.H.; Selim, M.M. Heartbeat classification based on single lead-II ECG using deep learning. Heliyon 2023, 9, e17974. [Google Scholar] [CrossRef] [PubMed]
- Pall, A.; Czifra, A.; Sebestyen, V.; Becs, G.; Kun, C.; Balla, J.; Paragh, G.; Lorincz, I.; Pall, D.; Padra, T.J.; et al. Hemodiafiltration and hemodialysis differently affect P wave duration and dispersion on the surface electrocardiogram. Int. Urol. Nephrol. 2016, 48, 271–277. [Google Scholar] [CrossRef] [PubMed]
- Dilaveris, P.; Tousoulis, D. P-wave dispersion measurement: Methodological considerations. Indian Pacing Electrophysiol. J. 2017, 17, 89. [Google Scholar] [CrossRef] [PubMed]
- Juhasz, I.; Ujfalusi, S.; Seres, I.; Lorincz, H.; Varga, V.E.; Paragh, G., Jr.; Somodi, S.; Harangi, M.; Paragh, G. Afamin Levels and Their Correlation with Oxidative and Lipid Parameters in Non-diabetic, Obese Patients. Biomolecules 2022, 12, 116. [Google Scholar] [CrossRef] [PubMed]
- Bielous-Wilk, A.; Poreba, M.; Staniszewska-Marszalek, E.; Poreba, R.; Podgorski, M.; Kalka, D.; Jagielski, D.; Rusiecki, L.; Pilecki, W.; Baran, E.; et al. Electrocardiographic evaluation in patients with systemic scleroderma and without clinically evident heart disease. Ann. Noninvasive Electrocardiol. 2009, 14, 251–257. [Google Scholar] [CrossRef]
- Nordin, A.; Bjornadal, L.; Larsson, A.; Svenungsson, E.; Jensen-Urstad, K. Electrocardiography in 110 patients with systemic sclerosis: A cross-sectional comparison with population-based controls. Scand. J. Rheumatol. 2014, 43, 221–225. [Google Scholar] [CrossRef] [PubMed]
- Sahn, D.J.; DeMaria, A.; Kisslo, J.; Weyman, A. Recommendations regarding quantitation in M-mode echocardiography: Results of a survey of echocardiographic measurements. Circulation 1978, 58, 1072–1083. [Google Scholar] [CrossRef]
- Lester, S.J.; Ryan, E.W.; Schiller, N.B.; Foster, E. Best method in clinical practice and in research studies to determine left atrial size. Am. J. Cardiol. 1999, 84, 829–832. [Google Scholar] [CrossRef] [PubMed]
- Lang, R.M.; Badano, L.P.; Mor-Avi, V.; Afilalo, J.; Armstrong, A.; Ernande, L.; Flachskampf, F.A.; Foster, E.; Goldstein, S.A.; Kuznetsova, T.; et al. Recommendations for cardiac chamber quantification by echocardiography in adults: An update from the American Society of Echocardiography and the European Association of Cardiovascular Imaging. Eur. Heart J. Cardiovasc. Imaging 2015, 16, 233–270. [Google Scholar] [CrossRef] [PubMed]
- Zhong, X.; Yu, J.; Zhao, D.; Teng, J.; Jiao, H. Association between serum apolipoprotein A1 and atrial fibrillation in the Chinese population: A case-control study. BMC Cardiovasc. Disord. 2023, 23, 269. [Google Scholar] [CrossRef] [PubMed]
- Malajczuk, C.J.; Gandhi, N.S.; Mancera, R.L. Structure and intermolecular interactions in spheroidal high-density lipoprotein subpopulations. J. Struct. Biol. X 2021, 5, 100042. [Google Scholar] [CrossRef]
- Huang, C.; Zhang, J.; Huang, J.; Li, H.; Wen, K.; Bao, J.; Wu, X.; Sun, R.; Abudukeremu, A.; Wang, Y.; et al. Proteomic and functional analysis of HDL subclasses in humans and rats: A proof-of-concept study. Lipids Health Dis. 2023, 22, 86. [Google Scholar] [CrossRef]
- Sacks, F.M.; Furtado, J.D.; Jensen, M.K. Protein-based HDL subspecies: Rationale and association with cardiovascular disease, diabetes, stroke, and dementia. Biochim. Biophys. Acta Mol. Cell Biol. Lipids 2022, 1867, 159182. [Google Scholar] [CrossRef] [PubMed]
- Ding, W.Y.; Protty, M.B.; Davies, I.G.; Lip, G.Y.H. Relationship between lipoproteins, thrombosis, and atrial fibrillation. Cardiovasc. Res. 2022, 118, 716–731. [Google Scholar] [CrossRef] [PubMed]
- Szabo, Z.; Harangi, M.; Lorincz, I.; Seres, I.; Katona, E.; Karanyi, Z.; Paragh, G. Effect of hyperlipidemia on QT dispersion in patients without ischemic heart disease. Can. J. Cardiol. 2005, 21, 847–850. [Google Scholar] [PubMed]
- Gaal, K.; Tarr, T.; Lorincz, H.; Borbas, V.; Seres, I.; Harangi, M.; Fulop, P.; Paragh, G. High-density lipopoprotein antioxidant capacity, subpopulation distribution and paraoxonase-1 activity in patients with systemic lupus erythematosus. Lipids Health Dis. 2016, 15, 60. [Google Scholar] [CrossRef] [PubMed]
- Radikova, Z.; Penesova, A.; Vlcek, M.; Havranova, A.; Sivakova, M.; Siarnik, P.; Zitnanova, I.; Imrich, R.; Kollar, B.; Turcani, P. LDL and HDL lipoprotein subfractions in multiple sclerosis patients with decreased insulin sensitivity. Endocr. Regul. 2018, 52, 139–145. [Google Scholar] [CrossRef] [PubMed]
- Liu, T.; Zhao, D.; Wang, M.; Sun, J.; Liu, J.; Li, J.; Duan, Y.; Sun, Z.; Hu, P.; Liu, J.; et al. Association between Intermediate-Density Lipoprotein Particles and the Progression of Carotid Atherosclerosis: A Community-Based Cohort Study. J. Atheroscler. Thromb 2023, 30, 1644–1660. [Google Scholar] [CrossRef]
- Nadro, B.; Lorincz, H.; Juhasz, L.; Szentpeteri, A.; Sztanek, F.; Varga, E.; Pall, D.; Paragh, G.; Harangi, M. Determination of Serum Progranulin in Patients with Untreated Familial Hypercholesterolemia. Biomedicines 2022, 10, 771. [Google Scholar] [CrossRef] [PubMed]
- Rizzo, M.; Spinas, G.A.; Cesur, M.; Ozbalkan, Z.; Rini, G.B.; Berneis, K. Atherogenic lipoprotein phenotype and LDL size and subclasses in drug-naive patients with early rheumatoid arthritis. Atherosclerosis 2009, 207, 502–506. [Google Scholar] [CrossRef] [PubMed]
- Lorincz, H.; Ratku, B.; Csiha, S.; Seres, I.; Szabo, Z.; Paragh, G.; Harangi, M.; Somodi, S. Impaired Organokine Regulation in Non-Diabetic Obese Subjects: Halfway to the Cardiometabolic Danger Zone. Int. J. Mol. Sci. 2023, 24, 4115. [Google Scholar] [CrossRef] [PubMed]


| Inclusion Criteria | Exclusion Criteria |
|---|---|
| age above 18 years | existing diabetes mellitus |
| age under 70 years | presence of structural heart diseases |
| existing systemic sclerosis | arrhythmia events, especially atrial fibrillation in past medical history |
| euthyroid state | presence of untreated hypothyroidism |
| normal base blood pressure values | presence of untreated hypertension |
| SSc Patients (n = 26) | Control Group (n = 36) | p Values | |
|---|---|---|---|
| ratio of female patients | 20/26 | 25/36 | n.s. |
| BMI | 24.96 ± 4.93 | 28.11 ± 7.97 | n.s. |
| age | 56.82 ± 2.27 | 53.21 ± 3.61 | n.s. |
| statins among medications | 7/26 | 5/36 | n.s. |
| Main Properties of Our SSc Population | |||
| type of SSc | 12/26 lcSSc, 14/26 dcSSc | ||
| time from diagnosis | 4.1 ± 1.8 years | ||
| time from first symptoms | 6.5 ± 2.1 years | ||
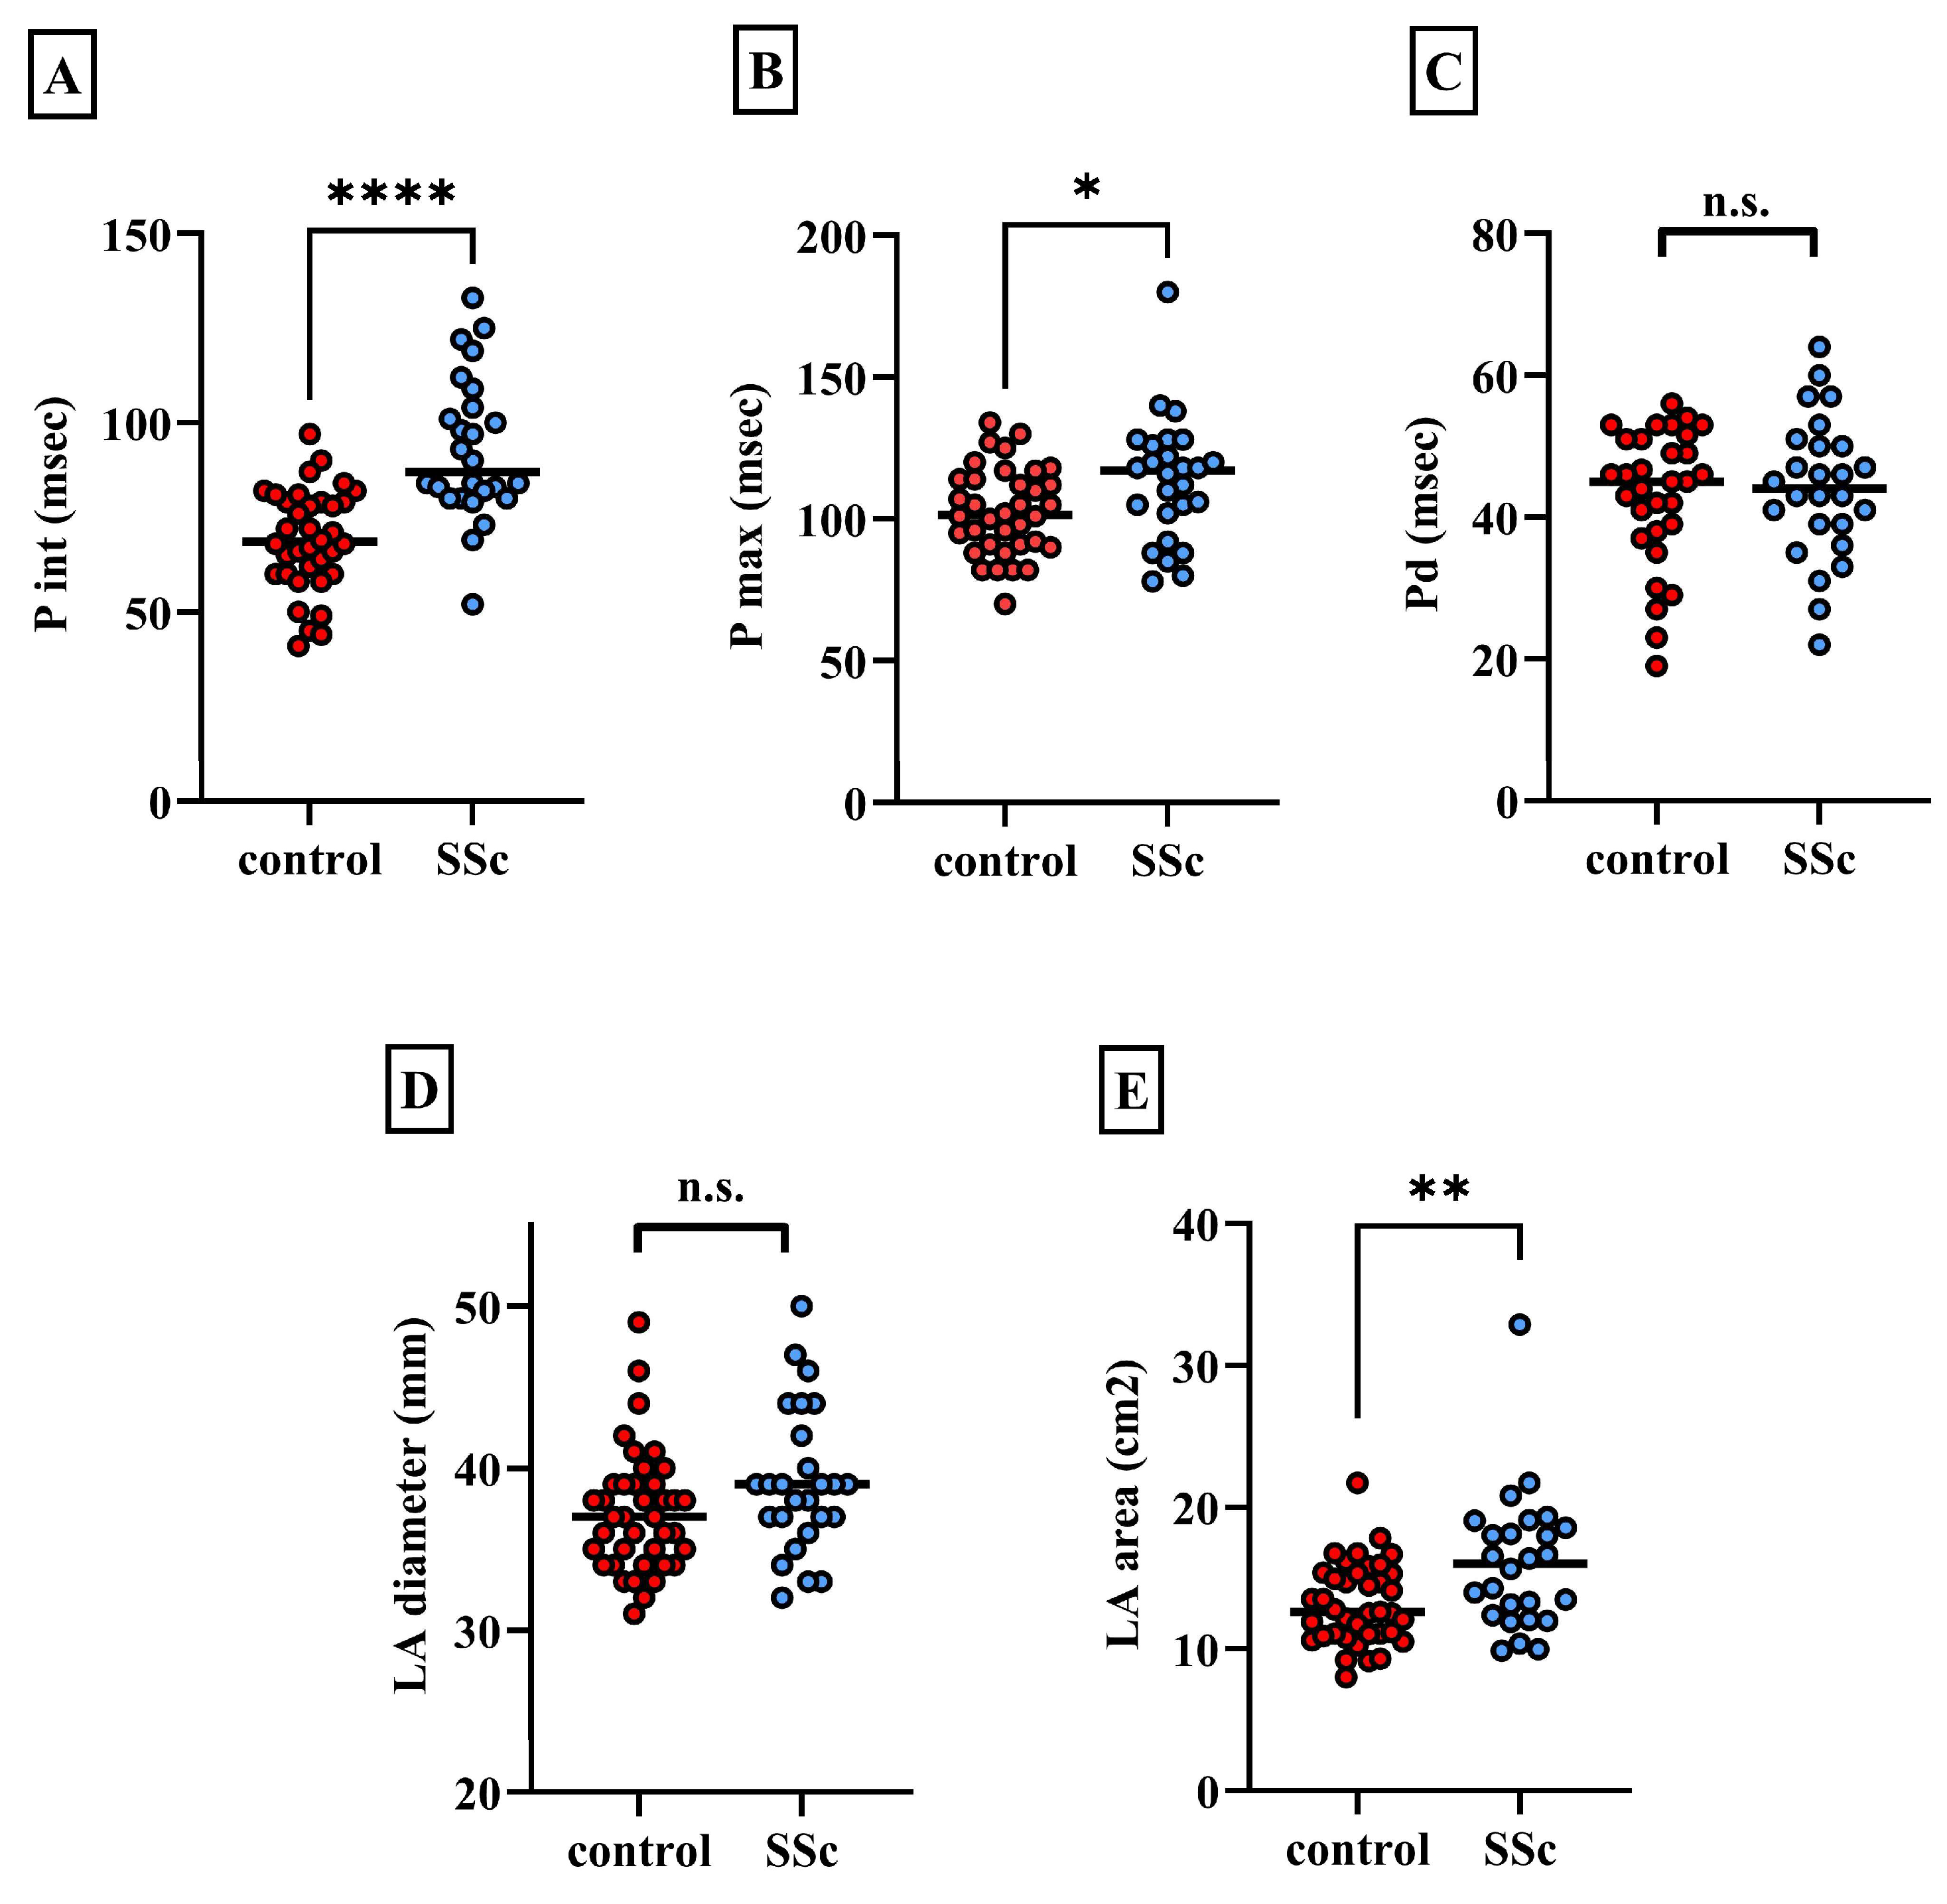
| Electrocardiographic Parameters | SSc Patients (n = 26) | Control Group (n = 36) | p Values |
|---|---|---|---|
| P wave interval (msec) | 92.92 ± 18.2 | 69.11 ± 13.4 | **** |
| P max (msec) | 113.5 ± 20.9 | 102.8 ± 15.3 | * |
| P wave dispersion (msec) | 44.08 ± 10 | 43.14 ± 9.6 | n.s. |
| PP distance (msec) | 910.61 ± 115.7 | 903.63 ± 143 | n.s. |
| PQ interval (msec) | 149.6 ± 25.37 | 142.3 ± 15.5 | n.s. |
| Echocardiographic Parameters | |||
| LA diameter (mm) | 39.1 ± 4.5 | 37.2 ± 3.78 | n.s. |
| LA area (cm2) | 16.1 ± 4.6 | 13.2 ± 2.9 | ** |
| VCI (mm) | 15.3 ± 2.13 | 14.1 ± 2.2 | n.s. |
| mitral E/A (cm/sec) | 1.6 ± 0.46 | 1.29 ± 0.38 | n.s. |
| E/e’ | 12.39 ± 3.9 | 8.88 ± 1.9 | **** |
| TAPSE (mm) | 26 ± 5.38 | 30 ± 3.8 | *** |
| RVP (mmHg) | 19.8 ± 7 | 16.7 ± 4.38 | * |
| EF (%) | 56 ± 6.1 | 58.8 ± 5.7 | n.s. |
| EDLVD (mm) | 50.2 ± 11.6 | 48.8 ± 5 | n.s. |
| SSc Patients | Control Group | p Values | |
|---|---|---|---|
| CRP (mg/L) | 5.04 ± 1.07 | 2.69 ± 0.96 | * |
| HScTnT (ng/L) | 17.8 (9.5–27.75) | 8 (5–10) | ** |
| CK (U/L) | 101.65 ± 50.2 | 157.31 ± 85.7 | * |
| NT-proBNP (ng/L) | 120 (80–374) | 43 (17–70) | **** |
| sTSH (mU/L) | 1.67 ± 0.43 | 1.97 ± 0.74 | n.s. |
| fT3 (pmol/L) | 4.78 ± 0.4 | 5.12 ± 1.51 | n.s. |
| fT4 (pmol/L) | 15.78 ± 2.62 | 15.47 ± 2 | n.s. |
| sICAM-1 (ng/mL) | 230.2 ± 76.4 | 186.4 ± 32.06 | ** |
| sVCAM-1 (ng/mL) | 655.7 ± 109.14 | 586.2 ± 98.12 | * |
| PGRN (ng/mL) | 37 ± 9.09 | 36.3 ± 6.25 | n.s. |
| TG (mmol/L) | 1.47 ± 0.8 | 1.85 ± 1 | n.s. |
| TC (mmol/L) | 4.86 ± 0.95 | 5.59 ± 1.07 | ** |
| LDL-C (mmol/L) | 2.99 ± 0.62 | 3.43 ± 0.77 | * |
| HDL-C (mmol/L) | 1.34 ± 0.29 | 1.39 ± 0.34 | n.s. |
| Apo A-I (g/L) | 1.41 ± 0.2 | 1.52 ± 0.22 | * |
| Apo B (g/L) | 0.99 ± 0.25 | 1.06 ± 0.25 | n.s. |
| Lp(a) (mg/L) | 64.5 (32.25–112.3) | 65 (35–138) | n.s. |
| small HDL % | 22.03 ± 7.2 | 23.33 ± 6.6 | n.s. |
| intermediate HDL % | 48.56 ± 4 | 50.54 ± 3.87 | * |
| large HDL % | 29.42 ± 8.9 | 26.14 ± 7.16 | n.s. |
| IDL % | 24.25 ± 3.8 | 19.39 ± 3.3 | **** |
| VLDL% | 18.78 ± 2.9 | 20.02 ± 3.6 | n.s. |
| large LDL % | 28.25 ± 5.4 | 31.92 ± 4.45 | ** |
| small LDL % | 1.89 ± 2.23 | 0.25 ± 0.39 | **** |
| mean LDL size (nm) | 27.04 ± 0.03 | 26.81 ± 0.05 | n.s. |
| oxLDL (U/L) | 67.3 ± 18.72 | 74.54 ± 18.1 | n.s. |
| leptin (ng/mL) | 14.17 (5.64–31.53) | 9. 8 (5.7–18.01) | n.s. |
Disclaimer/Publisher’s Note: The statements, opinions and data contained in all publications are solely those of the individual author(s) and contributor(s) and not of MDPI and/or the editor(s). MDPI and/or the editor(s) disclaim responsibility for any injury to people or property resulting from any ideas, methods, instructions or products referred to in the content. |
© 2025 by the authors. Licensee MDPI, Basel, Switzerland. This article is an open access article distributed under the terms and conditions of the Creative Commons Attribution (CC BY) license (https://creativecommons.org/licenses/by/4.0/).
Share and Cite
Sebestyén, V.; Ujvárosy, D.; Ratku, B.; Lőrincz, H.; Csiha, S.; Tari, D.; Majai, G.; Somodi, S.; Szűcs, G.; Harangi, M.; et al. Inflammatory Biomarkers and Lipid Parameters May Predict an Increased Risk for Atrial Arrhythmias in Patients with Systemic Sclerosis. Biomedicines 2025, 13, 220. https://doi.org/10.3390/biomedicines13010220
Sebestyén V, Ujvárosy D, Ratku B, Lőrincz H, Csiha S, Tari D, Majai G, Somodi S, Szűcs G, Harangi M, et al. Inflammatory Biomarkers and Lipid Parameters May Predict an Increased Risk for Atrial Arrhythmias in Patients with Systemic Sclerosis. Biomedicines. 2025; 13(1):220. https://doi.org/10.3390/biomedicines13010220
Chicago/Turabian StyleSebestyén, Veronika, Dóra Ujvárosy, Balázs Ratku, Hajnalka Lőrincz, Sára Csiha, Dóra Tari, Gyöngyike Majai, Sándor Somodi, Gabriella Szűcs, Mariann Harangi, and et al. 2025. "Inflammatory Biomarkers and Lipid Parameters May Predict an Increased Risk for Atrial Arrhythmias in Patients with Systemic Sclerosis" Biomedicines 13, no. 1: 220. https://doi.org/10.3390/biomedicines13010220
APA StyleSebestyén, V., Ujvárosy, D., Ratku, B., Lőrincz, H., Csiha, S., Tari, D., Majai, G., Somodi, S., Szűcs, G., Harangi, M., & Szabó, Z. (2025). Inflammatory Biomarkers and Lipid Parameters May Predict an Increased Risk for Atrial Arrhythmias in Patients with Systemic Sclerosis. Biomedicines, 13(1), 220. https://doi.org/10.3390/biomedicines13010220