
Machine Learning and Texture Analysis of [18F]FDG PET/CT Images for the Prediction of Distant Metastases in Non-Small-Cell Lung Cancer Patients

 , ,
, , 
Abstract
1. Introduction
2. Materials and Methods
2.1. Patients
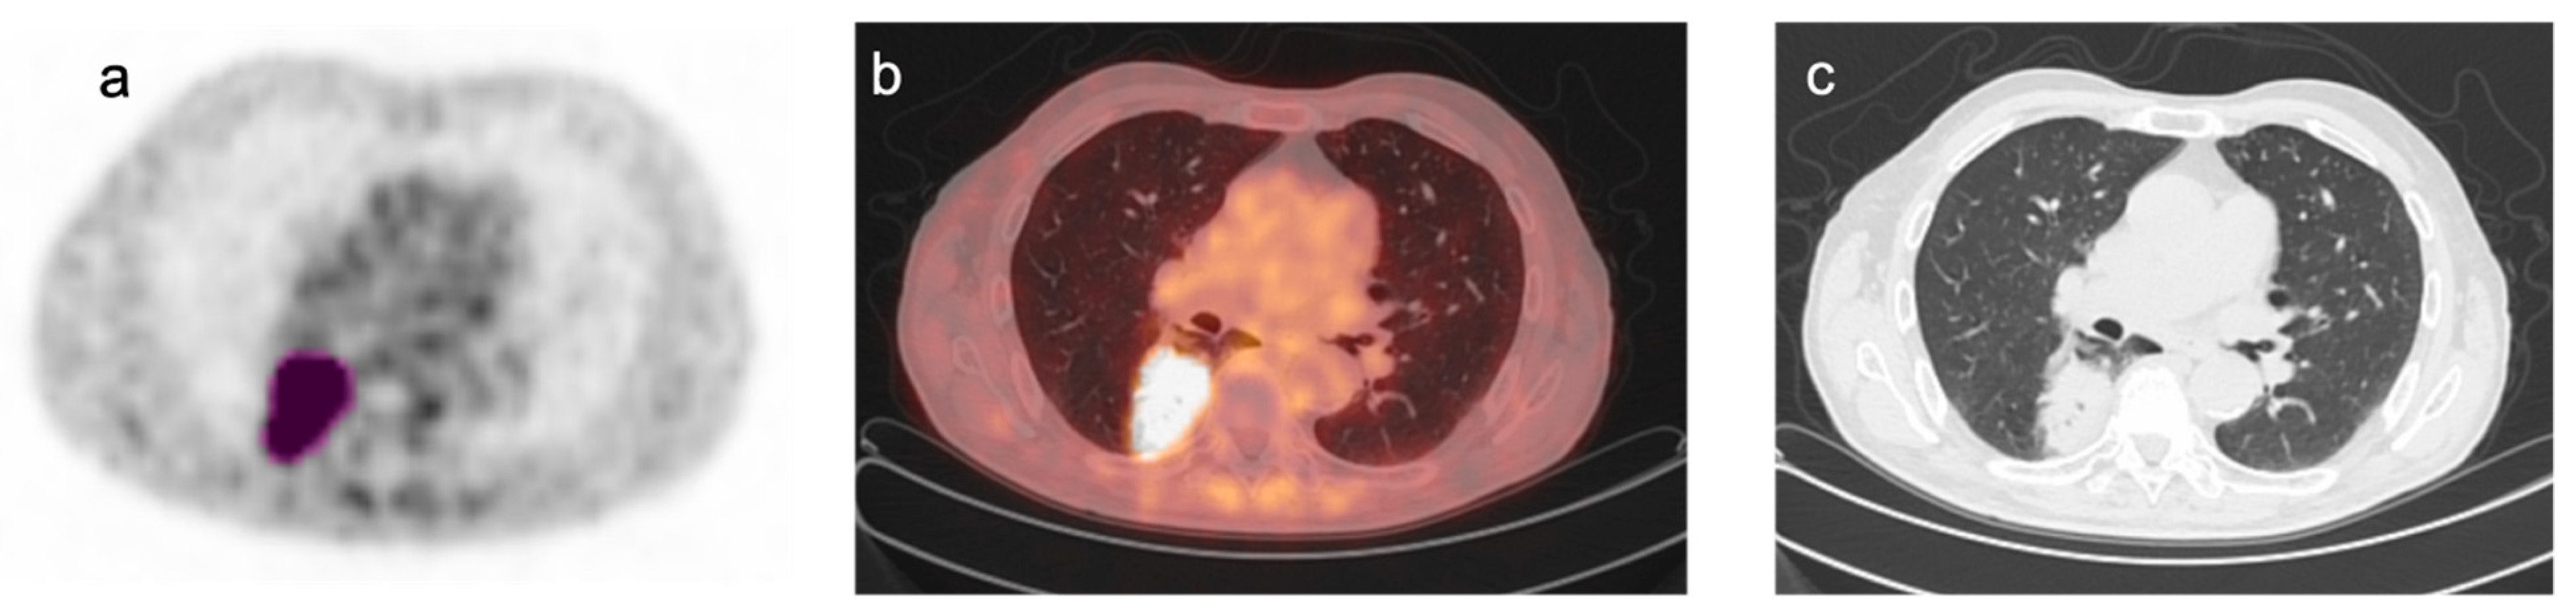
2.2. [18F]FDG PET/CT Study
2.3. [18F]FDG PET/CT Image Analysis
2.4. Selection of the Best Machine Learning Method
2.5. Selection of Texture Features
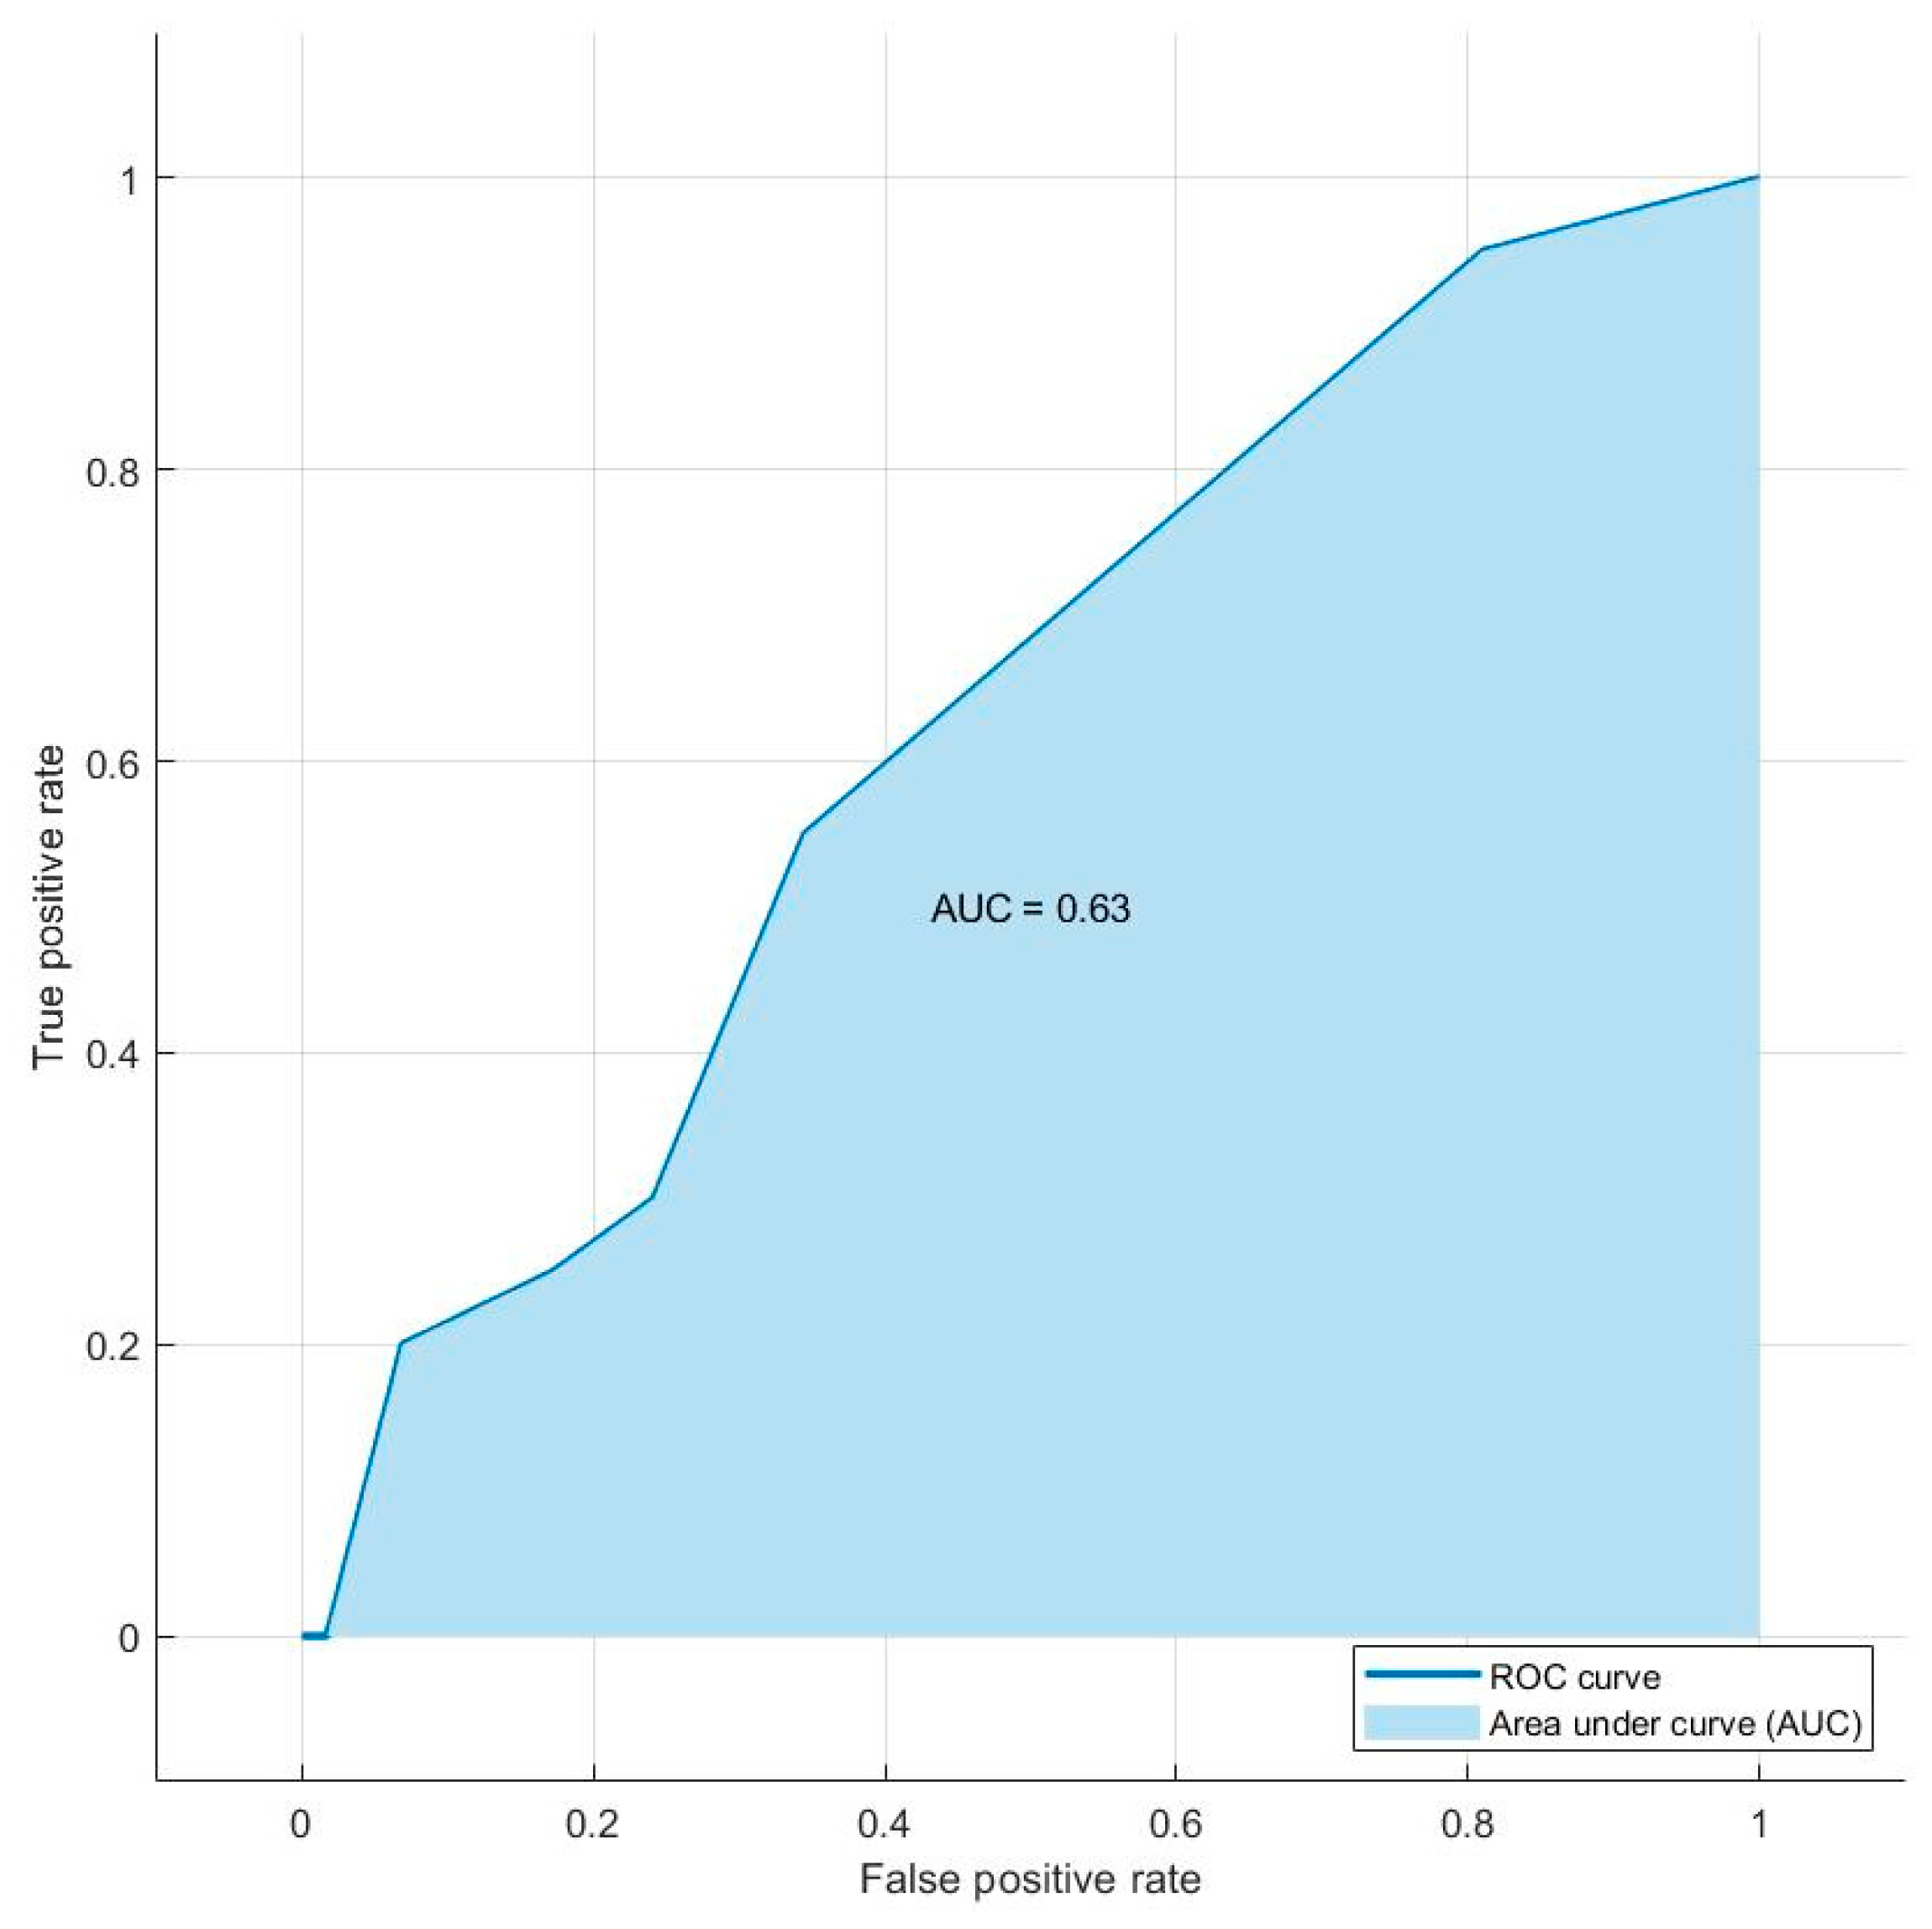
2.6. Selection and Evaluation of the Best Model
3. Results
4. Discussion
Supplementary Materials
Author Contributions
Funding
Institutional Review Board Statement
Informed Consent Statement
Data Availability Statement
Acknowledgments
Conflicts of Interest
References
- Sung, H.; Ferlay, J.; Siegel, R.L.; Laversanne, M.; Soerjomataram, I.; Jemal, A.; Bray, F. Global Cancer Statistics 2020: GLOBOCAN Estimates of Incidence and Mortality Worldwide for 36 Cancers in 185 Countries. CA Cancer J. Clin. 2021, 71, 209–249. [Google Scholar] [CrossRef]
- Herbst, R.S.; Morgensztern, D.; Boshof, C. The biology and management of non-small cell lung cancer. Nature 2018, 553, 446–454. [Google Scholar] [CrossRef] [PubMed]
- Jones, C.M.; Brunelli, A.; Callister, M.E.; Franks, K.N. Multimodality treatment of advanced non-small cell lung cancer: Where are we with the evidence? Curr. Surg. Rep. 2018, 6, 5. [Google Scholar] [CrossRef] [PubMed]
- Postmus, P.E.; Kerr, K.M.; Oudkerk, M.; Senan, S.; Waller, D.A.; Vansteenkiste, J.; Escriu, C.; Peters, S.; on behalf of the ESMO Guidelines Committee. Early and locally advanced non-small-cell lung cancer (NSCLC): ESMO Clinical Practice Guidelines for diagnosis, treatment and follow-up. Ann. Oncol. 2017, 28, iv1–iv21. [Google Scholar] [CrossRef] [PubMed]
- Hendriks, L.E.; Kerr, K.M.; Menis, J.; Mok, T.S.; Nestle, U.; Passaro, A.; Peters, S.; Planchard, D.; Smit, E.F.; Solomon, B.J.; et al. Non-oncogene-addicted metastatic non-small-cell lung cancer: ESMO Clinical Practice Guideline for diagnosis, treatment and follow-up. Ann. Oncol. 2023, 34, 358–376. [Google Scholar] [CrossRef] [PubMed]
- Hendriks, L.E.; Kerr, K.M.; Menis, J.; Mok, T.S.; Nestle, U.; Passaro, A.; Peters, S.; Planchard, D.; Smit, E.F.; Solomon, B.J.; et al. Oncogene-addicted metastatic non-small cell lung cancer:ESMO Clinical Practice Guideline for diagnosis, treatment and follow-up. Ann. Oncol. 2023, 34, 339–357. [Google Scholar] [CrossRef] [PubMed]
- Gandhi, Z.; Gurram, P.; Amgai, B.; Lekkala, S.P.; Lokhandwala, A.; Manne, S.; Mohammed, A.; Koshiya, H.; Dewaswala, N.; Desai, R.; et al. Artificial Intelligence and Lung Cancer: Impact on Improving Patient Outcomes. Cancers 2023, 15, 5236. [Google Scholar] [CrossRef] [PubMed]
- Huang, S.; Yang, J.; Shen, N.; Xu, Q.; Zhao, Q. Artificial intelligence in lung cancer diagnosis and prognosis: Current application and future perspective. Semin. Cancer Biol. 2023, 89, 30–37. [Google Scholar] [CrossRef] [PubMed]
- Phillips, I.; Ajaz, M.; Ezhil, V.; Prakash, V.; Alobaidli, S.; McQuaid, S.J.; South, C.; ScuffhAm, J.; Nisbet, A.; Evans, P. Clinical applications of textural analysis in non-small cell lung cancer. BJR 2018, 91, 20170267. [Google Scholar] [CrossRef]
- Rogers, W.; Seetha, S.T.; Refaee, T.A.G.; Lieverse, R.I.Y.; Granzier, R.W.Y.; Ibrahim, A.; Keek, S.; Sandaleanu, S.; Primakov, S.; Beuque, M.P.L.; et al. Radiomics: From qualitative to quantitative imaging. BJR 2020, 93, 20190948. [Google Scholar] [CrossRef]
- Chiu, H.Y.; Chao, H.S.; Chen, Y.M. Application of Artificial Intelligence in Lung Cancer. Cancers 2022, 14, 1370. [Google Scholar] [CrossRef]
- Forghani, R.; Savadjiev, P.; Chatterjee, A.; Muthukrishnan, N.; Reinhold, C.; Forghani, B. Radiomics and Artificial Intelligence for Biomarker and Prediction Model Development in Oncology. Comput. Struct. Biotechnol. J. 2019, 17, 995–1008. [Google Scholar] [CrossRef] [PubMed]
- Lovinfosse, P.; Hatt, M.; Visvikis, D.; Hustinx, R. Heterogeneity analysis of 18F-FDG PET imaging in oncology: Clinical indications and perspectives. Clin. Transl. Imaging 2018, 6, 393–410. [Google Scholar] [CrossRef]
- Pellegrino, S.; Fonti, R.; Moghadam, H.; Torbati, A.; Bologna, R.; Morra, R.; Damiano, V.; Matano, E.; De Placido, S.; Del Vecchio, S. Heterogeneity of glycolytic phenotype determined by 18F-FDG PET/CT using coefficient of variation in patients with advanced non-small cell lung cancer. Diagnostics 2023, 13, 2448. [Google Scholar] [CrossRef] [PubMed]
- Cook, G.J.; Yip, C.; Siddique, M.; Goh, V.; Chicklore, S.; Roy, A.; Marsden, P.; Ahmad, S.; Landau, D. Are pretreatment 18F-FDG PET tumor textural features in non-small cell lung cancer associated with response and survival after chemoradiotherapy? J. Nucl. Med. 2013, 54, 19–26. [Google Scholar] [CrossRef] [PubMed]
- Lovinfosse, P.; Janvary, Z.L.; Coucke, P.; Jodogne, S.; Bernard, C.; Hatt, M.; Visvikis, D.; Jansen, N.; Duysinx, B.; Hustinx, R. FDG PET/CT texture analysis for predicting the outcome of lung cancer treated by stereotactic body radiation therapy. Eur. J. Nucl. Med. Mol. Imaging 2016, 43, 1453–1460. [Google Scholar] [CrossRef]
- Park, S.; Ha, S.; Lee, S.H.; Paeng, J.C.; Keam, B.; Kim, T.M.; Dong-Wan Kim, D.W.; Heo, D.S. Intratumoral heterogeneity characterized by pretreatment PET in non-small cell lung cancer patients predicts progression-free survival on EGFR tyrosine kinase inhibitor. PLoS ONE 2018, 13, e0189766. [Google Scholar] [CrossRef] [PubMed]
- Tixier, F.; Hatt, M.; Valla, C.; Fleury, V.; Lamour, C.; Ezzouhri, S.; Ingrand, P.; Perdrisot, R.; Visvikis, D.; Le Rest, C.C. Visual versus quantitative assessment of intratumor 18F-FDG PET uptake heterogeneity: Prognostic value in non-small cell lung cancer. J. Nucl. Med. 2014, 55, 1235–1241. [Google Scholar] [CrossRef] [PubMed]
- Alves, A.F.; Souza, S.A.; Ruiz, R.L.; Reis, T.A.; Ximenes, A.M.; Hasimoto, E.N.; Lima, R.P.S.; Miranda, J.R.A.; Pina, D.R. Combining machine learning and texture analysis to differentiate mediastinal lymph nodes in lung cancer patients. Phys. Eng. Sci. Med. 2021, 44, 387–394. [Google Scholar] [CrossRef]
- Gao, X.; Chu, C.; Li, Y.; Lu, P.; Wang, W.; Liu, W.; Yu, L. The method and efficacy of support vector machine classifiers based on texture features and multi-resolution histogram from 18F-FDG PET-CT images for the evaluation of mediastinal lymph nodes in patients with lung cancer. Eur. J. Radiol. 2015, 84, 312–317. [Google Scholar] [CrossRef]
- Wu, J.; Aguilera, T.; Shultz, D.; Gudur, M.; Rubin, D.L.; Loo, B.W., Jr.; Diehn, M.; Li, R. Early-stage non-small cell lung cancer: Quantitative imaging characteristics of (18)F fluorodeoxyglucose PET/CT allow prediction of distant metastasis. Radiology 2016, 281, 270–278. [Google Scholar] [CrossRef]
- Manafi-Farid, R.; Askari, E.; Shiri, I.; Pirich, C.; Asadi, M.; Khater, M.; Zaidi, H.; Beheshti, M. [18F]FDG-PET/CT Radiomics and Artificial Intelligence in Lung Cancer: Technical Aspects and Potential Clinical Applications. Semin. Nucl. Med. 2022, 52, 759–780. [Google Scholar] [CrossRef]
- Tau, N.; Stundzia, A.; Yasufuku, K.; Hussey, D.; Metser, U. Convolutional neural networks in predicting nodal and distant metastatic potential of newly diagnosed non-small cell lung cancer on FDG PET images. AJR Am. J. Roentgenol. 2020, 215, 192–197. [Google Scholar] [CrossRef] [PubMed]
- Nioche, C.; Orlhac, F.; Boughdad, S.; Reuzé, S.; Goya-Outi, J.; Robert, C.; Pellot-Barakat, C.; Soussan, M.; Frouin, F.; Buvat, I. LIFEx: A freeware for radiomic feature calculation in multimodality imaging to accelerate advances in the characterization of tumor heterogeneity. Cancer Res. 2018, 78, 4786–4789. [Google Scholar] [CrossRef]
- Pellegrino, S.; Fonti, R.; Mazziotti, E.; Piccin, L.; Mozzillo, E.; Damiano, V.; Matano, E.; De Placido, S.; Del Vecchio, S. Total metabolic tumor volume by 18F-FDG PET/CT for the prediction of outcome in patients with non-small cell lung cancer. Ann. Nucl. Med. 2019, 33, 937–944. [Google Scholar] [CrossRef] [PubMed]
- Im, H.J.; Pak, K.; Cheon, G.J.; Kang, K.W.; Kim, S.J.; Kim, I.J.; Chung, J.K.; Kim, E.E.; Lee, D.S. Prognostic value of volumetric parameters of (18)F-FDG PET in non-small-cell lung cancer: A meta-analysis. Eur. J. Nucl. Med. Mol. Imaging 2015, 42, 241–251. [Google Scholar] [CrossRef] [PubMed]
- Pellegrino, S.; Fonti, R.; Pulcrano, A.; Del Vecchio, S. PET-based volumetric biomarkers for risk stratification of non-small cell lung cancer patients. Diagnostics 2021, 11, 210. [Google Scholar] [CrossRef]
- Uribe, C.F.; Mathotaarachchi, S.; Gaudet, V.; Smith, K.C.; Rosa-Neto, P.; Benard, F.; Black, S.E.; Zukotynski, K. Machine Learning in Nuclear Medicine: Part 1—Introduction. J. Nucl. Med. 2019, 60, 451–458. [Google Scholar] [CrossRef]
- Zukotynski, K.; Gaudet, V.; Uribe, C.F.; Mathotaarachchi, S.; Smith, K.C.; Rosa-Neto, P.; Benard, F.; Black, S.E. Machine Learning in Nuclear Medicine: Part 2—Neural Networks and Clinical Aspects. J. Nucl. Med. 2021, 62, 22–29. [Google Scholar] [CrossRef]
- Lambin, P.; Leijenaar, R.T.H.; Deist, T.M.; Peerlings, J.; de Jong, E.E.C.; van Timmeren, J.; Sanduleanu, S.; Larue, R.T.H.M.; Even, A.J.G.; Jochems, A.; et al. Radiomics: The bridge between medical imaging and personalized medicine. Nat. Rev. Clin. Oncol. 2017, 14, 749–762. [Google Scholar] [CrossRef]
- Gupta, B.; Rawat, A.; Jain, A.; Arora, A.; Dhami, N. Analysis of Various Decision Tree Algorithms for Classification in Data Mining. Int. J. Comput. Appl. 2017, 163, 15–19. [Google Scholar] [CrossRef]
- Gardner-Lubbe, S. Linear discriminant analysis for multiple functional data analysis. J. Appl. Stat. 2021, 48, 1917–1933. [Google Scholar] [CrossRef]
- Lowd, D.; Domingos, P. Naive Bayes models for probability estimation. In Proceedings of the ICML ‘05: 22nd International Conference on Machine Learning, Bonn, Germany, 7–11 August 2005; pp. 529–536. [Google Scholar] [CrossRef]
- Uddin, S.; Haque, I.; Lu, H.; Moni, M.A.; Gide, E. Comparative performance analysis of K-nearest neighbour (KNN) algorithm and its different variants for disease prediction. Sci. Rep. 2022, 12, 6256. [Google Scholar] [CrossRef]
- Teso-Fz-Betono, A.; Zulueta, E.; Cabezas-Olivenza, M.; Teso-Fz-Betono, A.; Fernandez-Gamiz, U. A Study of Learning Issues in Feedforward Neural Networks. Mathematics 2022, 10, 3206. [Google Scholar] [CrossRef]
- Sarkar, J.P.; Saha, I.; Sarkar, A.; Maulik, U. Machine learning integrated ensemble of feature selection methods followed by survival analysis for predicting breast cancer subtype specific miRNA biomarkers. Comput. Biol. Med. 2021, 131, 104244. [Google Scholar] [CrossRef] [PubMed]
- Chang, C.; Ruan, M.; Lei, B.; Yu, H.; Zhao, W.; Ge, Y.; Duan, S.; Teng, W.; Wu, Q.; Qian, X.; et al. Development of a PET/CT molecular radiomics-clinical model to predict thoracic lymph node metastasis of invasive lung adenocarcinoma ≤ 3 cm in diameter. EJNMMI Res. 2022, 12, 23. [Google Scholar] [CrossRef] [PubMed]
- Yoo, J.; Cheon, M.; Park, Y.J.; Hyun, S.H.; Zo, J.I.; Um, S.W.; Won, H.H.; Lee, K.H.; Kim, B.T.; Choi, J.Y. Machine learning-based diagnostic method of pre-therapeutic 18F-FDG PET/CT for evaluating mediastinal lymph nodes in non-small cell lung cancer. Eur. Radiol. 2021, 31, 4184–4194. [Google Scholar] [CrossRef]
- Wang, H.; Zhou, Z.; Li, Y.; Chen, Z.; Lu, P.; Wang, W.; Liu, W.; Yu, L. Comparison of machine learning methods for classifying mediastinal lymph node metastasis of non-small cell lung cancer from 18F-FDG PET/CT images. EJNMMI Res. 2017, 7, 11. [Google Scholar] [CrossRef]
- Guberina, M.; Herrmann, K.; Pöttgen, C.; Guberina, N.; Hautzel, H.; Gauler, T.; Ploenes, T.; Umutlu, L.; Wetter, A.; Theegarten, D.; et al. Prediction of malignant lymph nodes in NSCLC by machine learning classifiers using EBUS TBNA and PET/CT. Sci. Rep. 2022, 12, 17511. [Google Scholar] [CrossRef]
- Zhong, Y.; Cai, C.; Chen, T.; Gui, H.; Deng, J.; Yang, M.; Yu, B.; Song, Y.; Wang, T.; Sun, X.; et al. PET/CT based cross-modal deep learning signature to predict occult nodal metastasis in lung cancer. Nat. Commun. 2023, 14, 7513. [Google Scholar] [CrossRef]


| Characteristic | Overall | Training Cohort | Final Testing Cohort |
|---|---|---|---|
| Patients | 79 | 44 | 35 |
| Age | |||
| Mean ± SD | 65 ± 12 | 64 ± 13 | 67 ± 10 |
| Range | 38–86 | 38–86 | 41–71 |
| Gender | |||
| Male | 54 | 29 | 25 |
| Female | 25 | 15 | 10 |
| Histology | |||
| Adenocarcinoma | 38 | 18 | 20 |
| Squamous cell carcinoma | 20 | 12 | 8 |
| Large cell carcinoma | 3 | 2 | 1 |
| Not otherwise specified | 18 | 12 | 6 |
| TNM stage | |||
| Stage III | 26 | 11 | 15 |
| Stage IV | 53 | 33 | 20 |
| Treatment | |||
| Chemotherapy | 46 | 30 | 16 |
| Chemoradiotherapy | 3 | 3 | |
| Chemotherapy/Immunotherapy | 15 | 3 | 12 |
| No cancer therapy | 15 | 8 | 7 |
| Methods | Mean Accuracy (%) ± SD |
|---|---|
| Decision tree | 71.68 ± 0.89 |
| Linear discriminant analysis | 65.39 ± 1.04 |
| Naïve Bayes classification | 62.05 ± 0.98 |
| Support vector machine | 78.26 ± 0.98 |
| K-nearest neighbor | 63.39 ± 1.07 |
| Feedforward neural network | 66.09 ± 1.01 |
| Fscchi2 | Fscmrmr | Fscnca | Fsrftest | Fsrnca | Fsulaplacian | Relieff |
|---|---|---|---|---|---|---|
| GLCM_ dissimilarity | GLRLM_RP | GLZLM_ LZHGE | GLCM_ dissimilarity | GLZLM_ LZHGE | MTV | Shape sphericity |
| GLCM_energy | TLG | GLRLM_ RLNU | GLCM_energy | GLRLM_ RLNU | SUVmean | GLRLM_ RLNU |
| GLCM_ homogeneity | HISTO_ kurtosis | CoV | GLCM_ homogeneity | CoV | TLG | TLG |
| TLG | CoV | GLRLM_ LRHGE | TLG | GLRLM_ LRHGE | CoV | MTV |
| GLZLM_ SZLGE | Shape sphericity | GLZLM_SZLGE | SUVmax | Shape compacity |
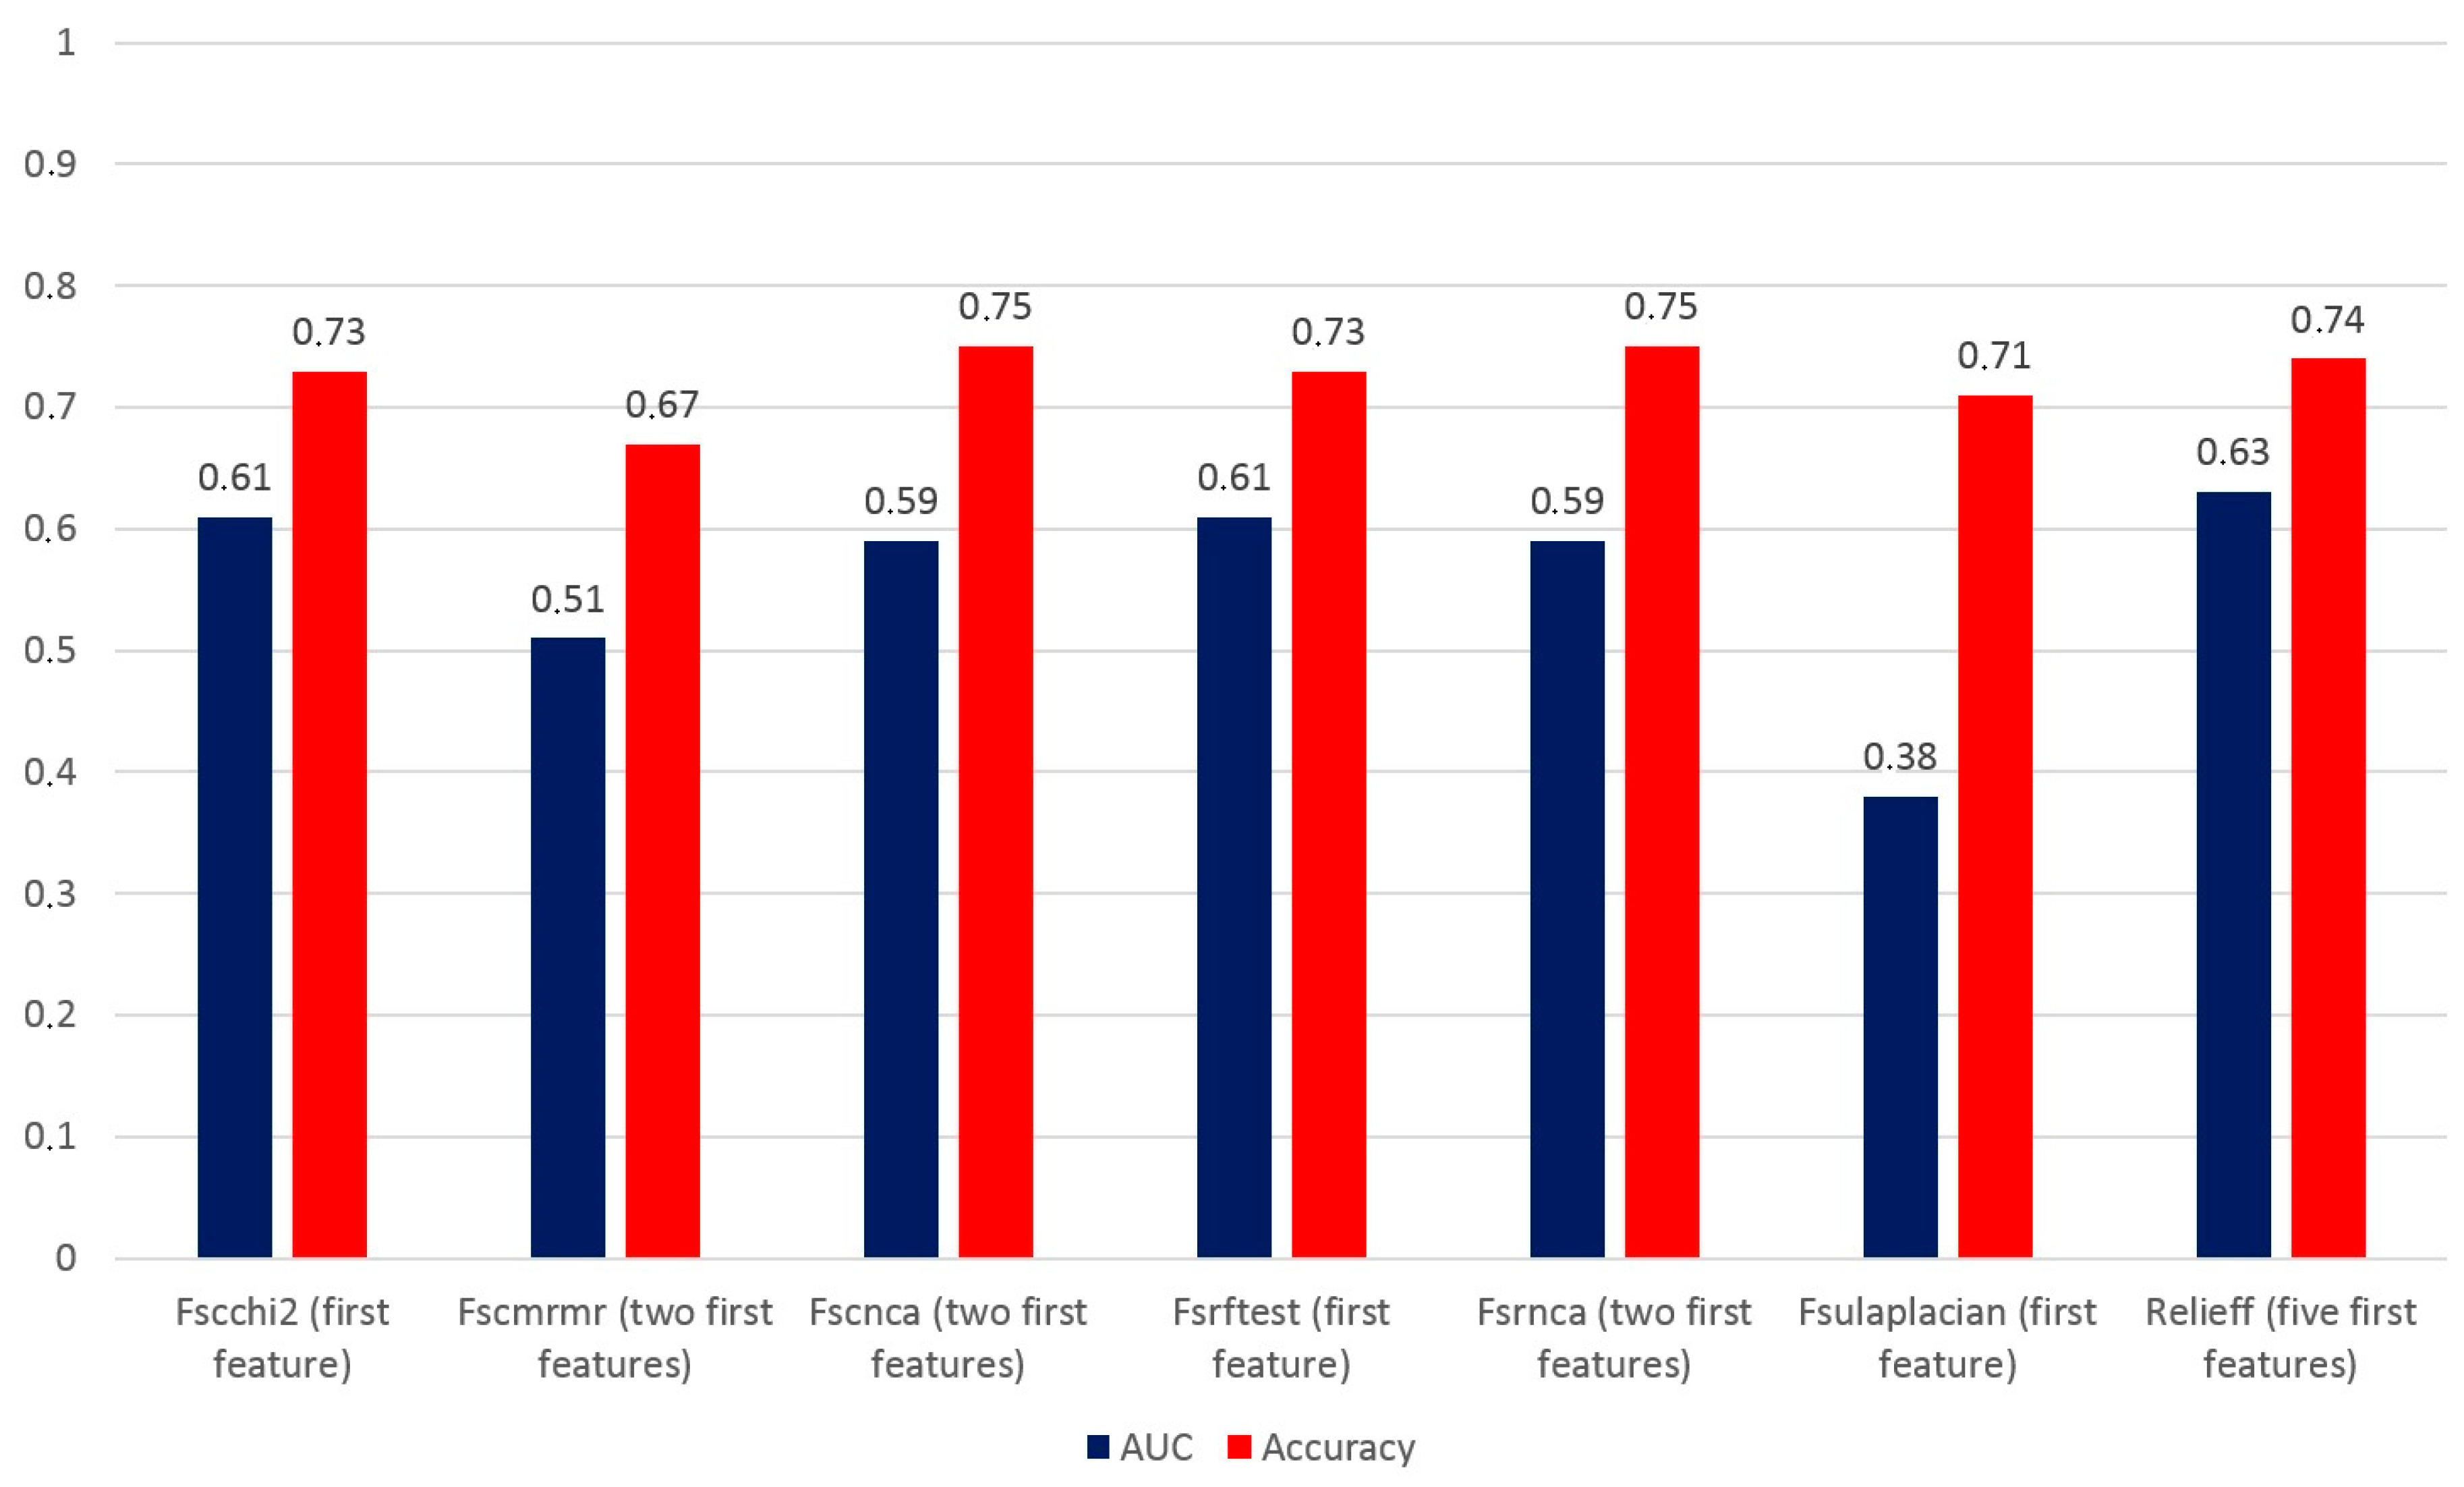
| Number of Combined Features | |||||
| LASSO method | First feature | Two first features | Three first features | Four first features | Five first features |
| Fscchi2 | 74 | 75 | 76 | 82.7 | 79.8 |
| Fscmrmr | 76 | 73.1 | 77.9 | 75 | 74 |
| Fscnca | 77.9 | 78.8 | 72.1 | 71.2 | - |
| Fsrftest | 74 | 75 | 76 | 82.7 | 79.8 |
| Fsrnca | 77.9 | 78.8 | 72.1 | 71.2 | - |
| Fsulaplacian | 75 | 71.2 | 72.1 | 71.2 | 73.1 |
| Relieff | 76.9 | 76.9 | 76 | 77.9 | 76.9 |
| Number of Combined Features | |||||
| LASSO method | First feature | Two first features | Three first features | Four first features | Five first features |
| Fscchi2 | 73.1 | 71.8 | 69.2 | 70.5 | 69.2 |
| Fscmrmr | 66.7 | 67.9 | 60.3 | 65.4 | 65.4 |
| Fscnca | 71.8 | 75.5 | 70.5 | 69.2 | - |
| Fsrftest | 73.1 | 71.8 | 69.2 | 70.5 | 69.2 |
| Fsrnca | 71.8 | 75.5 | 70.5 | 69.2 | - |
| Fsulaplacian | 71.8 | 70.1 | 65.4 | 69.5 | 70.6 |
| Relieff | 69.2 | 73.1 | 73.1 | 71.9 | 74.4 |
Disclaimer/Publisher’s Note: The statements, opinions and data contained in all publications are solely those of the individual author(s) and contributor(s) and not of MDPI and/or the editor(s). MDPI and/or the editor(s) disclaim responsibility for any injury to people or property resulting from any ideas, methods, instructions or products referred to in the content. |
© 2024 by the authors. Licensee MDPI, Basel, Switzerland. This article is an open access article distributed under the terms and conditions of the Creative Commons Attribution (CC BY) license (https://creativecommons.org/licenses/by/4.0/).
Share and Cite
Hakkak Moghadam Torbati, A.; Pellegrino, S.; Fonti, R.; Morra, R.; De Placido, S.; Del Vecchio, S. Machine Learning and Texture Analysis of [18F]FDG PET/CT Images for the Prediction of Distant Metastases in Non-Small-Cell Lung Cancer Patients. Biomedicines 2024, 12, 472. https://doi.org/10.3390/biomedicines12030472
Hakkak Moghadam Torbati A, Pellegrino S, Fonti R, Morra R, De Placido S, Del Vecchio S. Machine Learning and Texture Analysis of [18F]FDG PET/CT Images for the Prediction of Distant Metastases in Non-Small-Cell Lung Cancer Patients. Biomedicines. 2024; 12(3):472. https://doi.org/10.3390/biomedicines12030472
Chicago/Turabian StyleHakkak Moghadam Torbati, Armin, Sara Pellegrino, Rosa Fonti, Rocco Morra, Sabino De Placido, and Silvana Del Vecchio. 2024. "Machine Learning and Texture Analysis of [18F]FDG PET/CT Images for the Prediction of Distant Metastases in Non-Small-Cell Lung Cancer Patients" Biomedicines 12, no. 3: 472. https://doi.org/10.3390/biomedicines12030472
APA StyleHakkak Moghadam Torbati, A., Pellegrino, S., Fonti, R., Morra, R., De Placido, S., & Del Vecchio, S. (2024). Machine Learning and Texture Analysis of [18F]FDG PET/CT Images for the Prediction of Distant Metastases in Non-Small-Cell Lung Cancer Patients. Biomedicines, 12(3), 472. https://doi.org/10.3390/biomedicines12030472