
MicroRNA Expression Profiling—Potential Molecular Discrimination of Papillary Thyroid Carcinoma Subtypes

 , ,
, , 
 ,
,  ,
,  and
and
Abstract
1. Introduction
2. Materials and Methods
2.1. Altered miRNA Pattern in Thyroid Cancer
Case Selection and Tumour Specimen Collection
2.2. Macrodissection and RNA Extraction
2.3. qRT-PCR Experiment
2.4. Functional Analysis
3. Results
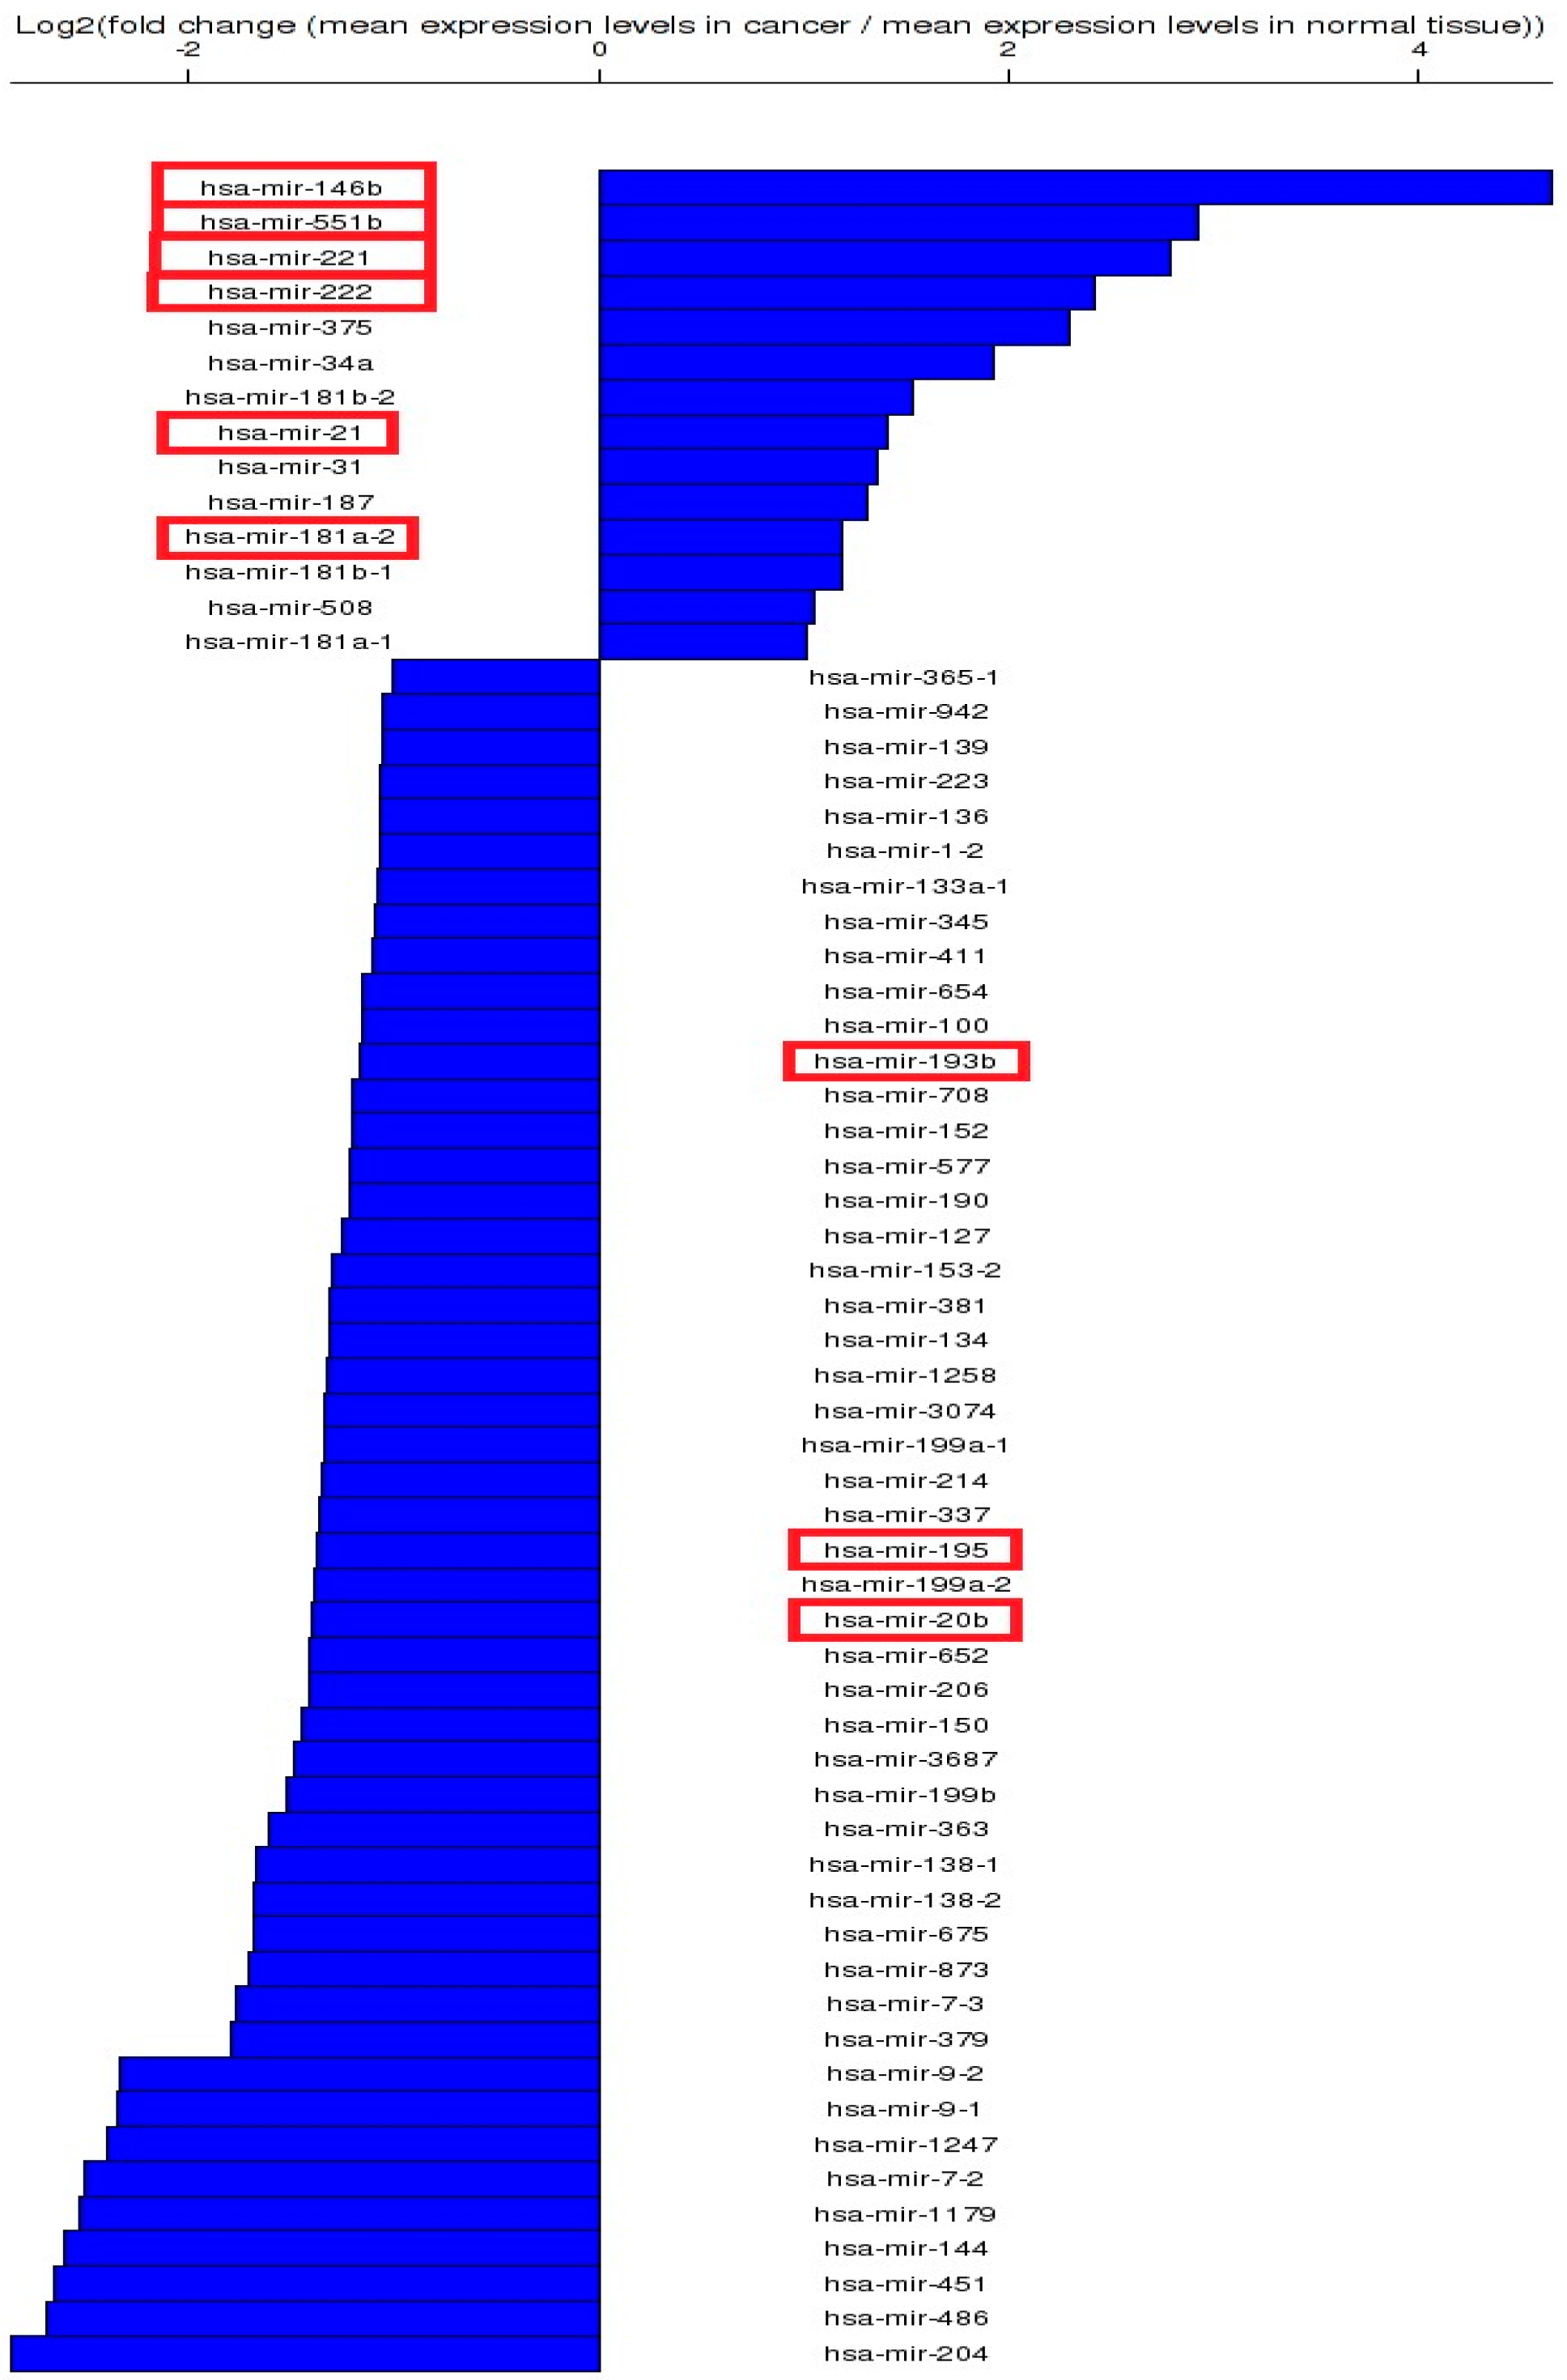
3.1. Altered miRNA Pattern in Thyroid Cancer—TCGA Data
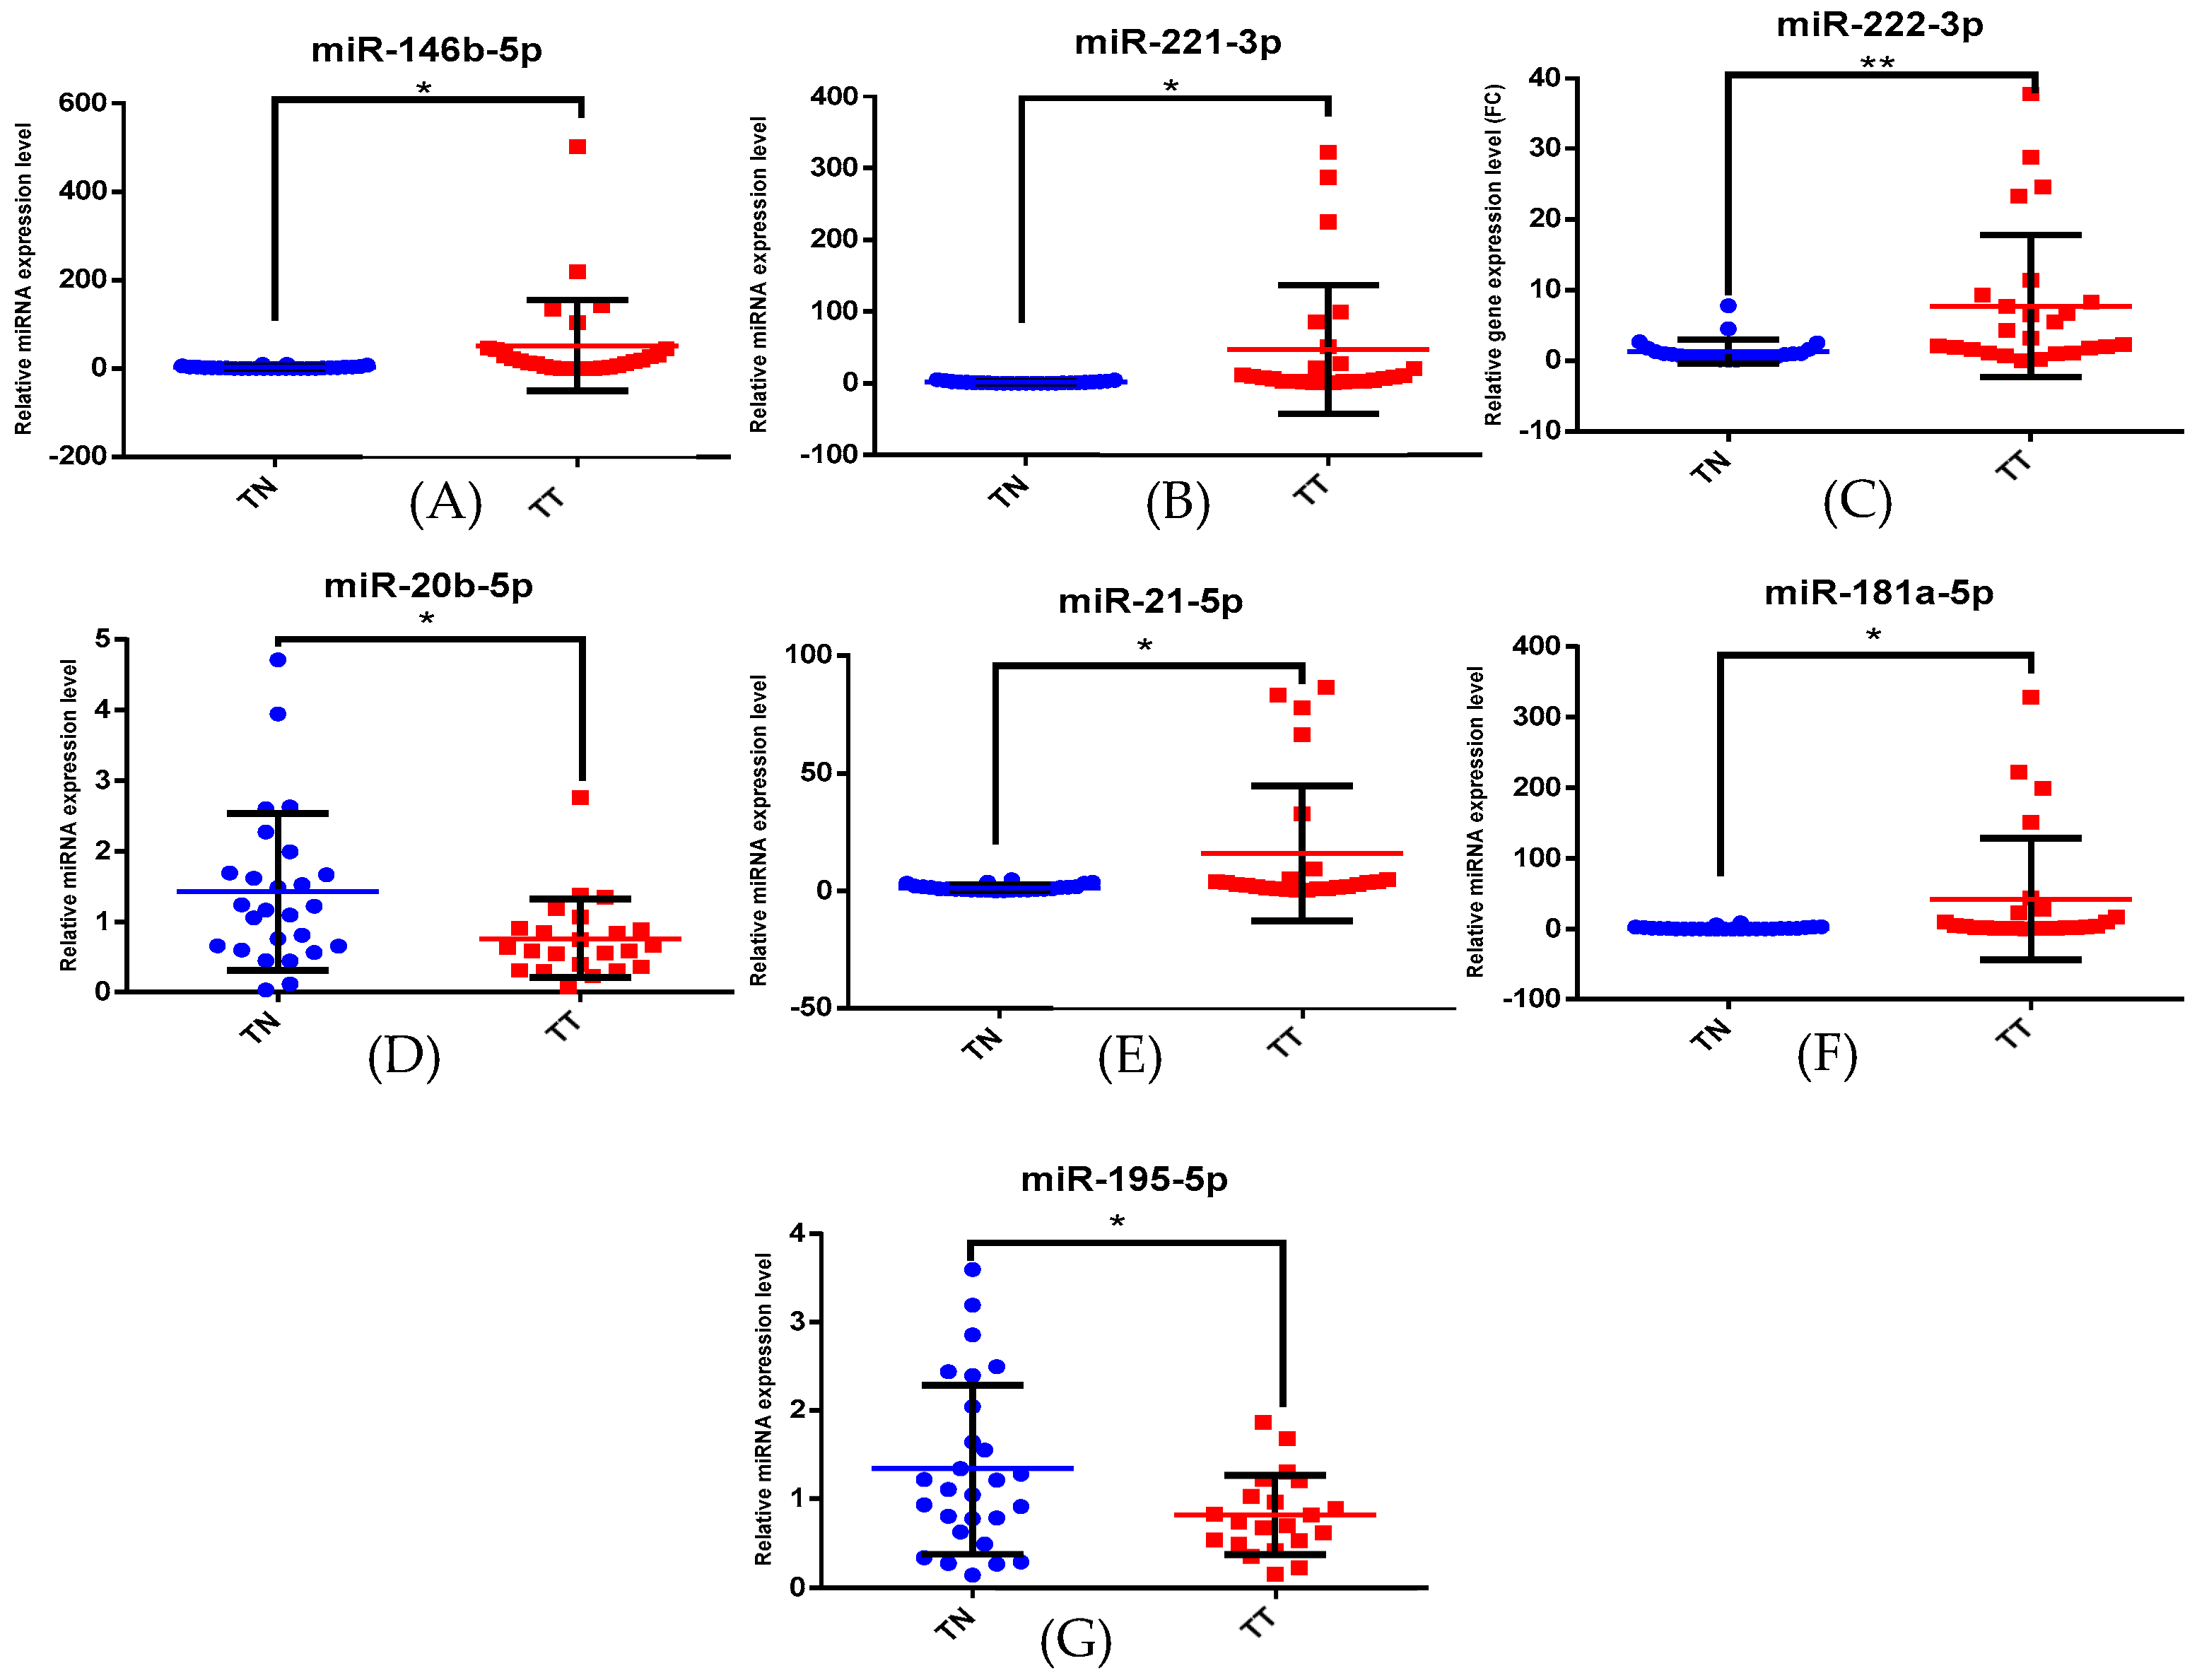
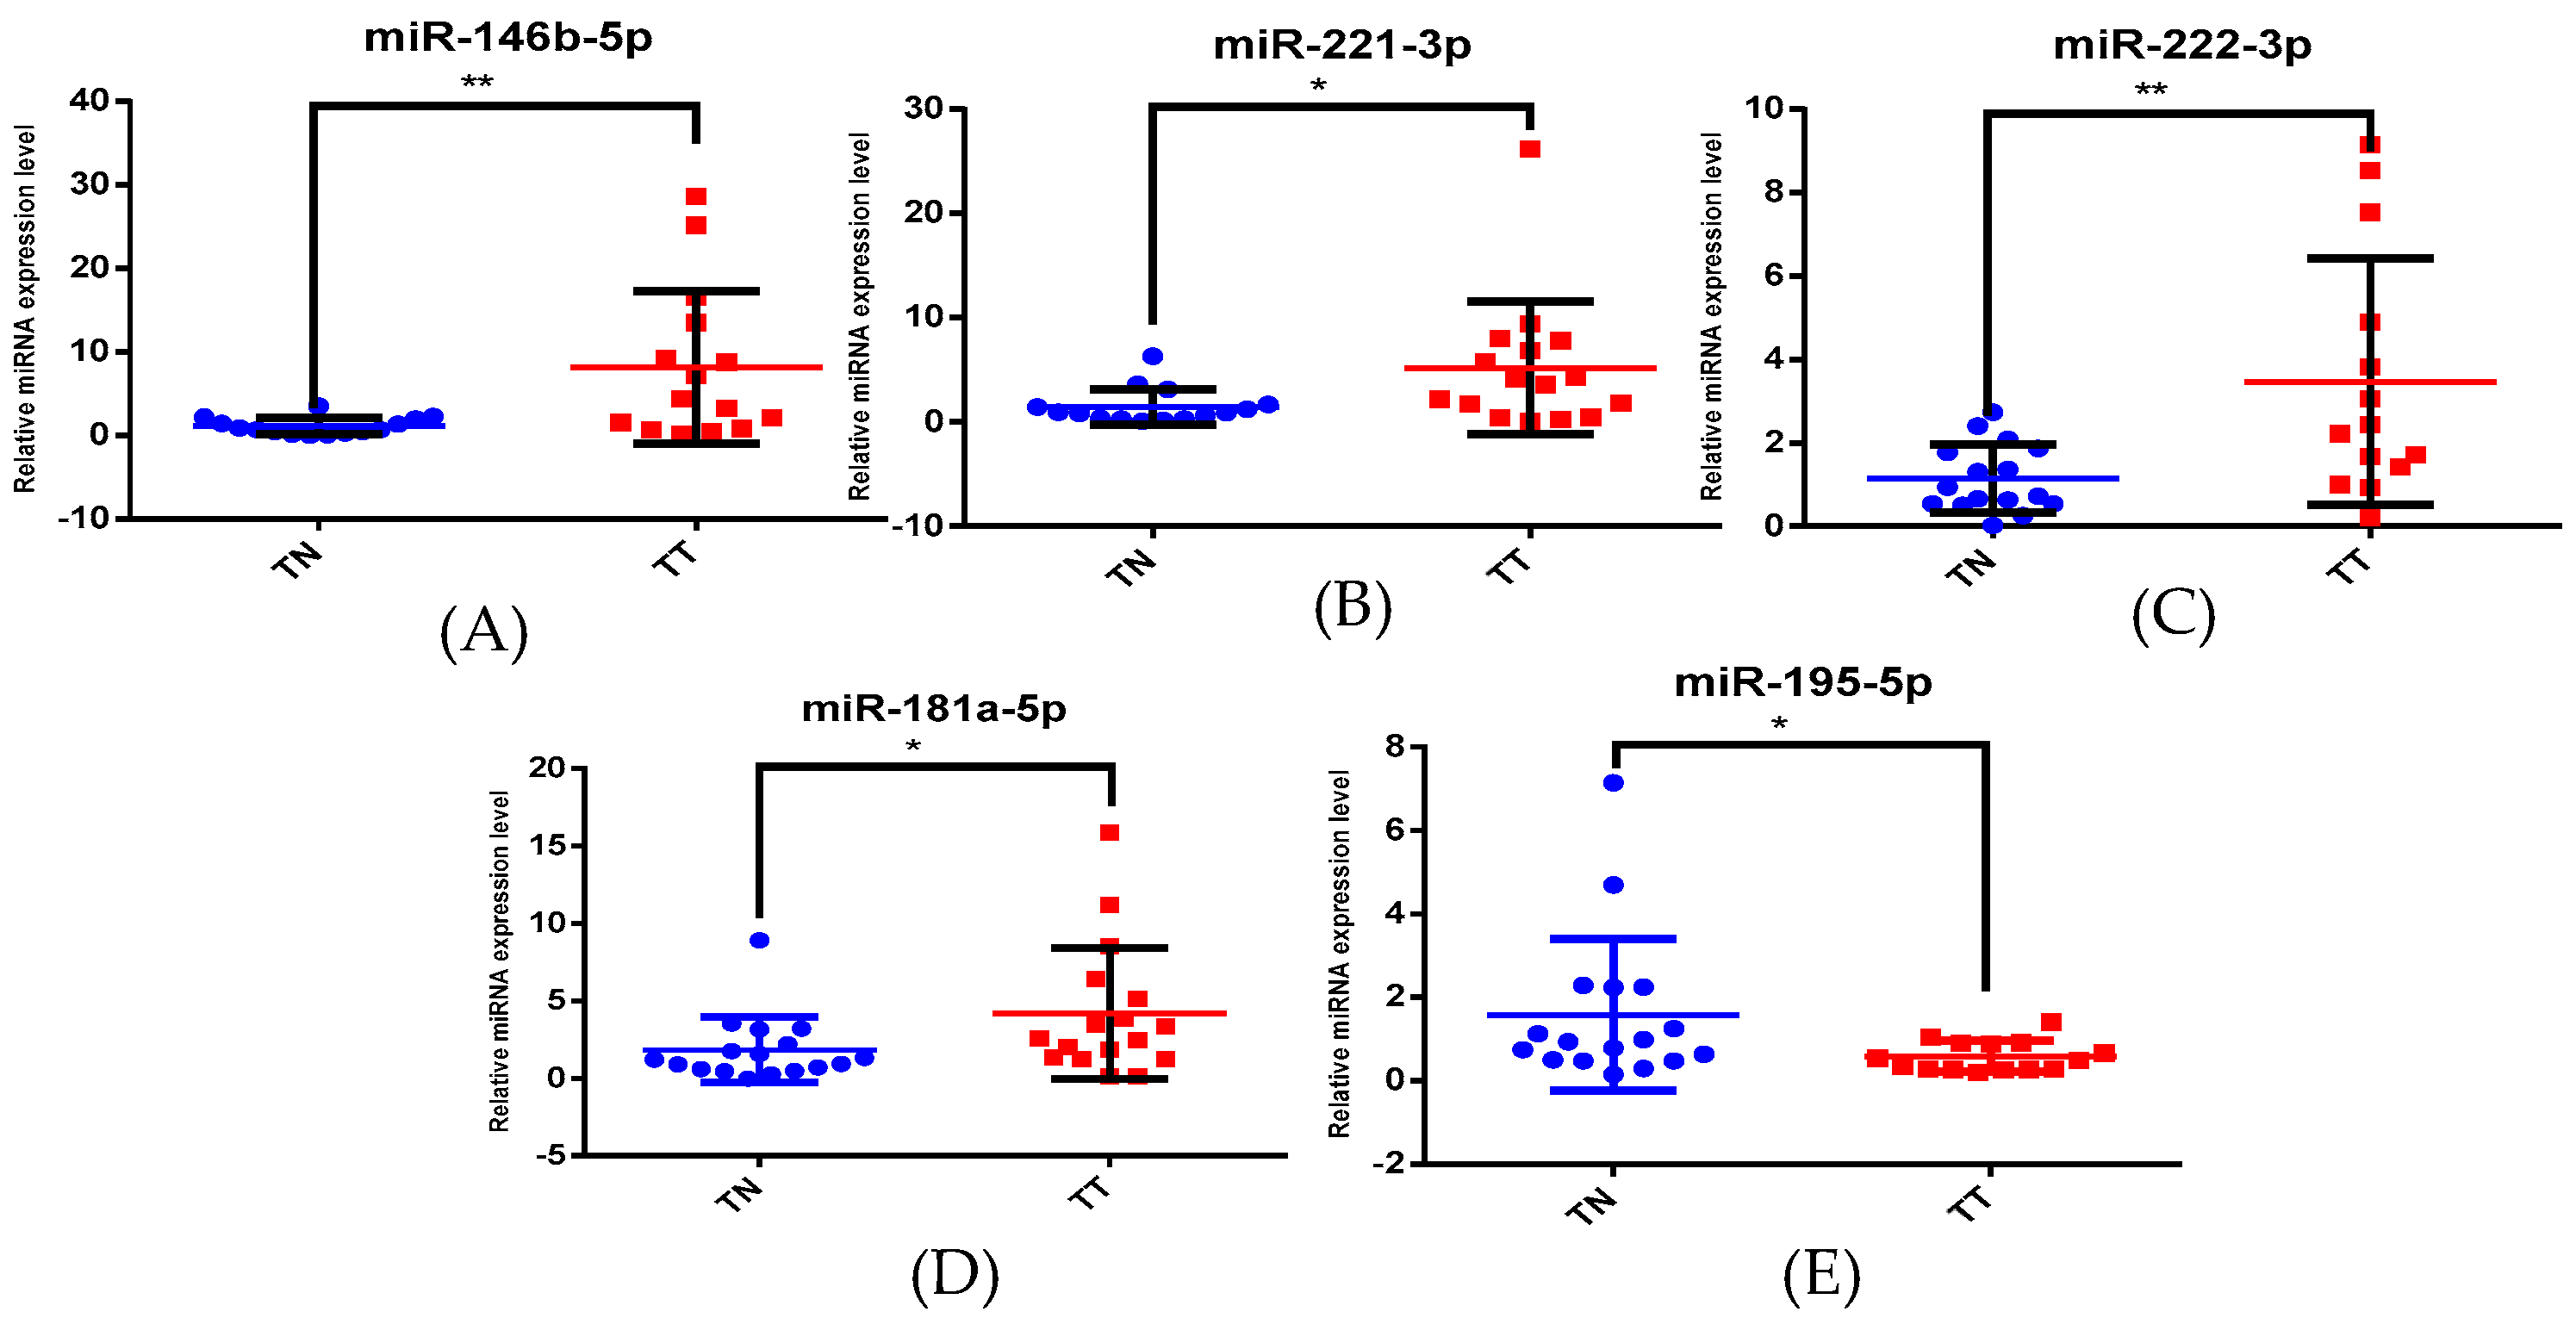
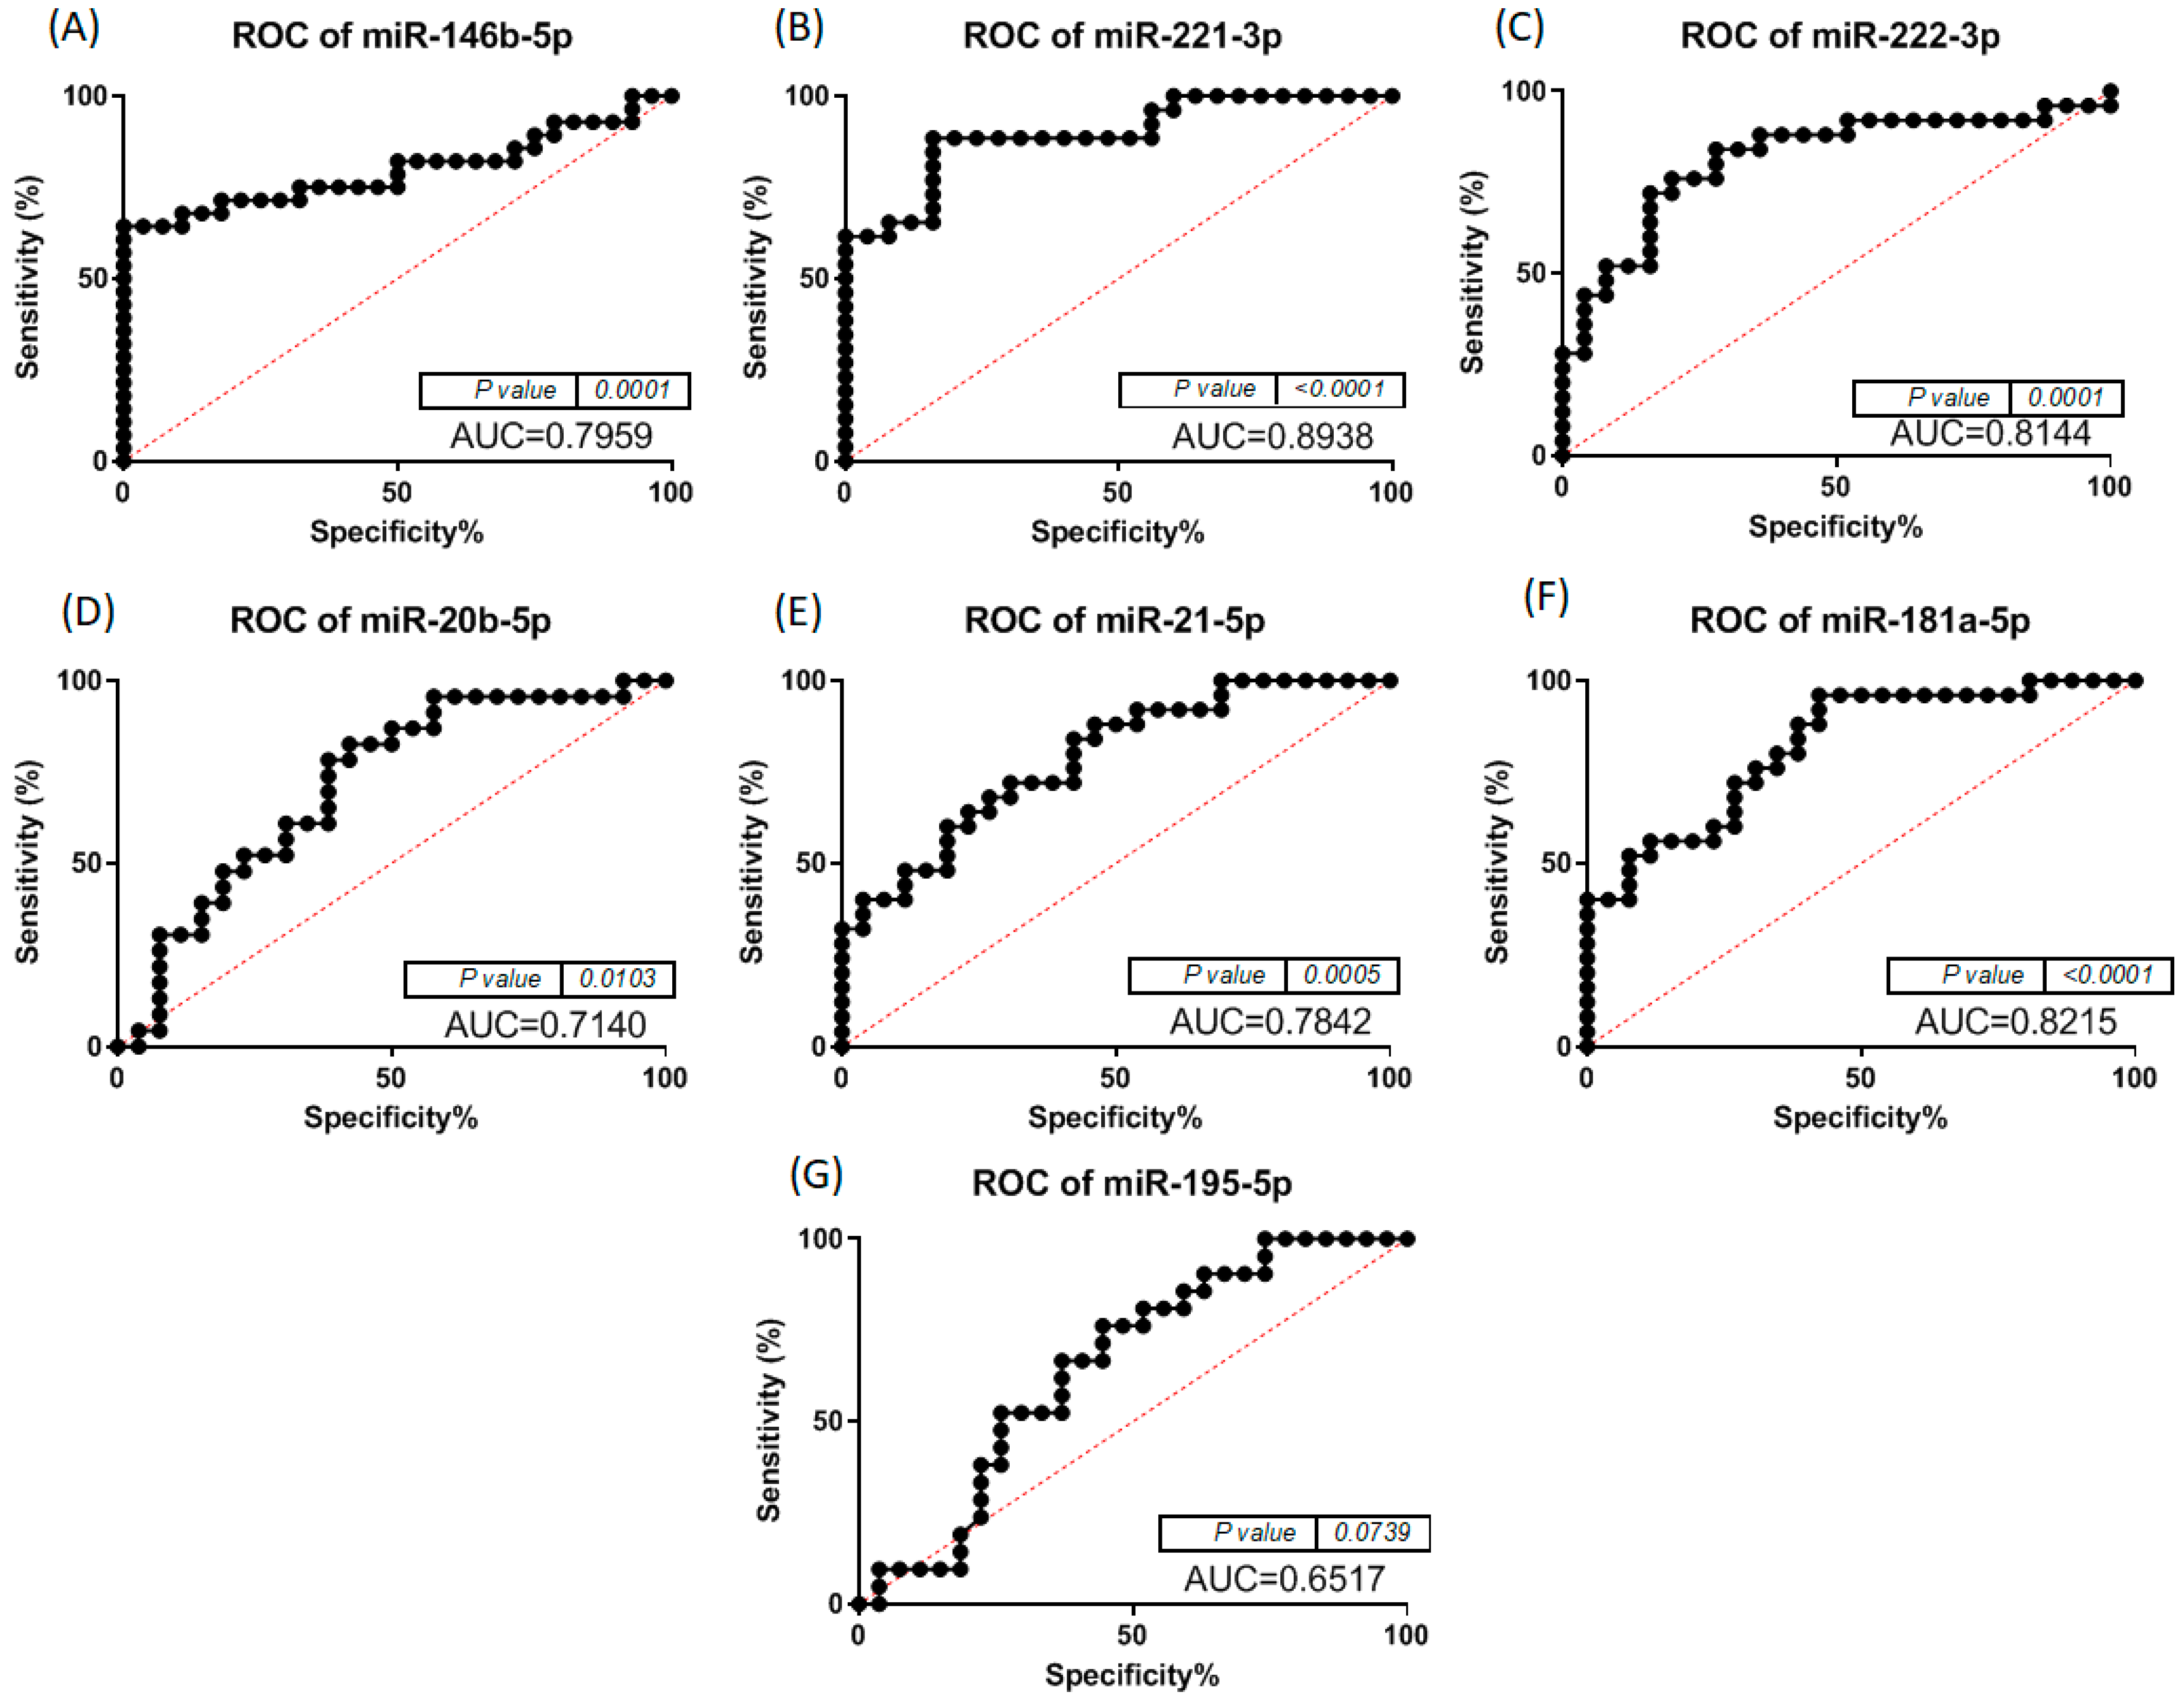
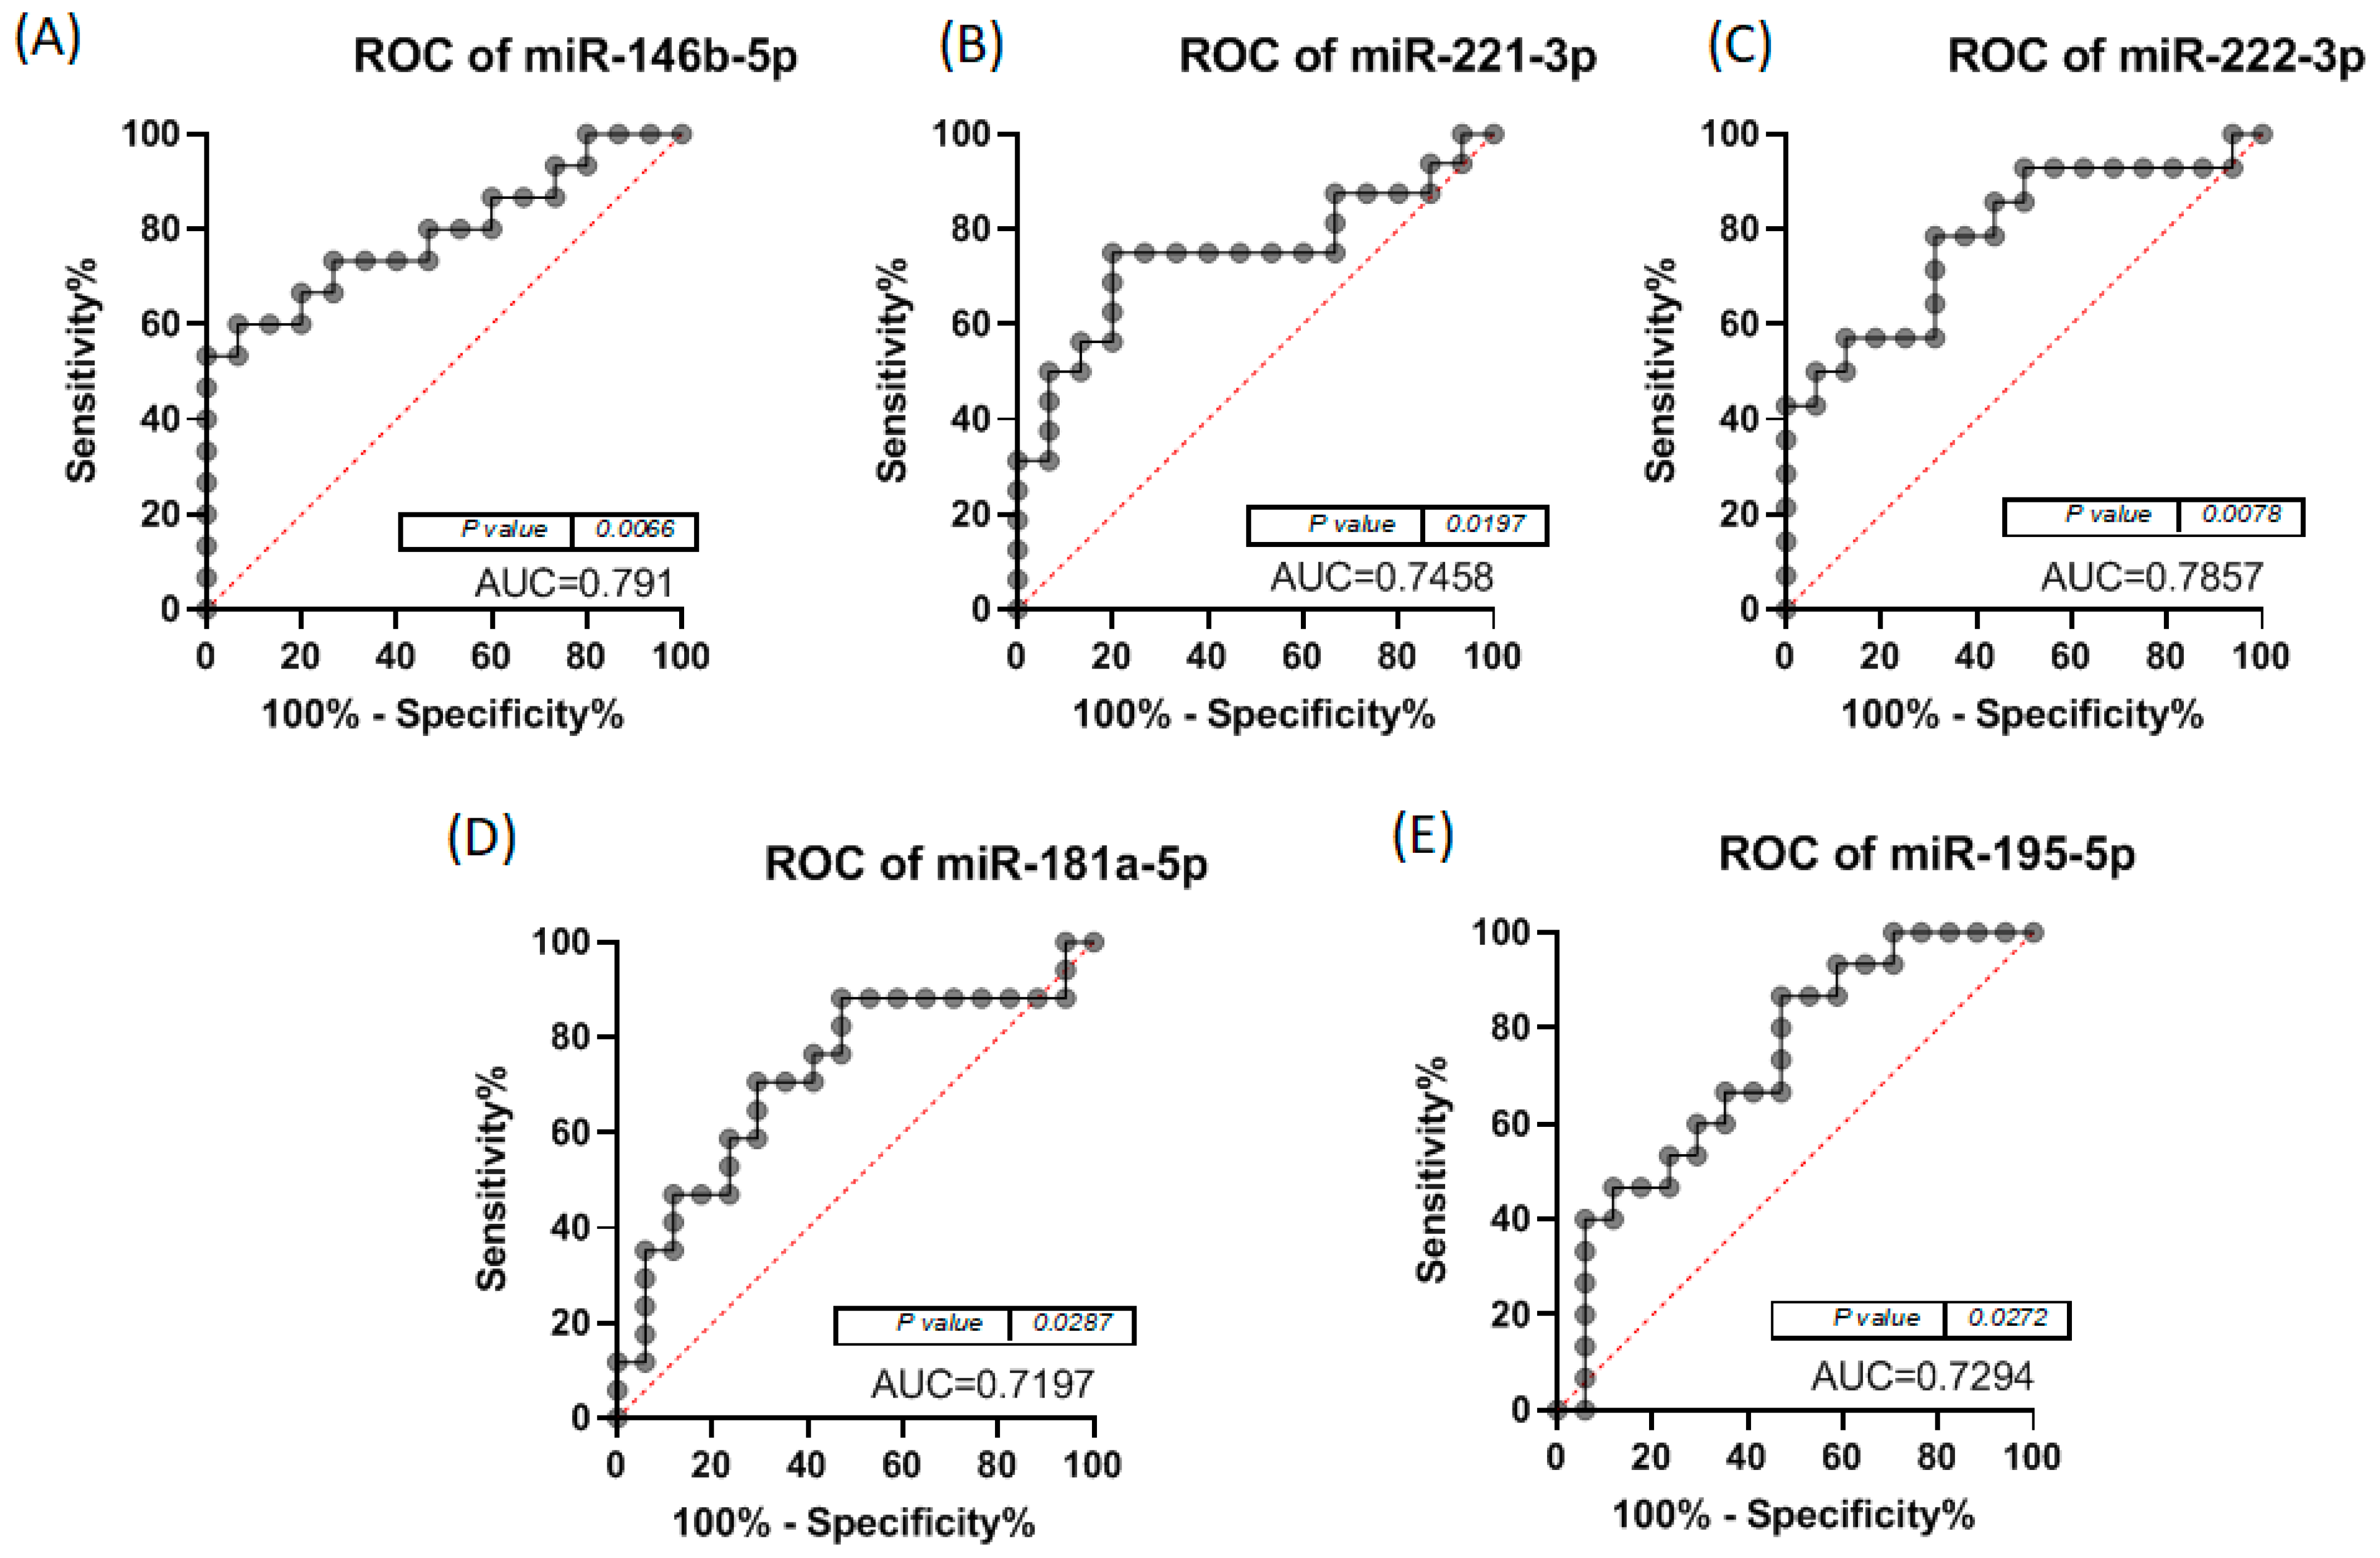
3.2. Altered miRNA Pattern in Thyroid Cancer—Validation Using qRT-PCR
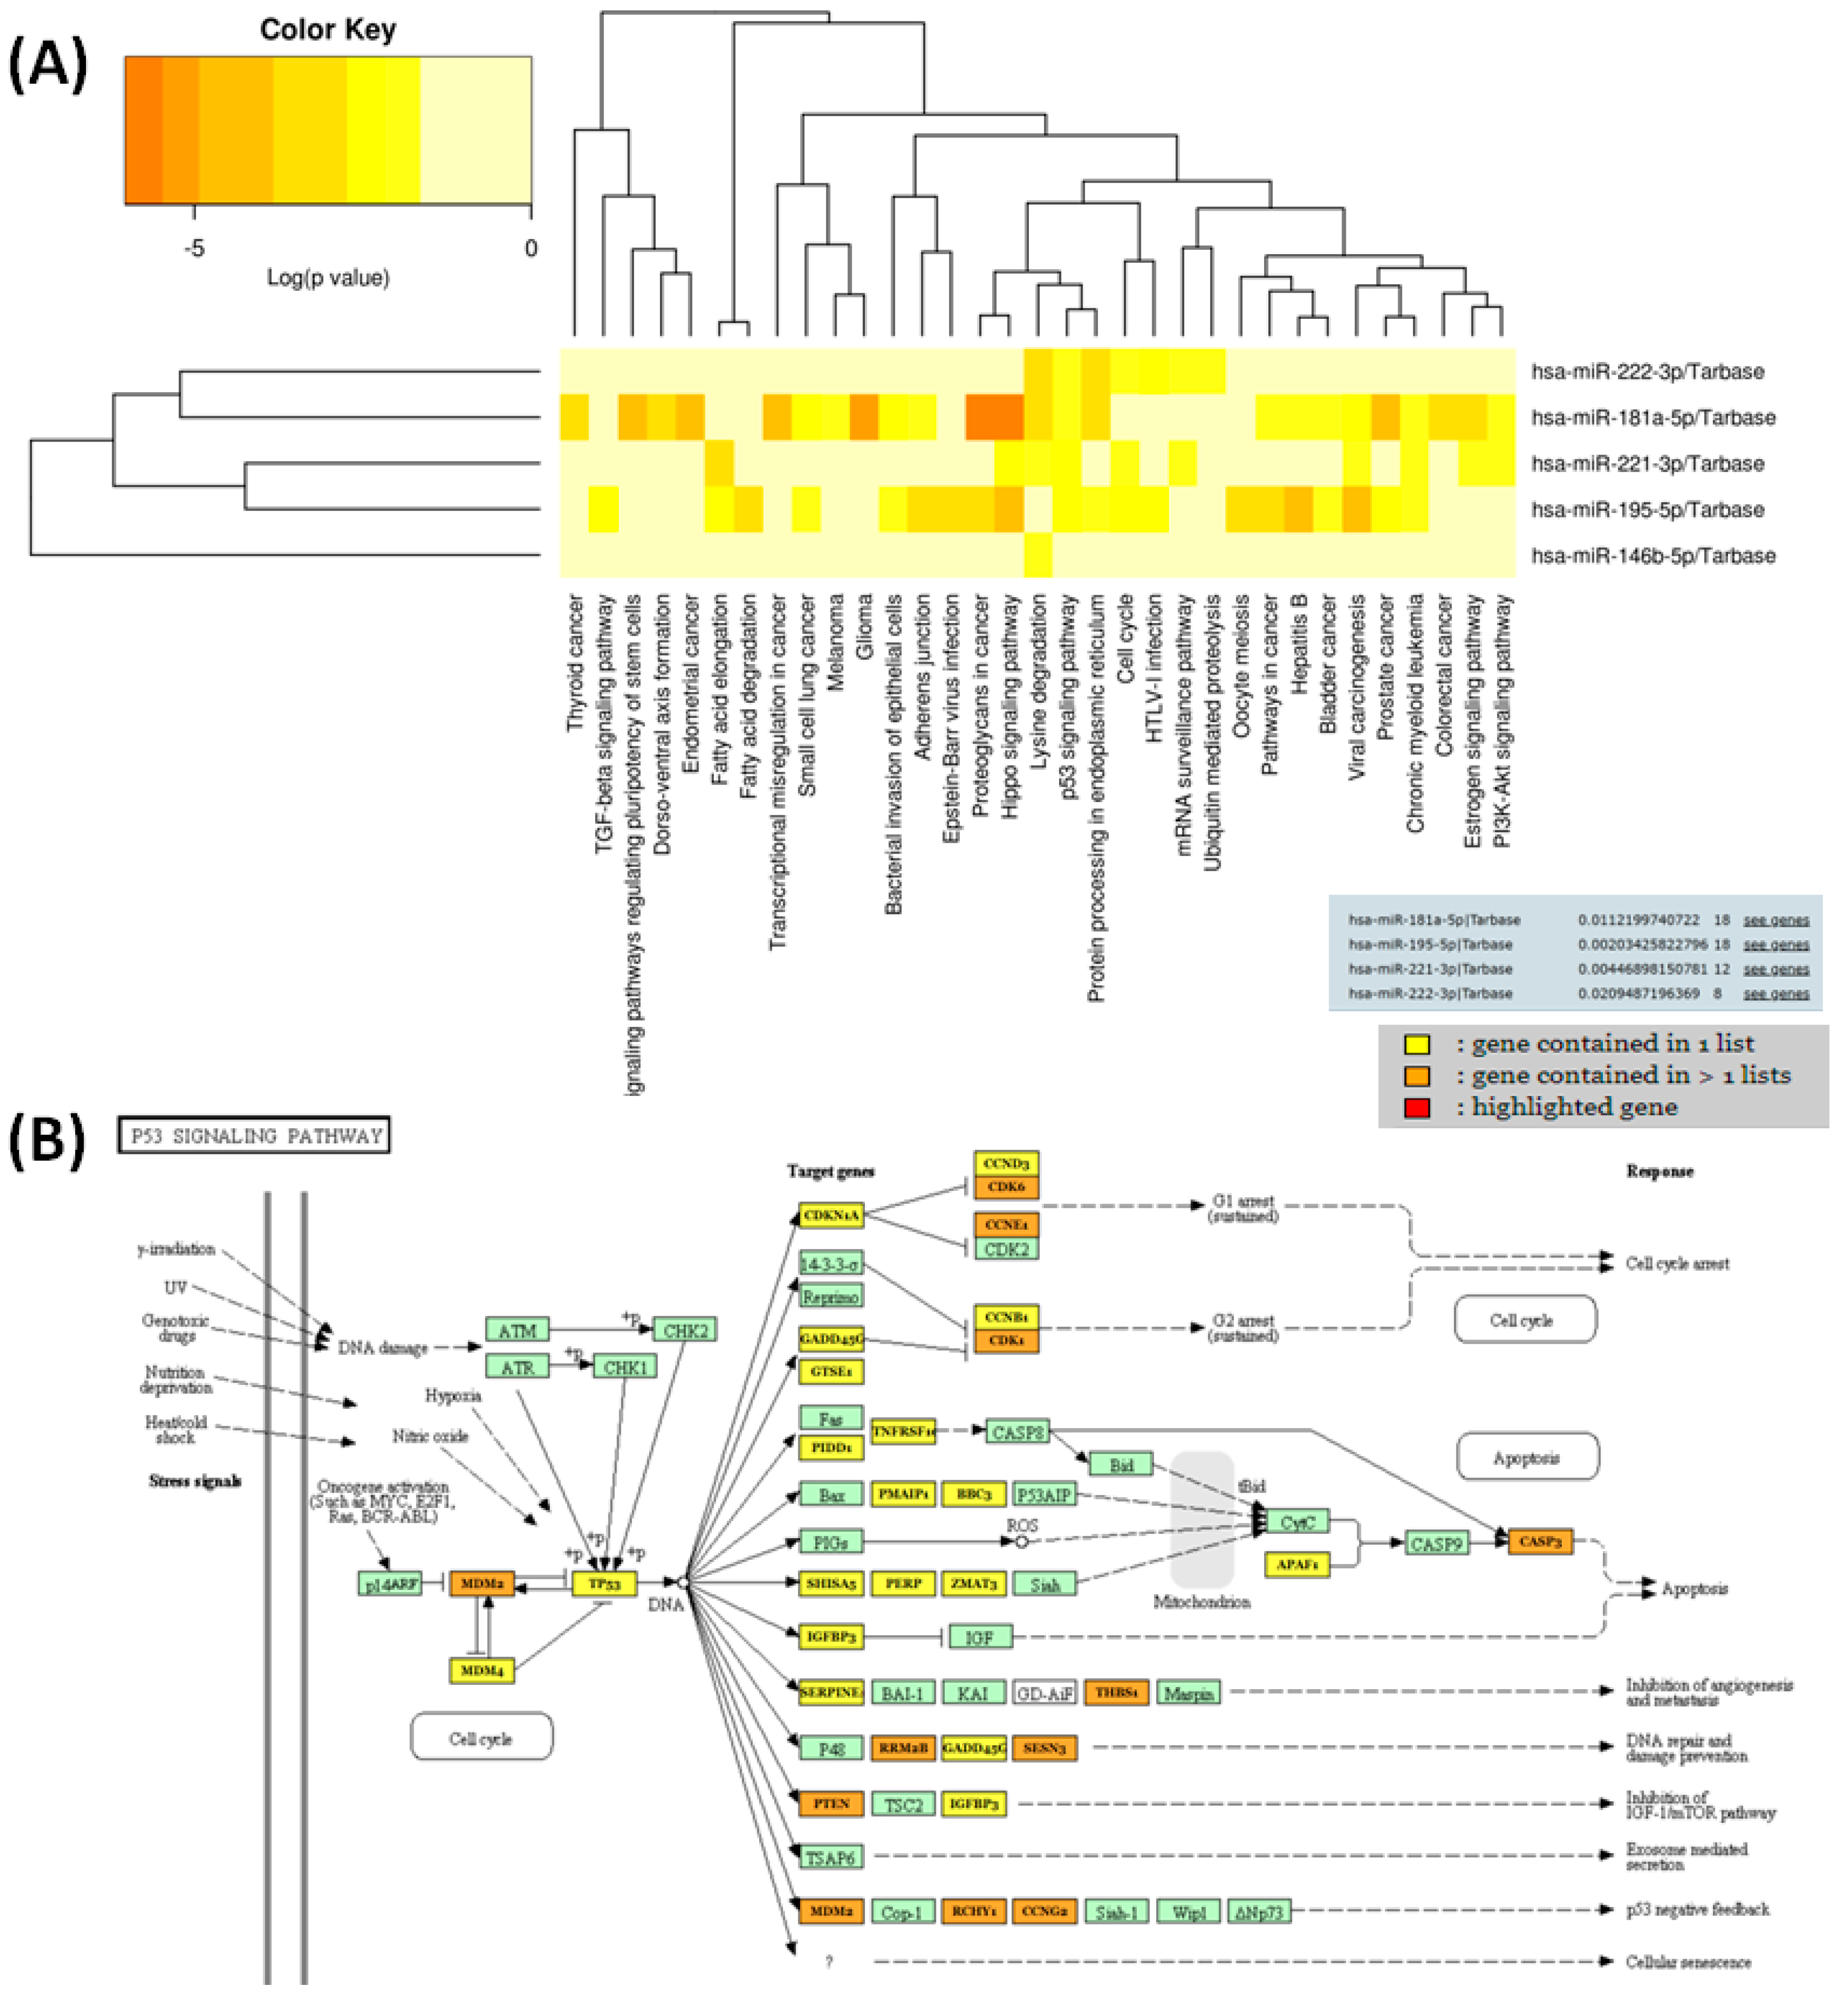
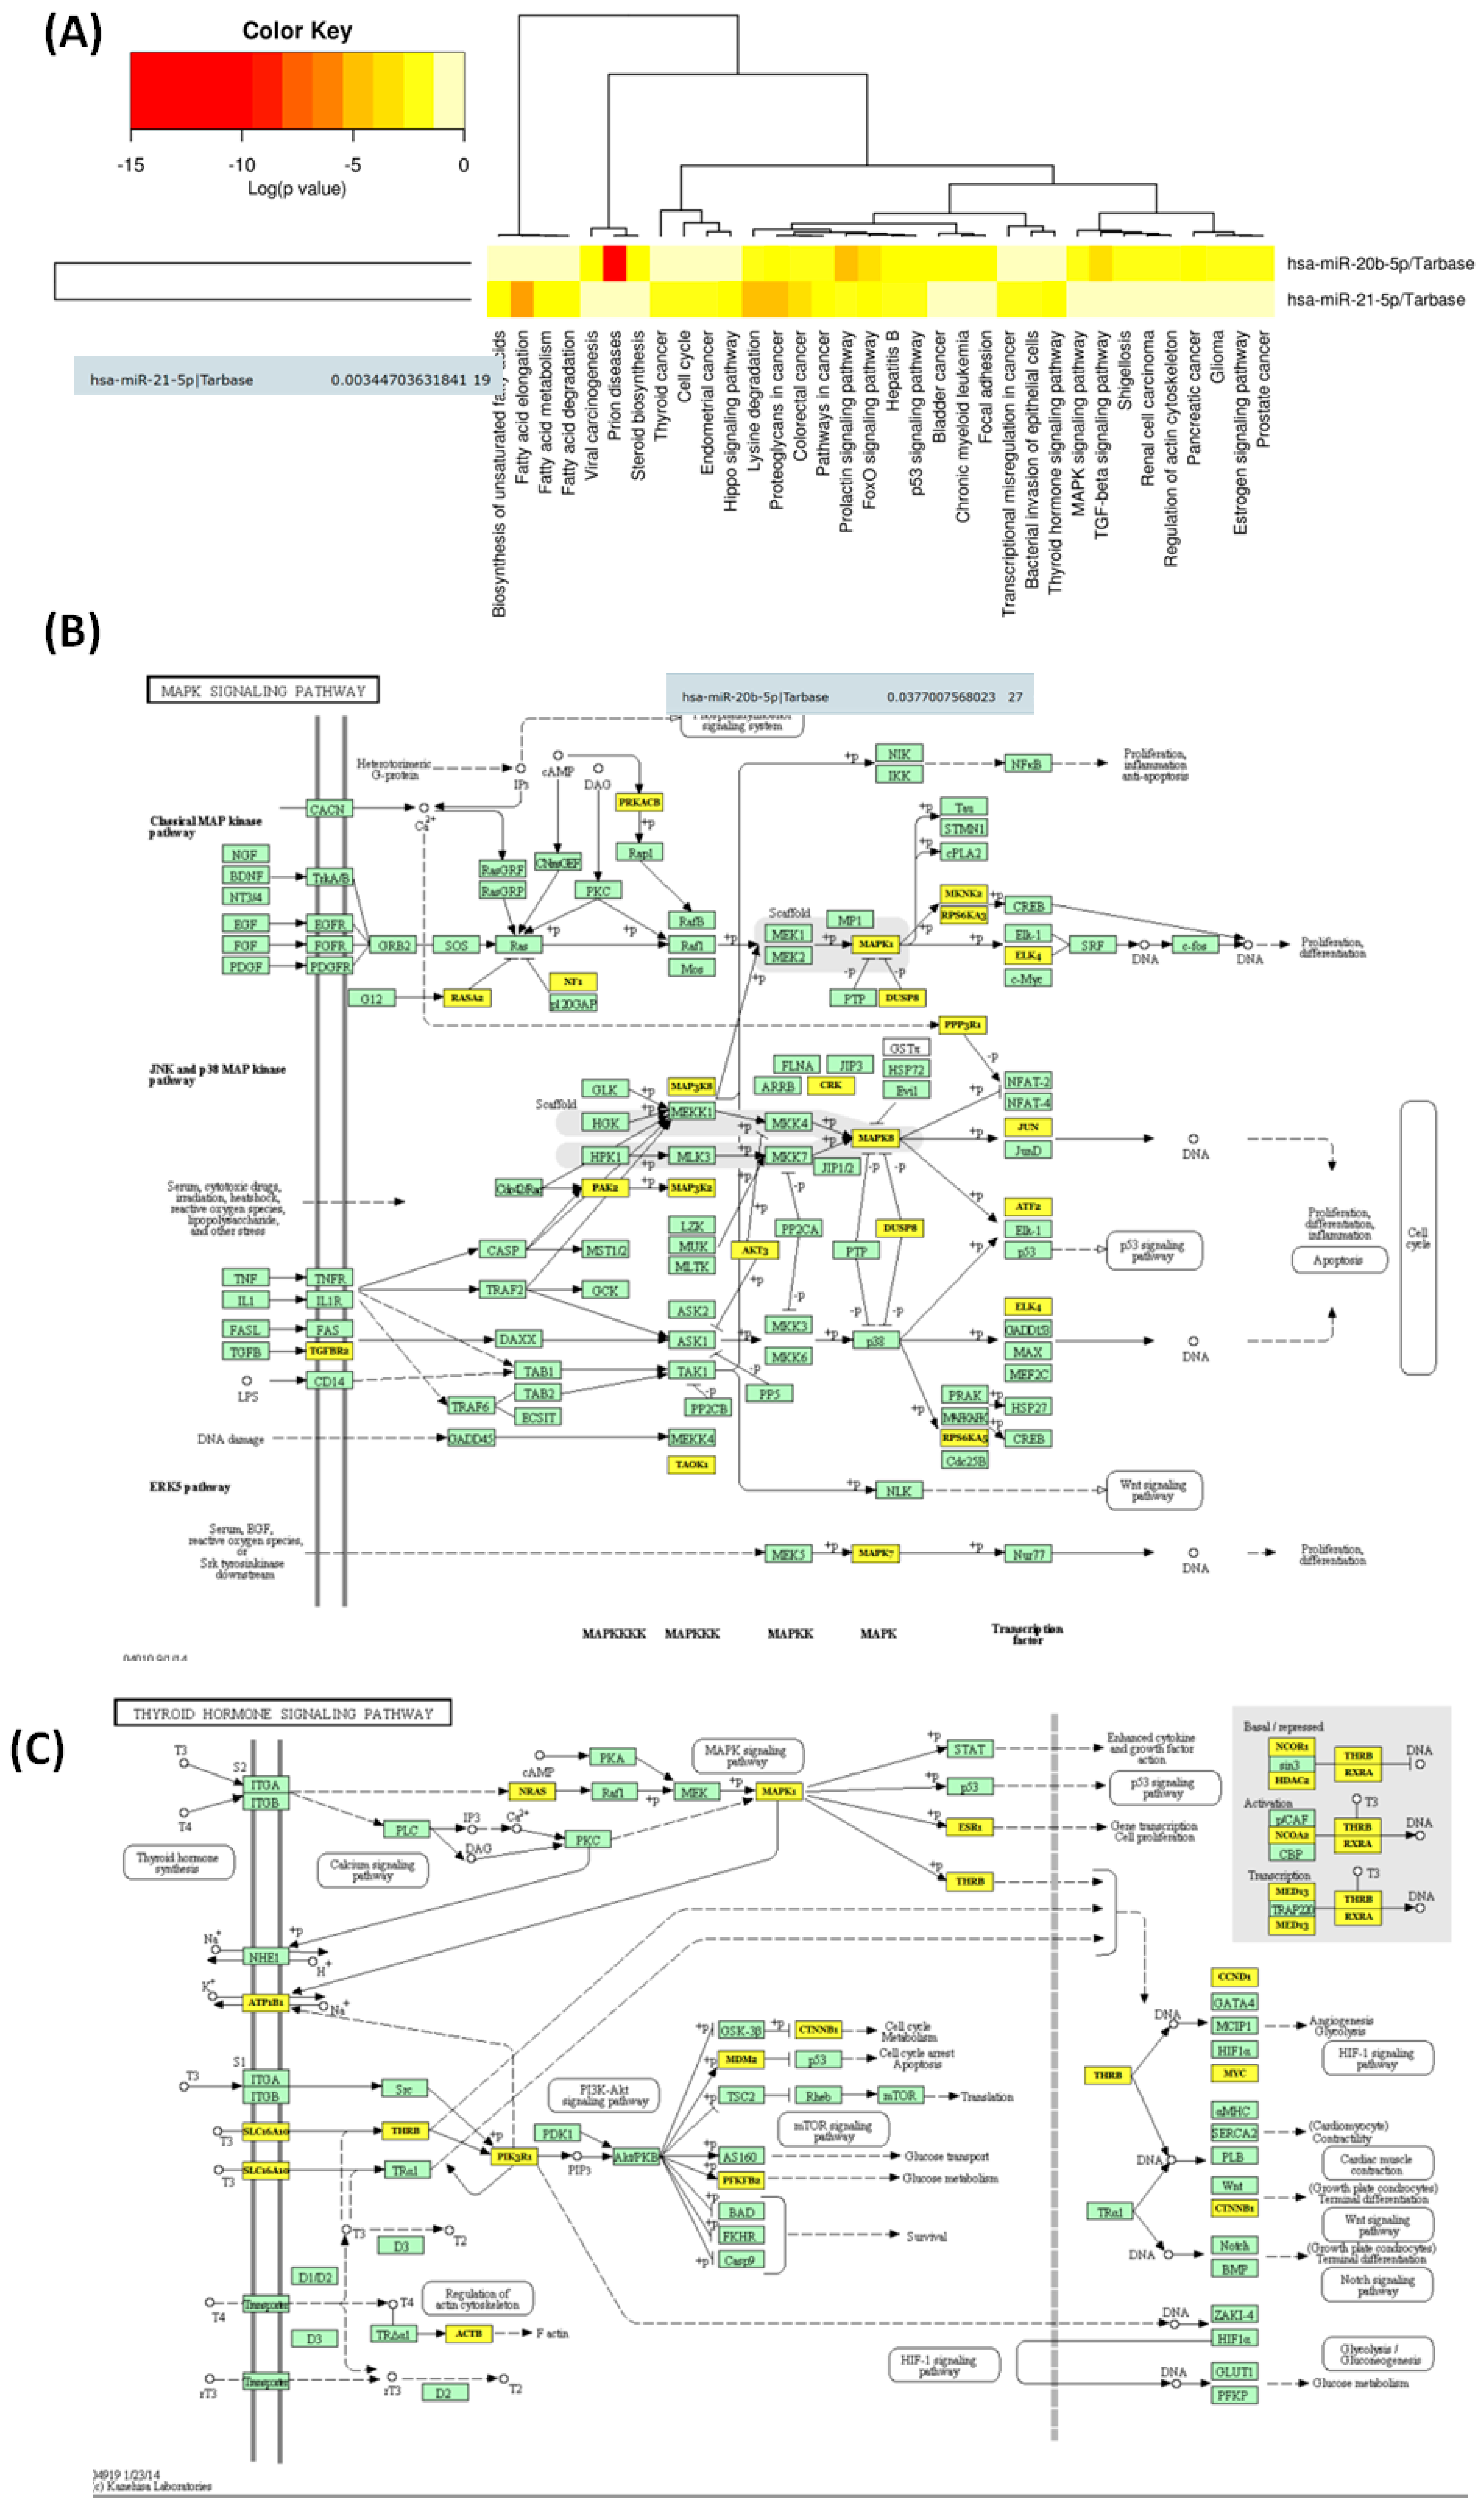
3.3. Functional Analysis and Target Genes Identification for the Selected miRNAs
4. Discussion
5. Conclusions
Supplementary Materials
Author Contributions
Funding
Institutional Review Board Statement
Informed Consent Statement
Data Availability Statement
Conflicts of Interest
References
- Seib, C.D.; Sosa, J.A. Evolving Understanding of the Epidemiology of Thyroid Cancer. Endocrinol. Metab. Clin. N. Am. 2019, 48, 23–35. [Google Scholar] [CrossRef]
- Jung, C.K.; Little, M.P.; Lubin, J.H.; Brenner, A.V.; Wells, S.A., Jr.; Sigurdson, A.J.; Nikiforov, Y.E. The increase in thyroid cancer incidence during the last four decades is accompanied by a high frequency of BRAF mutations and a sharp increase in RAS mutations. J. Clin. Endocrinol. Metab. 2014, 99, E276–E285. [Google Scholar] [CrossRef]
- Yu, X.M.; Schneider, D.F.; Leverson, G.; Chen, H.; Sippel, R.S. Follicular variant of papillary thyroid carcinoma is a unique clinical entity: A population-based study of 10,740 cases. Thyroid 2013, 23, 1263–1268. [Google Scholar] [CrossRef]
- Lam, A.K.; Lo, C.Y.; Lam, K.S. Papillary carcinoma of thyroid: A 30-yr clinicopathological review of the histological variants. Endocr. Pathol. 2005, 16, 323–330. [Google Scholar] [CrossRef]
- Zidan, J.; Karen, D.; Stein, M.; Rosenblatt, E.; Basher, W.; Kuten, A. Pure versus follicular variant of papillary thyroid carcinoma: Clinical features, prognostic factors, treatment, and survival. Cancer 2003, 97, 1181–1185. [Google Scholar] [CrossRef]
- Nikiforov, Y.E.; Seethala, R.R.; Tallini, G.; Baloch, Z.W.; Basolo, F.; Thompson, L.D.; Barletta, J.A.; Wenig, B.M.; Al Ghuzlan, A.; Kakudo, K.; et al. Nomenclature Revision for Encapsulated Follicular Variant of Papillary Thyroid Carcinoma: A Paradigm Shift to Reduce Overtreatment of Indolent Tumors. JAMA Oncol. 2016, 2, 1023–1029. [Google Scholar] [CrossRef]
- Nikiforova, M.N.; Lynch, R.A.; Biddinger, P.W.; Alexander, E.K.; Dorn, G.W., 2nd; Tallini, G.; Kroll, T.G.; Nikiforov, Y.E. RAS point mutations and PAX8-PPAR gamma rearrangement in thyroid tumors: Evidence for distinct molecular pathways in thyroid follicular carcinoma. J. Clin. Endocrinol. Metab. 2003, 88, 2318–2326. [Google Scholar] [CrossRef]
- Fagin, J.A.; Wells, S.A., Jr. Biologic and Clinical Perspectives on Thyroid Cancer. N. Engl. J. Med. 2016, 375, 1054–1067. [Google Scholar] [CrossRef]
- Tallini, G.; Tuttle, R.M.; Ghossein, R.A. The History of the Follicular Variant of Papillary Thyroid Carcinoma. J. Clin. Endocrinol. Metab. 2017, 102, 15–22. [Google Scholar] [CrossRef]
- Shi, X.; Liu, R.; Basolo, F.; Giannini, R.; Shen, X.; Teng, D.; Guan, H.; Shan, Z.; Teng, W.; Musholt, T.J.; et al. Differential Clinicopathological Risk and Prognosis of Major Papillary Thyroid Cancer Variants. J. Clin. Endocrinol. Metab. 2016, 101, 264–274. [Google Scholar] [CrossRef]
- Cardenas, M.G.; Kini, S.; Wisgerhof, M. Two patients with highly aggressive macrofollicular variant of papillary thyroid carcinoma. Thyroid 2009, 19, 413–416. [Google Scholar] [CrossRef]
- Chang, H.Y.; Lin, J.D.; Chou, S.C.; Chao, T.C.; Hsueh, C. Clinical presentations and outcomes of surgical treatment of follicular variant of the papillary thyroid carcinomas. Jpn. J. Clin. Oncol. 2006, 36, 688–693. [Google Scholar] [CrossRef]
- Hagag, P.; Hod, N.; Kummer, E.; Cohenpour, M.; Horne, T.; Weiss, M. Follicular variant of papillary thyroid carcinoma: Clinical-pathological characterization and long-term follow-up. Cancer J. 2006, 12, 275–282. [Google Scholar] [CrossRef]
- Christofer Juhlin, C.; Mete, O.; Baloch, Z.W. The 2022 WHO classification of thyroid tumors: Novel concepts in nomenclature and grading. Endocr. Relat. Cancer 2023, 30, e220293. [Google Scholar] [CrossRef]
- Basolo, F.; Macerola, E.; Poma, A.M.; Torregrossa, L. The 5(th) edition of WHO classification of tumors of endocrine organs: Changes in the diagnosis of follicular-derived thyroid carcinoma. Endocrine 2023, 80, 470–476. [Google Scholar] [CrossRef]
- Liu, J.; Singh, B.; Tallini, G.; Carlson, D.L.; Katabi, N.; Shaha, A.; Tuttle, R.M.; Ghossein, R.A. Follicular variant of papillary thyroid carcinoma: A clinicopathologic study of a problematic entity. Cancer 2006, 107, 1255–1264. [Google Scholar] [CrossRef]
- Ghafouri-Fard, S.; Shirvani-Farsani, Z.; Taheri, M. The role of microRNAs in the pathogenesis of thyroid cancer. Noncoding RNA Res. 2020, 5, 88–98. [Google Scholar] [CrossRef]
- Santiago, K.; Chen Wongworawat, Y.; Khan, S. Differential MicroRNA-Signatures in Thyroid Cancer Subtypes. J. Oncol. 2020, 2020, 2052396. [Google Scholar] [CrossRef]
- Sun, Q.; Li, M.; Wang, X. The Cancer Omics Atlas: An integrative resource for cancer omics annotations. BMC Med. Genom. 2018, 11, 63. [Google Scholar] [CrossRef]
- von Elm, E.; Altman, D.G.; Egger, M.; Pocock, S.J.; Gotzsche, P.C.; Vandenbroucke, J.P.; Initiative, S. The Strengthening the Reporting of Observational Studies in Epidemiology (STROBE) statement: Guidelines for reporting observational studies. PLoS Med. 2007, 4, e296. [Google Scholar] [CrossRef]
- Mazzara, S.; Rossi, R.L.; Grifantini, R.; Donizetti, S.; Abrignani, S.; Bombaci, M. CombiROC: An interactive web tool for selecting accurate marker combinations of omics data. Sci. Rep. 2017, 7, 45477. [Google Scholar] [CrossRef]
- Vlachos, I.S.; Kostoulas, N.; Vergoulis, T.; Georgakilas, G.; Reczko, M.; Maragkakis, M.; Paraskevopoulou, M.D.; Prionidis, K.; Dalamagas, T.; Hatzigeorgiou, A.G. DIANA miRPath v.2.0: Investigating the combinatorial effect of microRNAs in pathways. Nucleic Acids Res. 2012, 40, W498–W504. [Google Scholar] [CrossRef]
- Fan, Y.; Siklenka, K.; Arora, S.K.; Ribeiro, P.; Kimmins, S.; Xia, J. miRNet—Dissecting miRNA-target interactions and functional associations through network-based visual analysis. Nucleic Acids Res. 2016, 44, W135–W141. [Google Scholar] [CrossRef]
- Kane, S. ClinCalc.com. Available online: https://clincalc.com/Stats/Power.aspx (accessed on 28 November 2023).
- Capaccia, C.; Diverio, S.; Zampini, D.; Guelfi, G. The Complex Interaction between P53 and miRNAs Joins New Awareness in Physiological Stress Responses. Cells 2022, 11, 1631. [Google Scholar] [CrossRef]
- Khalilian, S.; Abedinlou, H.; Hussen, B.M.; Imani, S.Z.H.; Ghafouri-Fard, S. The emerging role of miR-20b in human cancer and other disorders: Pathophysiology and therapeutic implications. Front. Oncol. 2022, 12, 985457. [Google Scholar] [CrossRef]
- Hamidi, A.A.; Taghehchian, N.; Basirat, Z.; Zangouei, A.S.; Moghbeli, M. MicroRNAs as the critical regulators of cell migration and invasion in thyroid cancer. Biomark. Res. 2022, 10, 40. [Google Scholar] [CrossRef]
- Hong, S.; Yu, S.; Li, J.; Yin, Y.; Liu, Y.; Zhang, Q.; Guan, H.; Li, Y.; Xiao, H. MiR-20b Displays Tumor-Suppressor Functions in Papillary Thyroid Carcinoma by Regulating the MAPK/ERK Signaling Pathway. Thyroid 2016, 26, 1733–1743. [Google Scholar] [CrossRef]
- Pang, R.; Yang, S. lncRNA DUXAP8 inhibits papillary thyroid carcinoma cell apoptosis via sponging the miR-20b-5p/SOS1 axis. Oncol. Rep. 2021, 45, 64. [Google Scholar] [CrossRef]
- Ilhan, A.; Golestani, S.; Shafagh, S.G.; Asadi, F.; Daneshdoust, D.; Al-Naqeeb, B.Z.T.; Nemati, M.M.; Khalatbari, F.; Yaseri, A.F. The dual role of microRNA (miR)-20b in cancers: Friend or foe? Cell Commun. Signal. 2023, 21, 26. [Google Scholar] [CrossRef]
- Galuppini, F.; Censi, S.; Merante Boschin, I.; Fassan, M.; Sbaraglia, M.; Valeri, N.; Hahne, J.C.; Bertazza, L.; Munari, G.; Galasso, M.; et al. Papillary Thyroid Carcinoma: Molecular Distinction by MicroRNA Profiling. Front. Endocrinol. 2022, 13, 834075. [Google Scholar] [CrossRef]
- Liu, M.; Deng, H.; Zhao, Y.; Li, C.; Liu, H. Impact of microRNA-21-5p on the growth of thyroid cancer cells via targeting the recombinant sclerostin domain containing protein 1. Zhong Nan Da Xue Xue Bao Yi Xue Ban 2021, 46, 1054–1062. [Google Scholar] [CrossRef]
- Samsonov, R.; Burdakov, V.; Shtam, T.; Radzhabovа, Z.; Vasilyev, D.; Tsyrlina, E.; Titov, S.; Ivanov, M.; Berstein, L.; Filatov, M.; et al. Plasma exosomal miR-21 and miR-181a differentiates follicular from papillary thyroid cancer. Tumour. Biol. 2016, 37, 12011–12021. [Google Scholar] [CrossRef]
- Hu, Y.; Wang, H.; Chen, E.; Xu, Z.; Chen, B.; Lu, G. Candidate microRNAs as biomarkers of thyroid carcinoma: A systematic review, meta-analysis, and experimental validation. Cancer Med. 2016, 5, 2602–2614. [Google Scholar] [CrossRef]
- Sheu, S.Y.; Grabellus, F.; Schwertheim, S.; Worm, K.; Broecker-Preuss, M.; Schmid, K.W. Differential miRNA expression profiles in variants of papillary thyroid carcinoma and encapsulated follicular thyroid tumours. Br. J. Cancer 2010, 102, 376–382. [Google Scholar] [CrossRef]
- Chen, Y.T.; Kitabayashi, N.; Zhou, X.K.; Fahey, T.J., 3rd; Scognamiglio, T. MicroRNA analysis as a potential diagnostic tool for papillary thyroid carcinoma. Mod. Pathol. 2008, 21, 1139–1146. [Google Scholar] [CrossRef]
- Acibucu, F.; Dokmetas, H.S.; Tutar, Y.; Elagoz, S.; Kilicli, F. Correlations between the expression levels of micro-RNA146b, 221, 222 and p27Kip1 protein mRNA and the clinicopathologic parameters in papillary thyroid cancers. Exp. Clin. Endocrinol. Diabetes 2014, 122, 137–143. [Google Scholar] [CrossRef]
- Yip, L.; Kelly, L.; Shuai, Y.; Armstrong, M.J.; Nikiforov, Y.E.; Carty, S.E.; Nikiforova, M.N. MicroRNA signature distinguishes the degree of aggressiveness of papillary thyroid carcinoma. Ann. Surg. Oncol. 2011, 18, 2035–2041. [Google Scholar] [CrossRef]
- Silaghi, C.A.; Lozovanu, V.; Silaghi, H.; Georgescu, R.D.; Pop, C.; Dobrean, A.; Georgescu, C.E. The Prognostic Value of MicroRNAs in Thyroid Cancers—A Systematic Review and Meta-Analysis. Cancers 2020, 12, 2608. [Google Scholar] [CrossRef]
- Geropoulos, G.; Psarras, K.; Papaioannou, M.; Giannis, D.; Meitanidou, M.; Kapriniotis, K.; Symeonidis, N.; Pavlidis, E.T.; Pavlidis, T.E.; Sapalidis, K.; et al. Circulating microRNAs and Clinicopathological Findings of Papillary Thyroid Cancer: A Systematic Review. In Vivo 2022, 36, 1551–1569. [Google Scholar] [CrossRef]
- Celano, M.; Rosignolo, F.; Maggisano, V.; Pecce, V.; Iannone, M.; Russo, D.; Bulotta, S. MicroRNAs as Biomarkers in Thyroid Carcinoma. Int. J. Genom. 2017, 2017, 6496570. [Google Scholar] [CrossRef]
- Matovinovic, F.; Novak, R.; Hrkac, S.; Salai, G.; Mocibob, M.; Pranjic, M.; Kosec, A.; Bedekovic, V.; Grgurevic, L. In search of new stratification strategies: Tissue proteomic profiling of papillary thyroid microcarcinoma in patients with localized disease and lateral neck metastases. J. Cancer Res. Clin. Oncol. 2023, 149, 17405–17417. [Google Scholar] [CrossRef] [PubMed]


| cPTC | iFVPTC | |
|---|---|---|
| Age mean (years) | 57.69 | 52.05 |
| Age range (years) | 44–74 | 28–74 |
| Females | 14 | 14 |
| Males | 12 | 3 |
| T1 | 14 | 9 |
| T2 | 9 | 3 |
| T3 | 3 | 5 |
| N0 | 3 | 2 |
| N1 | 6 | 2 |
| Nx | 17 | 13 |
| Mx | 26 | 17 |
| Tumour size mean (mm) | 19.42 | 22.58 |
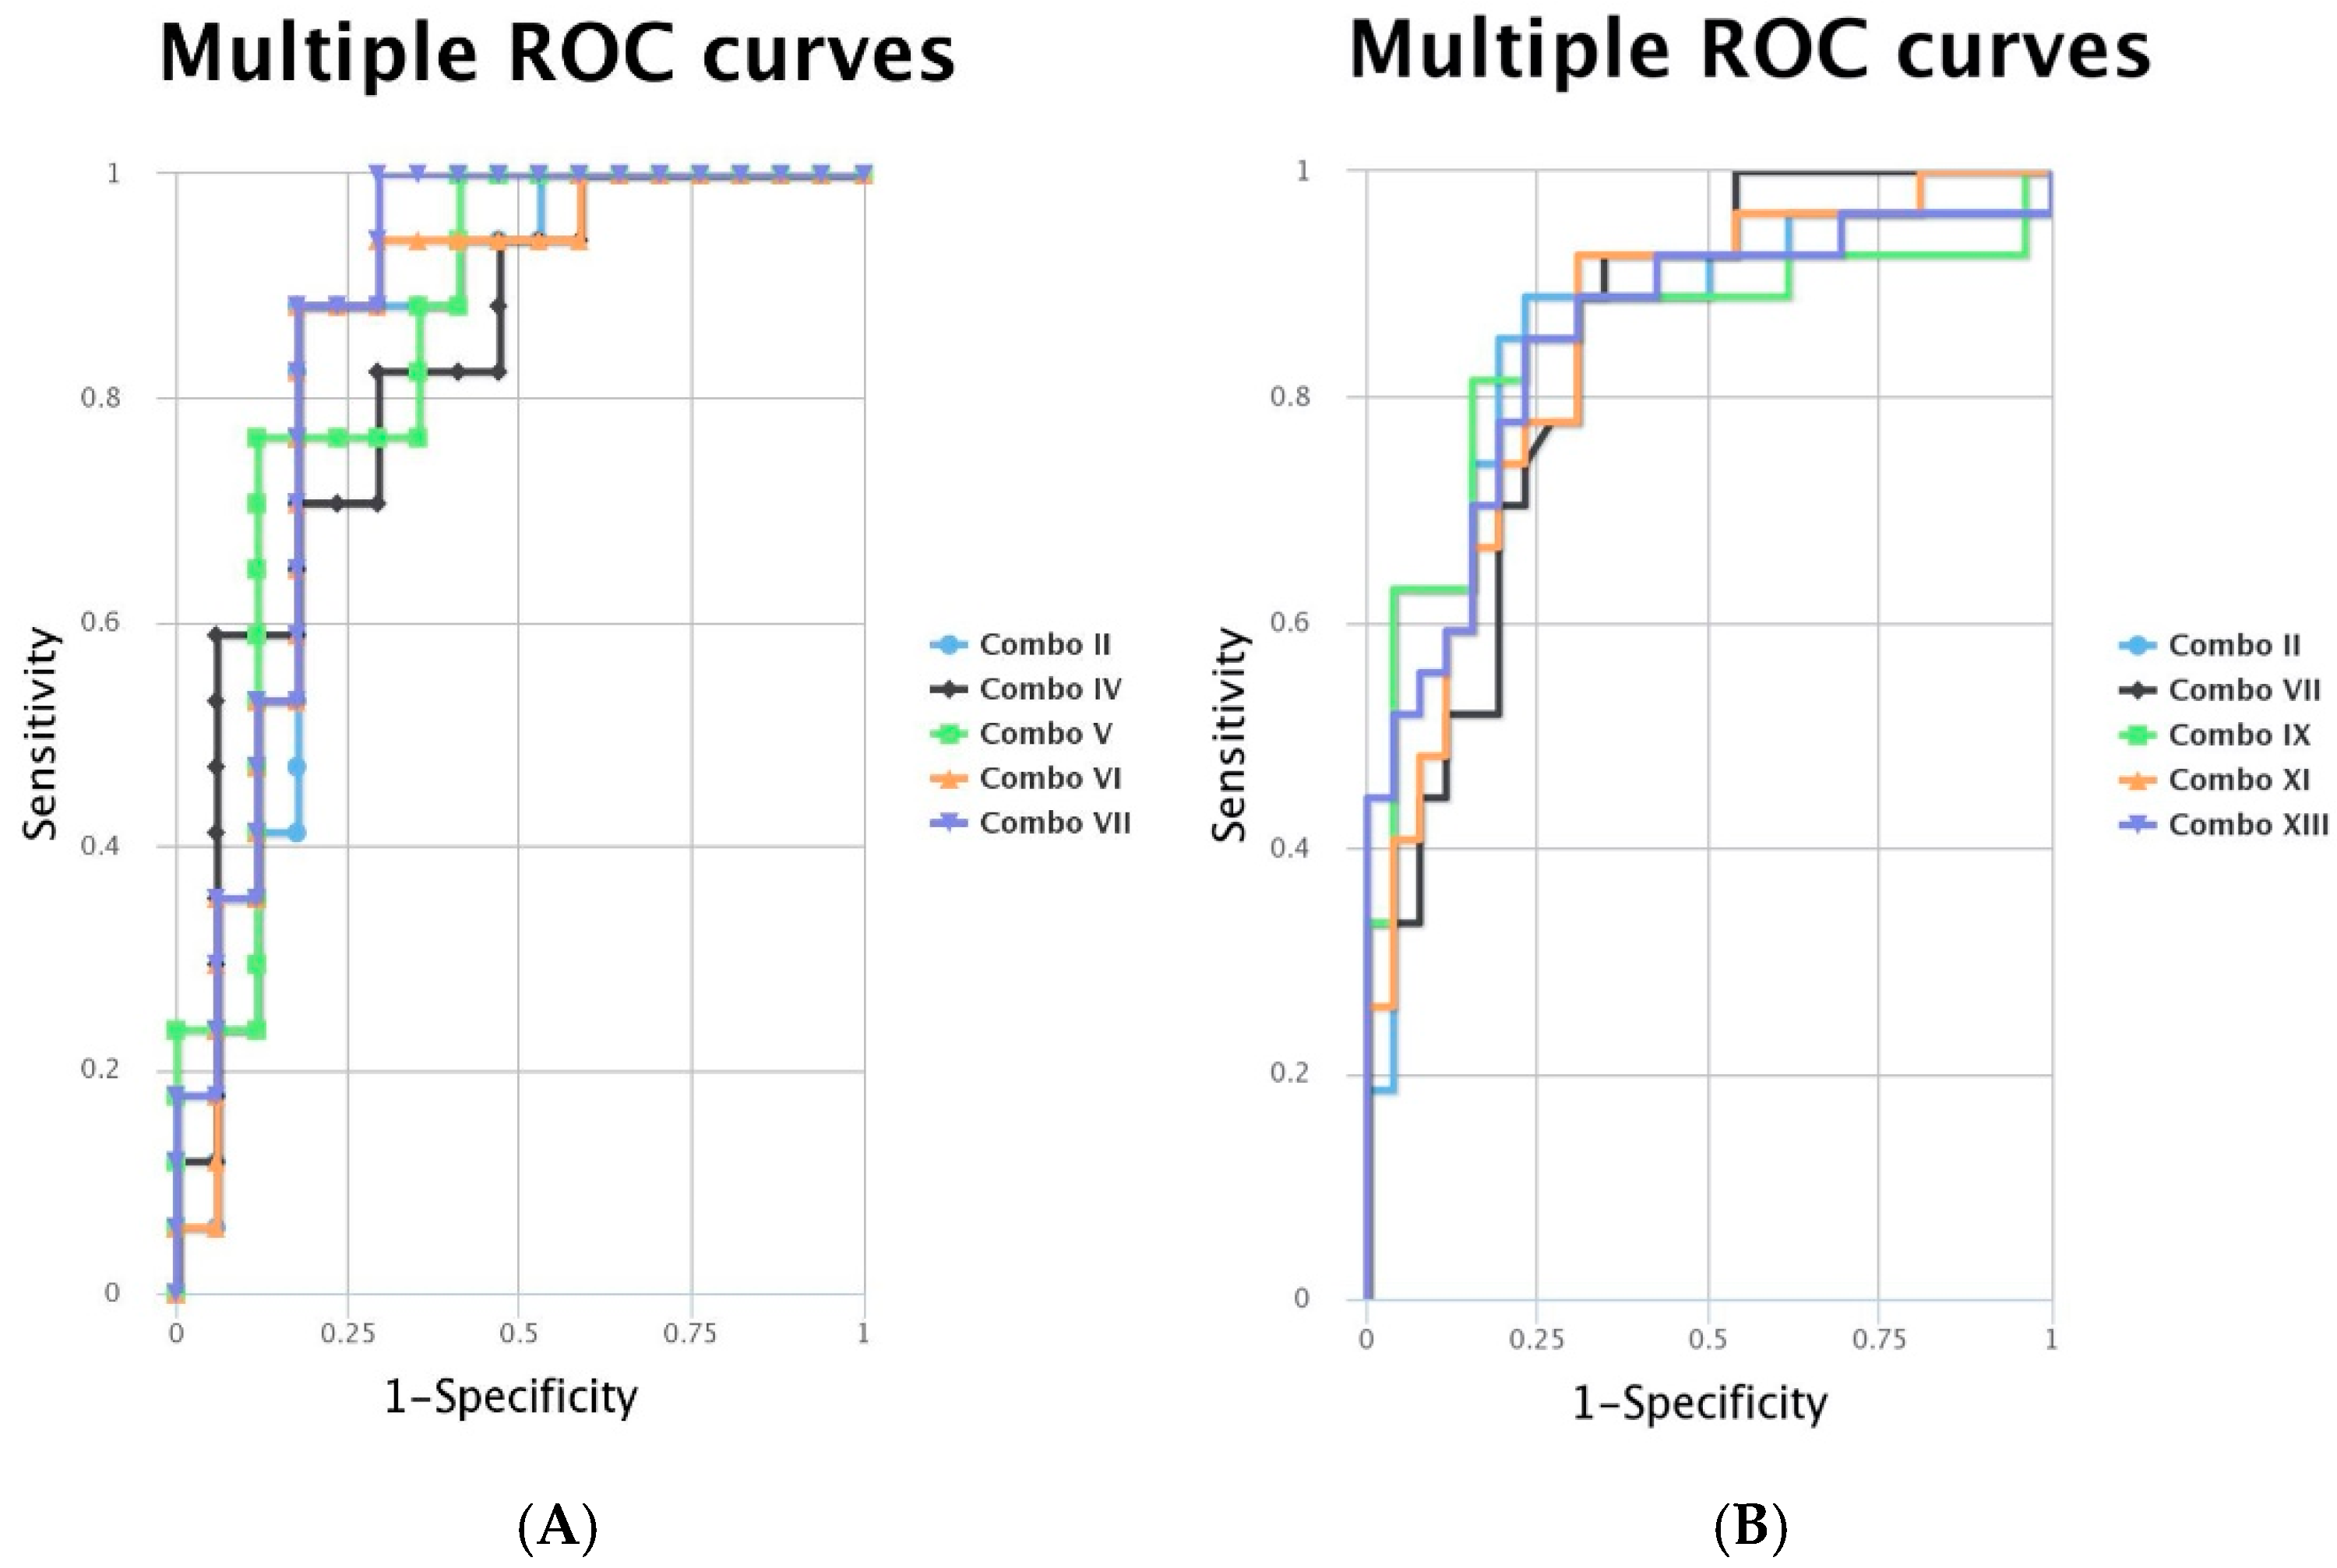
| Combo iFVPTC | Markers | AUC | Combo cPTC | Markers | AUC |
|---|---|---|---|---|---|
| II | miR-146-5p + miR-20b-5p | 0.83 | II | miR-221-3p + miR-20b-5p | 0.858 |
| IV | miR-222-3p + miR-20b-5p | 0.827 | VII | miR-20b-5p + miR-181a-5p | 0.843 |
| V | miR-222-3p + miR-195-5p | 0.848 | IX | miR-221-3p + miR222-3p + miR-20b-5p | 0.846 |
| VI | miR-146-5p + miR-222-3p + miR-20b-5p | 0.848 | XI | miR-221-3p + miR-20b-5p + miR-195-5p | 0.846 |
| VII | miR-222-3p + miR-20b-5p + miR-195-5p | 0.872 | XIII | miR-221-3p + miR222-3p + miR-20b-5p + miR-195-5p | 0.852 |
| iFVPTC | miR-146b-5p | miR-221-3p | miR-222-3p | miR-181-5p | miR-195-5p | Age | T | N | Tumour Size (mm) | Lymphatic Invasion | Multifocality |
|---|---|---|---|---|---|---|---|---|---|---|---|
| miR-146b-5p | 0.999 | 0.998 | −0.002 | 0.762 | 0.324 | 0.348 | −0.383 | 0.357 | −0.066 | −0.163 | |
| miR-221-3p | 0.999 | 0.997 | 0.012 | 0.761 | 0.320 | 0.355 | 0.685 | 0.358 | −0.066 | −0.169 | |
| miR-222-3p | 0.998 | 0.997 | −0.034 | 0.769 | 0.319 | 0.365 | −0.125 | 0.383 | −0.066 | −0.184 | |
| miR-181-5p | −0.002 | 0.012 | −0.034 | −0.095 | −0.421 | 0.066 | −0.663 | −0.002 | −0.179 | 0.011 | |
| miR-195-5p | 0.762 | 0.761 | 0.769 | −0.095 | 0.226 | 0.164 | −0.844 | 0.197 | −0.166 | −0.149 | |
| Age | 0.324 | 0.320 | 0.319 | −0.421 | 0.226 | 0.208 | 0.989 | 0.128 | 0.071 | 0.411 | |
| T | 0.348 | 0.355 | 0.365 | 0.066 | 0.164 | 0.208 | 0.577 | 0.952 | −0.218 | −0.223 | |
| N | −0.383 | 0.685 | −0.125 | −0.663 | −0.844 | 0.989 | 0.577 | 0.455 | 0.577 | ||
| Tumour size (mm) | 0.357 | 0.358 | 0.383 | −0.002 | 0.197 | 0.128 | 0.952 | 0.455 | −0.193 | −0.349 | |
| Lymphatic invasion | −0.066 | −0.066 | −0.066 | −0.179 | −0.166 | 0.071 | −0.218 | 0.577 | −0.193 | −0.185 | |
| Multifocality | −0.163 | −0.169 | −0.184 | 0.011 | −0.149 | 0.411 | −0.223 | −0.349 | −0.185 | ||
| Radioiodine therapy | 0.166 | 0.166 | 0.169 | 0.28 | −0.115 | −0.201 | 0.563 | 0.620 | 0.161 | −0.604 |
| cPTC | miR-146b-5p | miR-221-3p | miR-222-3p | miR-20b-5p | miR-21-5p | miR-181-5p | miR-195-5p | Age | T | N | Tumour Size (mm) | Lymphatic Invasion | Multifocality |
|---|---|---|---|---|---|---|---|---|---|---|---|---|---|
| miR-146b-5p | 0.65 | 1.00 | −0.31 | 0.88 | 0.65 | −0.21 | 0.11 | 0.12 | 0.00 | 0.22 | −0.07 | −0.11 | |
| miR-221-3p | 0.65 | 0.68 | −0.30 | 0.73 | 0.73 | −0.18 | −0.11 | 0.14 | 0.16 | 0.13 | 0.20 | 0.02 | |
| miR-222-3p | 1.00 | 0.68 | −0.24 | 0.65 | 0.57 | −0.18 | 0.08 | 0.12 | −0.07 | 0.22 | −0.06 | −0.12 | |
| miR-20b-5p | −0.31 | −0.30 | −0.24 | −0.38 | −0.02 | −0.02 | 0.20 | 0.10 | 0.19 | 0.62 | −0.09 | −0.07 | |
| miR-21-5p | 0.88 | 0.73 | 0.65 | −0.38 | 0.55 | −0.16 | −0.09 | 0.02 | −0.17 | −0.09 | 0.15 | 0.17 | |
| miR-181-5p | 0.65 | 0.73 | 0.57 | −0.02 | 0.55 | −0.30 | −0.12 | −0.08 | −0.30 | −0.01 | 0.43 | −0.09 | |
| miR-195-5p | −0.21 | −0.18 | −0.18 | −0.02 | −0.16 | −0.30 | −0.44 | −0.01 | 0.64 | −0.04 | −0.01 | 0.00 | |
| Age | 0.11 | −0.11 | 0.08 | 0.20 | −0.09 | −0.12 | −0.44 | −0.09 | −0.58 | −0.11 | −0.11 | 0.20 | |
| T | 0.12 | 0.14 | 0.12 | 0.10 | 0.02 | −0.08 | −0.01 | −0.09 | 0.46 | 0.52 | 0.42 | −0.13 | |
| N | 0.00 | 0.16 | −0.07 | 0.19 | −0.17 | −0.30 | 0.64 | −0.58 | 0.46 | 0.44 | 0.38 | 0.16 | |
| Tumour size(mm) | 0.22 | 0.13 | 0.22 | 0.62 | −0.09 | −0.01 | −0.04 | −0.11 | 0.52 | 0.44 | −0.13 | −0.30 | |
| Lymphatic invasion | −0.07 | 0.20 | −0.06 | −0.09 | 0.15 | 0.43 | −0.01 | −0.11 | 0.42 | 0.38 | −0.13 | 0.22 | |
| Multifocality | −0.11 | 0.02 | −0.12 | −0.07 | 0.17 | −0.09 | 0.00 | 0.20 | −0.13 | 0.16 | −0.30 | 0.22 |
Disclaimer/Publisher’s Note: The statements, opinions and data contained in all publications are solely those of the individual author(s) and contributor(s) and not of MDPI and/or the editor(s). MDPI and/or the editor(s) disclaim responsibility for any injury to people or property resulting from any ideas, methods, instructions or products referred to in the content. |
© 2024 by the authors. Licensee MDPI, Basel, Switzerland. This article is an open access article distributed under the terms and conditions of the Creative Commons Attribution (CC BY) license (https://creativecommons.org/licenses/by/4.0/).
Share and Cite
Silaghi, H.; Pop, L.A.; Georgescu, C.E.; Muntean, D.; Crișan, D.; Silaghi, P.; Lungu, I.; Nasui, B.A.; Dulf, E.-H.; Braicu, C.; et al. MicroRNA Expression Profiling—Potential Molecular Discrimination of Papillary Thyroid Carcinoma Subtypes. Biomedicines 2024, 12, 136. https://doi.org/10.3390/biomedicines12010136
Silaghi H, Pop LA, Georgescu CE, Muntean D, Crișan D, Silaghi P, Lungu I, Nasui BA, Dulf E-H, Braicu C, et al. MicroRNA Expression Profiling—Potential Molecular Discrimination of Papillary Thyroid Carcinoma Subtypes. Biomedicines. 2024; 12(1):136. https://doi.org/10.3390/biomedicines12010136
Chicago/Turabian StyleSilaghi, Horatiu, Laura Ancuța Pop, Carmen Emanuela Georgescu, Diana Muntean, Doinița Crișan, Patricia Silaghi, Ionela Lungu, Bogdana Adriana Nasui, Eva-H. Dulf, Cornelia Braicu, and et al. 2024. "MicroRNA Expression Profiling—Potential Molecular Discrimination of Papillary Thyroid Carcinoma Subtypes" Biomedicines 12, no. 1: 136. https://doi.org/10.3390/biomedicines12010136
APA StyleSilaghi, H., Pop, L. A., Georgescu, C. E., Muntean, D., Crișan, D., Silaghi, P., Lungu, I., Nasui, B. A., Dulf, E.-H., Braicu, C., Berindan-Neagoe, I., & Silaghi, C. A. (2024). MicroRNA Expression Profiling—Potential Molecular Discrimination of Papillary Thyroid Carcinoma Subtypes. Biomedicines, 12(1), 136. https://doi.org/10.3390/biomedicines12010136