

Volumetric Differences in Cerebellum and Brainstem in Patients with Migraine: A UK Biobank Study


Abstract
:1. Introduction
2. Materials and Methods
2.1. Structural MRI Analyses
2.2. Outcome Variables and Covariates
2.3. Statistical Analyses
3. Results
4. Discussion
5. Conclusions
Author Contributions
Funding
Institutional Review Board Statement
Informed Consent Statement
Data Availability Statement
Acknowledgments
Conflicts of Interest
Abbreviations
| MRI | magnetic resonance imaging |
| BMI | body mass index |
| SD | standard deviation |
| IQR | interquartile range |
| SE | standard error |
| CI | confidence interval |
| DAG | directed acyclic graph |
References
- Kros, L.; Aristizábal, C.A.A.; Khodakhah, K. Cerebellar involvement in migraine. Cephalalgia 2018, 38, 1782–1791. [Google Scholar] [CrossRef] [PubMed]
- Apps, R.; Garwicz, M. Anatomical and physiological foundations of cerebellar information processing. Nat. Rev. Neurosci. 2005, 6, 297–311. [Google Scholar] [CrossRef] [PubMed]
- Schmahmann, J.D.; Caplan, D. Cognition, emotion and the cerebellum. Brain 2006, 129, 290–292. [Google Scholar] [CrossRef] [PubMed]
- Saab, C.Y.; Willis, W.D. The cerebellum: Organization, functions and its role in nociception. Brain Res. Rev. 2003, 42, 85–95. [Google Scholar] [CrossRef]
- Moulton, E.A.; Schmahmann, J.D.; Becerra, L.; Borsook, D. The cerebellum and pain: Passive integrator or active participator? Brain Res. Rev. 2010, 65, 14–27. [Google Scholar] [CrossRef]
- Bilgiç, B.; Kocaman, G.; Arslan, A.B.; Noyan, H.; Sherifov, R.; Alkan, A.; Asil, T.; Parman, Y.; Baykan, B. Volumetric differences suggest involvement of cerebellum and brainstem in chronic migraine. Cephalalgia 2016, 36, 301–308. [Google Scholar] [CrossRef]
- Jin, C.; Yuan, K.; Zhao, L.; Zhao, L.; Yu, D.; von Deneen, K.M.; Zhang, M.; Qin, W.; Sun, W.; Tian, J. Structural and functional abnormalities in migraine patients without aura: Brain abnormalities in migraine patients without aura. NMR Biomed. 2013, 26, 58–64. [Google Scholar] [CrossRef]
- Coppola, G.; Petolicchio, B.; Di Renzo, A.; Tinelli, E.; Di Lorenzo, C.; Parisi, V.; Serrao, M.; Calistri, V.; Tardioli, S.; Cartocci, G.; et al. Cerebral gray matter volume in patients with chronic migraine: Correlations with clinical features. J. Headache Pain 2017, 18, 115. [Google Scholar] [CrossRef]
- Mehnert, J.; Schulte, L.; Timmann, D.; May, A. Activity and connectivity of the cerebellum in trigeminal nociception. NeuroImage 2017, 150, 112–118. [Google Scholar] [CrossRef]
- Qin, Z.; He, X.-W.; Zhang, J.; Xu, S.; Li, G.-F.; Su, J.; Shi, Y.-H.; Ban, S.; Hu, Y.; Liu, Y.-S.; et al. Structural changes of cerebellum and brainstem in migraine without aura. J. Headache Pain 2019, 20, 93. [Google Scholar] [CrossRef]
- Mehnert, J.; May, A. Functional and structural alterations in the migraine cerebellum. J. Cereb. Blood Flow Metab. 2019, 39, 730–739. [Google Scholar] [CrossRef] [PubMed]
- Allen, N.; Sudlow, C.; Downey, P.; Peakman, T.; Danesh, J.; Elliott, P.; Gallacher, J.; Green, J.; Matthews, P.; Pell, J.; et al. UK Biobank: Current status and what it means for epidemiology. Health Policy Technol. 2012, 1, 123–126. [Google Scholar] [CrossRef]
- Zhang, Y.; Brady, M.; Smith, S. Segmentation of brain MR images through a hidden Markov random field model and the expectation-maximization algorithm. IEEE Trans. Med. Imaging 2001, 20, 45–57. [Google Scholar] [CrossRef] [PubMed]
- Miller, K.L.; Alfaro-Almagro, F.; Bangerter, N.K.; Thomas, D.L.; Yacoub, E.; Xu, J.; Bartsch, A.J.; Jbabdi, S.; Sotiropoulos, S.N.; Andersson, J.L.R.; et al. Multimodal population brain imaging in the UK Biobank prospective epidemiological study. Nat. Neurosci. 2016, 19, 1523–1536. [Google Scholar] [CrossRef]
- Pannacciulli, N.; Del Parigi, A.; Chen, K.; Le, D.S.N.T.; Reiman, E.M.; Tataranni, P.A. Brain abnormalities in human obesity: A voxel-based morphometric study. NeuroImage 2006, 31, 1419–1425. [Google Scholar] [CrossRef]
- Raji, C.A.; Ho, A.J.; Parikshak, N.N.; Becker, J.T.; Lopez, O.L.; Kuller, L.H.; Hua, X.; Leow, A.D.; Toga, A.W.; Thompson, P.M.; et al. Brain structure and obesity. Hum. Brain Mapp. 2010, 31, 353–364. [Google Scholar] [CrossRef]
- Masouleh, S.K.; Arélin, K.; Horstmann, A.; Lampe, L.; Kipping, J.A.; Luck, T.; Riedel-Heller, S.G.; Schroeter, M.L.; Stumvoll, M.; Villringer, A.; et al. Higher body mass index in older adults is associated with lower gray matter volume: Implications for memory performance. Neurobiol. Aging 2016, 40, 1–10. [Google Scholar] [CrossRef]
- Király, A.; Szabó, N.; Tóth, E.; Csete, G.; Faragó, P.; Kocsis, K.; Must, A.; Vécsei, L.; Kincses, Z.T. Male brain ages faster: The age and gender dependence of subcortical volumes. Brain Imaging Behav. 2016, 10, 901–910. [Google Scholar] [CrossRef]
- Courchesne, E.; Chisum, H.J.; Townsend, J.; Cowles, A.; Covington, J.; Egaas, B.; Harwood, M.; Hinds, S.; Press, G.A. Normal Brain Development and Aging: Quantitative Analysis at in Vivo MR Imaging in Healthy Volunteers. Radiology 2000, 216, 672–682. [Google Scholar] [CrossRef]
- Scahill, R.I.; Frost, C.; Jenkins, R.; Whitwell, J.L.; Rossor, M.N.; Fox, N.C. A Longitudinal Study of Brain Volume Changes in Normal Aging Using Serial Registered Magnetic Resonance Imaging. Arch. Neurol. 2003, 60, 989. [Google Scholar] [CrossRef]
- Gelman, A.; Hill, J.; Vehtari, A. Regression and Other Stories; Cambridge University Press: Cambridge, UK, 2021. [Google Scholar]
- Lash, T.L.; VanderWeel, T.J.; Haneuse, S.; Rothman, K.J. Modern Epidemiology, 4th ed.; Wolters Kluwer: Minato City, Japan, 2020. [Google Scholar]
- Elkins, M.R.; Pinto, R.Z.; Verhagen, A.; Grygorowicz, M.; Söderlund, A.; Guemann, M.; Gómez-Conesa, A.; Blanton, S.; Brismée, J.-M.; Agarwal, S.; et al. Statistical inference through estimation: Recommendations from the International Society of Physiotherapy Journal Editors. J. Physiother. 2022, 68, 1–4. [Google Scholar] [CrossRef] [PubMed]
- Amrhein, V.; Greenland, S.; McShane, B. Scientists rise up against statistical significance. Nature 2019, 567, 305–307. [Google Scholar] [CrossRef] [PubMed]
- Lang, J.M.; Rothman, K.J.; Cann, C.I. That Confounded P-Value. Epidemiology 1998, 9, 7–8. [Google Scholar] [CrossRef]
- Cohen, J. The earth is round (p < 0.05). Am. Psychol. 1994, 49, 997–1003. [Google Scholar] [CrossRef]
- Goodman, S. A Dirty Dozen: Twelve P-Value Misconceptions. Semin. Hematol. 2008, 45, 135–140. [Google Scholar] [CrossRef]
- Halsey, L.G. The reign of the p-value is over: What alternative analyses could we employ to fill the power vacuum? Biol. Lett. 2019, 15, 20190174. [Google Scholar] [CrossRef]
- Cohen, J. Statistical Power Analysis for the Behavioral Sciences; Routledge: London, UK, 2013. [Google Scholar] [CrossRef]
- Nakagawa, S.; Cuthill, I.C. Effect size, confidence interval and statistical significance: A practical guide for biologists. Biol. Rev. 2007, 82, 591–605. [Google Scholar] [CrossRef]
- Fritz, C.O.; Morris, P.E.; Richler, J.J. Effect size estimates: Current use, calculations, and interpretation. J. Exp. Psychol. Gen. 2012, 141, 2–18. [Google Scholar] [CrossRef]
- Wang, M.; Tutt, J.O.; Dorricott, N.O.; Parker, K.L.; Russo, A.F.; Sowers, L.P. Involvement of the cerebellum in migraine. Front. Syst. Neurosci. 2022, 16, 984406. [Google Scholar] [CrossRef]
- Qin, Z.; Su, J.; He, X.-W.; Ban, S.; Zhu, Q.; Cui, Y.; Zhang, J.; Hu, Y.; Liu, Y.-S.; Zhao, R.; et al. Disrupted functional connectivity between sub-regions in the sensorimotor areas and cortex in migraine without aura. J. Headache Pain 2020, 21, 47. [Google Scholar] [CrossRef]
- Zhang, J.; Su, J.; Wang, M.; Zhao, Y.; Zhang, Q.-T.; Yao, Q.; Lu, H.; Zhang, H.; Li, G.-F.; Wu, Y.-L.; et al. The sensorimotor network dysfunction in migraineurs without aura: A resting-state fMRI study. J. Neurol. 2017, 264, 654–663. [Google Scholar] [CrossRef] [PubMed]
- Russo, A.F. Calcitonin Gene-Related Peptide (CGRP): A New Target for Migraine. Annu. Rev. Pharmacol. Toxicol. 2015, 55, 533–552. [Google Scholar] [CrossRef] [PubMed]
- Edvinsson, L.; Ho, T.W. CGRP receptor antagonism and migraine. Neurotherapeutics 2010, 7, 164–175. [Google Scholar] [CrossRef] [PubMed]
- Edvinsson, L.; Haanes, K.A.; Warfvinge, K. Does inflammation have a role in migraine? Nat. Rev. Neurol. 2019, 15, 483–490. [Google Scholar] [CrossRef]
- Jia, Z.; Yu, S. Grey matter alterations in migraine: A systematic review and meta-analysis. NeuroImage Clin. 2017, 14, 130–140. [Google Scholar] [CrossRef]
- Ashina, M. Migraine. N. Engl. J. Med. 2020, 383, 1866–1876. [Google Scholar] [CrossRef]


| Migraineurs | Controls | |
|---|---|---|
| N = 712 | N = 45,681 | |
| Sex | ||
| Women | 527 (74%) | 23,977 (53%) |
| Men | 185 (26%) | 21,704 (47%) |
| Age (mean ± SD 1) | 63 ± 8 | 64 ± 8 |
| BMI (mean ± SD 1) | 27 ± 5 | 27 ± 4 |
| IMD (median, IQR 2) | 12.4, [7.1, 20.5] | 11.3, [6.7, 19.9] |
| Current tobacco smoking | ||
| Yes, on most or all days | 10 (2%) | 616 (2%) |
| Only occasionally | 14 (2%) | 911 (2%) |
| No | 682 (96%) | 43,825 (96%) |
| Prefer not to answer | 0 (0%) | 8 (0%) |
| Alcohol intake frequency | ||
| Daily or almost daily | 60 (8%) | 7678 (17%) |
| Three or four times a week | 136 (19%) | 12,786 (28%) |
| Once or twice a week | 174 (25%) | 11,976 (26%) |
| One to three times a month | 97 (14%) | 5236 (12%) |
| Special occasions only | 135 (19%) | 4725 (10%) |
| Never | 104 (15%) | 2942 (7%) |
| Prefer not to answer | 0 (%) | 17 (0%) |
| Brain Region | Migraineurs (N = 712) | Controls (N = 45,681) |
|---|---|---|
| Cerebellum | Mean = 89,511, Median = 89,482 | Mean = 90,346, Median = 90,472 |
| SD = 10,564 | SD = 11,158 | |
| IQR = [82,646, 96,887] | IQR = [83,227, 97,605] | |
| I–IV cerebellum | Mean = 3899, Median = 3881 | Mean = 3965, Median = 3940 |
| SD = 550 | SD = 575 | |
| IQR = [3518, 4228] | IQR = [3567, 4328] | |
| V cerebellum | Mean = 5174, Median = 5134 | Mean = 5230, Median = 5199 |
| SD = 707 | SD = 732 | |
| IQR = [4710, 5623] | IQR = [4728, 5697] | |
| VI cerebellum | Mean = 14,688, Median = 14,761 | Mean = 14,855, Median = 14,841 |
| SD = 2126 | SD = 2201 | |
| IQR = [13,251, 16,206] | IQR = [13,385, 16,299] | |
| Crus I cerebellum | Mean = 21,819, Median = 21,766 | Mean = 21,952, Median = 21,838 |
| SD = 3145 | SD = 3230 | |
| IQR = [19,688, 23,883] | IQR = [19,764, 24,026] | |
| Crus II cerebellum | Mean = 16,012, Median = 15,815 | Mean = 16,190, Median = 16,133 |
| SD = 2196 | SD = 2307 | |
| IQR = [14,631, 17,409] | IQR = [14,673, 17,648] | |
| VIIb cerebellum | Mean = 8037, Median = 8041 | Mean = 8114, Median = 8109 |
| SD = 1217 | SD = 1322 | |
| IQR = [7222, 8810] | IQR = [7280, 8960] | |
| VIIIa cerebellum | Mean = 8521, Median = 8507 | Mean = 8569, Median = 8624 |
| SD = 1382 | SD = 1473 | |
| IQR = [7641, 9428] | IQR = [7649, 9540] | |
| VIIIb cerebellum | Mean = 5761, Median = 5730 | Mean = 5837, Median = 5818 |
| SD = 1018 | SD = 1049 | |
| IQR = [5017, 6443] | IQR = [5119, 6515] | |
| IX cerebellum | Mean = 4433, Median = 4400 | Mean = 4463, Median = 4409 |
| SD = 830 | SD = 866 | |
| IQR = [3821, 5007] | IQR = [3850, 5015] | |
| X cerebellum | Mean = 1167, Median = 1170 | Mean = 1172, Median = 1168 |
| SD = 165 | SD = 166 | |
| IQR = [1059, 1274] | IQR = [1062, 1278] | |
| Brainstem | Mean = 4834, Median = 4755 | Mean = 4857, Median = 4794 |
| SD = 797 | SD = 848 | |
| IQR = [4293, 5323] | IQR = [4301, 5333] | |
| Brain volume | Mean = 1,503,249, Median = 1,500,440 | Mean = 1,490,284, Median = 1,490,310 |
| SD = 74,378 | SD = 73,870 | |
| IQR = [1,451,903, 1,556,158] | IQR = [1,439,020, 1,541,320] |
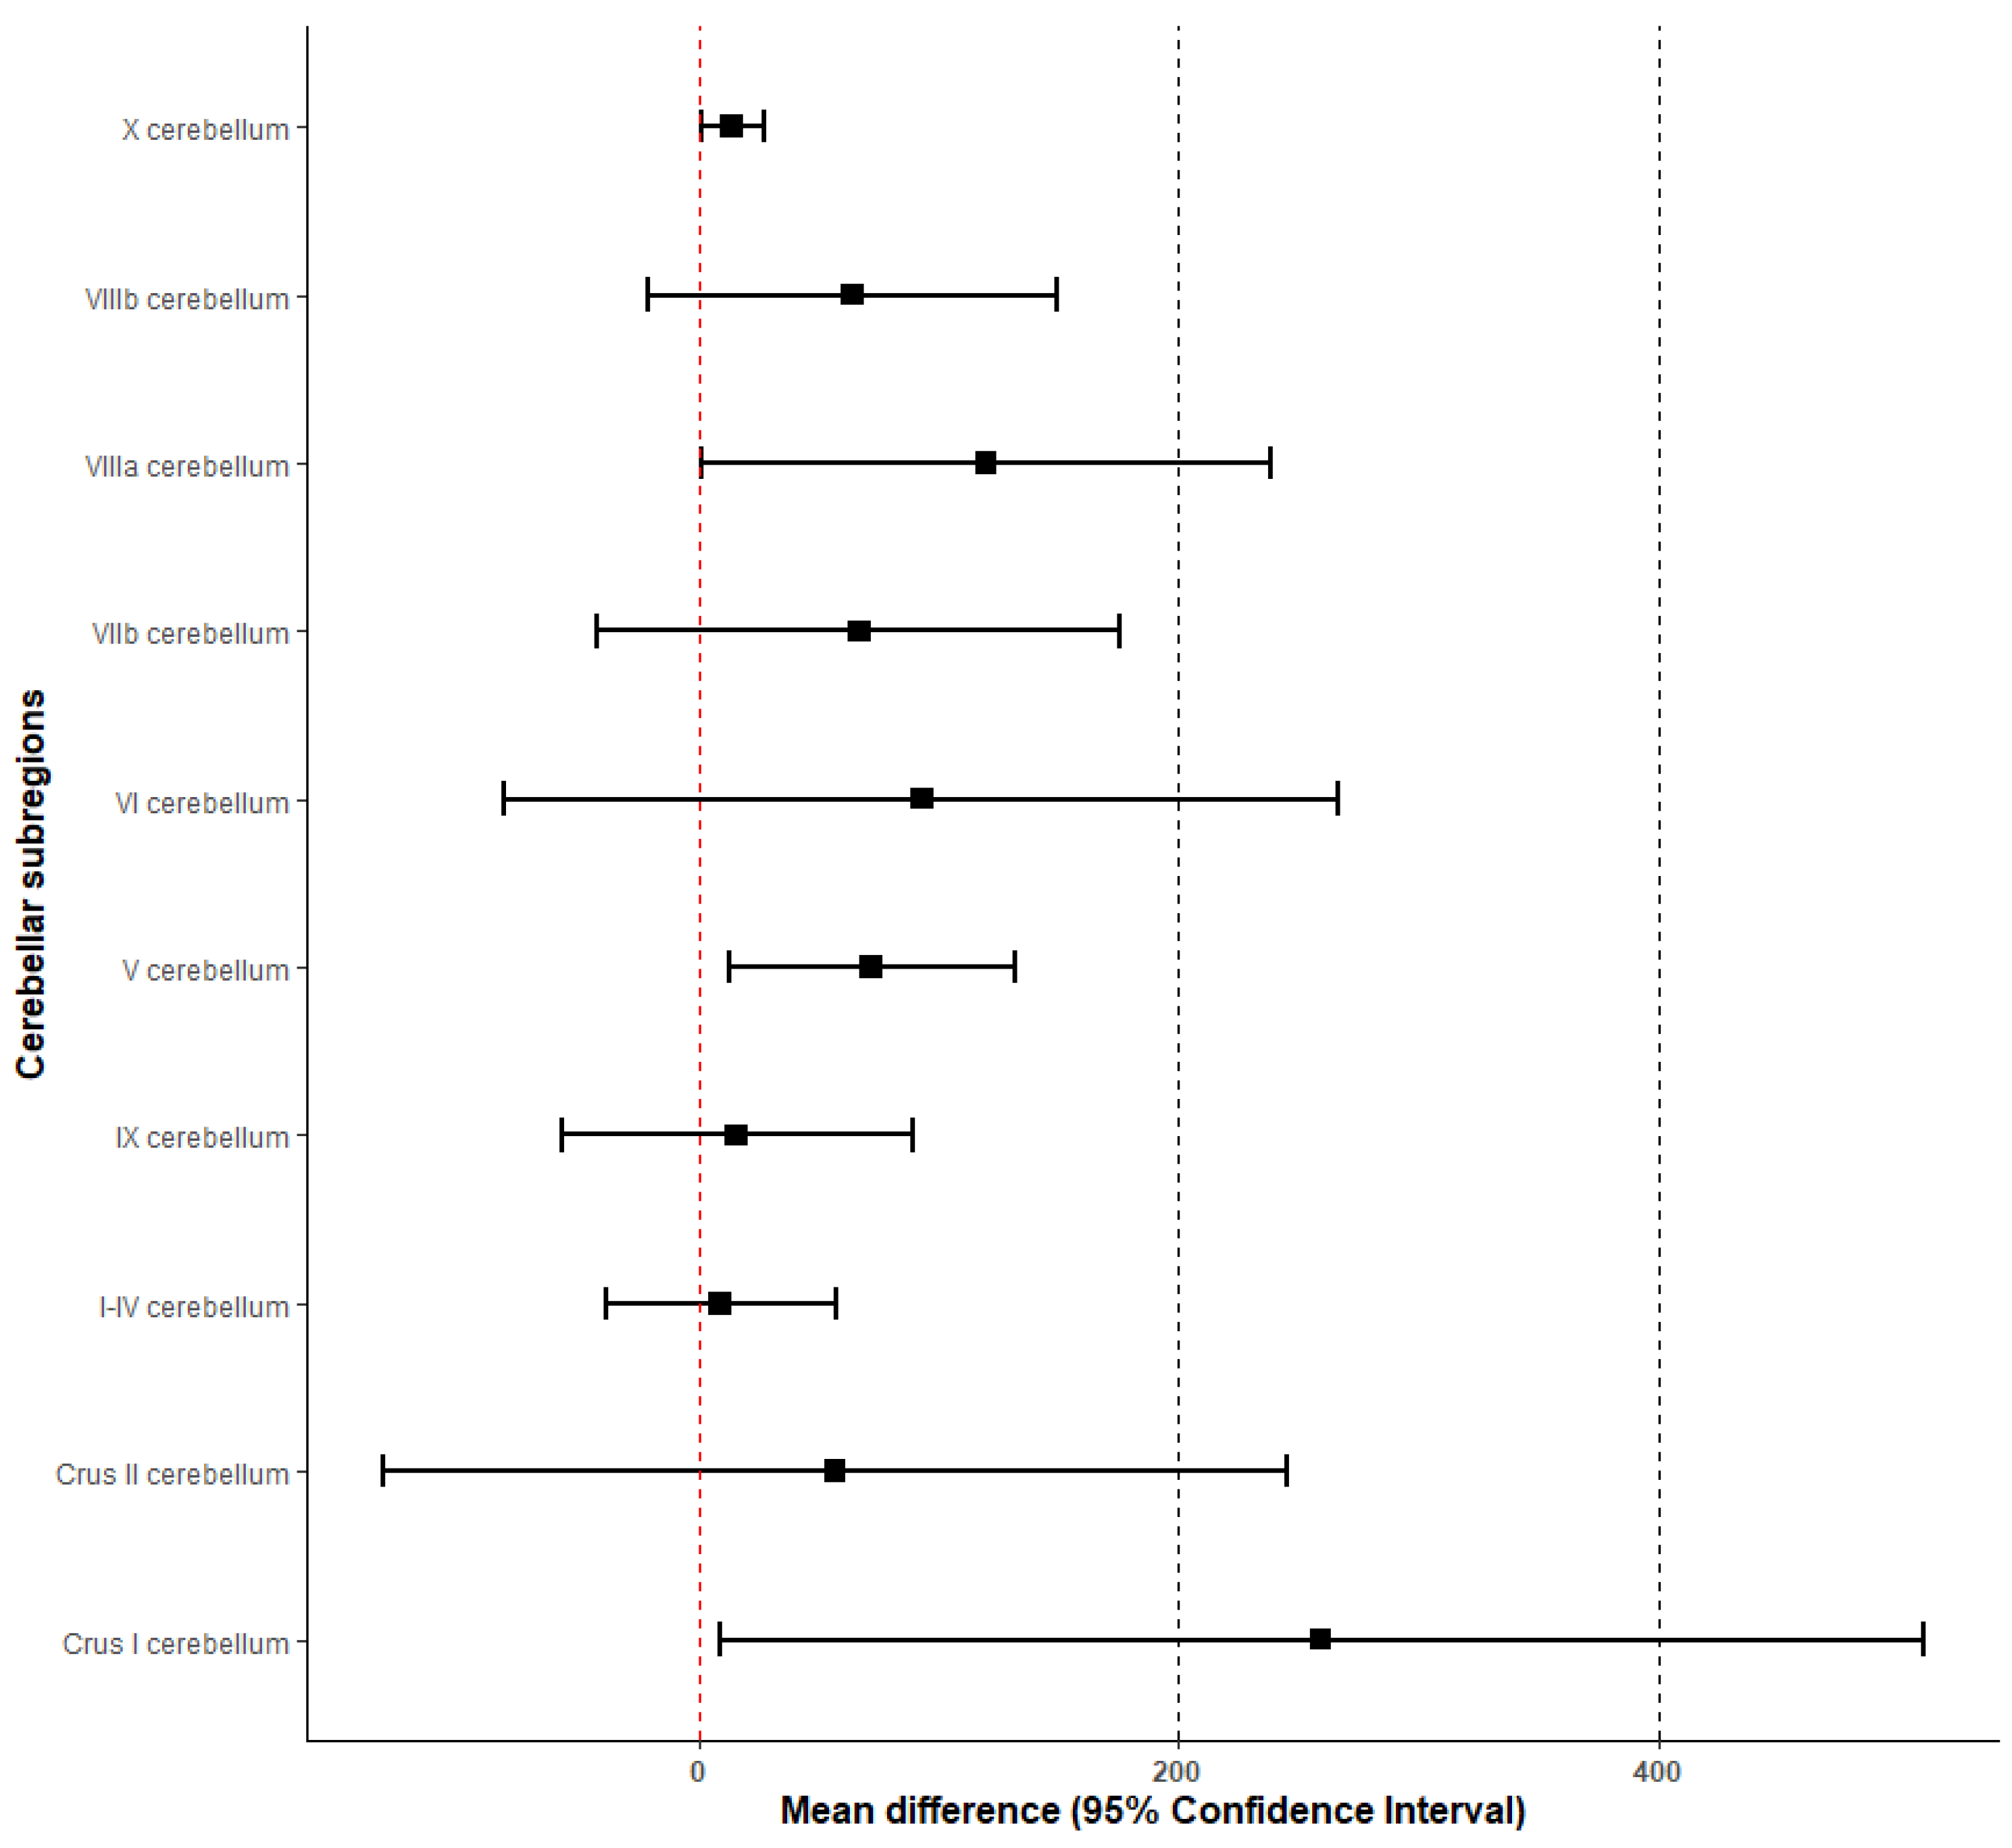
| Brain Region | Mean ± SE | 95% Confidence Interval | Cohen’s d | |
|---|---|---|---|---|
| Cerebellum | 771 ± 438 | [−87, 1630] | 57% | 0.08 |
| I–IV cerebellum | 9 ± 24 | [−38, 57] | 267% | 0.02 |
| V cerebellum | 72 ± 30 | [13, 132] | 42% | 0.10 |
| VI cerebellum | 93 ± 88 | [−81, 266] | 95% | 0.05 |
| Crus I cerebellum | 259 ± 128 | [9, 510] | 49% | 0.08 |
| Crus II cerebellum | 57 ± 96 | [−131, 245] | 168% | 0.03 |
| VIIb cerebellum | 67 ± 55 | [−42, 175] | 82% | 0.05 |
| VIIIa cerebellum | 120 ± 60 | [0.9, 238] | 50% | 0.09 |
| VIIIb cerebellum | 64 ± 44 | [−21, 149] | 69% | 0.06 |
| IX cerebellum | 16 ± 37 | [−57, 89] | 231% | 0.02 |
| X cerebellum | 14 ± 7 | [1, 27] | 50% | 0.09 |
| Brainstem | 27 ± 32 | [−36, 89] | 119% | 0.04 |
Disclaimer/Publisher’s Note: The statements, opinions and data contained in all publications are solely those of the individual author(s) and contributor(s) and not of MDPI and/or the editor(s). MDPI and/or the editor(s) disclaim responsibility for any injury to people or property resulting from any ideas, methods, instructions or products referred to in the content. |
© 2023 by the authors. Licensee MDPI, Basel, Switzerland. This article is an open access article distributed under the terms and conditions of the Creative Commons Attribution (CC BY) license (https://creativecommons.org/licenses/by/4.0/).
Share and Cite
Affatato, O.; Rukh, G.; Schiöth, H.B.; Mwinyi, J. Volumetric Differences in Cerebellum and Brainstem in Patients with Migraine: A UK Biobank Study. Biomedicines 2023, 11, 2528. https://doi.org/10.3390/biomedicines11092528
Affatato O, Rukh G, Schiöth HB, Mwinyi J. Volumetric Differences in Cerebellum and Brainstem in Patients with Migraine: A UK Biobank Study. Biomedicines. 2023; 11(9):2528. https://doi.org/10.3390/biomedicines11092528
Chicago/Turabian StyleAffatato, Oreste, Gull Rukh, Helgi Birgir Schiöth, and Jessica Mwinyi. 2023. "Volumetric Differences in Cerebellum and Brainstem in Patients with Migraine: A UK Biobank Study" Biomedicines 11, no. 9: 2528. https://doi.org/10.3390/biomedicines11092528
APA StyleAffatato, O., Rukh, G., Schiöth, H. B., & Mwinyi, J. (2023). Volumetric Differences in Cerebellum and Brainstem in Patients with Migraine: A UK Biobank Study. Biomedicines, 11(9), 2528. https://doi.org/10.3390/biomedicines11092528