Article

Serum Cytokines and Growth Factors in Subjects with Type 1 Diabetes: Associations with Time in Ranges and Glucose Variability

by
Vadim V. Klimontov
1,*,
Kamilla R. Mavlianova
1,
Nikolai B. Orlov
2,
Julia F. Semenova
1 and
Anton I. Korbut
1
1
Laboratory of Endocrinology, Research Institute of Clinical and Experimental Lymphology—Branch of the Institute of Cytology and Genetics, Siberian Branch of Russian Academy of Sciences (RICEL—Branch of IC&G SB RAS), 630060 Novosibirsk, Russia
2
Laboratory of Clinical Immunogenetics, Research Institute of Clinical and Experimental Lymphology—Branch of the Institute of Cytology and Genetics, Siberian Branch of Russian Academy of Sciences (RICEL—Branch of IC&G SB RAS), 630060 Novosibirsk, Russia
*
Author to whom correspondence should be addressed.
Biomedicines 2023, 11(10), 2843; https://doi.org/10.3390/biomedicines11102843
Submission received: 3 September 2023 / Revised: 8 October 2023 / Accepted: 18 October 2023 / Published: 19 October 2023
(This article belongs to the Special Issue Diabetes: Comorbidities, Therapeutics and Insights)

Abstract

:
The detrimental effect of hyperglycemia and glucose variability (GV) on target organs in diabetes can be implemented through a wide network of regulatory peptides. In this study, we assessed a broad panel of serum cytokines and growth factors in subjects with type 1 diabetes (T1D) and estimated associations between concentrations of these molecules with time in ranges (TIRs) and GV. One hundred and thirty subjects with T1D and twenty-seven individuals with normal glucose tolerance (control) were included. Serum levels of 44 cytokines and growth factors were measured using a multiplex bead array assay. TIRs and GV parameters were derived from continuous glucose monitoring. Subjects with T1D compared to control demonstrated an increase in concentrations of IL-1β, IL-1Ra, IL-2Rα, IL-3, IL-6, IL-7, IL-12 p40, IL-16, IL-17A, LIF, M-CSF, IFN-α2, IFN-γ, MCP-1, MCP-3, and TNF-α. Patients with TIR ≤ 70% had higher levels of IL-1α, IL-1β, IL-6, IL-12 p70, IL-16, LIF, M-CSF, MCP-1, MCP-3, RANTES, TNF-α, TNF-β, and b-NGF, and lower levels of IL-1α, IL-4, IL-10, GM-CSF, and MIF than those with TIR > 70%. Serum IL-1β, IL-10, IL-12 p70, MCP-1, MCP-3, RANTES, SCF, and TNF-α correlated with TIR and time above range. IL-1β, IL-8, IL-10, IL-12 p70, MCP-1, RANTES, MIF, and SDF-1α were related to at least one amplitude-dependent GV metric. In logistic regression models, IL-1β, IL-4, IL-10, IL-12 p70, GM-CSF, HGF, MCP-3, and TNF-α were associated with TIR ≤ 70%, and MIF and PDGF-BB demonstrated associations with coefficient of variation values ≥ 36%. These results provide further insight into the pathophysiological effects of hyperglycemia and GV in people with diabetes.

Graphical Abstract

1. Introduction

The burden of type 1 diabetes (T1D) is enormous and is expected to increase. In 2021, there were about 8.4 million individuals worldwide living with T1D. The remaining life expectancy of a 10-year-old diagnosed with T1D ranges from a mean of 13 years in low-income countries to 65 years in high-income ones [1]. Vascular diabetes complications remain an important determinant of mortality in subjects with T1D [2,3,4]. The Diabetes Control and Complications Trial (DCCT) and its longitudinal observational follow-up study, the Epidemiology of Diabetes Interventions and Complications (EDIC) study, clearly showed a reduction in the incidence of diabetic retinopathy, diabetic nephropathy, diabetic neuropathy, and cardiovascular disease (CVD) outcomes, following the optimization of glycemic control in people with T1D [5,6]. However, the benefits of intensive insulin treatment in terms of the risk of major adverse cardiovascular events vary substantially between individuals with T1D [7]. Age, diabetes duration, and glucose level do not completely explain the associations between complications and mortality [4]. This underlines the necessity for a better understanding of the drivers of diabetic complications.
Clinicians noticed a long time ago that many patients with excessive glucose fluctuations and unstable glycemic control rapidly develop complications. One of the first experimental studies testing the deteriorating effect of glucose fluctuations on the kidneys was published in 1957: it showed the rapid development of glomerulosclerosis in rats when excessive blood glucose fluctuations were induced by the intermittent administration of glucose and insulin [8]. In recent years, the role of glucose variability (GV) as a trigger of diabetic vascular complications has attracted increasing attention [9,10]. In the observational Finnish Diabetic Nephropathy (FinnDiane) study, glycated hemoglobin A1c (HbA1c) variability predicts incident cardiovascular events, microalbuminuria, and overt diabetic nephropathy in subjects with T1D [11]. A recent analysis of 14 studies with 254,017 patients with diabetes revealed that the highest HbA1c variability is associated with increased risks of CVD. The CVD risk associated with HbA1c variability might be even higher among patients with T1D [12]. However, the role of short-term GV as a trigger of diabetic complications remains to be clarified.
Continuous glucose monitoring (CGM) opened the way for the comprehensive assessment of short-term GV in patients with diabetes. Two principal dimensions of GV, amplitude and time, can be assessed and visualized from CGM data [9]. Time in range (TIR), time above range (TAR), and time below range (TBR) became standardized CGM metrics for clinical care [13]. Accumulating evidence suggests a negative association between time in range (TIR) and microvascular complications in subjects with T1D [14,15]. In addition, associations of coefficient of variation (CV) and the mean amplitude of glycemic excursions (MAGE) with diabetic microvascular complications [16] and cardiovascular autonomic neuropathy [17] were reported.
The mechanisms of the harmful effects of excessive GV on target organs in diabetes have been intensively studied in recent years. The cardiovascular system, pancreas, adipose and muscle tissues, gastrointestinal tract, and kidney have been recognized as the loci with the highest expression of GV-related genes [18]. Current data indicate that GV effects can be realized through oxidative stress, non-enzymatic glycation, chronic low-grade inflammation, endothelial dysfunction, platelet activation, impaired angiogenesis, and renal fibrosis. At the molecular level, these pathophysiological processes may be mediated through shifts in the production of cytokines and growth factors playing an important role in intercellular interactions [19]. At present, the relationships between GV and changes in the production of these regulators are not well understood.
The large number of secreted cytokines and their interactions make it difficult to assess changes in the cytokine response during stress and disease. Moreover, measuring individual regulators can lead to a one-sided or even incorrect interpretation of the response. In such situations, multiplex platforms, widely used to measure multiple biomarkers from a single assay, may have advantages over single assay-based detection methods [20,21]. In recent years, a multiplex bead assay has become increasingly popular in studies of cytokine panels in various diseases, including diabetes [22,23,24].
Therefore, we aimed to assess a broad panel of circulating cytokines and growth factors in subjects with T1D via a multiplex bead array assay and to determine the associations of these regulators with CGM-derived TIR and GV parameters.

2. Materials and Methods
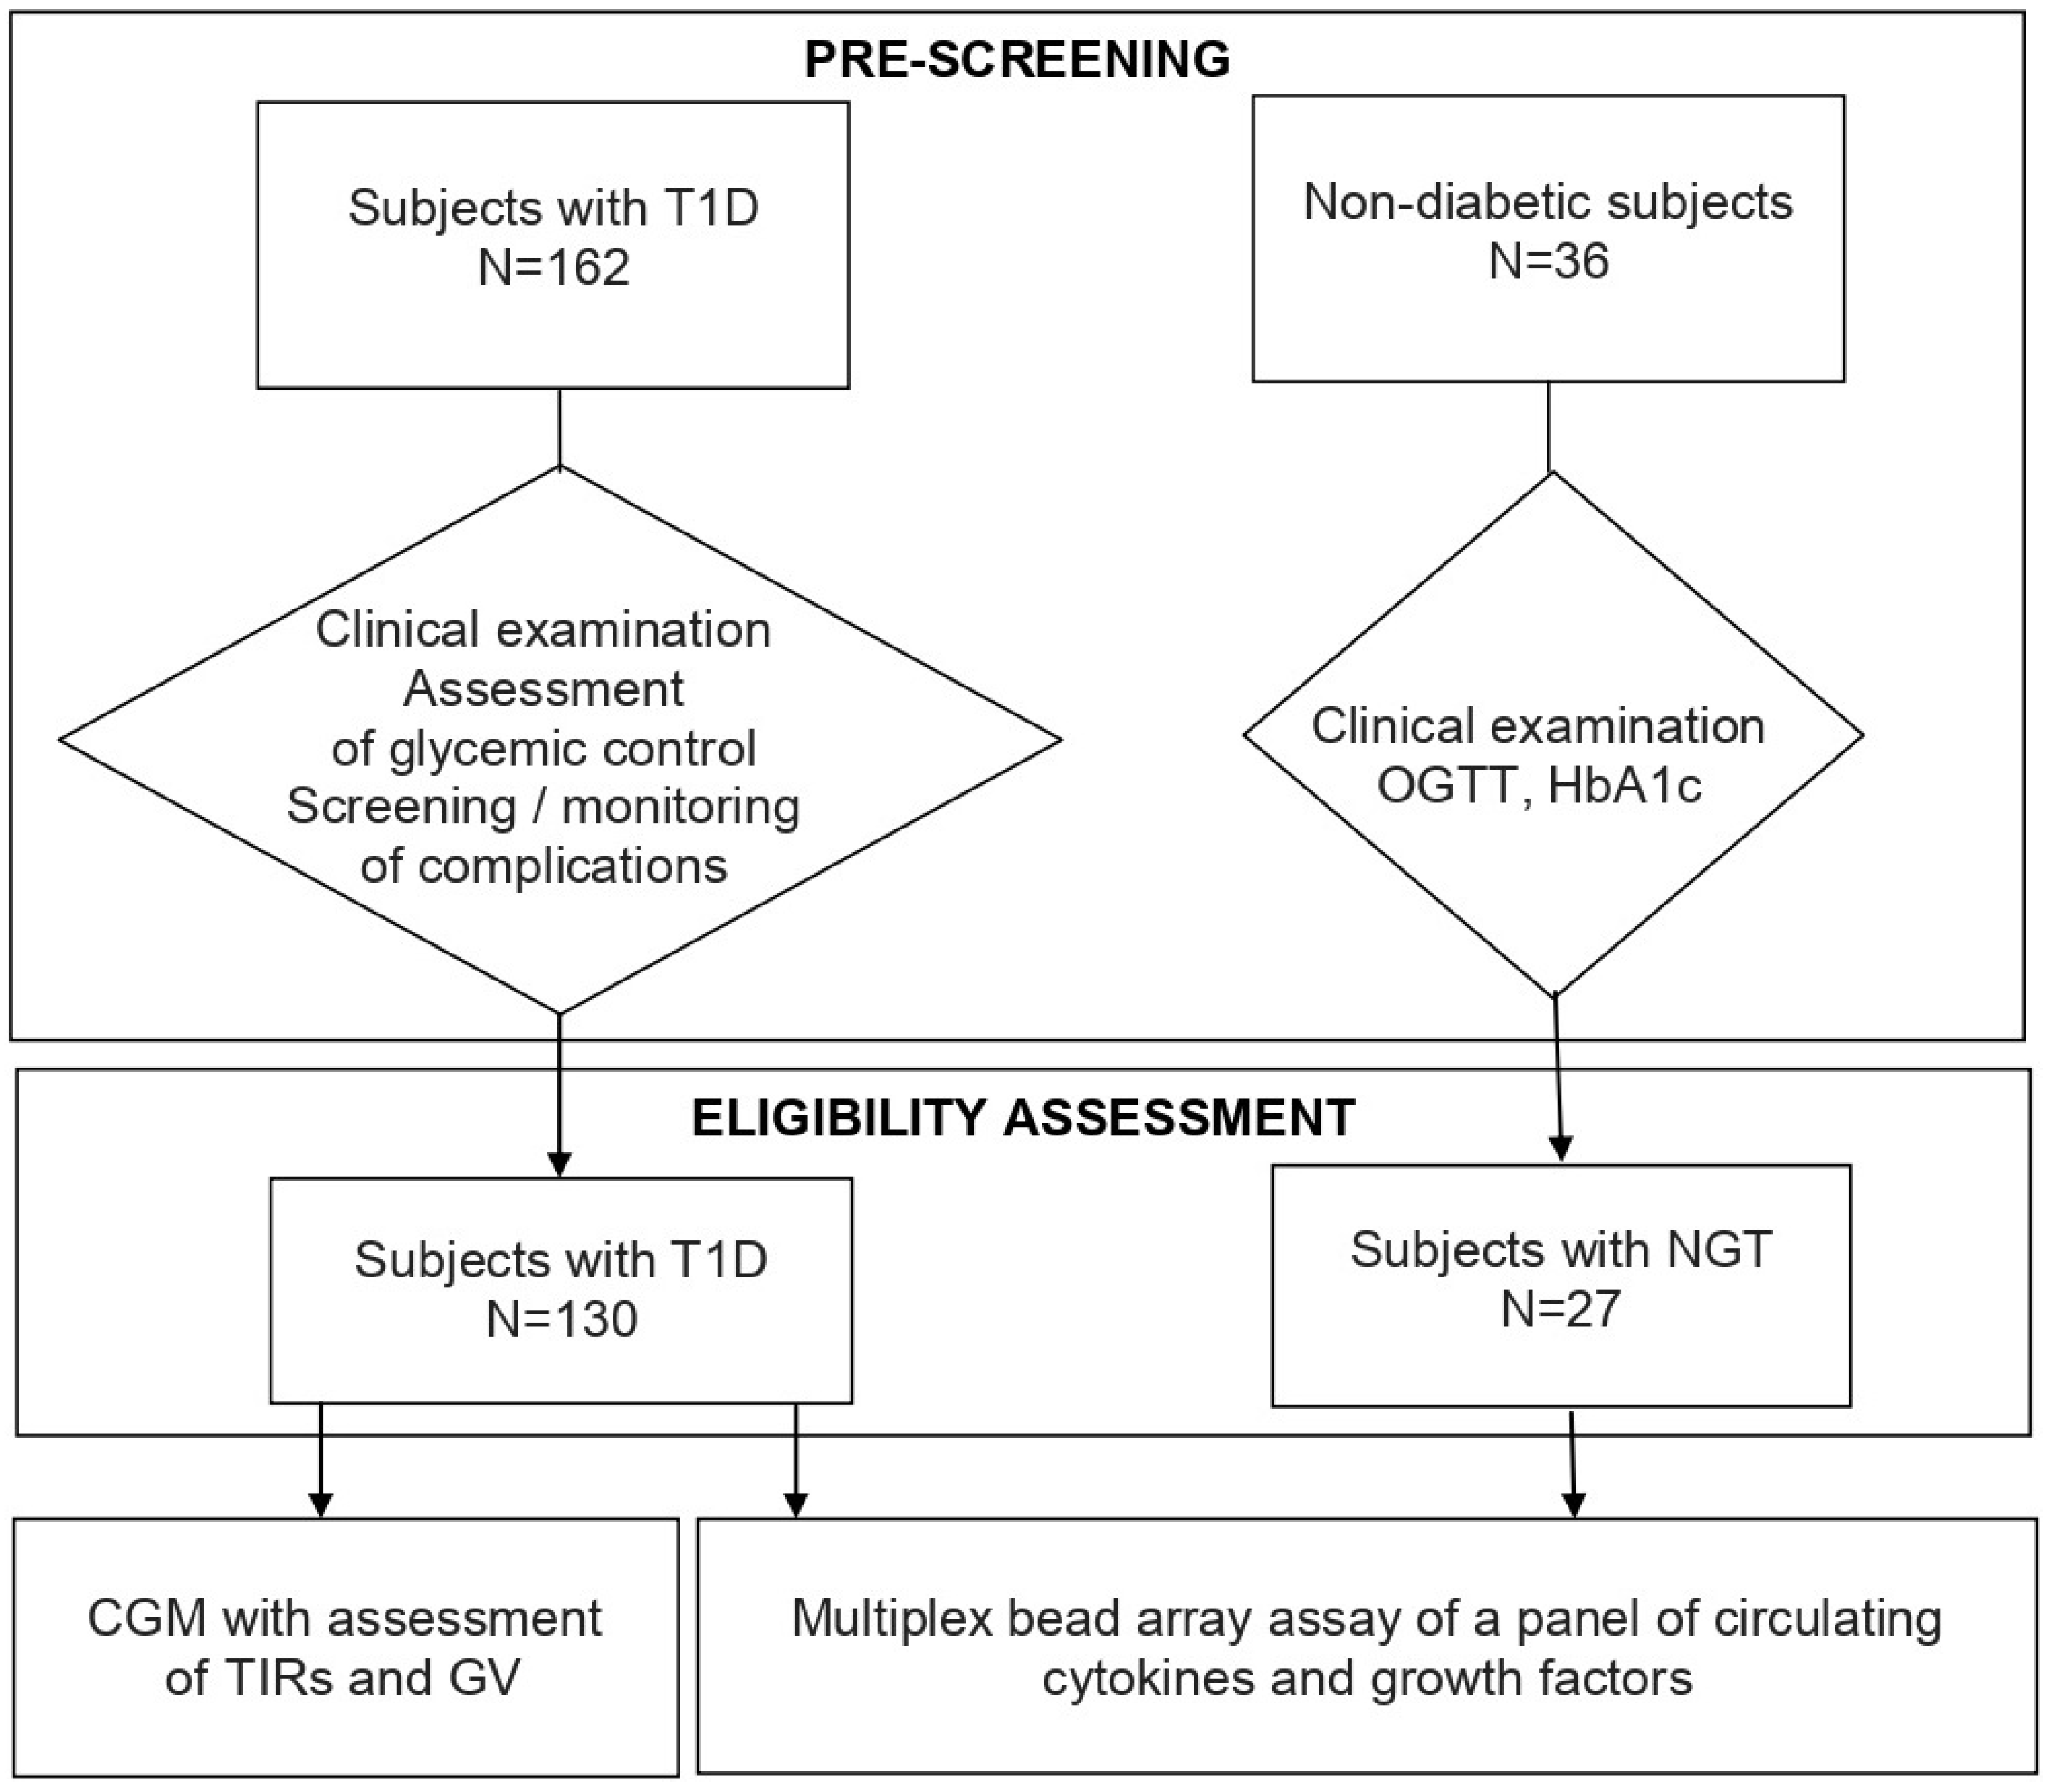
2.1. Design

We performed a cross-sectional observational single-center comparative study.
Caucasian male and female patients with T1D aged 18 to 70 years were included. Acute infections within three months prior to the study, pregnancy, malignant neoplasm, chronic inflammatory or autoimmune diseases, current diabetic ketoacidosis or hyperglycemic hyperosmolar state, end-stage renal disease, and diabetic foot syndrome were established as the principal exclusion criteria. Subjects without the above-mentioned diseases and conditions who had normal glucose tolerance (NGT) verified by the results of the oral glucose tolerance test and HbA1c measurement were included in the control group.
All study participants underwent a detailed clinical examination with real-time CGM. Digital CGM data were used for the calculation of TIRs and GV parameters. The panel of serum cytokines and growth factors was assessed with a multiplex bead array assay.
The study design is shown in Figure 1.

2.2. Methods

General clinical tests. The levels of HbA1c, serum biochemical parameters, and urinary albumin were assessed in patients with T1D with the use of a AU480 Chemical Analyzer (Beckman Coulter, Brea, CA, USA) and commercially available cartridges. A complete blood count was performed on a hematology analyzer (Analyticon Biotechnologies AG, Lichtenfels, Germany). The fasting C-peptide was determined using chemiluminescent immunoassay with an Immulite 2000 XPi immunological analyzer (Siemens Healthineers, Erlangen, Germany).
A standard oral glucose tolerance test with 75 g of glucose was performed in non-diabetic subjects. Blood samples for the measurement of glucose were taken from the cubital vein at 0 and 120 min of the test.
CGM parameters. Patients with T1D underwent real-time CGM within 3–13 days (median 5.4 days) with MMT-722 or MMT-754 monitoring systems and CareLink® Pro software 2.5.524.0 (version 2.5A, Medtronic, Minneapolis, MN, USA). Study participants were instructed to calibrate the system at least three times a day. The results of the CGM of each subject were reviewed individually and recording defects were eliminated.
TIRs were defined according to the International Consensus on Use of Continuous Glucose Monitoring [25] and the International Consensus on Time in Range [13]. Specifically, we assessed TIR: 70–180 mg/dL (3.9–10.0 mmol/L), time above range, level 1 (TAR L-1: 181–250 mg/dL [10.1–13.9 mmol/L]), time above range, level 2 (TAR L-2: >250 mg/dL [>13.9 mmol/L]), time below range, level 1 (TBR L-1: 54–69 mg/dL [3.0–3.8 mmol/L]), and time below range, level 2 (TBR L-2: <54 mg/dL [<3.0 mmol/L]). In addition, the following GV parameters were calculated: CV, MAGE, and mean absolute glucose (MAG) changes. Among these parameters, CV is an indicator of variations around the mean glucose, MAGE is the mean differences from peaks to nadirs, and MAG is the absolute differences between sequential readings divided by the time [9,10]. The GV parameters were estimated with the use of EasyGV v. 9.0.R2 software [26]. The values of TIR > 70% were considered as targets [13] and values of CV < 36% as indicators of stable glucose level [25].
Serum cytokines and growth factors. Serum samples for the assay of cytokines and growth factors were obtained from the fasting blood and stored at −80 °C until the analysis. Repeated freeze–thaw cycles were avoided.
The concentrations of interleukin 1 alpha (IL-1α), interleukin 1 beta (IL-1β), interleukin-1 receptor antagonist (IL-1Ra), interleukin 2 (IL-2), interleukin-2 receptor alpha chain (IL-2Rα), interleukin 3 (IL-3), interleukin 4 (IL-4), interleukin 5 (IL-5), interleukin 6 (IL-6), interleukin 7 (IL-7), interleukin 8 (IL-8), interleukin 9 (IL-9), interleukin 10 (IL-10), interleukin-12 subunit beta (IL-12 p40), interleukin 12 active heterodimer (IL-12 p70), interleukin 16 (IL-16), interleukin 17A (IL-17A), interleukin 18 (IL-18), leukemia inhibitory factor (LIF), granulocyte colony-stimulating factor (G-CSF), granulocyte-macrophage colony-stimulating factor (GM-CSF), macrophage colony-stimulating factor (M-CSF), chemokine growth-regulated protein alpha (GRO-α), interferon alpha 2 (IFN-α2), interferon gamma (IFN-γ), interferon gamma-induced protein 10 (IP-10), monocyte chemoattractant protein 1 (MCP-1), monocyte chemoattractant protein 3 (MCP-3), macrophage migration inhibitory factor (MIF), monokine induced by interferon-γ (MIG), macrophage inflammatory protein 1 alpha (MIP-1α), macrophage inflammatory protein 1 beta (MIP-1β), regulated on activation, normal T cell expressed and secreted (RANTES), tumor necrosis factor alpha (TNF-α), tumor necrosis factor-beta (TNF-β), TNF-related apoptosis-inducing ligand (TRAIL), soluble cytotoxic factor (SCF), stem cell growth factor beta (SCGF beta), stromal cell-derived factor-1 alpha (SDF-1α), basic fibroblast growth factor (bFGF), platelet-derived growth factor subunit B (PDGF-BB), hepatocyte growth factor (HGF), beta subunit of nerve growth factor (β-NGF), and vascular endothelial growth factor (VEGF) were assessed with the use of Bio-Plex Pro™ Human Cytokine Screening Panel Assay (Bio-Rad Laboratories, Hercules, CA, USA).
A multiplex bead array assay was performed according to the manufacturer’s instructions. Serum samples were centrifuged at 10,000× g for 10 min at 4 °C, diluted 1:4 with Bio-Plex Sample Diluent, and incubated with antibody-coupled beads, detection antibody, and streptavidin for 30 min, 30 min, and 10 min, respectively. After each coating with antigen, the plate was washed with a Bio-Plex Handheld Magnetic Washer, resuspended, and vortexed. Fluorescence was measured on a two-beam laser automated analyzer Bio-Plex® 200 system. Data were acquired with Bio-Plex Manager Software 4.0. The values below the detection limit were set to zero.

2.3. Statistical Analysis

Statistics 12.0 software package (Dell, Round Rock, TX, USA) was used for analysis. The outliers were excluded with Dixon’s Q test. Quantitative data are presented as medians (lower quartiles; upper quartiles); frequencies are presented as percentages (%). The Kolmogorov–Smirnov (KS) test was applied to test the normality of data distribution. As most of the studied parameters were not distributed normally, a non-parametric Mann–Whitney U-test was used for group comparisons. Spearman’s rank correlation analysis and logistic regression analysis were applied to test the associations between studied parameters. p-values less than 0.05 were considered significant.

3. Results

3.1. Clinical Characteristics of the Study Participants

One hundred and thirty subjects with T1D, fifty-five men and seventy-five women, aged from 18 to 70 years (median 33 years), with diabetes duration from 0.5 to 55 years (median 15 years), were included in the study. Eighty eight patients had normal body mass index (BMI), twenty-four were overweight, and eighteen individuals had obesity. The level of fasting C-peptide in most patients was below the sensitivity limit (<0.1 ng/mL); however, 19 subjects had detectable C-peptide (range: 0.102–1.3 ng/mL). Eighty-two individuals received multiple daily injections of insulin and forty-eight were on continuous subcutaneous insulin infusion. Clinical characteristics are presented in Table 1.
Twenty-seven non-obese individuals with NGT, twelve men and fifteen women, from 19 to 62 years of age (median 32 years), were included in the control group.
Mean monitoring glucose, CGM-derived TIRs, and GV parameters in subjects with T1D are presented in Table 2.

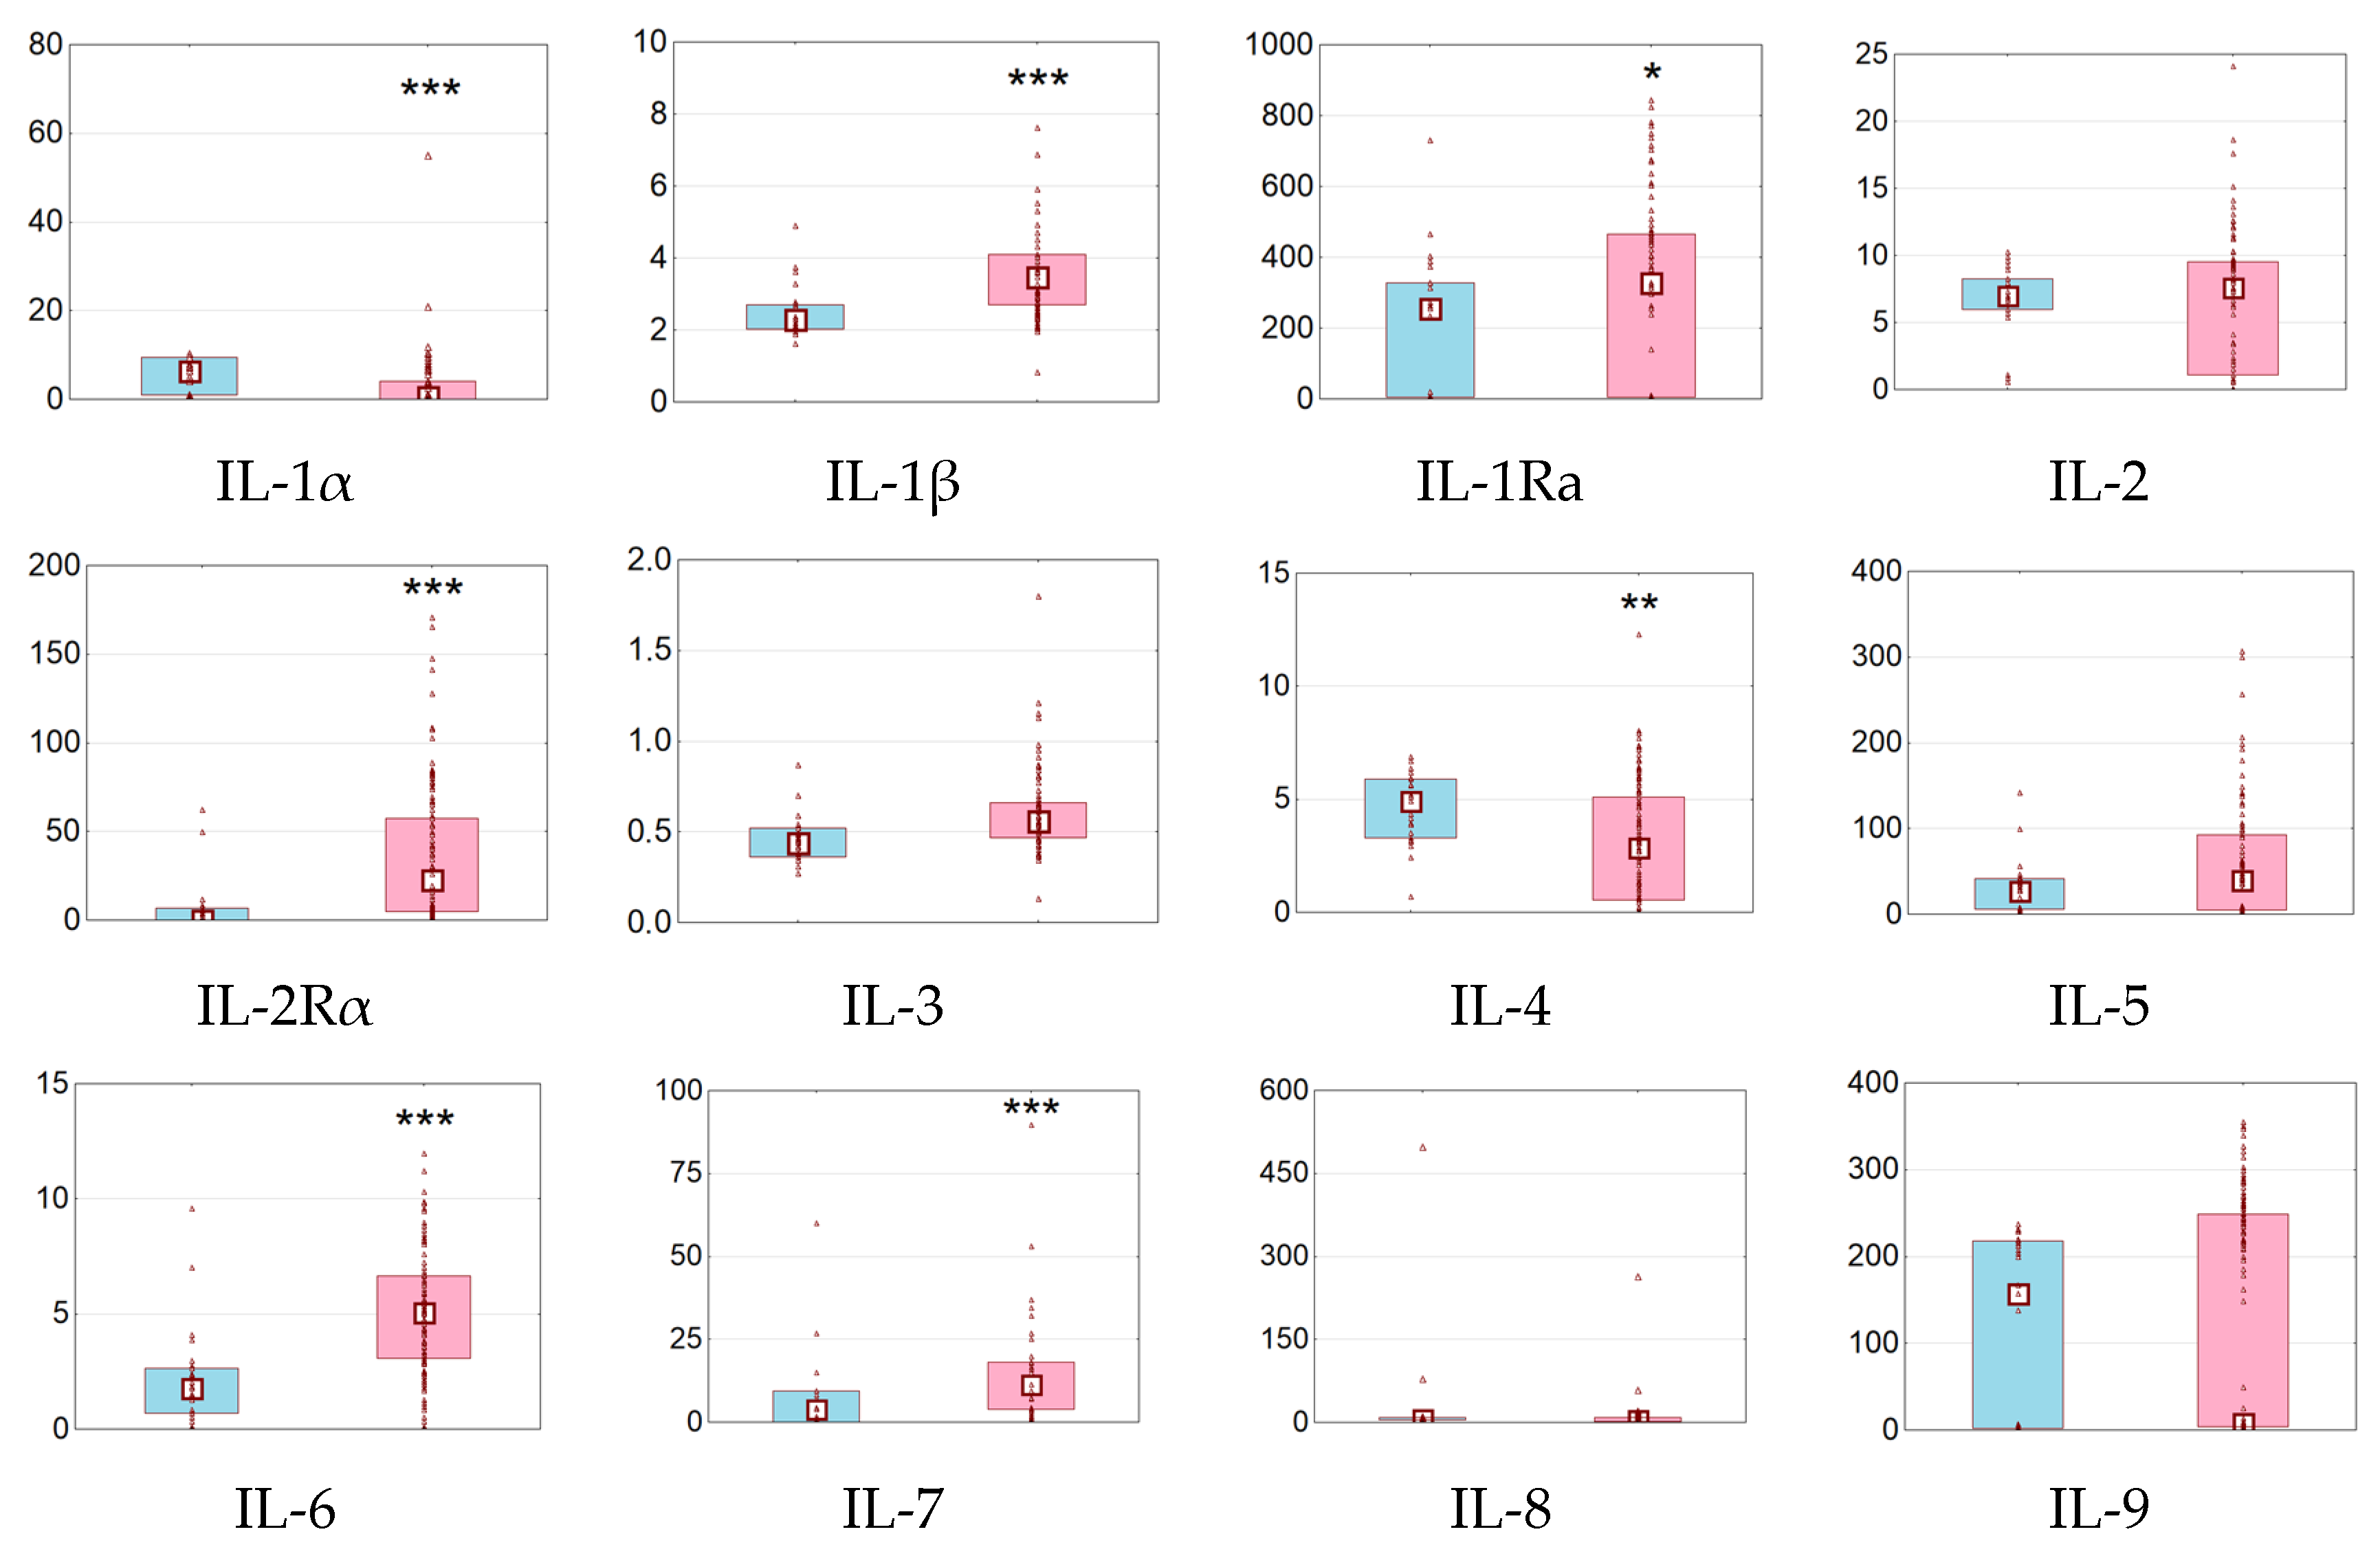
3.2. Serum Cytokines and Growth Factors in Subjects with NGT and T1D

Patients with T1D as compared to subjects with NGT demonstrated significant increases in serum levels of IL-1β, IL-1Ra, IL-2Rα, IL-3, IL-6, IL-7, IL-12 p70, IL-16, IL-17A, LIF, M-CSF, IFN-α2, IFN-γ, MCP-1, MCP-3, and TNF-α (Figure 2).
In addition, there were trends towards an increase in the levels of G-CSF, SCF, TRAIL, and HGF. On the other hand, concentrations of IL-1α, IL-4, and GM-CSF were decreased and MIF demonstrated a tendency to decrease. Other molecules showed no significant changes (Figure 2).

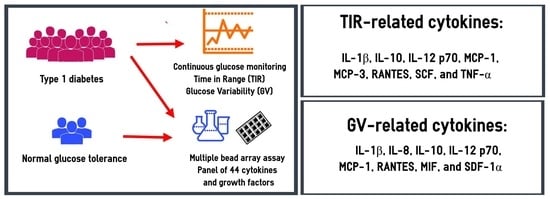
3.3. Serum Cytokines and Growth Factors in Subjects with T1D: Relationships with TIRs

The changes in the levels of the most studied molecules were more pronounced in subjects with TIR < 70%; in this group we found significant increases in the levels of IL-1β, IL-1Ra, IL-2Rα, IL-3, IL-6, IL-7, IL-12 p40, IL-16, IL-17A, G-CSF, M-CSF, IFN-γ, MCP-1, MCP-3, TNF-α, TNF-β, SCF, and HGF, and decreases in the levels of IL-1α, IL-4, IL-8, IL-10, GM-CSF, and MIF when compared to control (Table 3). In patients with TIR > 70%, concentrations of IL-1α, IL-1β, IL-2Rα, IL-3, IL-4, IL-7, IL-16, IL-17A, LIF, G-CSF, IFN-α2, IFN-γ, MCP-1, MCP-3, and β-NGF were significantly different from control.
Among subjects with diabetes, those with TIR ≤ 70% had higher levels of IL-1α, IL-1β, IL-6, IL-12 p70, IL-16, LIF, M-CSF, MCP-1, MCP-3, RANTES, TNF-α, TNF-β, and b-NGF, and lower levels of IL-1α, IL-4, IL-10, GM-CSF, and MIF than individuals with TIR > 70% (Table 3).
We found weak correlations between TIR and concentrations of IL-1β (r = −0.21, p = 0.02), IL-10 (r = 0.23, p = 0.008), IL-12 p70 (r = −0.26, p = 0.004), MCP-1 (r = −0.32, p = 0.0002), MCP-3 (r = −0.19, p = 0.03), RANTES (r = −0.24, p = 0.006), SCF (r = −0.18, p = 0.04), and TNF-α (r = −0.23, p = 0.008). Most of these cytokines demonstrated correlations with TAR L1: IL-1β (r = 0.23, p = 0.008), IL-10 (r = −0.21, p = 0.02), IL-12 p70 (r = 0.28, p = 0.001), MCP-1 (r = 0.32, p = 0.0002), MCP-3 (r = 0.21, p = 0.02), RANTES (r = 0.30, p = 0.0005), TNF-α (r = 0.29, p = 0.0008), and TAR L2: IL-1β (r = 0.24, p = 0.006), IL-10 (r = −0.24, p = 0.006), IL-12 p70 (r = 0.24, p = 0.006), IL-16 (r = 0.20, p = 0.02), MCP-1 (r = 0.28, p = 0.001), MCP-3 (r = 0.19, p = 0.03), MIF (r = −0.20, p = 0.02), RANTES (r = 0.21, p = 0.02), SCF (r = 0.22, p = 0.01), and TNF-α (r = 0.22, p = 0.01).
There were negative correlations between TBR L1 and IL-1β (r = −0.29, p = 0.0008), IL-3 (r = −0.23, p = 0.008), IL-4 (r = −0.24, p = 0.006), IL-16 (r = −0.23, p = 0.008), IL-18 (r = −0.20, p = 0.02), LIF (r = −0.21, p = 0.02), MCP-3 (r = −0.34, p < 0.0001), MIP-1α (r = −0.23, p = 0.008), β-NGF (r = −0.26, p = 0.004), and TNF-α (r = −0.23, p = 0.008). Additionally, we found negative correlations between TBR L2 and IL-1Ra (r = −0.21, p = 0.02), IL-3 (r = −0.22, p = 0.01), IL-16 (r = −0.20, p = 0.02), MCP-3 (r = −0.22, p = 0.01), and G-CSF (r = −0.23, p = 0.008), and a positive correlation between TBR L2 and PDGF-BB (r = 0.23, p = 0.008).

3.4. Serum Concentrations of Cytokines and Growth Factors in Subjects with T1D: Relationships with GV

We compared the concentrations of the studied cytokines and growth factors in patients with CV values < 36% and in those with CV ≥ 36%. Most of the molecules demonstrated no significant differences between the groups (Table 4). However, MCP-1 and RANTES were markedly higher and the MIF level was decreased in patients with unstable glucose levels. Both diabetic groups showed significant differences with the control group in concentrations of IL-1α, IL-1β, IL-2Rα, IL-3, IL-4, IL-6, IL-7, IL-16, IL-17A, LIF, GM-CSF, M-CSF, IFN-γ, MCP-1, MCP-3, and β-NGF.
In subjects with T1D, CV correlated positively with concentrations of MCP-1 (r = 0.18, p = 0.04) and RANTES (r = 0.27, p = 0.002). There were negative correlations between CV and IL-10 (r = −0.23, p = 0.008) and MIF (r = −0.26, p = 0.003). MAGE demonstrated positive correlations with IL-1β (r = 0.19, p = 0.03), IL-12 p70 (r = 0.29, p = 0.0008), MCP-1 (r = 0.21, p = 0.02), RANTES (r = 0.27, p = 0.02), and SDF-1α (r = 0.21, p = 0.02). There were negative correlations between MAGE and IL-8 (r = −0.19, p = 0.03), IL-10 (r = −0.22, p = 0.01), and MIF (r = −0.25, p = 0.004). MAG showed positive correlations with IL-12 p70 (r = 0.39, p < 0.0001), MCP-1 (r = 0.31, p = 0.0003), and SDF-1α (r = 0.26, p = 0.003).

3.5. Serum Concentrations of Cytokines and Growth Factors in Subjects with T1D: Other Relationships

In the panel of studied molecules, IL-1β, MCP-3, and TNF-α only showed weak positive correlations with HbA1c (r = 0.23, p = 0.008; r = 0.19, p = 0.03; r = 0.21, p = 0.02, respectively). Additionally, IL-1β, IL-2Rα, and IL-16 demonstrated negative correlations with C-peptide (r = −0.25, p = 0.004; r = −0.19, p = 0.03; r = −0.26, p = 0.003, respectively). None of the cytokines were associated with age.
Patients with BMI ≥ 25 kg/m2 when compared to those with BMI < 25 kg/m2 demonstrated higher levels of IL-1β (3.9, 3.0–4.4 vs. 3.3, 2.5–3.9 pg/mL, p = 0.003), IL-12 p70 (7.0, 3.9–13.7 vs. 4.1, 2.7–5.7 pg/mL, p = 0.005), IP-10 (257, 7.5–490 vs. 88, 4.5–372 pg/mL, p = 0.03), LIF (26.5, 8.6–59.3 vs. 8.6, 0–49.4 pg/mL, p = 0.006), MCP-3 (6.0, 0–6.8 vs. 1.0, 0–6.2 pg/mL, p = 0.02), β-NGF (0, 0–1.9 vs. 1.4, 0–4.7 pg/mL, p = 0.002), and TNF-α (7.4, 3.0–75 vs. 4.8, 0.56–54 pg/mL, p = 0.02) and lower levels of IL-10 (4.3, 2.9–5.3 vs. 5.2, 3.8–6.0 pg/mL, p = 0.049). Other cytokines did not demonstrate statistically significant differences (data are not shown). BMI correlated positively with IL-1β (r = 0.20, p = 0.02), IL-16 (r = 0.23, p = 0.008), IP-10 (r = 0.20, p = 0.02), LIF (r = 0.19, p = 0.03), MCP-3 (r = 0.20, p = 0.02), and β-NGF (r = 0.21, p = 0.02). There was a negative correlation between BMI and IL-10 (r = −0.20, p = 0.02).

3.6. Multiple Regression Models

In logistic regression models, the levels of IL-1β, IL-4, IL-10, IL-12 (p70), GM-CSF, HGF, MCP-3, MIF, and TNF-α were associated with TIR ≤ 70% (Table 5). All these molecules, excluding MIF, demonstrated significant associations with TIR ≤ 70% after adjustments for age, sex, BMI, diabetes duration, and eGFR. The concentrations of MIF and PDGF-BB were associated with CV ≥ 36%.

4. Discussion

In this study, we assessed serum levels of 44 cytokines and growth factors that are discussed as mediators of diabetic complications in subjects with T1D depending on CGM-derived TIRs and GV metrics. To determine the circulating regulators, we used multiplex analysis, or multiplex bead array assay. This method makes it possible to simultaneously determine a large number of biomarkers in one biological sample [20,21]. Moreover, we performed a comprehensive analysis of the GV [10,27] that included an assessment of time-dependent parameters (TIR, TAR L1, TAR L2, TBR L1, TBR L2), the dispersion of glucose values (CV), the amplitude of glucose fluctuations (MAGE), and the rate of glucose changes (MAG).
The results demonstrate significant changes in the levels of the studied regulators in subjects with T1D as compared with normoglycemic individuals. In particular, we recorded an increase in the levels of pro-inflammatory cytokines (IL-1β, IL-6, IL-12 p70, IL-16, IL-17A, IFN-γ, TNF-α), monocyte chemoattractant proteins (MCP-1, MCP-3), a depletion of an anti-inflammatory cytokine (IL-4), an imbalance among hematopoietic growth factors (IL-3, IL-7, M-CSF, GM-CSF), and changes in the concentrations of other regulators of the immune system and cell differentiation (IL-1α, IL-1Ra, IL-2Rα, IFN-α2, LIF). In general, these findings are consistent with the literature data on an increase in the levels of circulating IL-1β [28,29,30], IL-6 [29,31,32], IL-12 [29], IL-17A [30,33], IFN-γ [32,34], MCP-1 [29,35], TNF-α [28,29,32,36], and a decrease in IL-4 concentrations [37] in patients with T1D. However, decreased concentrations of IL-6 [28] and MCP-1 [38,39] in T1D patients were also reported. Other authors demonstrated no differences between healthy individuals and people with diabetes in serum IL-4 [40] and MCP-1 [41]. The discrepancies in the data can be explained by the heterogeneity of the included patients in terms of age, diabetes duration, the presence of complications, and the quality of glycemic control.
When interpreting the levels of cytokines in subjects with T1D, the autoimmune nature of the disease should be taken into account. Some studies have matched the levels of circulating cytokines with markers of the autoimmune process in patients with T1D. It was reported that children with one or two diabetes-related antibodies (IA-2 and/or GAD65) have significantly higher levels of IL-1β and IL-2 and lower levels of IL-4 than children with diabetes who were negative for these markers [40]. In patients with recent-onset T1D, an increase in IL-18 and decrease in MIF and MCP-1 levels were associated with IA-2 and GAD65 antibody positivity [42]. Another study showed a dependency of accelerated autoimmunity and beta cell destruction on increased IFN-γ, IL-12, and IL-17 and decreased IL-4, IL-6, and IL-13 in pediatric patients with T1D [37]. The onset of T1D in children was characterized by the upregulation of GM-CSF, IL-1β, IL-7, IL-8, IL-10, IL-17F, IL-21, IL-23, and IL-27, but not IL-6 or TNF-α; the presence of autoantibodies (anti-IA-2 and -ZnT8) influenced the blood cytokine levels [43]. In this study, we did not test patients for autoimmune markers of diabetes but assessed fasting C-peptide levels. Though we found negative correlations between fasting C-peptide and IL-1β, IL-2Rα, and IL-16 concentrations, it should be emphasized that the majority of patients in our study had long-term diabetes with undetectable beta-cell function. Therefore, the autoimmune process hardly played a significant role in changing the cytokine profile in our cohort.
The greatest changes in the levels of the studied molecules were revealed in patients with TIR values < 70%. Compared to individuals with target TIR, these patients showed higher concentrations of IL-1β, IL-1Ra, IL-2Rα, IL-3, IL-6, IL-7, IL-12 p70, IL-16, IL-17A, G-CSF, M-CSF, IFN-γ, MCP-1, MCP-3, TNF-α, TNF-β, SCF, and HGF, and lower levels of IL-1α, IL-4, IL-8, IL-10, GM-CSF, and MIF. Associations of IL-1β, IL-4, IL-10, IL-12 (p70), GM-CSF, HGF, MCP-3, and TNF-α with target TIR were confirmed in a multivariate logistic analysis. It is interesting to note that many of the studied molecules showed associations with TIR, but not with HbA1c. Naturally, TIR reflects glucose levels over a much shorter period than HbA1c. Therefore, it can be hypothesized that recent glucose fluctuations may have a greater impact on cytokine production than long-term glycemic control. Our data on the associations of TIR with the levels of important biological regulators represent another argument for the widespread use of TIR in assessing glycemic control in people with diabetes.
Most of the TIR-associated molecules also showed correlations with TAR L1 and TAR L2. This is consistent with the literature data on the pro-inflammatory effect of hyperglycemia in diabetes. In vitro experiments showed a stimulating effect of high glucose on the production of principal proinflammatory cytokines in cultured human mononuclear cells [44,45,46], B cells [47], human umbilical vein endothelial cells [48], aortic endothelial cells [49], glomerular endothelial cells [50], cardiomyocytes [51], and beta cells [52]. According to these data, a high glucose level increases the secretion of IL-1β [46,50,52], IL-6 [46,51], IL-12 [44], IFN-γ [46], TNF-α [45,46,49,51], MCP-1 [48,49], and other proinflammatory cytokines. These findings are consistent with our results. Moreover, we found a depletion in the levels of anti-inflammatory cytokines (IL-4, IL-10) in patients with non-target TIR, which confirmed the imbalance between inflammatory and anti-inflammatory cytokines under hyperglycemic conditions.
In our study, many molecules were associated with time-dependent parameters reflecting hyperglycemic fluctuations (TAR L1 and TAR L2), and some molecules (IL-1β, IL-8, IL-12 p70, MCP-1, RANTES, MIF, SDF-1α) demonstrated correlation(s) with at least one amplitude-dependent GV metric (CV, MAGE, and/or MAG indices). It has previously been shown that intermittently high glucose enhances the secretion of IL-6 and TNF-α by activated monocytes [53]. Moreover, it has been demonstrated that glucose oscillations stimulate IL-6 production in endothelial cells to a greater extent than persistently high glucose [54,55]. Similarly, acute glucose fluctuations were a more potent inducer of IL-1β and TNF-α in rat podocytes than constantly high glucose [56]. In adipocytes, oscillating glucose induced a greater increase in MCP-1 secretion than constantly high glucose [57]. In rats, blood glucose fluctuations induced by intermittent glucose infusions increased the expression of IL-6 and TNF-α in vascular endothelial cells [58]. Therefore, the effect of hyperglycemia on cytokine synthesis may be exacerbated by that of GV.
Hypoglycemia may act as an additional trigger of inflammation in individuals with high GV. In cultured macrophages, intermittent episodes of hypoglycemia and hyperglycemia promote M1 polarization and enhance IL-1β, TNF-α, IL-6, and MCP-1 secretion [59]. In healthy individuals and those with T1D, hypoglycemia promotes leukocyte mobilization into the bloodstream and induces proinflammatory changes in these cells [60]. In individuals with T1D, an episode of two-hour hypoglycemia was followed by an increase in the levels of IL-6 [61]. High blood glucose, replacing hypoglycemia, caused a further increase in the concentrations of IL-6 [62]. Contrary to these data, we found weak negative correlations between TBR and some studied cytokines. This can be explained by associations of these molecules with TIR and TAR, which are in reciprocal relationships in TBR. It should also be noted that all hypoglycemic episodes in our study were non-severe and may not have affected cytokine levels.
When discussing possible confounders affecting cytokine levels in patients with T1D, BMI should be taken into account [63]. The prevalence of obesity among people with T1D is increasing [64] and nearly a quarter of T1D patients are affected by metabolic syndrome [65]. In our study, patients with excessive BMI had higher levels of IL-1β, IL-12 p70, IP-10, LIF, MCP-3, β-NGF, and TNF-α, and lower levels of IL-10. However, associations of IL-1β, IL-10, IL-12 p70, MCP-3, and TNF-α with TIR remained significant after adjustment to BMI, as well as other possible confounders (age, sex, diabetes duration, and eGFR). This demonstrates an independent association of excessive glucose oscillations with the changes in cytokine levels.
Our study is not without limitations. The recruitment of patients in one center could lead to some bias in the sample selection. A cross-sectional design does not prove the causality. The CGM duration was rather short. However, to the best of our knowledge, this is the first study that examined a panel of circulating cytokines and growth factors depending on GV parameters in T1D patients. The strengths of the study are a comprehensive analysis of GV with time-dependent and amplitude-dependent metrics and a determination of the relationship of these parameters with the levels of a large number of cytokines and growth factors. As a result, we have identified the regulators most associated with off-target glucose values and GV. Further studies are needed to explore the effect of glucose fluctuations on their production and signaling. At the same time, identified molecules can be considered to be perspective biomarkers of GV-related immune dysfunction in T1D.

5. Conclusions

Subjects with T1D demonstrated an increase in serum concentrations of IL-1β, IL-1Ra, IL-2Rα, IL-3, IL-6, IL-7, IL-12 p40, IL-16, IL-17A, LIF, M-CSF, IFN-α2, IFN-γ, MCP-1, MCP-3, and TNF-α compared to normoglycemic individuals. The changes in the levels of these cytokines and growth factors are related to the time-dependent and amplitude-dependent GV characteristics. Specifically, the levels of IL-1β, IL-10, IL-12 p70, IL-16, MCP-1, MCP-3, RANTES, TNF-α, SCF, and MIF are associated with TAR, while IL-1β, IL-8, IL-12 p70, MCP-1, RANTES, MIF, and SDF-1α show association with at least one amplitude-dependent GV parameter (CV, MAGE, and MAG). Therefore, the pro-inflammatory effect of hyperglycemia and GV in diabetes may be realized through the shifts in cytokine and chemokine production. The study results provide further support for the notion that GV may be a therapeutic target in the management of diabetes.

Author Contributions

Conceptualization, V.V.K.; methodology, V.V.K.; software, J.F.S.; formal analysis, V.V.K., K.R.M. and A.I.K.; investigation, K.R.M., N.B.O. and J.F.S.; visualization—A.I.K.; resources, V.V.K.; data curation, J.F.S. and A.I.K.; writing—original draft preparation, V.V.K. and K.R.M.; writing—review and editing, V.V.K.; supervision, V.V.K.; project administration, V.V.K.; funding acquisition, V.V.K. All authors have read and agreed to the published version of the manuscript.

Funding

This study was funded by the Russian Science Foundation (grant 20-15-00057-П).

Institutional Review Board Statement

The study protocol was approved by the Ethical Committee of RICEL—Branch of IC&G SB RAS (Approval: 158, 1 June 2020).

Informed Consent Statement

Informed consent was obtained from all subjects involved in the study.

Data Availability Statement

The data that support the findings of this study are available from the corresponding author [V.V.K.] upon reasonable request.

Conflicts of Interest

The authors declare no conflict of interest.

References

  1. Gregory, G.A.; Robinson, T.I.G.; Linklater, S.E.; Wang, F.; Colagiuri, S.; De Beaufort, C.; Donaghue, K.C.; Magliano, D.J.; Maniam, J.; Orchard, T.J.; et al. Global Incidence, Prevalence, and Mortality of Type 1 Diabetes in 2021 with Projection to 2040: A Modelling Study. Lancet Diabetes Endocrinol. 2022, 10, 741–760. [Google Scholar] [CrossRef] [PubMed]
  2. Garofolo, M.; Gualdani, E.; Giannarelli, R.; Aragona, M.; Campi, F.; Lucchesi, D.; Daniele, G.; Miccoli, R.; Francesconi, P.; Del Prato, S.; et al. Microvascular Complications Burden (Nephropathy, Retinopathy and Peripheral Polyneuropathy) Affects Risk of Major Vascular Events and All-Cause Mortality in Type 1 Diabetes: A 10-Year Follow-up Study. Cardiovasc. Diabetol. 2019, 18, 159. [Google Scholar] [CrossRef] [PubMed]
  3. Bjerg, L.; Gudbjörnsdottir, S.; Franzén, S.; Carstensen, B.; Witte, D.R.; Jørgensen, M.E.; Svensson, A.-M. Duration of Diabetes-Related Complications and Mortality in Type 1 Diabetes: A National Cohort Study. Int. J. Epidemiol. 2021, 50, 1250–1259. [Google Scholar] [CrossRef]
  4. Bebu, I.; Braffett, B.H.; De Boer, I.H.; Aiello, L.P.; Bantle, J.P.; Lorenzi, G.M.; Herman, W.H.; Gubitosi-Klug, R.A.; Perkins, B.A.; Lachin, J.M.; et al. Relationships Between the Cumulative Incidences of Long-Term Complications in Type 1 Diabetes: The DCCT/EDIC Study. Diabetes Care 2023, 46, 361–368. [Google Scholar] [CrossRef]
  5. Diabetes Control and Complications Trial Research Group; Nathan, D.M.; Genuth, S.; Lachin, J.; Cleary, P.; Crofford, O.; Davis, M.; Rand, L.; Siebert, C. The Effect of Intensive Treatment of Diabetes on the Development and Progression of Long-Term Complications in Insulin-Dependent Diabetes Mellitus. N. Engl. J. Med. 1993, 329, 977–986. [Google Scholar] [CrossRef]
  6. The Diabetes Control and Complications Trial (DCCT)/Epidemiology of Diabetes Interventions and Complications (EDIC) Study Research Group. Intensive Diabetes Treatment and Cardiovascular Outcomes in Type 1 Diabetes: The DCCT/EDIC Study 30-Year Follow-Up. Diabetes Care 2016, 39, 686–693. [Google Scholar] [CrossRef]
  7. Helmink, M.A.G.; Hageman, S.H.J.; Visseren, F.L.J.; De Ranitz-Greven, W.L.; De Valk, H.W.; Van Sloten, T.T.; Westerink, J. Variability in Benefit from Intensive Insulin Therapy on Cardiovascular Events in Individuals with Type 1 Diabetes: A Post Hoc Analysis of the DCCT/EDIC Study. Diabet. Med. 2023, 40, e15183. [Google Scholar] [CrossRef]
  8. Goth, A.; Lengyel, L.; Nadasdi, N.; Savely, C. Renal Lesions Due to Fluctuations in Blood Sugar Levels. Acta Med. Scand. 1957, 158, 475–480. [Google Scholar] [CrossRef] [PubMed]
  9. Kovatchev, B. Glycemic Variability: Risk Factors, Assessment, and Control. J. Diabetes Sci. Technol. 2019, 13, 627–635. [Google Scholar] [CrossRef]
  10. Sun, B.; Luo, Z.; Zhou, J. Comprehensive Elaboration of Glycemic Variability in Diabetic Macrovascular and Microvascular Complications. Cardiovasc. Diabetol. 2021, 20, 9. [Google Scholar] [CrossRef]
  11. Wadén, J.; Forsblom, C.; Thorn, L.M.; Gordin, D.; Saraheimo, M.; Groop, P.-H.; Finnish Diabetic Nephropathy Study Group A1C. Variability Predicts Incident Cardiovascular Events, Microalbuminuria, and Overt Diabetic Nephropathy in Patients with Type 1 Diabetes. Diabetes 2009, 58, 2649–2655. [Google Scholar] [CrossRef]
  12. Li, F.; Zhang, L.; Shen, Y.; Liu, H.-H.; Zhang, Z.-Y.; Hu, G.; Wang, R.-X. Higher Glucose Fluctuation Is Associated with a Higher Risk of Cardiovascular Disease: Insights from Pooled Results among Patients with Diabetes. J. Diabetes 2023, 15, 368–381. [Google Scholar] [CrossRef]
  13. Battelino, T.; Danne, T.; Bergenstal, R.M.; Amiel, S.A.; Beck, R.; Biester, T.; Bosi, E.; Buckingham, B.A.; Cefalu, W.T.; Close, K.L.; et al. Clinical Targets for Continuous Glucose Monitoring Data Interpretation: Recommendations From the International Consensus on Time in Range. Diabetes Care 2019, 42, 1593–1603. [Google Scholar] [CrossRef]
  14. El Malahi, A.; Van Elsen, M.; Charleer, S.; Dirinck, E.; Ledeganck, K.; Keymeulen, B.; Crenier, L.; Radermecker, R.; Taes, Y.; Vercammen, C.; et al. Relationship Between Time in Range, Glycemic Variability, HbA1c, and Complications in Adults with Type 1 Diabetes Mellitus. J. Clin. Endocrinol. Metab. 2022, 107, e570–e581. [Google Scholar] [CrossRef]
  15. Ranjan, A.G.; Rosenlund, S.V.; Hansen, T.W.; Rossing, P.; Andersen, S.; Nørgaard, K. Improved Time in Range Over 1 Year Is Associated With Reduced Albuminuria in Individuals With Sensor-Augmented Insulin Pump-Treated Type 1 Diabetes. Diabetes Care 2020, 43, 2882–2885. [Google Scholar] [CrossRef]
  16. Šoupal, J.; Škrha, J., Jr.; Fajmon, M.; Horová, E.; Mráz, M.; Škrha, J.; Prázný, M. Glycemic variability is higher in type 1 diabetes patients with microvascular complications irrespective of glycemic control. Diabetes Technol. Ther. 2014, 16, 198–203. [Google Scholar] [CrossRef]
  17. Naaman, S.H.; Mizrak, H.I.; Lind, N.; Laursen, J.C.; Kufaishi, H.; Christensen, M.M.B.; Ranjan, A.G.; Nørgaard, K.; Hansen, C.S. Cardiovascular Autonomic Neuropathy Is Associated With Increased Glucose Variability in People With Type 1 Diabetes. Diabetes Care 2022, 45, 2461–2465. [Google Scholar] [CrossRef]
  18. Saik, O.V.; Klimontov, V.V. Bioinformatic Reconstruction and Analysis of Gene Networks Related to Glucose Variability in Diabetes and Its Complications. Int. J. Mol. Sci. 2020, 21, 8691. [Google Scholar] [CrossRef]
  19. Klimontov, V.V.; Saik, O.V.; Korbut, A.I. Glucose Variability: How Does It Work? Int. J. Mol. Sci. 2021, 22, 7783. [Google Scholar] [CrossRef]
  20. Capone, F.; Guerriero, E.; Sorice, A.; Colonna, G.; Ciliberto, G.; Costantini, S. Serum Cytokinome Profile Evaluation: A Tool to Define New Diagnostic and Prognostic Markers of Cancer Using Multiplexed Bead-Based Immunoassays. Mediat. Inflamm. 2016, 2016, 3064643. [Google Scholar] [CrossRef]
  21. Zhang, Y.; Li, X.; Di, Y.P. Fast and efficient measurement of clinical and biological samples using immunoassay-based multiplexing systems. Methods Mol. Biol. 2020, 2102, 129–147. [Google Scholar] [CrossRef]
  22. Chen, H.; Zhang, X.; Liao, N.; Wen, F. Assessment of biomarkers using multiplex assays in aqueous humor of patients with diabetic retinopathy. BMC Ophthalmol. 2017, 17, 176. [Google Scholar] [CrossRef]
  23. Klimontov, V.V.; Korbut, A.I.; Orlov, N.B.; Dashkin, M.V.; Konenkov, V.I. Multiplex Bead Array Assay of a Panel of Circulating Cytokines and Growth Factors in Patients with Albuminuric and Non-AlbuminuricDiabetic Kidney Disease. J. Clin. Med. 2020, 9, 3006. [Google Scholar] [CrossRef]
  24. Lee, M.Y.; Park, S.; Song, J.Y.; Ra, H.; Baek, J.U.; Baek, J. Inflammatory cytokines and retinal nonperfusion area in quiescent proliferative diabetic retinopathy. Cytokine 2022, 154, 155774. [Google Scholar] [CrossRef]
  25. Danne, T.; Nimri, R.; Battelino, T.; Bergenstal, R.M.; Close, K.L.; DeVries, J.H.; Garg, S.; Heinemann, L.; Hirsch, I.; Amiel, S.A.; et al. International Consensus on Use of Continuous Glucose Monitoring. Diabetes Care 2017, 40, 1631–1640. [Google Scholar] [CrossRef]
  26. Hill, N.R.; Oliver, N.S.; Choudhary, P.; Levy, J.C.; Hindmarsh, P.; Matthews, D.R. Normal Reference Range for Mean Tissue Glucose and Glycemic Variability Derived from Continuous Glucose Monitoring for Subjects without Diabetes in Different Ethnic Groups. Diabetes Technol. Ther. 2011, 13, 921–928. [Google Scholar] [CrossRef]
  27. Kovatchev, B.; Cobelli, C. Glucose Variability: Timing, Risk Analysis, and Relationship to Hypoglycemia in Diabetes. Diabetes Care 2016, 39, 502–510. [Google Scholar] [CrossRef]
  28. Dogan, Y.; Akarsu, S.; Ustundag, B.; Yilmaz, E.; Gurgoze, M.K. Serum IL-1beta, IL-2, and IL-6 in Insulin-Dependent Diabetic Children. Mediat. Inflamm. 2006, 2006, 59206. [Google Scholar] [CrossRef]
  29. Gabbay, M.A.L.; Sato, M.N.; Duarte, A.J.S.; Dib, S.A. Serum Titres of Anti-Glutamic Acid Decarboxylase-65 and Anti-IA-2 Autoantibodies Are Associated with Different Immunoregulatory Milieu in Newly Diagnosed Type 1 Diabetes Patients. Clin. Exp. Immunol. 2012, 168, 60–67. [Google Scholar] [CrossRef]
  30. Fatima, N.; Faisal, S.M.; Zubair, S.; Ajmal, M.; Siddiqui, S.S.; Moin, S.; Owais, M. Role of Pro-Inflammatory Cytokines and Biochemical Markers in the Pathogenesis of Type 1 Diabetes: Correlation with Age and Glycemic Condition in Diabetic Human Subjects. PLoS ONE 2016, 11, e0161548. [Google Scholar] [CrossRef]
  31. Chen, Y.-L.; Qiao, Y.-C.; Pan, Y.-H.; Xu, Y.; Huang, Y.-C.; Wang, Y.-H.; Geng, L.-J.; Zhao, H.-L.; Zhang, X.-X. Correlation between Serum Interleukin-6 Level and Type 1 Diabetes Mellitus: A Systematic Review and Meta-Analysis. Cytokine 2017, 94, 14–20. [Google Scholar] [CrossRef]
  32. Tangjittipokin, W.; Umjai, P.; Khemaprasit, K.; Charoentawornpanich, P.; Chanprasert, C.; Teerawattanapong, N.; Narkdontri, T.; Santiprabhob, J. Vitamin D Pathway Gene Polymorphisms, Vitamin D Level, and Cytokines in Children with Type 1 Diabetes. Gene 2021, 791, 145691. [Google Scholar] [CrossRef] [PubMed]
  33. Li, J.; Xu, L.; Zhao, W.; Pan, J.; Lu, J.; Lu, H.; Yan, J.; Weng, J.; Liu, F. Serum IL-17A Concentration and a IL17RA Single Nucleotide Polymorphism Contribute to the Risk of Autoimmune Type 1 Diabetes. Diabetes Metab. Res. Rev. 2022, 38, e3547. [Google Scholar] [CrossRef] [PubMed]
  34. Alizadeh, B.Z.; Hanifi-Moghaddam, P.; Eerligh, P.; van der Slik, A.R.; Kolb, H.; Kharagjitsingh, A.V.; Pereira Arias, A.M.; Ronkainen, M.; Knip, M.; Bonfanti, R.; et al. Association of Interferon-Gamma and Interleukin 10 Genotypes and Serum Levels with Partial Clinical Remission in Type 1 Diabetes. Clin. Exp. Immunol. 2006, 145, 480–484. [Google Scholar] [CrossRef]
  35. Ismail, N.A.; Abd El Baky, A.N.; Ragab, S.; Hamed, M.; Hashish, M.A.; Shehata, A. Monocyte Chemoattractant Protein 1 and Macrophage Migration Inhibitory Factor in Children with Type 1 Diabetes. J. Pediatr. Endocrinol. Metab. 2016, 29, 641–645. [Google Scholar] [CrossRef]
  36. Qiao, Y.-C.; Chen, Y.-L.; Pan, Y.-H.; Tian, F.; Xu, Y.; Zhang, X.-X.; Zhao, H.-L. The Change of Serum Tumor Necrosis Factor Alpha in Patients with Type 1 Diabetes Mellitus: A Systematic Review and Meta-Analysis. PLoS ONE 2017, 12, e0176157. [Google Scholar] [CrossRef] [PubMed]
  37. Abdel-Latif, M.; Abdel-Moneim, A.A.; El-Hefnawy, M.H.; Khalil, R.G. Comparative and Correlative Assessments of Cytokine, Complement and Antibody Patterns in Paediatric Type 1 Diabetes. Clin. Exp. Immunol. 2017, 190, 110–121. [Google Scholar] [CrossRef]
  38. Jamali, Z.; Nazari, M.; Khoramdelazad, H.; Hakimizadeh, E.; Mahmoodi, M.; Karimabad, M.N.; Hassanshahi, G.; Rezaeian, M.; Balaei, P.; Darakhshan, S.; et al. Expression of CC Chemokines CCL2, CCL5, and CCL11 Is Associated with Duration of Disease and Complications in Type-1 Diabetes: A Study on Iranian Diabetic Patients. Clin. Lab. 2013, 59, 993–1001. [Google Scholar] [CrossRef]
  39. Purohit, S.; Sharma, A.; Hopkins, D.; Steed, L.; Bode, B.; Anderson, S.W.; Reed, J.C.; Steed, R.D.; Yang, T.; She, J.-X. Large-Scale Discovery and Validation Studies Demonstrate Significant Reductions in Circulating Levels of IL8, IL-1Ra, MCP-1, and MIP-1β in Patients With Type 1 Diabetes. J. Clin. Endocrinol. Metab. 2015, 100, E1179–E1187. [Google Scholar] [CrossRef]
  40. Pérez, F.; Oyarzún, A.; Carrasco, E.; Angel, B.; Albala, C.; Santos, J.L. Plasma levels of interleukin-1beta, interleukin-2 and interleukin-4 in recently diagnosed type 1 diabetic children and their association with beta-pancreatic autoantibodies. Rev. Med. Chil. 2004, 132, 413–420. [Google Scholar] [CrossRef]
  41. Antonelli, A.; Fallahi, P.; Ferrari, S.M.; Pupilli, C.; d’Annunzio, G.; Lorini, R.; Vanelli, M.; Ferrannini, E. Serum Th1 (CXCL10) and Th2 (CCL2) Chemokine Levels in Children with Newly Diagnosed Type 1 Diabetes: A Longitudinal Study. Diabet Med. 2008, 25, 1349–1353. [Google Scholar] [CrossRef] [PubMed]
  42. Hanifi-Moghaddam, P.; Schloot, N.C.; Kappler, S.; Seissler, J.; Kolb, H. An Association of Autoantibody Status and Serum Cytokine Levels in Type 1 Diabetes. Diabetes 2003, 52, 1137–1142. [Google Scholar] [CrossRef] [PubMed]
  43. Alnek, K.; Kisand, K.; Heilman, K.; Peet, A.; Varik, K.; Uibo, R. Increased Blood Levels of Growth Factors, Proinflammatory Cytokines, and Th17 Cytokines in Patients with Newly Diagnosed Type 1 Diabetes. PLoS ONE 2015, 10, e0142976. [Google Scholar] [CrossRef]
  44. Wu, H.-P.; Kuo, S.-F.; Wu, S.-Y.; Chuang, D.-Y. High Interleukin-12 Production from Stimulated Peripheral Blood Mononuclear Cells of Type 2 Diabetes Patients. Cytokine 2010, 51, 298–304. [Google Scholar] [CrossRef]
  45. Gonzalez, Y.; Herrera, M.T.; Soldevila, G.; Garcia-Garcia, L.; Fabián, G.; Pérez-Armendariz, E.M.; Bobadilla, K.; Guzmán-Beltrán, S.; Sada, E.; Torres, M. High Glucose Concentrations Induce TNF-α Production through the down-Regulation of CD33 in Primary Human Monocytes. BMC Immunol. 2012, 13, 19. [Google Scholar] [CrossRef] [PubMed]
  46. Hu, R.; Xia, C.-Q.; Butfiloski, E.; Clare-Salzler, M. Effect of High Glucose on Cytokine Production by Human Peripheral Blood Immune Cells and Type I Interferon Signaling in Monocytes: Implications for the Role of Hyperglycemia in the Diabetes Inflammatory Process and Host Defense against Infection. Clin. Immunol. 2018, 195, 139–148. [Google Scholar] [CrossRef] [PubMed]
  47. Li, Z.; Zhao, M.; Li, J.; Luo, W.; Huang, J.; Huang, G.; Xie, Z.; Xiao, Y.; Huang, J.; Li, X.; et al. Elevated Glucose Metabolism Driving Pro-Inflammatory Response in B Cells Contributes to the Progression of Type 1 Diabetes. Clin. Immunol. 2023, 255, 109729. [Google Scholar] [CrossRef]
  48. Wu, M.; Wu, Y.; Xu, K.; Lin, L. Protective Effects of 1,25 Dihydroxyvitamin D3 against High-Glucose-Induced Damage in Human Umbilical Vein Endothelial Cells Involve Activation of Nrf2 Antioxidant Signaling. J. Vasc. Res. 2021, 58, 267–276. [Google Scholar] [CrossRef]
  49. Zhang, M.; Jin, X.; Zhang, Z.; Li, B.; Yang, G. Vildagliptin Protects Endothelial Cells against High Glucose-Induced Damage. Biomed. Pharmacother. 2018, 108, 1790–1796. [Google Scholar] [CrossRef]
  50. Xu, L.; Shao, F. Sitagliptin Protects Renal Glomerular Endothelial Cells against High Glucose-Induced Dysfunction and Injury. Bioengineered 2022, 13, 655–666. [Google Scholar] [CrossRef]
  51. Cheng, G.; Li, L. High-Glucose-Induced Apoptosis, ROS Production and pro-Inflammatory Response in Cardiomyocytes Is Attenuated by Metformin Treatment via PP2A Activation. J. Biosci. 2020, 45, 126. [Google Scholar] [CrossRef]
  52. Maedler, K.; Sergeev, P.; Ris, F.; Oberholzer, J.; Joller-Jemelka, H.I.; Spinas, G.A.; Kaiser, N.; Halban, P.A.; Donath, M.Y. Glucose-Induced Beta Cell Production of IL-1beta Contributes to Glucotoxicity in Human Pancreatic Islets. J. Clin. Investig. 2002, 110, 851–860. [Google Scholar] [CrossRef] [PubMed]
  53. Li-Bo, Y.; Wen-Bo, Q.; Xiao-Hong, L.; You-Lun, F.; Tie, Z. Intermittent High Glucose Promotes Expression of Proinflammatory Cytokines in Monocytes. Inflamm. Res. 2011, 60, 367–370. [Google Scholar] [CrossRef] [PubMed]
  54. Piconi, L.; Quagliaro, L.; Assaloni, R.; Da Ros, R.; Maier, A.; Zuodar, G.; Ceriello, A. Constant and Intermittent High Glucose Enhances Endothelial Cell Apoptosis through Mitochondrial Superoxide Overproduction. Diabetes Metab. Res. Rev. 2006, 22, 198–203. [Google Scholar] [CrossRef] [PubMed]
  55. Quagliaro, L.; Piconi, L.; Assaloni, R.; Da Ros, R.; Maier, A.; Zuodar, G.; Ceriello, A. Intermittent High Glucose Enhances ICAM-1, VCAM-1 and E-Selectin Expression in Human Umbilical Vein Endothelial Cells in Culture: The Distinct Role of Protein Kinase C and Mitochondrial Superoxide Production. Atherosclerosis 2005, 183, 259–267. [Google Scholar] [CrossRef]
  56. Hu, Z.; Fang, W.; Liu, Y.; Liang, H.; Chen, W.; Wang, H. Acute Glucose Fluctuation Promotes RAGE Expression via Reactive Oxygen Species-mediated NF-κB Activation in Rat Podocytes. Mol. Med. Rep. 2021, 23, 330. [Google Scholar] [CrossRef] [PubMed]
  57. Sun, J.; Xu, Y.; Dai, Z.; Sun, Y. Intermittent High Glucose Stimulate MCP-l, IL-18, and PAI-1, but Inhibit Adiponectin Expression and Secretion in Adipocytes Dependent of ROS. Cell Biochem. Biophys. 2009, 55, 173–180. [Google Scholar] [CrossRef]
  58. Wu, N.; Shen, H.; Liu, H.; Wang, Y.; Bai, Y.; Han, P. Acute Blood Glucose Fluctuation Enhances Rat Aorta Endothelial Cell Apoptosis, Oxidative Stress and pro-Inflammatory Cytokine Expression in Vivo. Cardiovasc. Diabetol. 2016, 15, 109. [Google Scholar] [CrossRef]
  59. Al-Rashed, F.; Sindhu, S.; Arefanian, H.; Al Madhoun, A.; Kochumon, S.; Thomas, R.; Al-Kandari, S.; Alghaith, A.; Jacob, T.; Al-Mulla, F.; et al. Repetitive Intermittent Hyperglycemia Drives the M1 Polarization and Inflammatory Responses in THP-1 Macrophages Through the Mechanism Involving the TLR4-IRF5 Pathway. Cells 2020, 9, 1892. [Google Scholar] [CrossRef]
  60. Ratter, J.M.; Rooijackers, H.M.M.; Tack, C.J.; Hijmans, A.G.M.; Netea, M.G.; de Galan, B.E.; Stienstra, R. Proinflammatory Effects of Hypoglycemia in Humans With or Without Diabetes. Diabetes 2017, 66, 1052–1061. [Google Scholar] [CrossRef] [PubMed]
  61. Ceriello, A.; Novials, A.; Ortega, E.; Canivell, S.; La Sala, L.; Pujadas, G.; Esposito, K.; Giugliano, D.; Genovese, S. Glucagon-like Peptide 1 Reduces Endothelial Dysfunction, Inflammation, and Oxidative Stress Induced by Both Hyperglycemia and Hypoglycemia in Type 1 Diabetes. Diabetes Care 2013, 36, 2346–2350. [Google Scholar] [CrossRef] [PubMed]
  62. Ceriello, A.; Novials, A.; Ortega, E.; Canivell, S.; Pujadas, G.; La Sala, L.; Bucciarelli, L.; Rondinelli, M.; Genovese, S. Vitamin C Further Improves the Protective Effect of GLP-1 on the Ischemia-Reperfusion-like Effect Induced by Hyperglycemia Post-Hypoglycemia in Type 1 Diabetes. Cardiovasc. Diabetol. 2013, 12, 97. [Google Scholar] [CrossRef] [PubMed]
  63. Fleiner, H.F.; Radtke, M.; Ryan, L.; Moen, T.; Grill, V. Circulating Immune Mediators Are Closely Linked in Adult-Onset Type 1 Diabetes as Well as in Non-Diabetic Subjects. Autoimmunity 2014, 47, 530–537. [Google Scholar] [CrossRef] [PubMed]
  64. Wallace, A.S.; Chang, A.R.; Shin, J.-I.; Reider, J.; Echouffo-Tcheugui, J.B.; Grams, M.E.; Selvin, E. Obesity and Chronic Kidney Disease in US Adults With Type 1 and Type 2 Diabetes Mellitus. J. Clin. Endocrinol. Metab. 2022, 107, 1247–1256. [Google Scholar] [CrossRef] [PubMed]
  65. Belete, R.; Ataro, Z.; Abdu, A.; Sheleme, M. Global Prevalence of Metabolic Syndrome among Patients with Type I Diabetes Mellitus: A Systematic Review and Meta-Analysis. Diabetol. Metab. Syndr. 2021, 13, 25. [Google Scholar] [CrossRef]
Figure 1. Study design. CGM, continuous glucose monitoring; GV, glucose variability; HbA1c, glycated hemoglobin A1c; NGT, normal glucose tolerance; OGTT, oral glucose tolerance test; T1D, type 1 diabetes; TIRs, time in ranges.
Biomedicines 11 02843 g001
Figure 2. Serum concentrations of cytokines and growth factors in subjects with NGT and T1D. Data are presented as raw data (dots), medians (squares), and interquartile ranges (boxes). NGT subjects are marked in blue and patients with T1D are marked in pink. The concentrations are expressed in pg/mL. * p < 0.05, ** p < 0.01, *** p < 0.001 vs. subjects with NGT. NGT, normal glucose tolerance; T1D, type 1 diabetes.
Biomedicines 11 02843 g002aBiomedicines 11 02843 g002b
Table 1. Clinical characteristics of the study participants with T1D.
ParameterMedian (25; 75 Percentile)
Demographic and general clinical parameters
Age, years33 (24; 43)
Smokers, n (%)23 (18%)
BMI, kg/m223 (20; 26)
Waist-to-hip ratio0.81 (0.76; 0.91)
Diabetes-related parameters and associated diseases
Diabetes duration, years15 (10; 23)
Daily insulin dose, IU/kg0.7 (0.5; 0.9)
Diabetic retinopathy, n (%)79 (61%)
Chronic kidney disease, n (%)75 (58%)
Diabetic neuropathy, n (%)96 (74%)
Arterial hypertension, n (%)39 (30%)
Coronary artery disease, n (%)7 (5.3%)
Peripheral artery disease, n (%)18 (14%)
Laboratory parameters
HbA1c, %7.9 (6.8; 9.6)
HbA1c, mmol/L67 (51; 81)
Total cholesterol, mmol/L5.1 (4.2; 6.3)
LDL-cholesterol, mmol/L3.0 (2.4; 3.7)
HDL-cholesterol, mmol/L1.5 (1.3; 1.8)
Triglycerides, mmol/L1.0 (0.7; 1.3)
hsCRP, mmol/L1.3 (0.7; 2.8)
eGFR (CKD-EPI formula, 2009), mL/min/1.73 m294 (82; 105)
UACR, mg/mmol0.5 (0.3; 1.1)
Hemoglobin, g/L139 (125; 150)
RBC, ×10124.7 (4.4; 5.0)
WBC, ×1095.4 (4.8; 6.9)
Continuous data are presented as medians (lower quartile; upper quartile), and frequencies are presented as number of patients (percentage). BMI, body mass index; eGFR, estimated glomerular filtration rate; HbA1c, glycated hemoglobin A1c; HDL, high density lipoprotein; hsCRP, high sensitivity C-reactive protein; LDL, low-density lipoprotein; RBC, red blood cells; UACR, urinary albumin-to-creatinine ratio; WBC, white blood cells.
Table 2. CGM-derived TIRs and GV parameters in subjects with T1D.
ParameterMedian (25; 75 Percentile)
Mean glucose, mmol/L7.7 (6.6; 9.3)
TIR, %72 (57; 88)
TAR L-1, %17 (7.4; 25)
TAR L-2, %3.5 (0.3; 11)
TBR L-1, %1.5 (0; 2.1)
TBR L-2, %0.2 (0; 1.2)
CV, %33 (27; 38)
MAGE, mmol/L4.3 (3.1; 5.2)
MAG, mmol × h−1 × L−11.7 (2.1; 2.4)
Data are presented as median (lower quartile; upper quartile). TIR, time in range; TAR L-1, time above range, level 1; TAR L-2, time above range, level 2; TBR L-1, time below range, level 1; TBR L-2, time below range, level 2; CV, coefficient of variation; MAGE, mean amplitude of glycemic excursions; MAG, mean absolute glucose change.
Table 3. Serum concentrations (pg/mL) of cytokines and growth factors in T1D subjects depending on TIR.
MoleculeGroupp
TIR > 70%
(n = 69)
TIR ≤ 70%
(n = 61)
IL-1α0.93 (0; 6.42) **0 (0; 3.82) ***0.01
IL-1β3.07 (2.53; 3.90) ***3.79 (3.06; 4.31) ***0.0004
IL-1Ra296 (4.46; 461)405 (7.25; 478) **0.08
IL-27.94 (3.42; 9.55)6.12 (1.07; 9.56)0.09
IL-2Rα18 (3.24; 63) ***30 (4.96; 54) ***0.68
IL-30.53 (0.45; 0.65) ***0.56 (0.49; 0.70)***0.07
IL-43.82 (1.10; 5.88) ***1.53 (0.42; 3.95) ***0.01
IL-542 (5.14; 77)9.89 (4.14; 117)0.96
IL-64.32 (2.40; 5.86)5.54 (3.84; 7.03) ***0.007
IL-710 (3.91; 18) **11 (3.78; 18) ***0.78
IL-86.53 (2.28; 9.38)3.83 (1.52; 6.90) *0.07
IL-9182 (5.22; 251)6.64 (2.92; 235)0.07
IL-105.29 (3.83; 6.05)4.75 (2.90; 5.29) *0.001
IL-12 p403.62 (0; 9.66)0.28 (0; 9.42)0.25
IL-12 p704.10 (3.41; 5.41)6.56 (3.41; 14) **0.02
IL-169.12 (3.74; 36) *34 (6.08; 490) ***0.02
IL-17A10 (4.46; 15) *8.95 (6.09; 13) **0.94
IL-188.34 (3.29; 23)8.01 (4.02; 32)0.35
LIF8.58 (0; 49) ***26 (8.58; 59)0.02
G-CSF14 (2.46; 72) **38 (5.48; 74) *0.16
GM-CSF4.66 (0.83; 6.04)1.08 (0; 5.08) ***0.002
M-CSF9.29 (3.67; 18)12 (4.4; 21) ***0.25
GRO-α0 (0; 5.46)0 (0; 0.75)0.2
IFN-α20 (0; 1.62) *0 (0; 1.62)0.71
IFN-γ1.79 (1.09; 3.06) ***1.94 (1.07; 2.53) ***0.87
IP-10145 (4.57; 333)235 (6.09; 471)0.13
MCP-16.83 (3.11; 30) *24.39 (6.48; 41) ***0.01
MCP-30 (0; 5.70) **6.05 (0.91; 6.74) ***0.0006
MIF8.44 (0; 149)0.44 (0; 28) **0.005
MIG110 (6.23; 177)117 (5.95; 200)0.84
MIP-1α1.54 (1.18; 2.22)1.81 (1.50; 2.58)0.07
MIP-1β193 (4.51; 224)7.98 (4.07; 232)0.61
RANTES2437 (3.14; 11,840)9590 (6.99; 14,106)0.02
TNF-α4.25 (0; 12)6.77 (3.29; 79) ***0.002
TNF-β176 (4.30; 226)208 (6.72; 289) *0.04
TRAIL7.47 (5.35; 13)8.49 (3.79; 13)0.95
SCF19 (3.10; 78)69 (6.48; 99) *0.06
SCGF-β9.01 (4.57; 117,138)9.85 (3.87; 126,518)0.92
SDF-1α1276 (4.63; 1611)1339 (1132; 1543)0.26
bFGF20 (3.82; 28)8.33 (7.06; 108)0.75
PDGF-BB385 (5.66; 1307)730 (4.78; 1402)0.58
HGF159 (5.42; 326)291 (6.28; 407) *0.06
β-NGF0 (0; 1.24) *1.24 (0; 4.69)0.02
VEGF152 (6.11; 208)6.11 (2.87; 214)0.22
Data are presented as medians (lower quartile; upper quartile). * p < 0.05, ** p < 0.01, *** p < 0.001 vs. subjects with NGT. Significant differences between diabetic groups are highlighted in bold. NGT, normal glucose tolerance; T1D, type 1 diabetes; TIR, time in range.
Table 4. Serum concentrations (pg/mL) of cytokines and growth factors in T1D subjects depending on CV.
MoleculeGroupp
CV < 36%
(n = 72)
CV ≥ 36%
(n = 58)
IL-1α0.46 (0; 4.85) ***0.51 (0; 4.05) ***0.74
IL-1β3.60 (2.62; 4.10) ***3.48 (2.71; 4.10) ***0.94
IL-1Ra324 (5.81; 464)376 (5.81; 478) *0.69
IL-27.78 (2.35; 9.93)7.20 (1.07; 9.24)0.16
IL-2Rα21 (4.96; 59) ***25 (4.96; 54) ***0.99
IL-30.57 (0.46; 0.69) ***0.53 (0.49; 0.63) ***0.23
IL-44.89 (2.40; 6.26) ***5.17 (3.33; 6.69) ***0.33
IL-539 (5.03; 98)38 (4.63; 90)0.40
IL-63.08 (0.90; 4.86) **2.73 (0.17; 5.29) **0.76
IL-711 (4.03; 18) ***10 (3.78; 18) **0.63
IL-85.69 (2.43; 9.26)4.41 (1.52; 8.10)0.15
IL-97.85 (3.71; 244)11 (4.35; 258)0.55
IL-104.96 (3.83; 5.66)4.75 (2.90; 5.66)0.45
IL-12 p402.92 (0; 14)0.38 (0; 6.09) *0.33
IL-12 p704.33 (3.41; 13)4.45 (3.41; 13)0.73
IL-1631 (5.74; 45) **9.12 (4.87; 38) *0.26
IL-17A9.15 (4.85; 15) *9.36 (5.77; 15) **0.57
IL-188.85 (3.86; 24)7.37 (3.89; 25)0.98
LIF8.58 (0.43; 49) ***22 (4.92; 54) ***0.29
G-CSF38 (3.30; 87)22 (3.37; 60)0.53
GM-CSF2.85 (0.24; 5.40) ***2.94 (0; 6.28) *0.96
M-CSF9.78 (3.89; 18) **9.66 (3.89; 20) **0.77
GRO-α0 (0; 4.34)0 (0; 0.75)0.45
IFN-α20 (0; 1.62)0 (0; 3.35) *0.27
IFN-γ1.87 (1.08; 2.98) ***1.94 (1.07; 2.48) ***0.67
IP-10180 (5.62; 442)193 (6.09; 448)0.87
MCP-16.91 (3.18; 30) *24 (6.75; 43) ***0.007
MCP-35.34 (0; 6.63) ***4.74 (0; 6.28) ***0.72
MIF14 (0; 144)1.59 (0; 20) **0.04
MIG115 (6.23; 217)112 (6.11; 193)0.79
MIP-1α1.63 (1.35; 3.06)1.74 (1.41; 2.24)0.65
MIP-1β173 (3.95; 224)96 (4.99; 230)0.58
RANTES9.85 (4.07; 12,458)9868 (7.22; 13,970)0.03
TNF-α5.21 (0.67; 62)6.53 (2.77; 60) *0.61
TNF-β170 (4.77; 236)208 (6.96; 266) *0.18
TRAIL7.78 (5.12; 12)7.98 (3.79; 13)0.93
SCF14 (3.65; 88)69 (6.68; 99) *0.18
SCGF-β10,314 (4.04; 115,521)8.39 (4.65; 130,694)0.64
SDF-1α1298 (6.48; 1580)1314 (8.44; 1569)0.55
bFGF20 (5.26; 34)8.33 (5.64; 28)0.36
PDGF-BB190 (3.80; 1212)794 (5.38; 1544)0.11
HGF219 (5.33; 328)288 (6.72; 403) *0.19
β-NGF0.00 (0; 4.07) **0 (0; 3.18) **0.53
VEGF167 (3.39; 226)6.18 (3.31; 198)0.21
Data are presented as medians (lower quartile; upper quartile). * p < 0.05, ** p < 0.01, *** p < 0.001 vs. subjects with NGT. Significant differences between diabetic groups are highlighted in bold. CV, coefficient of variation; NGT, normal glucose tolerance; T1D, type 1 diabetes.
Table 5. Serum cytokines and growth factors associated with TIR ≤ 70% and CV ≥ 36% in subjects with T1D.
MoleculeCrude OR (95% CI), p-ValueAdjusted OR (95% CI), p-Value
TIR ≤ 70%
IL-1β, 1 pg/mL1.78 (1.18–2.67), p = 0.0061.69 (1.12–2.55), p = 0.01
IL-4, 1 pg/mL0.82 (0.71–0.95), p = 0.0070.82 (0.7–0.96), p = 0.01
IL-10, 1 pg/mL0.7 (0.56–0.89), p = 0.0030.73 (0.56–0.94), p = 0.01
IL-12 (p70), 1 pg/mL1.08 (1.02–1.15), p = 0.0061.08 (1.01–1.15), p = 0.02
MCP-3, 1 pg/mL1.16 (1.04–1.29), p = 0.0061.14 (1.02–1.28), p = 0.03
MIF, 100 pg/mL0.76 (0.6–0.97), p = 0.030.79 (0.62–1.01), p = 0.06
TNF-α, 10 pg/mL1.14 (1.03–1.27), p = 0.011.12 (1–1.25), p = 0.04
GM-CSF, 1 pg/mL0.82 (0.72–0.94), p = 0.0050.84 (0.73–0.97), p = 0.02
HGF, 100 pg/mL1.21 (1.02–1.44), p = 0.031.23 (1.02–1.47), p = 0.03
CV ≥ 36%
MIF, 100 pg/mL0.78 (0.62–0.99), p = 0.040.78 (0.61–0.99), p = 0.04
PDGF-BB, 1000 pg/mL1.56 (1.05–2.32), p = 0.031.58 (1.05–2.37), p = 0.03
Logistic regression models. Adjustment to age, sex, BMI, diabetes duration, and eGFR. CV, coefficient of variation; T1D, type 1 diabetes; TIR, time in range.
Disclaimer/Publisher’s Note: The statements, opinions and data contained in all publications are solely those of the individual author(s) and contributor(s) and not of MDPI and/or the editor(s). MDPI and/or the editor(s) disclaim responsibility for any injury to people or property resulting from any ideas, methods, instructions or products referred to in the content.

