
Production of Reactive Oxygen Species by Epicardial Adipocytes Is Associated with an Increase in Postprandial Glycemia, Postprandial Insulin, and a Decrease in Serum Adiponectin in Patients with Severe Coronary Atherosclerosis

 ,
,  and
and
Abstract
1. Introduction
2. Methods
2.1. Study Population
2.2. Biochemical Study
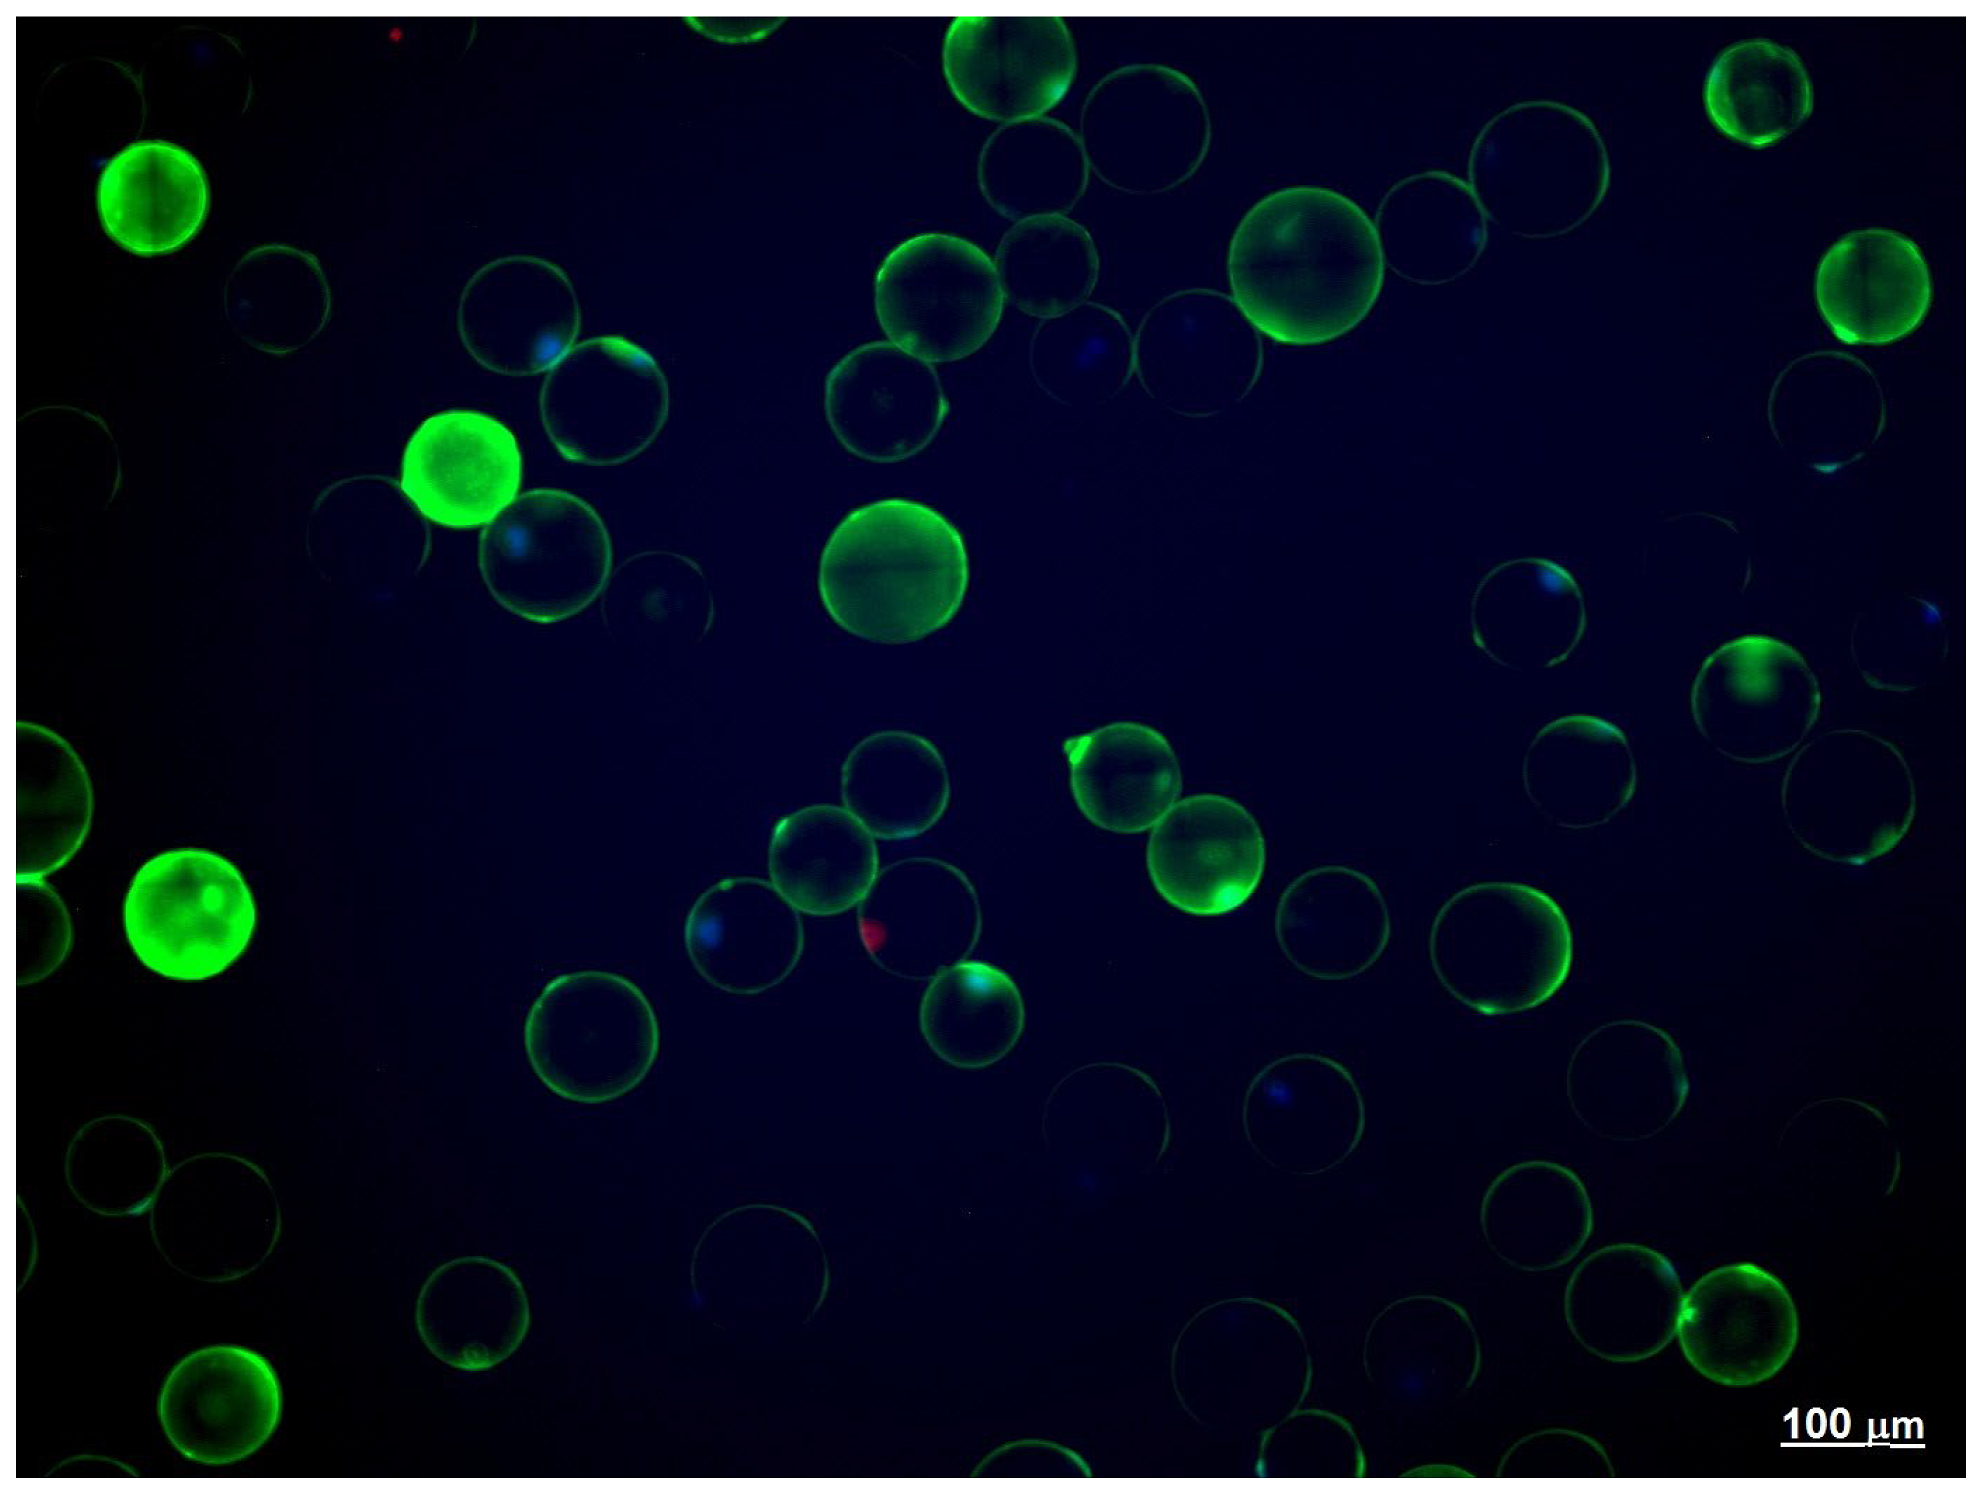
2.3. Adipose Tissue Explants
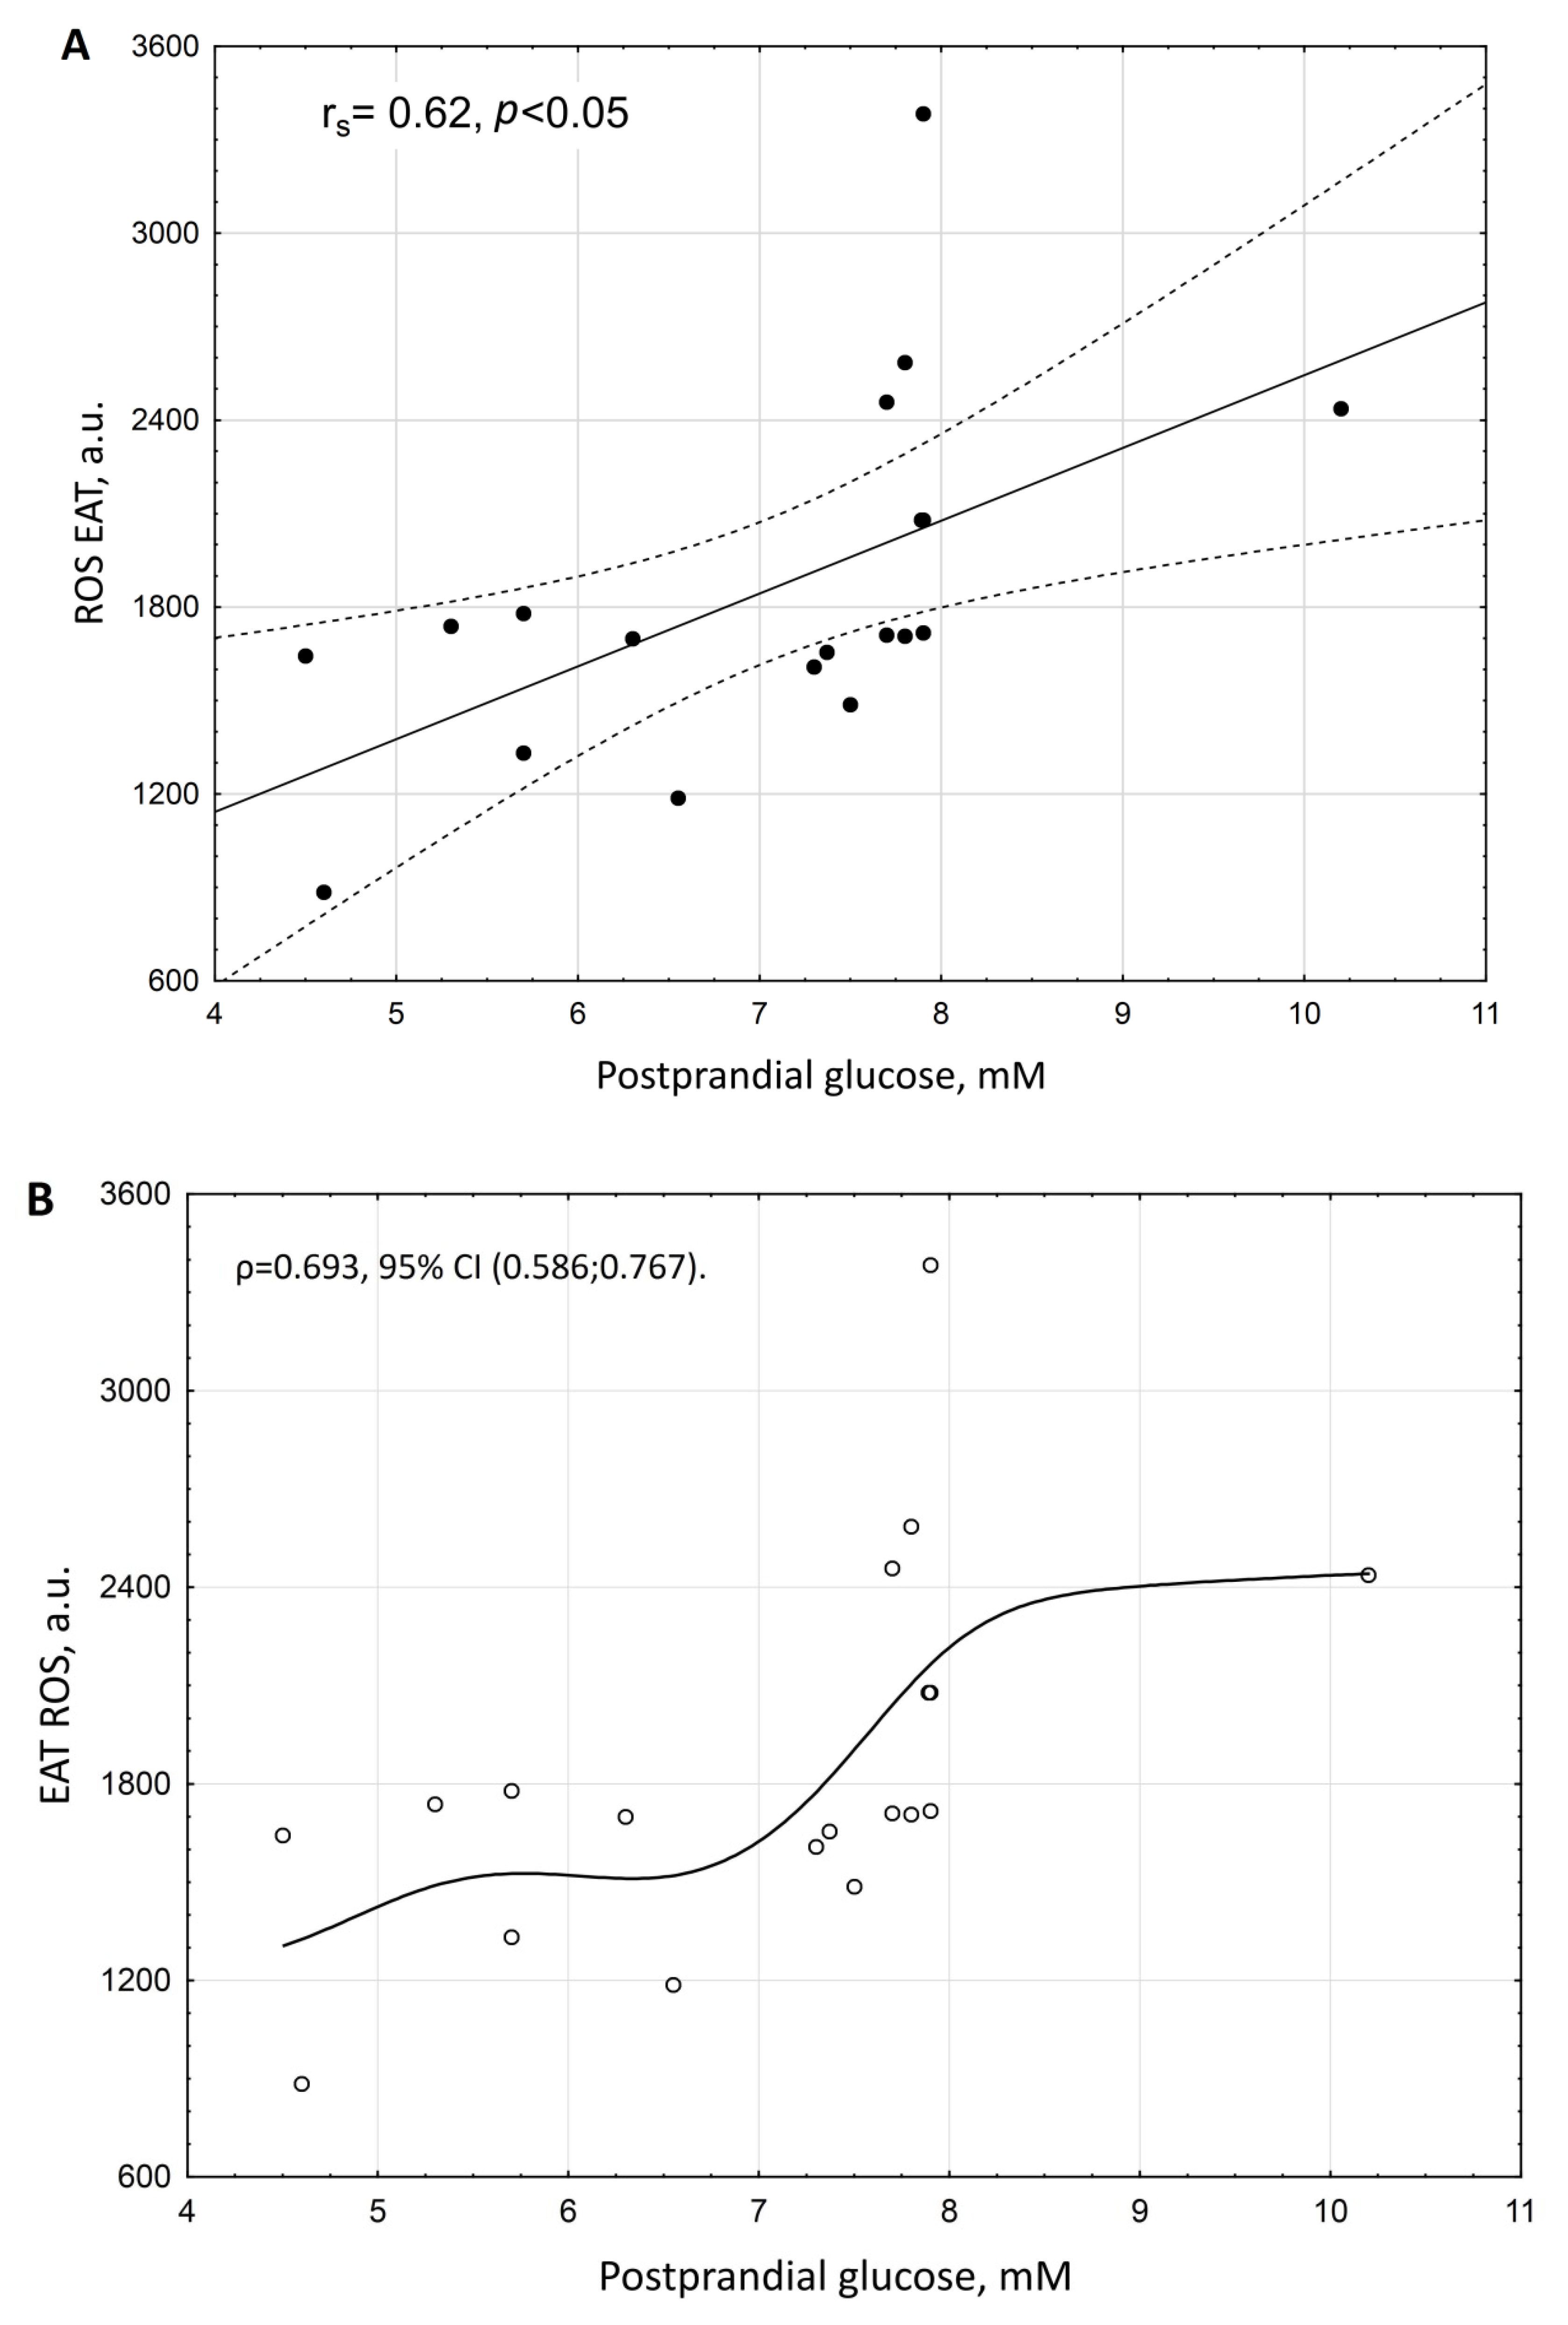
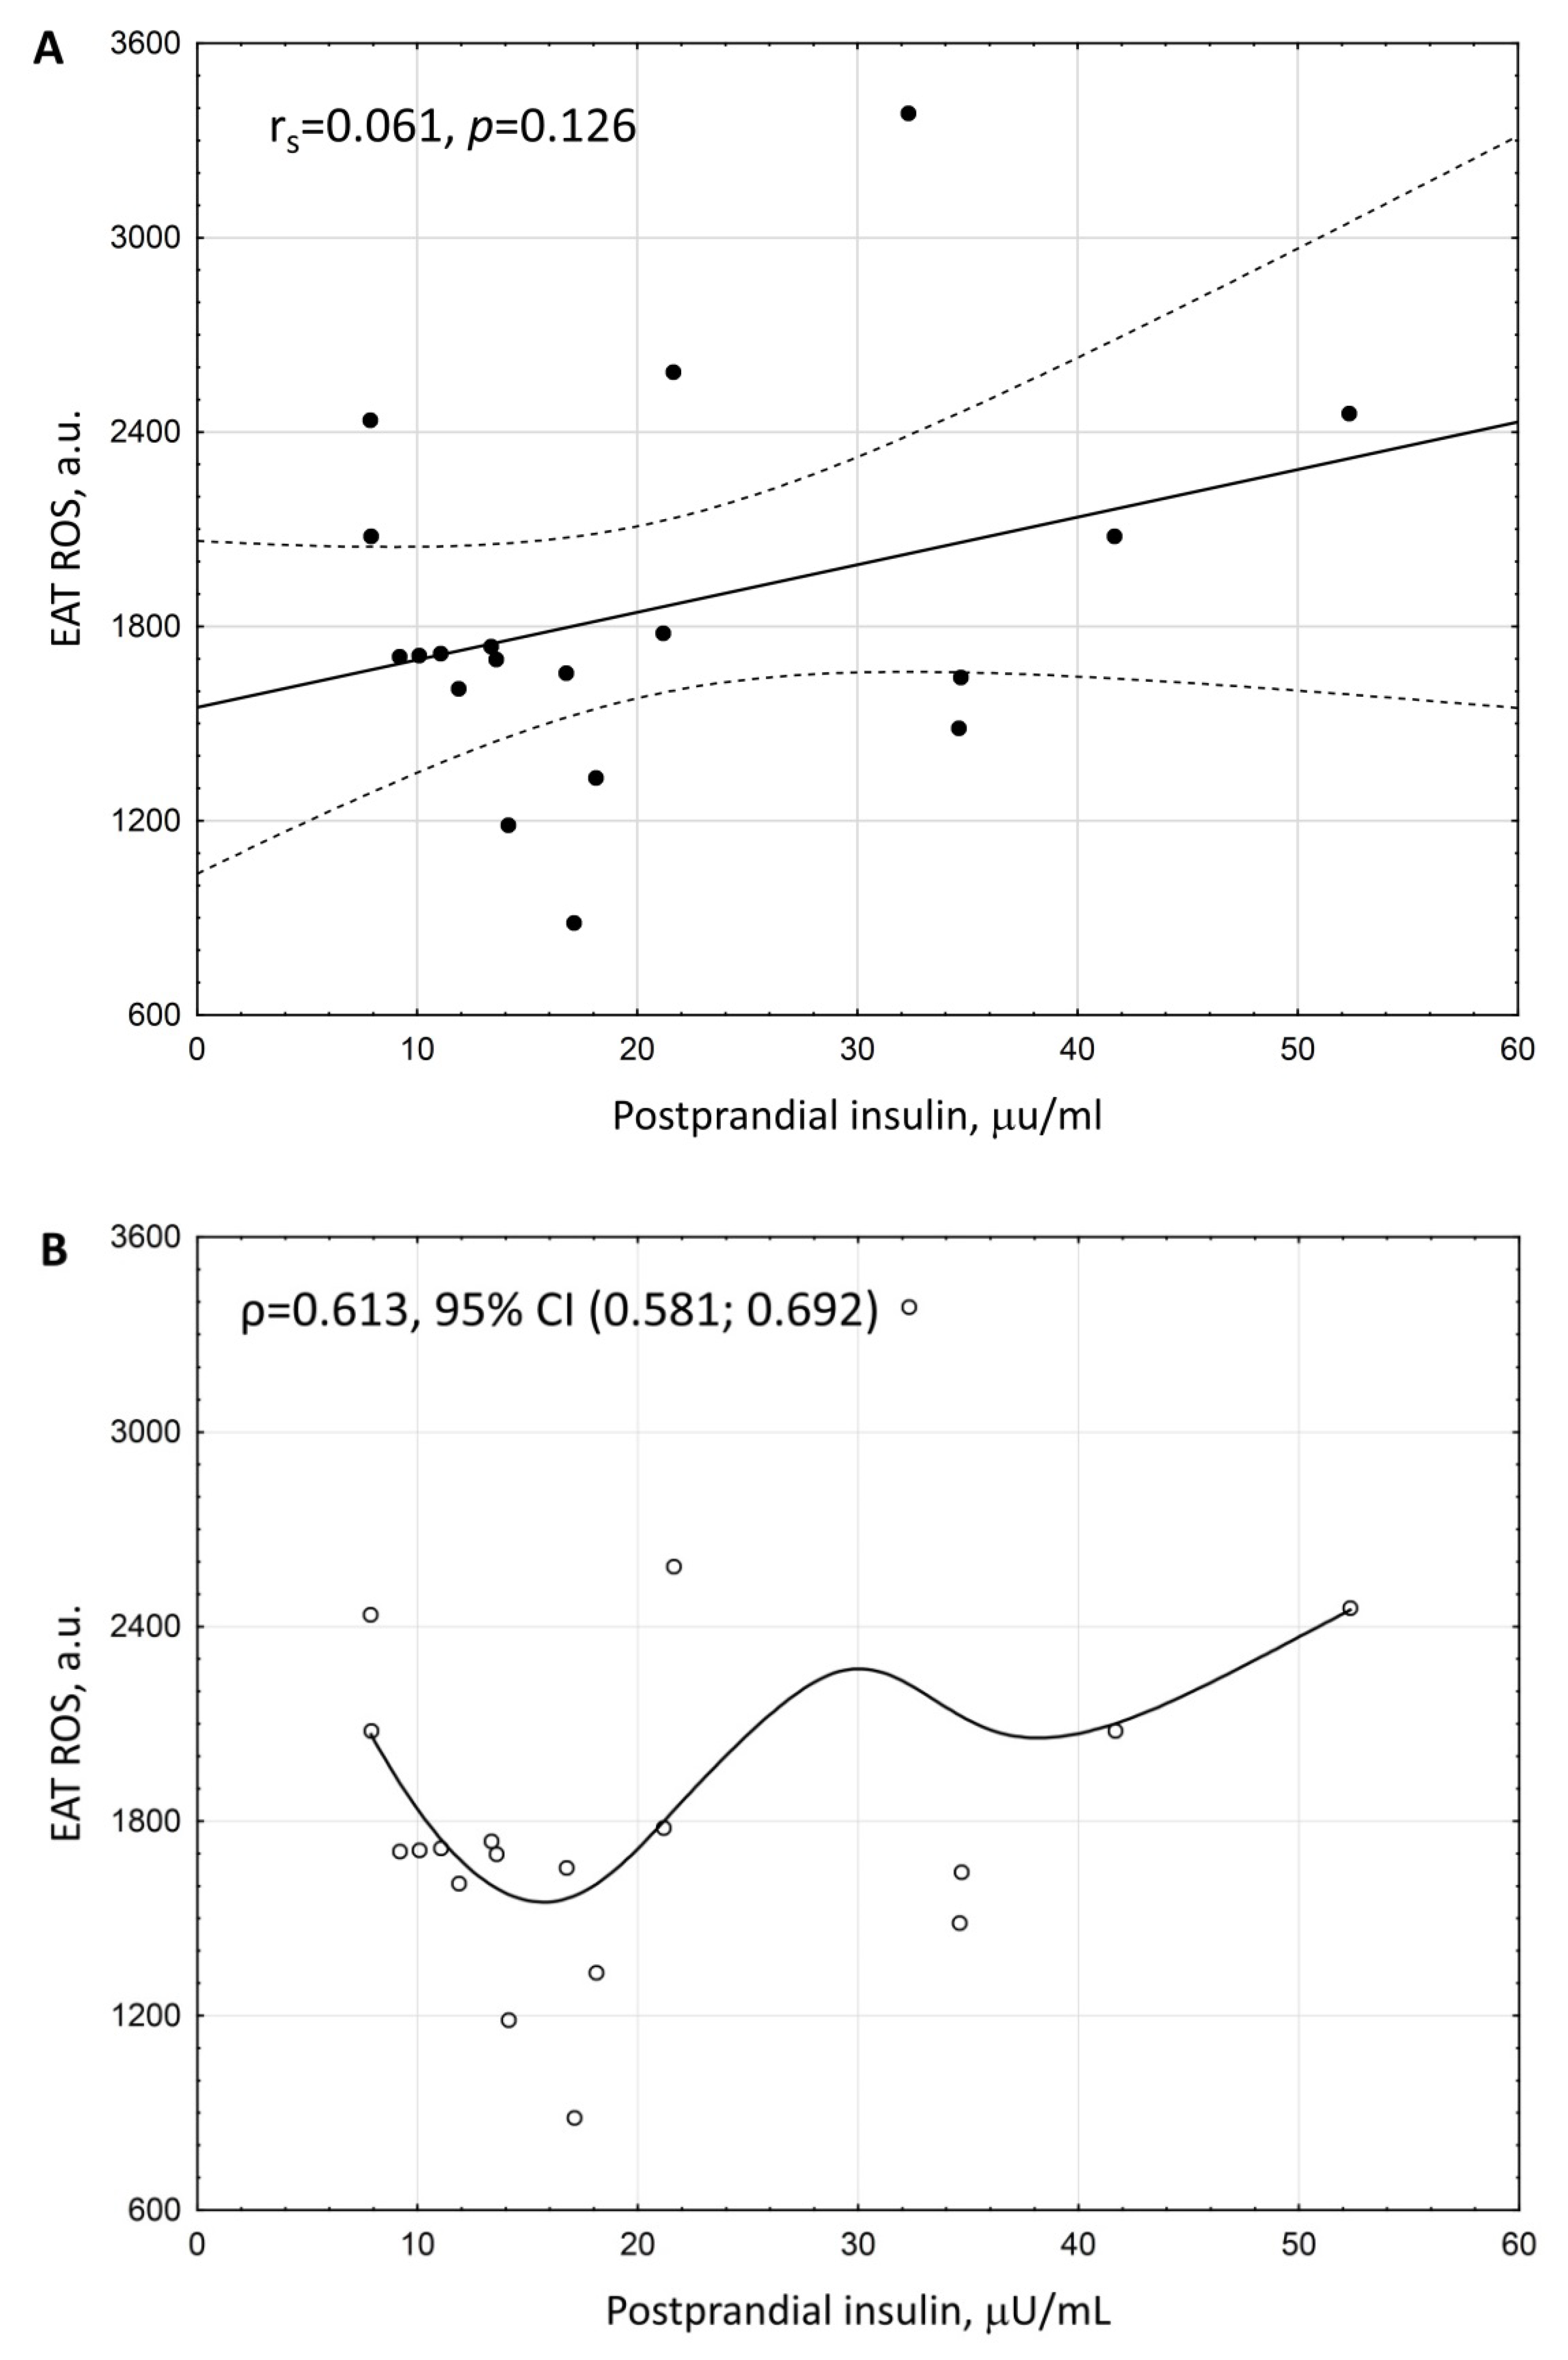
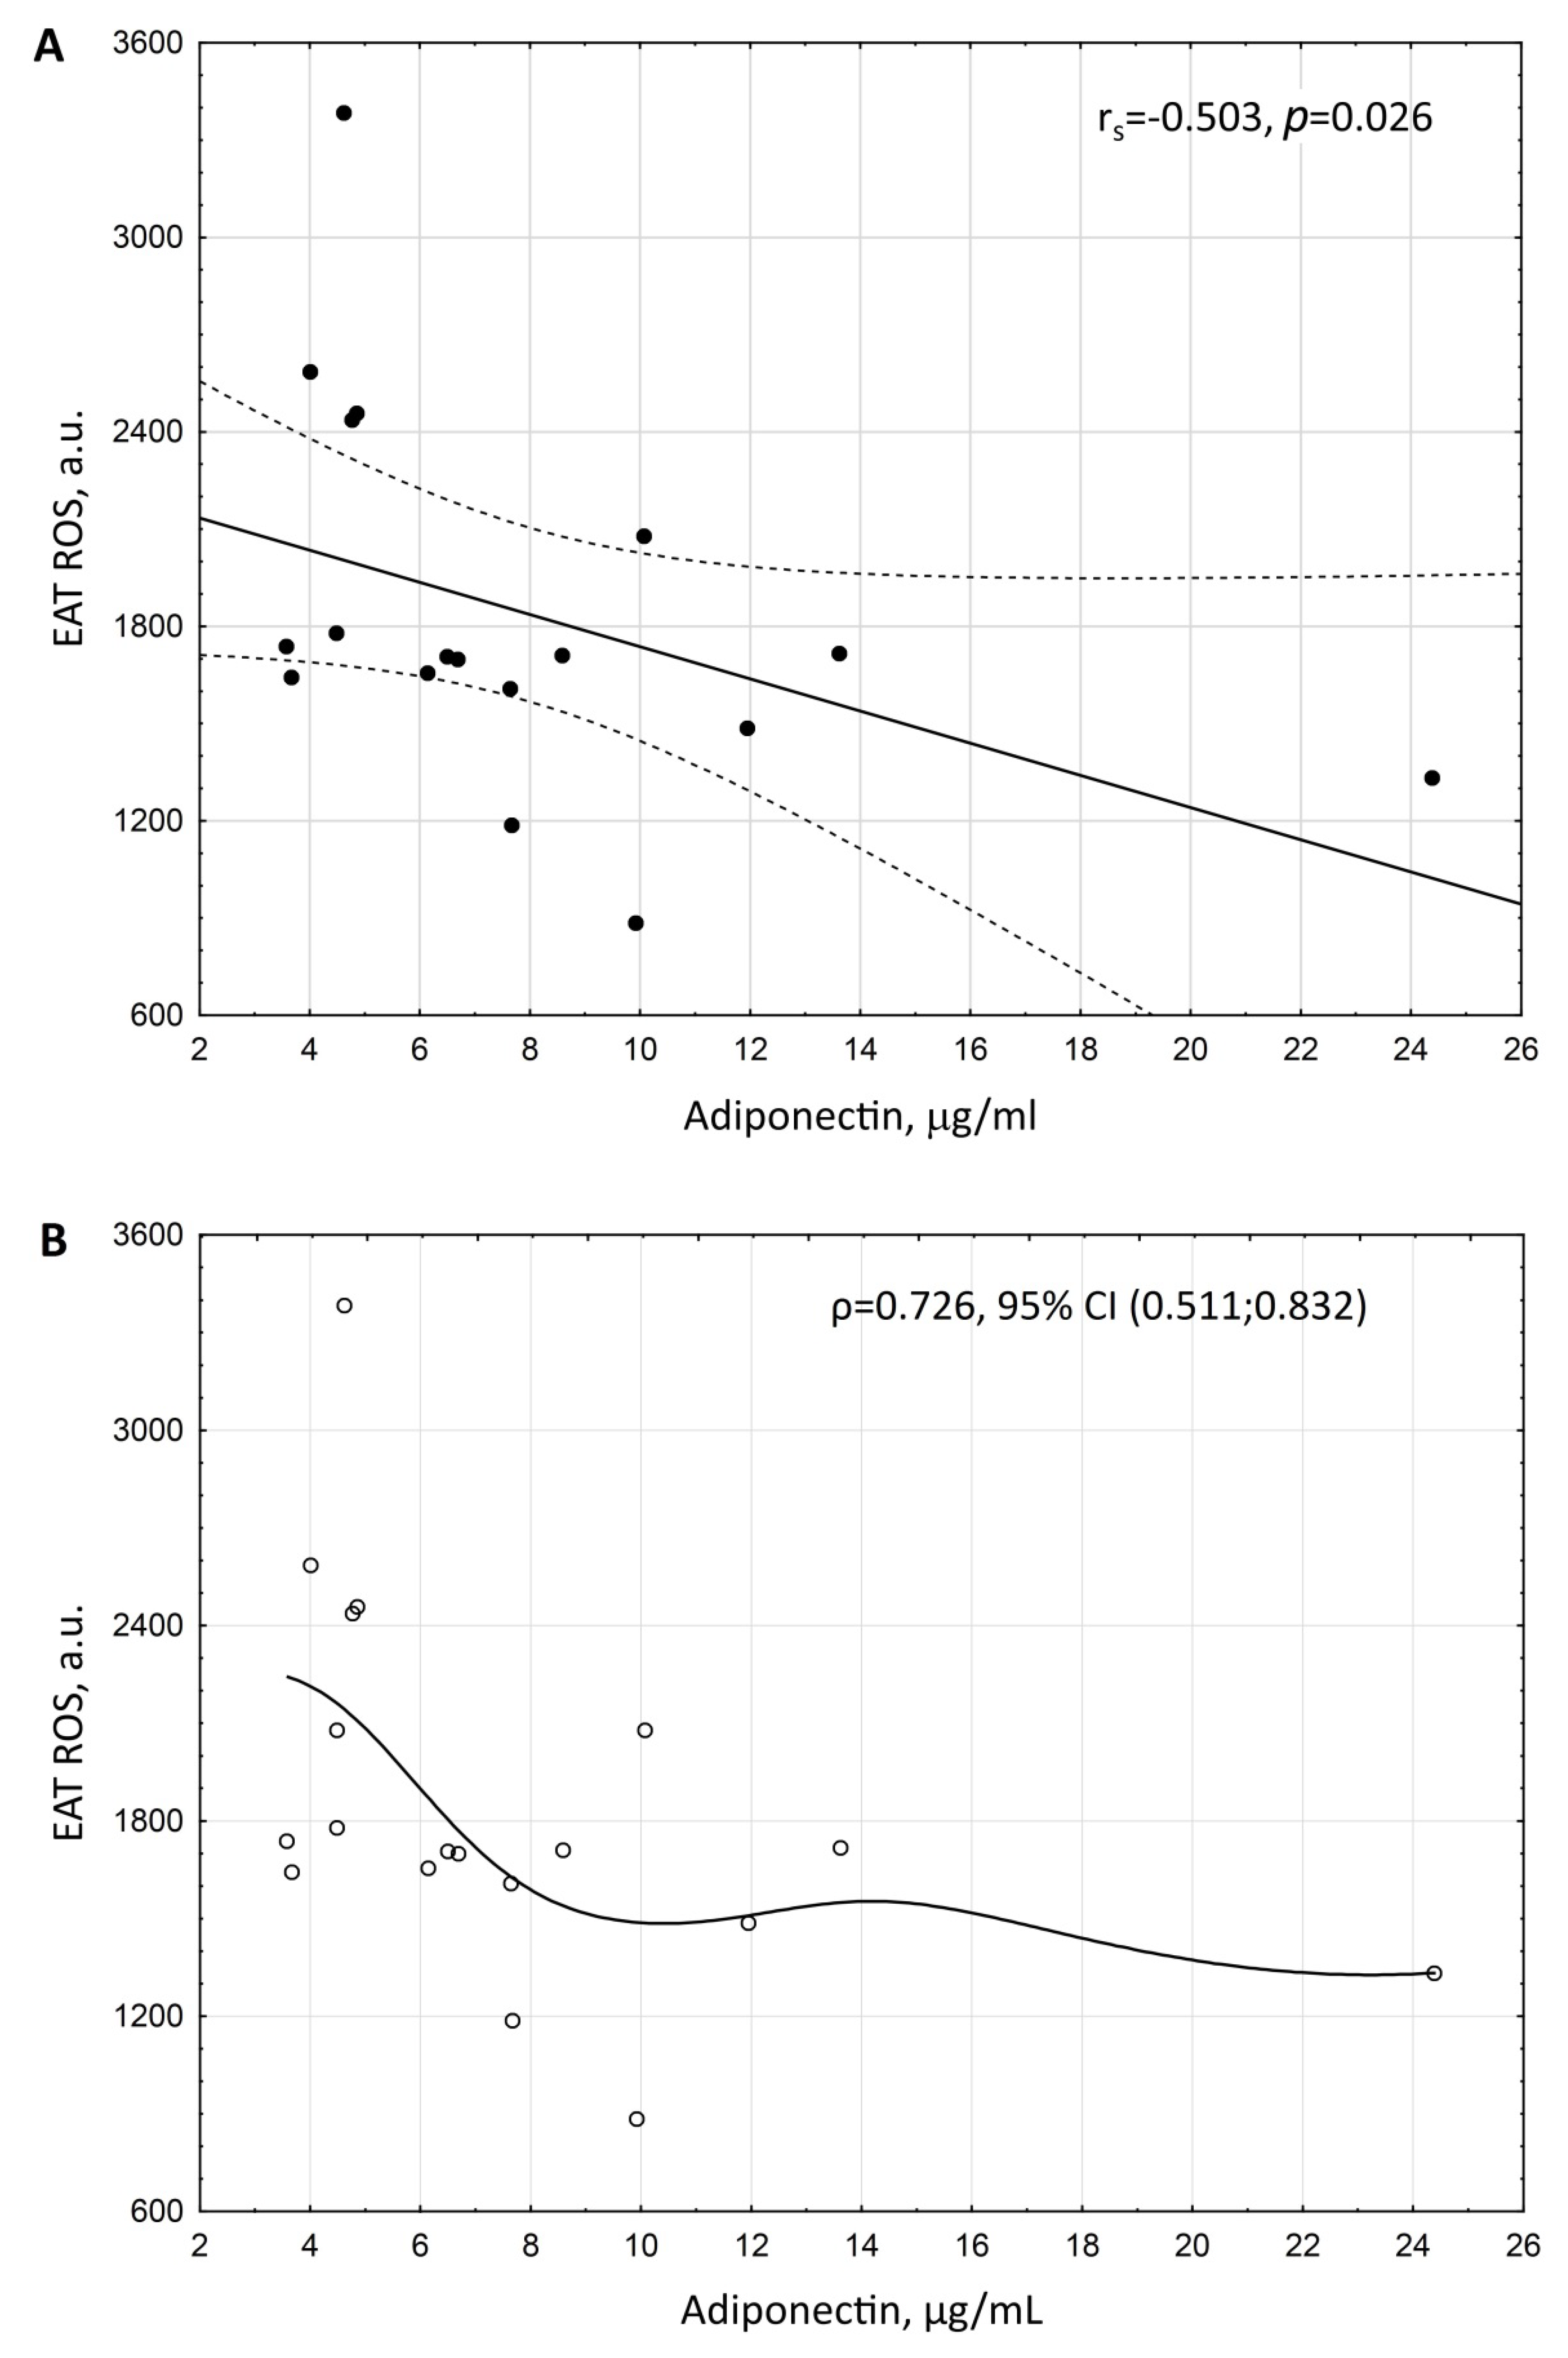
3. Results
4. Discussion
5. Conclusions
6. Limitations
Abbreviation
Supplementary Materials
Author Contributions
Funding
Institutional Review Board Statement
Informed Consent Statement
Data Availability Statement
Acknowledgments
Conflicts of Interest
References
- Krylatov, A.V.; Maslov, L.N.; Voronkov, N.S.; Boshchenko, A.A.; Popov, S.V.; Gomez, L.; Wang, H.; Jaggi, A.S.; Downey, J.M. Reactive Oxygen Species as Intracellular Signaling Molecules in the Cardiovascular System. Curr. Cardiol. Rev. 2018, 14, 290–300. [Google Scholar] [CrossRef] [PubMed]
- Barbato, D.L.; Aquilano, K.; Baldelli, S.; Cannata, S.M.; Bernardini, S.; Rotilio, G.; Ciriolo, M.R. Proline oxidase–adipose triglyceride lipase pathway restrains adipose cell death and tissue inflammation. Cell Death Differ. 2014, 21, 113–123. [Google Scholar] [CrossRef] [PubMed]
- Manuel, A.M.; Walla, M.D.; Dorn, M.T.; Tanis, R.M.; Piroli, G.G.; Frizzell, N. Fumarate and oxidative stress synergize to promote stability of C/EBP homologous protein in the adipocyte. Free. Radic. Biol. Med. 2020, 148, 70–82. [Google Scholar] [CrossRef] [PubMed]
- Sies, H. Hydrogen peroxide as a central redox signaling molecule in physiological oxidative stress: Oxidative eustress. Redox Biol. 2017, 11, 613–619. [Google Scholar] [CrossRef]
- Lee, H.; Lee, Y.J.; Choi, H.; Ko, E.H.; Kim, J.-W. Reactive Oxygen Species Facilitate Adipocyte Differentiation by Accelerating Mitotic Clonal Expansion. J. Biol. Chem. 2009, 284, 10601–10609. [Google Scholar] [CrossRef]
- Kono, T.; Robinson, F.W.; Blevins, T.L.; Ezaki, O. Evidence that translocation of the glucose transport activity is the major mechanism of insulin action on glucose transport in fat cells. J. Biol. Chem. 1982, 257, 10942–10947. [Google Scholar] [CrossRef]
- May, J.; de Haën, C. Insulin-stimulated intracellular hydrogen peroxide production in rat epididymal fat cells. J. Biol. Chem. 1979, 254, 2214–2220. [Google Scholar] [CrossRef]
- Little, S.A.; de Haën, C. Effects of hydrogen peroxide on basal and hormone-stimulated lipolysis in perifused rat fat cells in relation to the mechanism of action of insulin. J. Biol. Chem. 1980, 255, 10888–10895. [Google Scholar] [CrossRef]
- Loh, K.; Deng, H.; Fukushima, A.; Cai, X.; Boivin, B.; Galic, S.; Bruce, C.; Shields, B.J.; Skiba, B.; Ooms, L.M.; et al. Reactive Oxygen Species Enhance Insulin Sensitivity. Cell Metab. 2009, 10, 260–272. [Google Scholar] [CrossRef]
- Gutiérrez-Cuevas, J.; Sandoval-Rodriguez, A.; Meza-Rios, A.; Monroy-Ramírez, H.C.; Galicia-Moreno, M.; García-Bañuelos, J.; Santos, A.; Armendariz-Borunda, J. Molecular Mechanisms of Obesity-Linked Cardiac Dysfunction: An Up-Date on Current Knowledge. Cells 2021, 10, 629. [Google Scholar] [CrossRef]
- Furukawa, S.; Fujita, T.; Shimabukuro, M.; Iwaki, M.; Yamada, Y.; Nakajima, Y.; Nakayama, O.; Makishima, M.; Matsuda, M.; Shimomura, I. Increased oxidative stress in obesity and its impact on metabolic syndrome. J. Clin. Investig. 2004, 114, 1752–1761. [Google Scholar] [CrossRef]
- Berezin, A.E.; Berezin, A.A.; Lichtenauer, M. Emerging Role of Adipocyte Dysfunction in Inducing Heart Failure Among Obese Patients with Prediabetes and Known Diabetes Mellitus. Front. Cardiovasc. Med. 2020, 7, 583175. [Google Scholar] [CrossRef]
- Frohnert, B.; Bernlohr, D.A. Protein Carbonylation, Mitochondrial Dysfunction, and Insulin Resistance. Adv. Nutr. Int. Rev. J. 2013, 4, 157–163. [Google Scholar] [CrossRef]
- Castro, J.P.; Grune, T.; Speckmann, B. The two faces of reactive oxygen species (ROS) in adipocyte function and dysfunction. Biol. Chem. 2016, 397, 709–724. [Google Scholar] [CrossRef]
- Ballal, K.; Wilson, C.R.; Harmancey, R.; Taegtmeyer, H. Obesogenic high fat western diet induces oxidative stress and apoptosis in rat heart. Mol. Cell. Biochem. 2010, 344, 221–230. [Google Scholar] [CrossRef]
- Wonisch, W.; Falk, A.; Sundl, I.; Winklhofer-Roob, B.M.; Lindschinger, M. Oxidative stress increases continuously with BMI and age with unfavourable profiles in males. Aging Male 2011, 15, 159–165. [Google Scholar] [CrossRef]
- Hatami, M.; Saidijam, M.; Yadegarzari, R.; Borzuei, S.; Soltanian, A.; Arian, M.S.; Goodarzi, M.T. Peroxisome Proliferator-Activated Receptor-γGene Expression and Its Association with Oxidative Stress in Patients with Metabolic Syndrome. Chonnam. Med. J. 2016, 52, 201–206. [Google Scholar] [CrossRef][Green Version]
- Prokudina, E.S.; Maslov, L.N.; Ivanov, V.V.; Bespalova, I.D.; Pismennyi, D.S.; Voronkov, N.S. The Role of Reactive Oxygen Species in the Pathogenesis of Adipocyte Dysfunction in Metabolic Syndrome. Prospects of Pharmacological Correction. Ann. Russ. Acad. Med Sci. 2017, 72, 11–16. [Google Scholar] [CrossRef]
- Maslov, L.N.; Naryzhnaya, N.V.; Boshchenko, A.A.; Popov, S.V.; Ivanov, V.V.; Oeltgen, P.R. Is oxidative stress of adipocytes a cause or a consequence of the metabolic syndrome? J. Clin. Transl. Endocrinol. 2019, 15, 1–5. [Google Scholar] [CrossRef]
- Dozio, E.; Vianello, E.; Briganti, S.; Fink, B.; Malavazos, A.E.; Scognamiglio, E.T.; Dogliotti, G.; Sigrüener, A.; Schmitz, G.; Romanelli, M.M.C. Increased reactive oxygen species production in epicardial adipose tissues from coronary artery disease patients is associated with brown-to-white adipocyte trans-differentiation. Int. J. Cardiol. 2014, 174, 413–414. [Google Scholar] [CrossRef] [PubMed]
- Chattopadhyay, M.; Khemka, V.K.; Chatterjee, G.; Ganguly, A.; Mukhopadhyay, S.; Chakrabarti, S. Enhanced ROS production and oxidative damage in subcutaneous white adipose tissue mitochondria in obese and type 2 diabetes subjects. Mol. Cell. Biochem. 2014, 399, 95–103. [Google Scholar] [CrossRef] [PubMed]
- Styskal, J.; Van Remmen, H.; Richardson, A.; Salmon, A.B. Oxidative stress and diabetes: What can we learn about insulin resistance from antioxidant mutant mouse models? Free. Radic. Biol. Med. 2012, 52, 46–58. [Google Scholar] [CrossRef] [PubMed]
- Hartigh, L.J.D.; Omer, M.; Goodspeed, L.; Wang, S.; Wietecha, T.; O’Brien, K.D.; Han, C.Y. Adipocyte-Specific Deficiency of NADPH Oxidase 4 Delays the Onset of Insulin Resistance and Attenuates Adipose Tissue Inflammation in Obesity. Arter. Thromb. Vasc. Biol. 2017, 37, 466–475. [Google Scholar] [CrossRef] [PubMed]
- Santos, I.B.; de Bem, G.F.; da Costa, C.A.; de Carvalho, L.C.R.M.; de Medeiros, A.F.; Silva, D.L.B.; Romão, M.H.; Soares, R.D.A.; Ognibene, D.T.; de Moura, R.S.; et al. Açaí seed extract prevents the renin-angiotensin system activation, oxidative stress and inflammation in white adipose tissue of high-fat diet–fed mice. Nutr. Res. 2020, 79, 35–49. [Google Scholar] [CrossRef]
- Illesca, P.G.; Álvarez, S.M.; Selenscig, D.A.; Ferreira, M.D.R.; Giménez, M.S.; Lombardo, Y.B.; D’Alessandro, M.E. Dietary soy protein improves adipose tissue dysfunction by modulating parameters related with oxidative stress in dyslipidemic insulin-resistant rats. Biomed. Pharmacother. 2017, 88, 1008–1015. [Google Scholar] [CrossRef]
- Volpe, C.M.O.; Villar-Delfino, P.H.; dos Anjos, P.M.F. Cellular death, reactive oxygen species (ROS) and diabetic complications. Cell Death Disease. 2018, 9, 119. [Google Scholar] [CrossRef]
- Han, C.Y. Roles of Reactive Oxygen Species on Insulin Resistance in Adipose Tissue. Diabetes Metab. J. 2016, 40, 272–279. [Google Scholar] [CrossRef]
- Koshelskaya, O.A.; Naryzhnaya, N.V.; Kologrivova, I.V.; Suslova, T.E.; Kharitonova, O.A.; Evtushenko, V.V.; Andreev, S.L.; Gorbunov, A.S.; Gudkova, A.A. The level of reactive oxygen species production by adipocytes of epicardial adipose tissue is associated with an increase in postprandial glycemia in patients with severe coronary atherosclerosis. Sib. J. Clin. Exp. Med. 2021, 36, 59–67. [Google Scholar] [CrossRef]
- Sacks, H.S.; Fain, J.N.; Cheema, P.; Bahouth, S.W.; Garrett, E.; Wolf, R.Y.; Wolford, D.; Samaha, J. Depot-Specific Overexpression of Proinflammatory, Redox, Endothelial Cell, and Angiogenic Genes in Epicardial Fat Adjacent to Severe Stable Coronary Atherosclerosis. Metab. Syndr. Relat. Disord. 2011, 9, 433–439. [Google Scholar] [CrossRef]
- Salgado-Somoza, A.; Teijeira-Fernández, E.; Fernández, L.; González-Juanatey, J.R.; Eiras, S. Proteomic analysis of epicardial and subcutaneous adipose tissue reveals differences in proteins involved in oxidative stress. Am. J. Physiol. Circ. Physiol. 2010, 299, H202–H209. [Google Scholar] [CrossRef]
- Jacobellis, G.; Assael, F.; Ribaudo, M.C.; Zappaterreno, A.; Alessi, G.; Di Mario, U.; Leonetti, F. Epicardial Fat from Echocardiography: A New Method for Visceral Adipose Tissue Prediction. Obes. Res. 2003, 11, 304–310. [Google Scholar] [CrossRef]
- Gensini, G.G. A more meaningful scoring system for determining the severity of coronary heart disease. Am. J. Cardiol. 1983, 51, 606. [Google Scholar] [CrossRef]
- World Health Organization. Definition and Diagnosis of Diabetes Mellitus and Intermediate Hyperglycaemia: REPORT of a WHO/IDF Consultation; WHO Document Production Services: Geneva, Switzerland, 2006; Available online: http://apps.who.int/iris/bitstream/10665/43588/1/9241594934_eng.pdf (accessed on 26 July 2022).
- Naryzhnaya, N.V.; Koshelskaya, O.A.; Kologrivova, I.V.; Kharitonova, O.A.; Evtushenko, V.V.; Boshchenko, A.A. Hypertrophy and Insulin Resistance of Epicardial Adipose Tissue Adipocytes: Association with the Coronary Artery Disease Severity. Biomedicines 2021, 9, 64. [Google Scholar] [CrossRef]
- Suga, H.; Matsumoto, D.; Inoue, K.; Shigeura, T.; Eto, H.; Aoi, N.; Kato, H.; Abe, H.; Yoshimura, K. Numerical Measurement of Viable and Nonviable Adipocytes and Other Cellular Components in Aspirated Fat Tissue. Plast. Reconstr. Surg. 2008, 122, 103–114. [Google Scholar] [CrossRef]
- Monickaraj, F.; Aravind, S.; Nandhini, P.; Prabu, P.; Sathishkumar, C.; Mohan, V.; Balasubramanyam, M. Accelerated fat cell aging links oxidative stress and insulin resistance in adipocytes. J. Biosci. 2013, 38, 113–122. [Google Scholar] [CrossRef]
- Houstis, N.; Rosen, E.D.; Lander, E.S. Reactive oxygen species have a causal role in multiple forms of insulin resistance. Nature 2006, 440, 944–948. [Google Scholar] [CrossRef]
- Calder, P.C.; Ahluwalia, N.; Brouns, F.; Buetler, T.; Clement, K.; Cunningham, K.; Esposito, K.; Jönsson, L.S.; Kolb, H.; Lansink, M.; et al. Dietary factors and low-grade inflammation in relation to overweight and obesity. Br. J. Nutr. 2011, 106, S5–S78. [Google Scholar] [CrossRef]
- Emilio, G.-J.; Jacqueline, S.-R.; Laura, S.; Maríe, C.V.; Perona, J.S. Predictive value of ceruloplasmin for metabolic syndrome in adolescents. BioFactors 2016, 42, 163–170. [Google Scholar] [CrossRef]
- Christiana, U.I.; Casimir, A.E.; Nicholas, A.A.; Christian, M.C.; Obiefuna, A.I. Plasma levels of inflammatory cytokines in adult Nigerians with the metabolic syndrome. Niger. Med. J. 2016, 57, 64–68. [Google Scholar] [CrossRef]
- Mirhafez, S.R.; Pasdar, A.; Avan, A.; Esmaily, H.; Moezzi, A.; Mohebati, M.; Meshkat, Z.; Mehrad-Majd, H.; Eslami, S.; Rahimi, H.R.; et al. Cytokine and growth factor profiling in patients with the metabolic syndrome. Br. J. Nutr. 2015, 113, 1911–1919. [Google Scholar] [CrossRef]
- Ouchi, N.; Kihara, S.; Arita, Y.; Okamoto, Y.; Maeda, K.; Kuriyama, H.; Hotta, K.; Nishida, M.; Takahashi, M.; Muraguchi, M.; et al. Adiponectin, an Adipocyte-Derived Plasma Protein, Inhibits Endothelial NF-κB Signaling Through a cAMP-Dependent Pathway. Circulation 2000, 102, 1296–1301. [Google Scholar] [CrossRef] [PubMed]
- Chistiakov, D.A.; Grechko, A.; Myasoedova, V.; Melnichenko, A.A.; Orekhov, A.N. Impact of the cardiovascular system-associated adipose tissue on atherosclerotic pathology. Atherosclerosis 2017, 263, 361–368. [Google Scholar] [CrossRef] [PubMed]
- Lisowska, A.; Tycinska, A.; Knapp, M.; Sawicki, R.; Lisowski, P.; Musiał, W.; Dobrzycki, S. Adiponectin—An independent marker of coronary artery disease occurrence rather than a degree of its advancement in comparison to the IMT values in peripheral arteries. Clin. Chim. Acta. 2012, 413, 749–752. [Google Scholar] [CrossRef] [PubMed]
- Wang, F.; Liu, Y.; Yang, W.; Yuan, J.; Mo, Z. Adiponectin inhibits NLRP3 inflammasome by modulating the AMPK-ROS pathway. Int. J. Clin. Exp. Pathol. 2018, 11, 3338–3347. [Google Scholar] [PubMed]
- Sena, C.M.; Pereira, A.; Fernandes, R.; Letra, L.; Seiça, R.M. Adiponectin improves endothelial function in mesenteric arteries of rats fed a high-fat diet: Role of perivascular adipose tissue. Br. J. Pharm. 2017, 174, 3514–3526. [Google Scholar] [CrossRef]
- Motoshima, H.; Wu, X.; Mahadev, K.; Goldstein, B.J. Adiponectin suppresses proliferation and superoxide generation and enhances eNOS activity in endothelial cells treated with oxidized LDL. Biochem. Biophys. Res. Commun. 2004, 315, 264–271. [Google Scholar] [CrossRef]
- Yaribeygi, H.; Maleki, M.; Sathyapalan, T.; Jamialahmadi, T.; Sahebkar, A. Obesity and Insulin Resistance: A Review of Molecular Interactions. Curr. Mol. Med. 2021, 21, 182–193. [Google Scholar] [CrossRef]
- Bambace, C.; Telesca, M.; Zoico, E.; Sepe, A.; Olioso, D.; Rossi, A.; Corzato, F.; Di Francesco, V.; Mazzucco, A.; Santini, F.; et al. Adiponectin gene expression and adipocyte diameter: A comparison between epicardial and subcutaneous adipose tissue in men. Cardiovasc. Pathol. 2011, 20, e153–e156. [Google Scholar] [CrossRef]
- Iacobellis, G.; Pistilli, D.; Gucciardo, M.; Leonetti, F.; Miraldi, F.; Brancaccio, G.; Gallo, P.; Di Gioia, C.R.T. Adiponectin expression in human epicardial adipose tissue in vivo is lower in patients with coronary artery disease. Cytokine 2005, 29, 251–255. [Google Scholar] [CrossRef]
- Sodhi, K.; Denvir, J.; Liu, J.; Sanabria, J.R.; Chen, Y.; Silverstein, R.; Xie, Z.; Abraham, N.G.; Shapiro, J.I. Oxidant-Induced Alterations in the Adipocyte Transcriptome: Role of the Na,K-ATPase Oxidant Amplification Loop. Int. J. Mol. Sci. 2020, 21, 5923. [Google Scholar] [CrossRef]
- Karastergiou, K.; Evans, I.; Ogston, N.; Miheisi, N.; Nair, D.; Kaski, J.-C.; Jahangiri, M.; Mohamed-Ali, V. Epicardial Adipokines in Obesity and Coronary Artery Disease Induce Atherogenic Changes in Monocytes and Endothelial Cells. Arter. Thromb. Vasc. Biol. 2010, 30, 1340–1346. [Google Scholar] [CrossRef]
- Pabon, M.A.; Manocha, K.; Cheung, J.W.; Lo, J.C. Linking Arrhythmias and Adipocytes: Insights, Mechanisms, and Future Directions. Front. Physiol. 2018, 9, 1752. [Google Scholar] [CrossRef]
- Li, B.; Po, S.S.; Zhang, B.; Bai, F.; Li, J.; Qin, F.; Liu, N.; Sun, C.; Xiao, Y.; Tu, T.; et al. Metformin regulates adiponectin signalling in epicardial adipose tissue and reduces atrial fibrillation vulnerability. J. Cell. Mol. Med. 2020, 24, 7751–7766. [Google Scholar] [CrossRef]
- Stanek, A.; Brożyna-Tkaczyk, K.; Myśliński, W. The Role of Obesity-Induced Perivascular Adipose Tissue (PVAT) Dysfunction in Vascular Homeostasis. Nutrients 2021, 13, 3843. [Google Scholar] [CrossRef]
- Hansson, G.K. Inflammation, Atherosclerosis, and Coronary Artery Disease. New. Engl. J. Med. 2005, 352, 1685–1695. [Google Scholar] [CrossRef]


| Parameters. | |
|---|---|
| Gender (m/f), n (%) | 14 (74)/5 (26) |
| Age, years, Me (max-min) | 62 (53–72) |
| History of myocardial infarction, n (%) | 7 (37) |
| Hypertension, n (%) | 19 (100) |
| Diabetes mellitus, n (%) | 6 (31.6) |
| Prediabetes, n (%) | 5 (26.3) |
| Patients with normoglycemia, n (%) | 8 (42.1) |
| Duration of hypertension, years | 14 (10; 20) |
| Duration of CAD, years | 2 (1; 7) |
| Systolic blood pressure, mmHg | 135 (123.5; 144) |
| Diastolic blood pressure, mmHg | 80 (70; 85) |
| Smoking, n (%) | 7 (37) |
| Body mass index, kg/m2 | 30.1 (27.4; 33.3) |
| Obesity, n (%) | 7 (37) |
| Waist circumference, cm | 105 (97; 114) |
| Waist-to-hip ratio | 0.98 (0.93; 1.09) |
| Fat-free mass, kg | 57.90 (47.05; 62.05) |
| Fat mass, adjusted to BMI, kg | 33.50 (28.95; 39.05) |
| Skeletal muscle mass, kg | 26.30 (20.20; 28.50) |
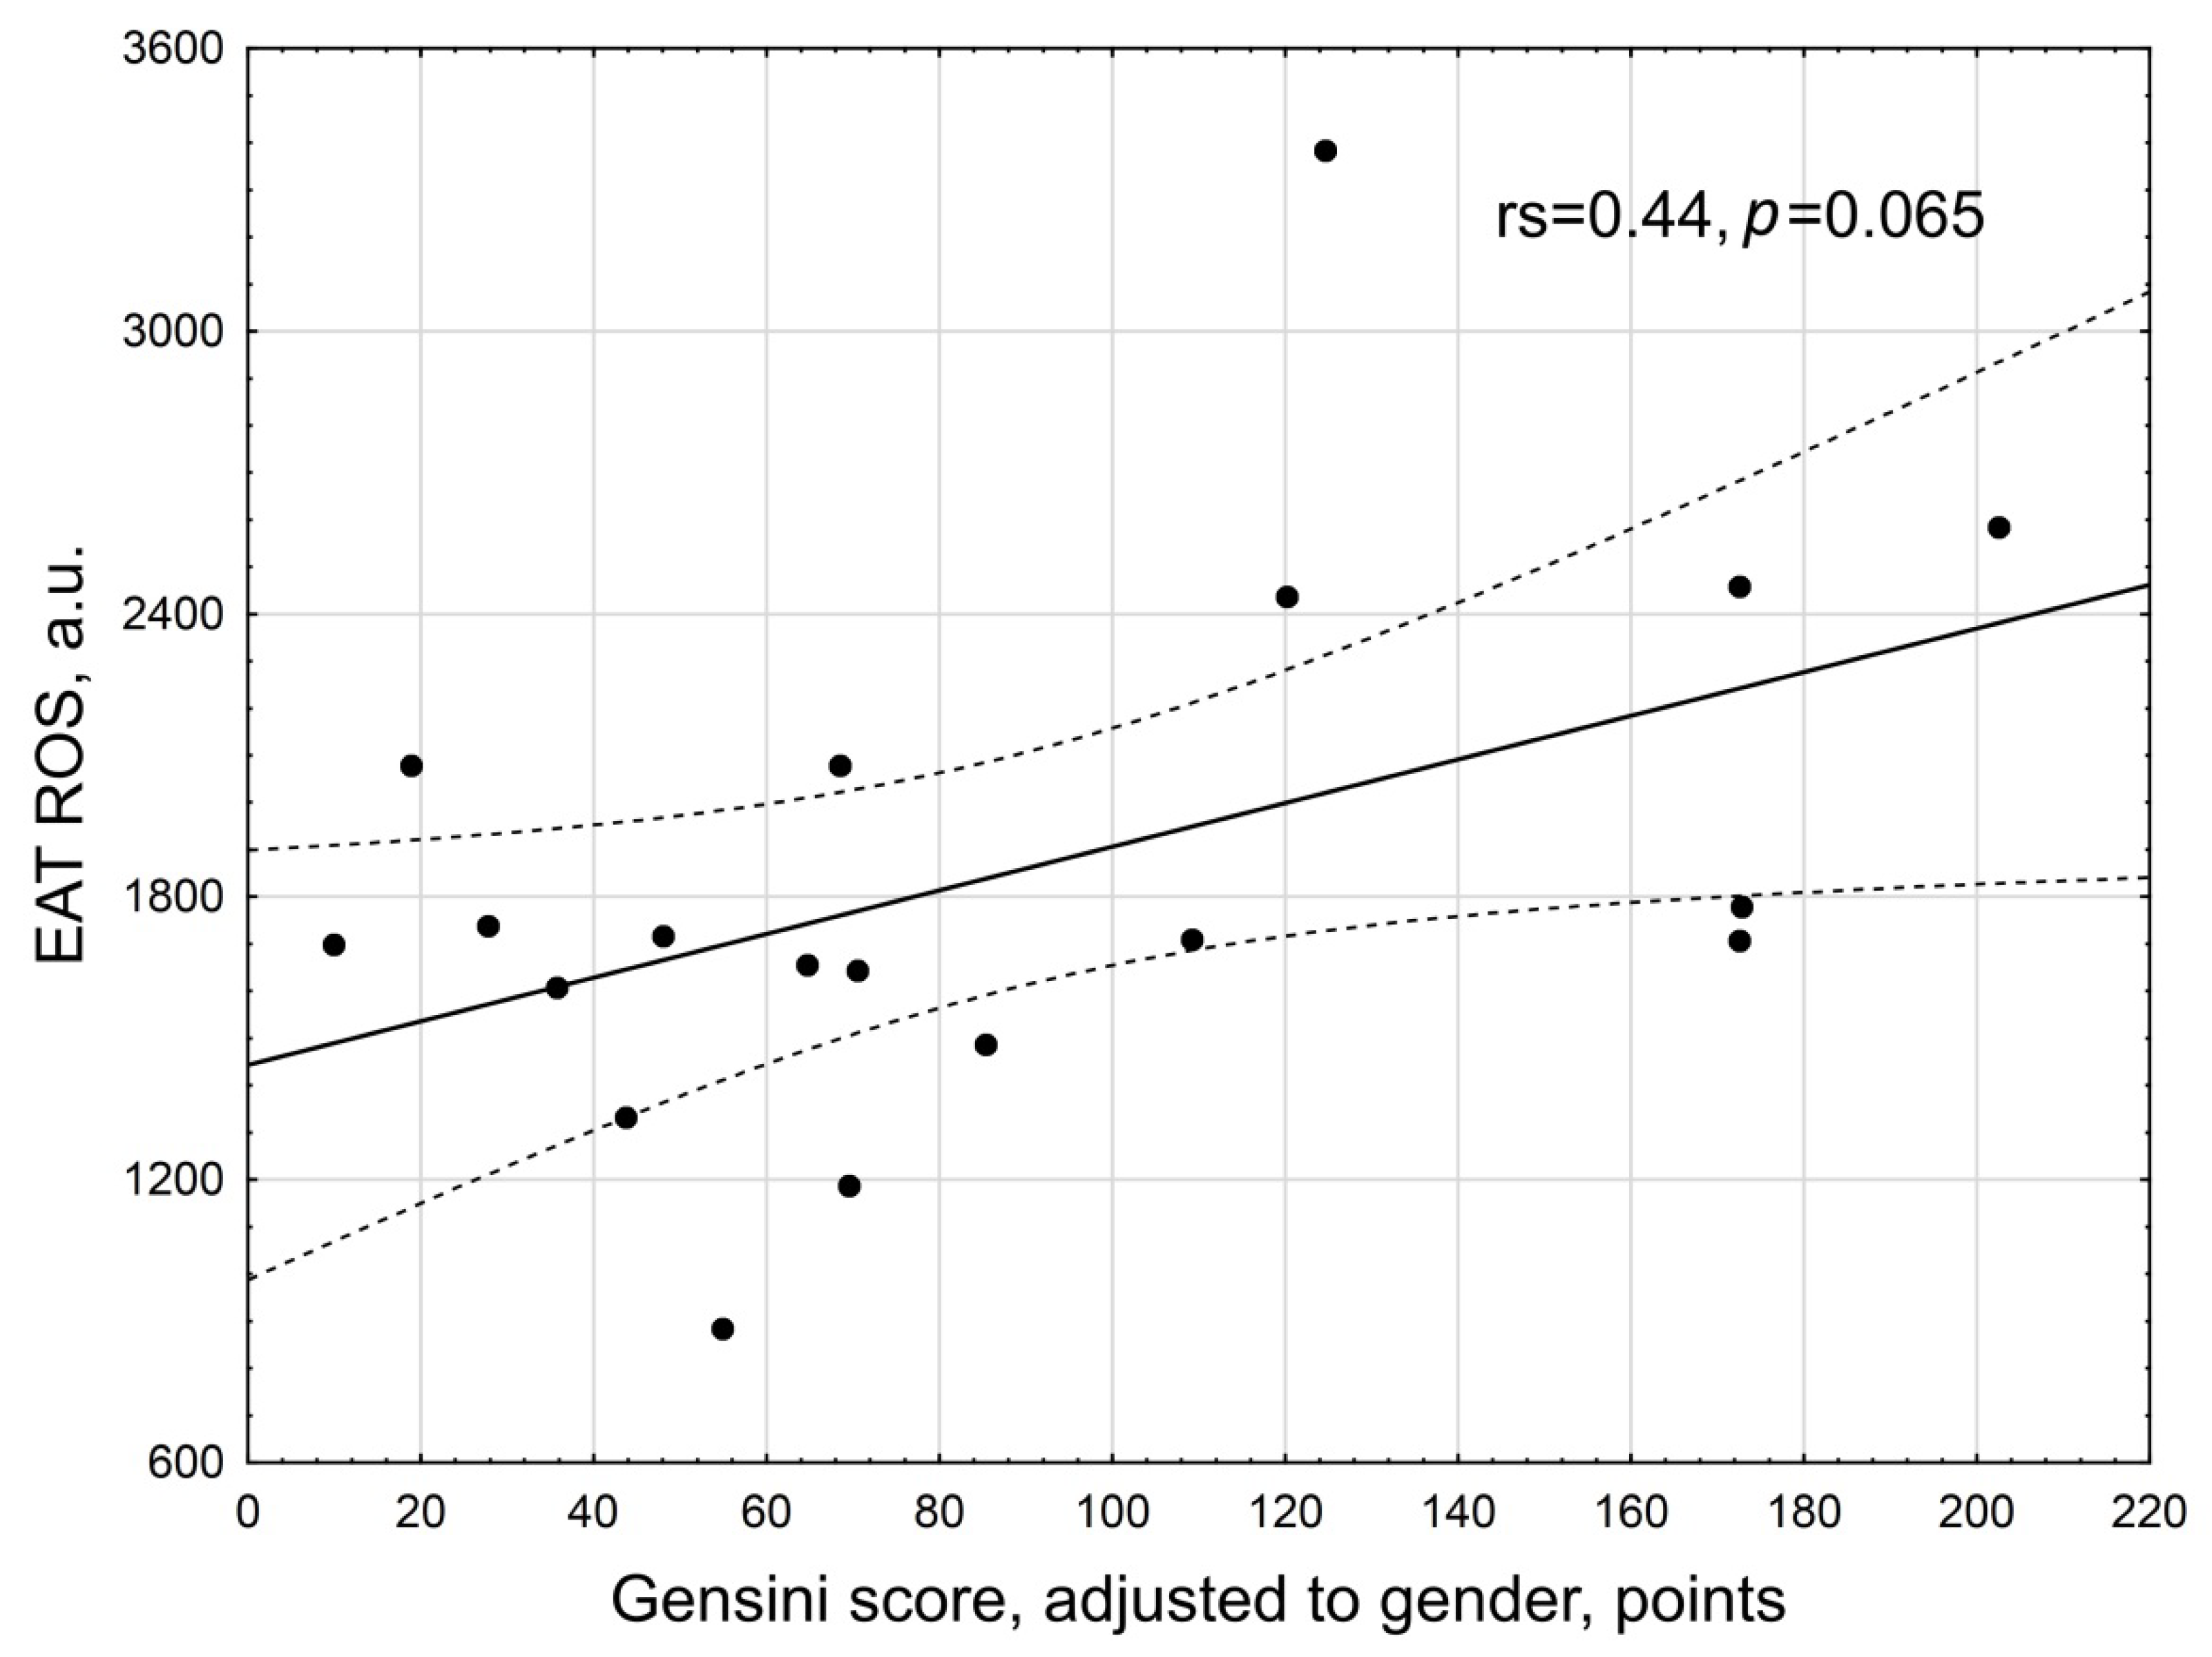
| Gensini score, points | 70.0 (28; 110) |
| Gensini score adjusted to gender, points | 70.55 (48; 149) |
| EAT thickness, mm | 4.65 (4.30; 5.60) |
| EAT adipocyte size, mm | 87.05 (84.82; 89.52) |
| Metformin, n (%) | 4 (21) |
| Angiotensin-converting enzyme inhibitors, n (%) | 8 (42) |
| Angiotensin receptor blockers, n (%) | 7 (37) |
| Calcium channels antagonists, n (%) | 10 (53) |
| Diuretics, n (%) | 17 (90) |
| Statins, n (%) | 7 (37) |
| Parameters | The General Group of Patients, n = 19 |
|---|---|
| Fasting glycemia, mmol/L | 5.7 (5.15; 6.05) |
| Postprandial glycemia, mmol/L | 7.5 (5.7; 7.89) |
| Fasting insulin, μU/mL | 5.6 (4.65; 8.60) |
| Postprandial insulin, μU/mL | 16.76 (11.06; 32.31) |
| HbA1c, % | 6.36 (5.57; 7.04) |
| Total cholesterol, mmol/L | 3.74 (3.01; 4.31) |
| Triacylglycerol, mmol/L | 1.31 (1.05; 1.45) |
| HDL, mmol/L | 1.04 (0.95; 1.23) |
| LDL, mmol/L | 1.95 (1.60; 2.42) |
| Serum adiponectin, adjusted to BMI, μg/mL | 6.36 (5.12; 10.44) |
| Serum leptin, adjusted to BMI and gender, ng/mL | 18.18 (11.98; 27.79) |
| Adiponectin, adjusted to BMI/leptin, adjusted to BMI and gender | 0.41 (0.27; 0.64) |
| hsCRP, mg/L | 2.99 (0.96; 6.72) |
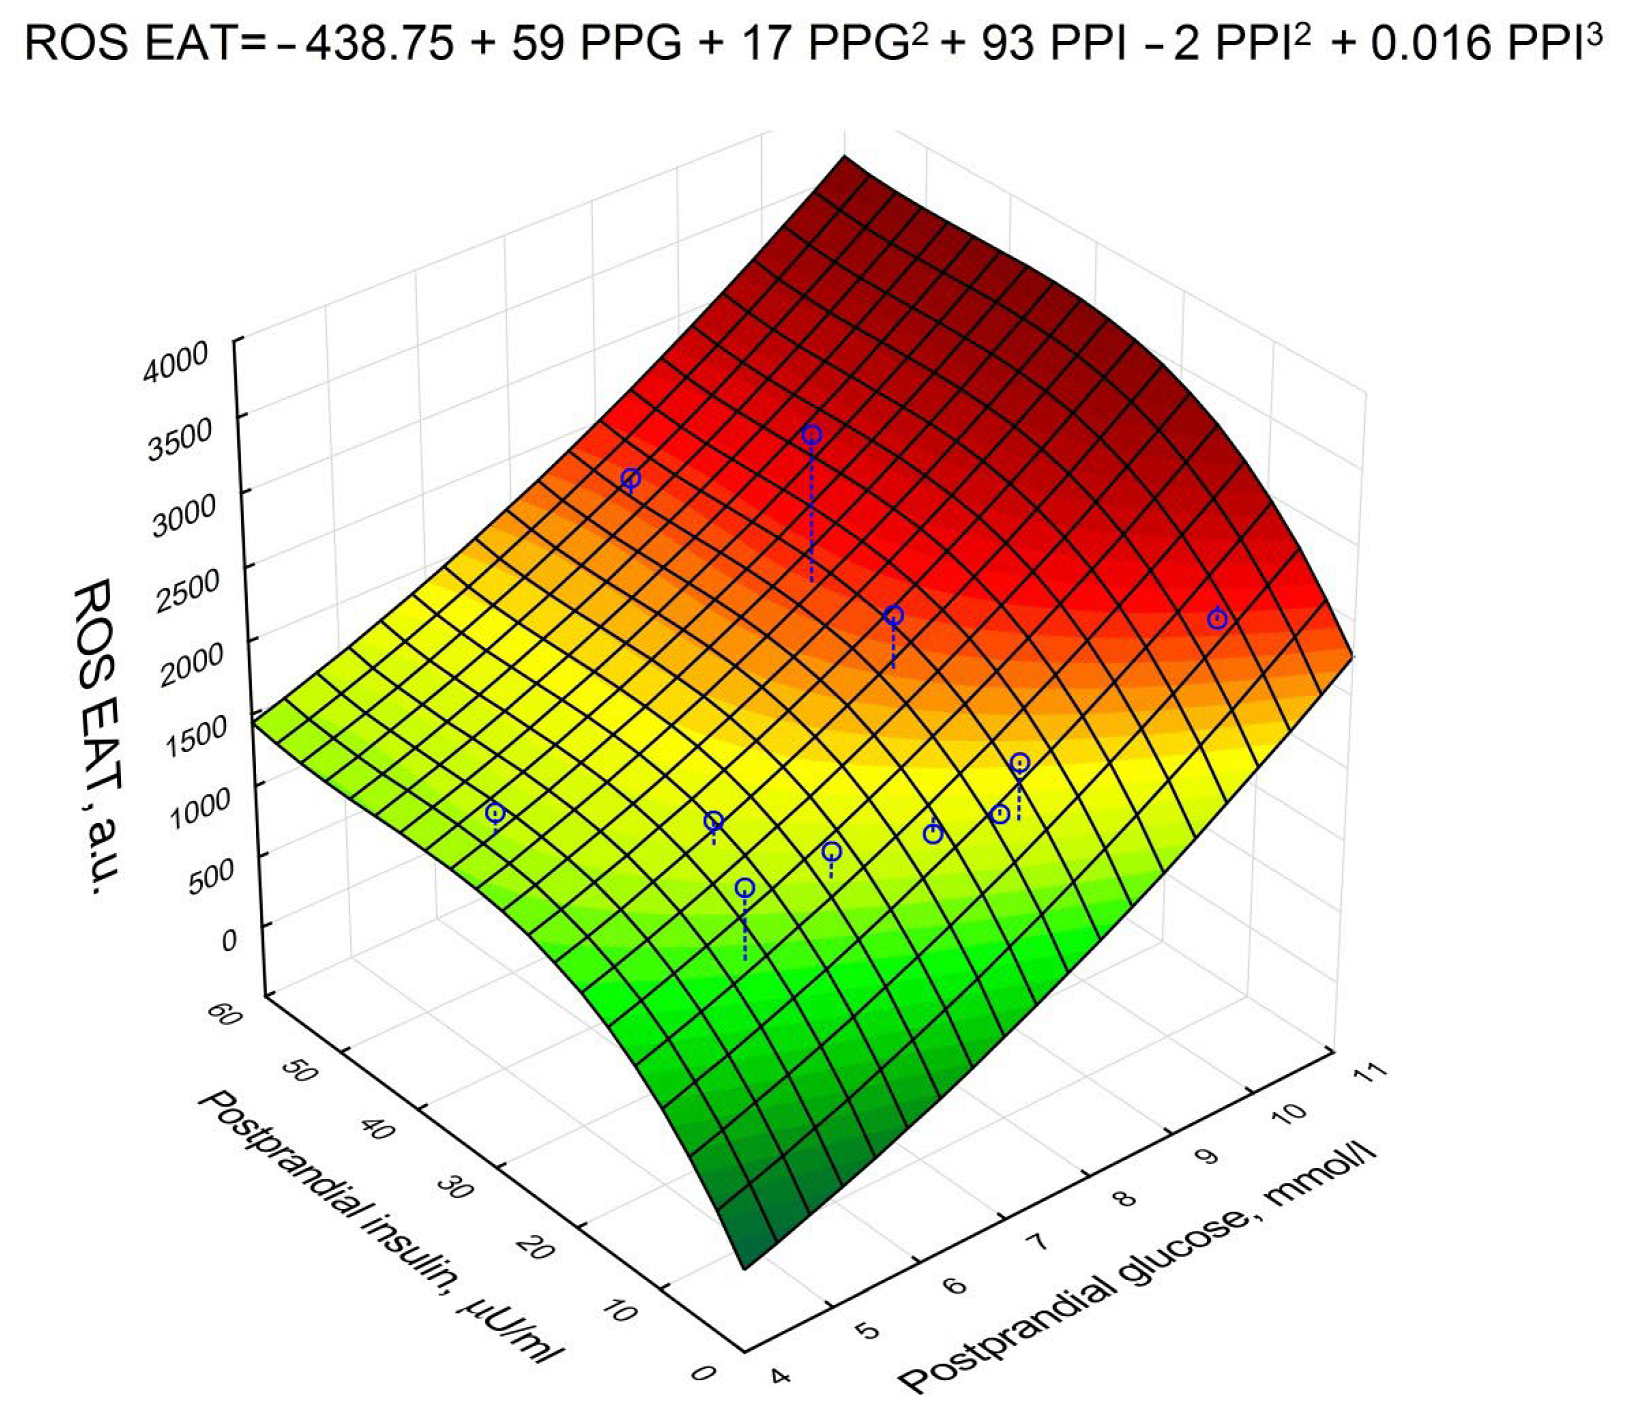
| Parameter | Beta | p |
|---|---|---|
| Postprandial glucose | 0.950704 | <0.001 |
| Postprandial insulin | 0.236687 | 0.012 |
| Serum adiponectin * | −0.203832 | 0.04 |
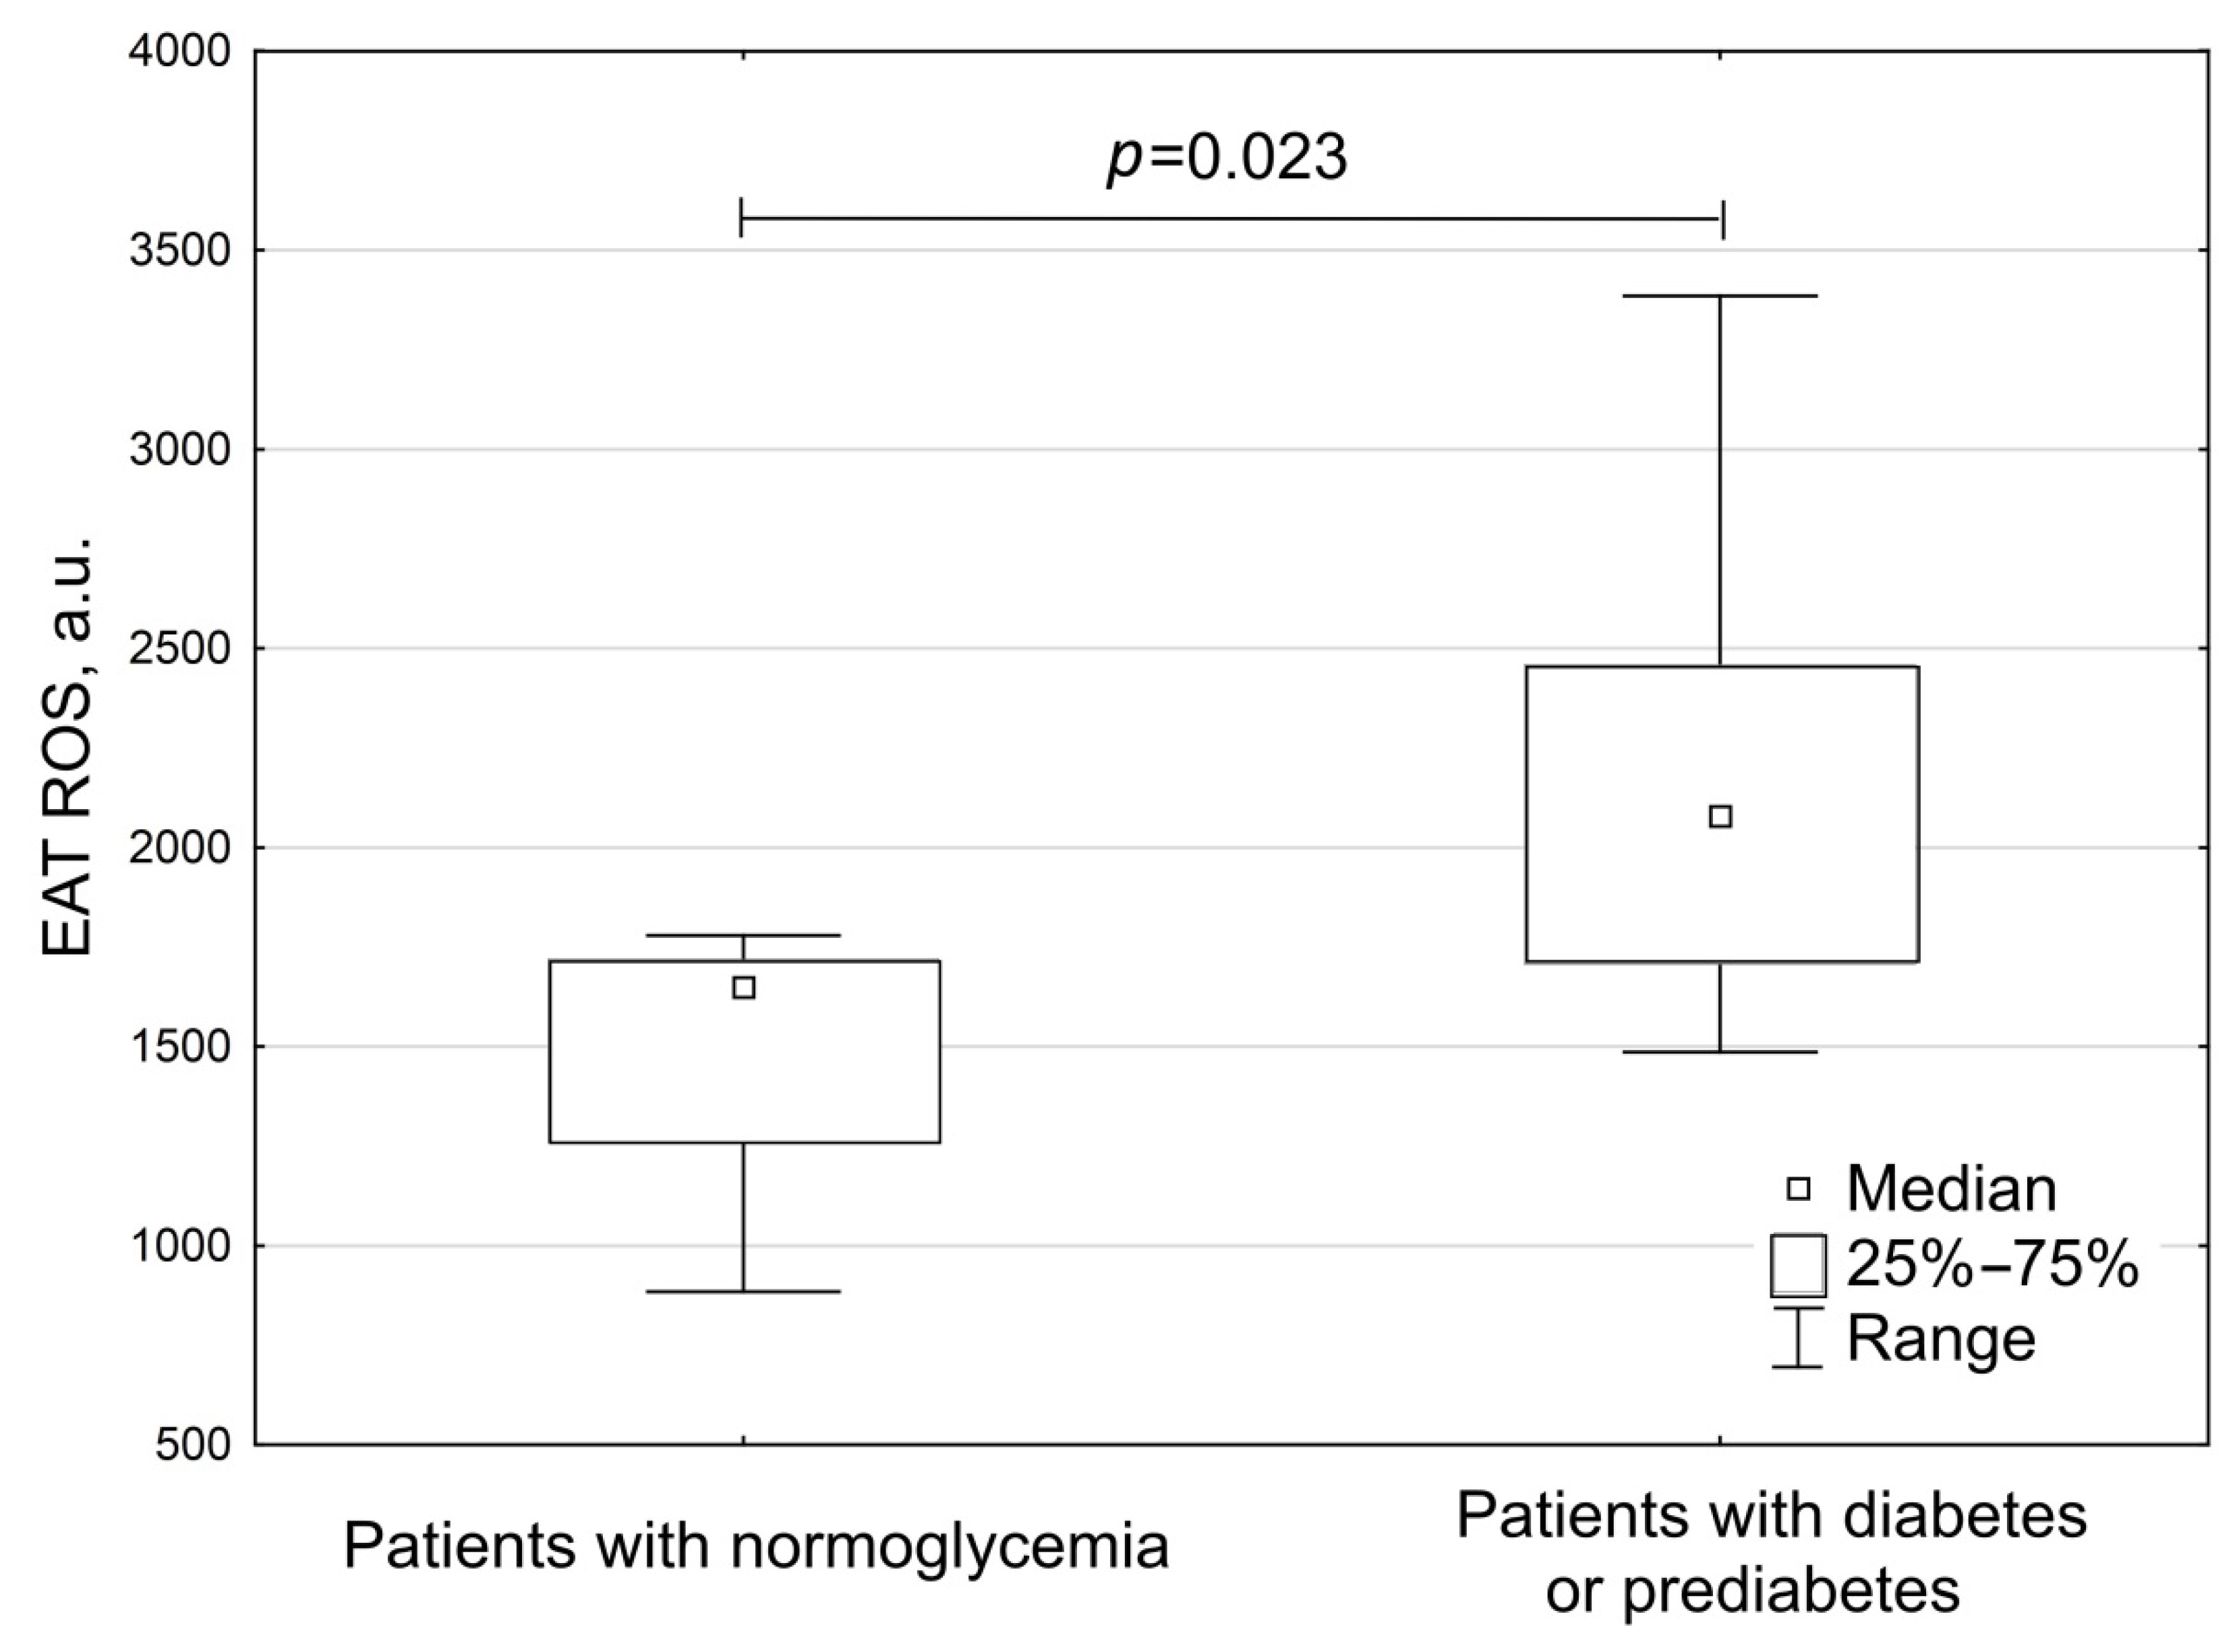
| Parameters | Group 1 Patients with Normoglycemia (n = 8) | Group 2 Patients with Diabetes or Prediabetes (n = 11) | p |
|---|---|---|---|
| Gender (m/f), n (%) | 6 (75)/2 (25) | 8 (73)/3 (27) | >0.05 |
| Age, years, Me (max-min) | 62 (53–71) | 62 (53–72) | >0.05 |
| BMI, kg/m2 | 29.1 (27.4; 30.8) | 31.3 (26.3; 36.8) | 0.21 |
| Waist circumference, cm | 102 (94.5; 107) | 109 (98; 118) | 0.139 |
| Waist-to-hip ratio | 0.96 (0.92; 1.01) | 1.02 (0.93; 1.11) | 0.46 |
| Fat-free mass, kg | 52.30 (47.00; 58.30) | 60.70 (56.70; 67.70) | 0.22 |
| Fat mass, adjusted to BMI, kg | 34.40 (27.70; 40.00) | 33.35 (30.20; 36.70) | 0.93 |
| Skeletal muscle mass, kg | 23.35 (18.00; 27.20) | 27.30 (25.80; 31.30) | 0.29 |
| Fasting glycemia, mmol/L | 5.2 (4.95; 5.7) | 6.0 (5.7; 8.0) | 0.01 |
| Postprandial glycemia, mmol/L | 5.7 (4.95; 6.43) | 7.8 (7.7; 7.9) | <0.001 |
| Fasting insulin, μU/mL | 6.0 (5.0; 8.0) | 5.6 (4.5; 8.7) | 0.98 |
| Postprandial insulin, μU/mL | 16.9 (13.9; 19.6) | 11.9 (9.2; 34.6) | 0.59 |
| HbA1c, % | 5.6 (5.5; 6.04) | 6.8 (6.3; 7.3) | 0.028 |
| Total cholesterol, mmol/L | 3.84 (3.13; 4.21) | 3.74 (3.01; 4.72) | 0.71 |
| Triacylglycerols, mmol/L | 1.14 (0.91; 1.31) | 1.37 (1.09; 1.78) | 0.1 |
| HDL, mmol/L | 1.04 (1.00; 1.18) | 1.06 (0.80; 1.36) | 0.96 |
| LDL, mmol/L | 2.06 (1.61; 2.56) | 1.95 (1.60; 2.42) | 0.9 |
| Serum adiponectin, adjusted to BMI, μg/mL | 7.14 (5.37; 9.68) | 6.36 (5.11; 10.6) | 0.96 |
| Serum leptin, adjusted to BMI and to gender, ng/mL | 17.40 (10.61; 25.14) | 18.34 (13.89; 27.79) | 0.5 |
| Adiponectin, adjusted to BMI/leptin, adjusted to BMI and gender | 0.41 (0.26; 0.68) | 0.43 (0.27; 0.64) | 0.82 |
| Metformin, n (%) | 0 | 4 (36) | >0.05 |
| Angiotensin-converting enzyme inhibitors, n (%) | 2 (25) | 6 (55) | >0.05 |
| Angiotensin receptor blockers, n (%) | 3 (38) | 4 (36) | >0.05 |
| Calcium channels antagonists, n (%) | 3 (38) | 7 (64) | >0.05 |
| Diuretics, n (%) | 7 (88) | 10 (91) | >0.05 |
| Statins, n (%) | 2 (25) | 5 (45) | >0.05 |
| Parameters | Group 1 Patients with Normoglycemia (n = 8) | Group 2 Patients with Diabetes or Prediabetes (n = 11) | p |
|---|---|---|---|
| Gensini score, points | 38.50 (28.00; 70.50) | 88.00 (36.00; 121.00) | 0.18 |
| Gensini score adjusted to gender, points | 59.80 (35.75; 70.01) | 109.24 (48.04; 172.55) | 0.18 |
| EAT thickness, mm | 4.60 (4.10; 5.13) | 4.65 (4.30; 5.60) | 0.67 |
| EAT adipocyte size, μm | 83.24 (79.18; 89.19) | 87.59 (86.37; 89.52) | 0.11 |
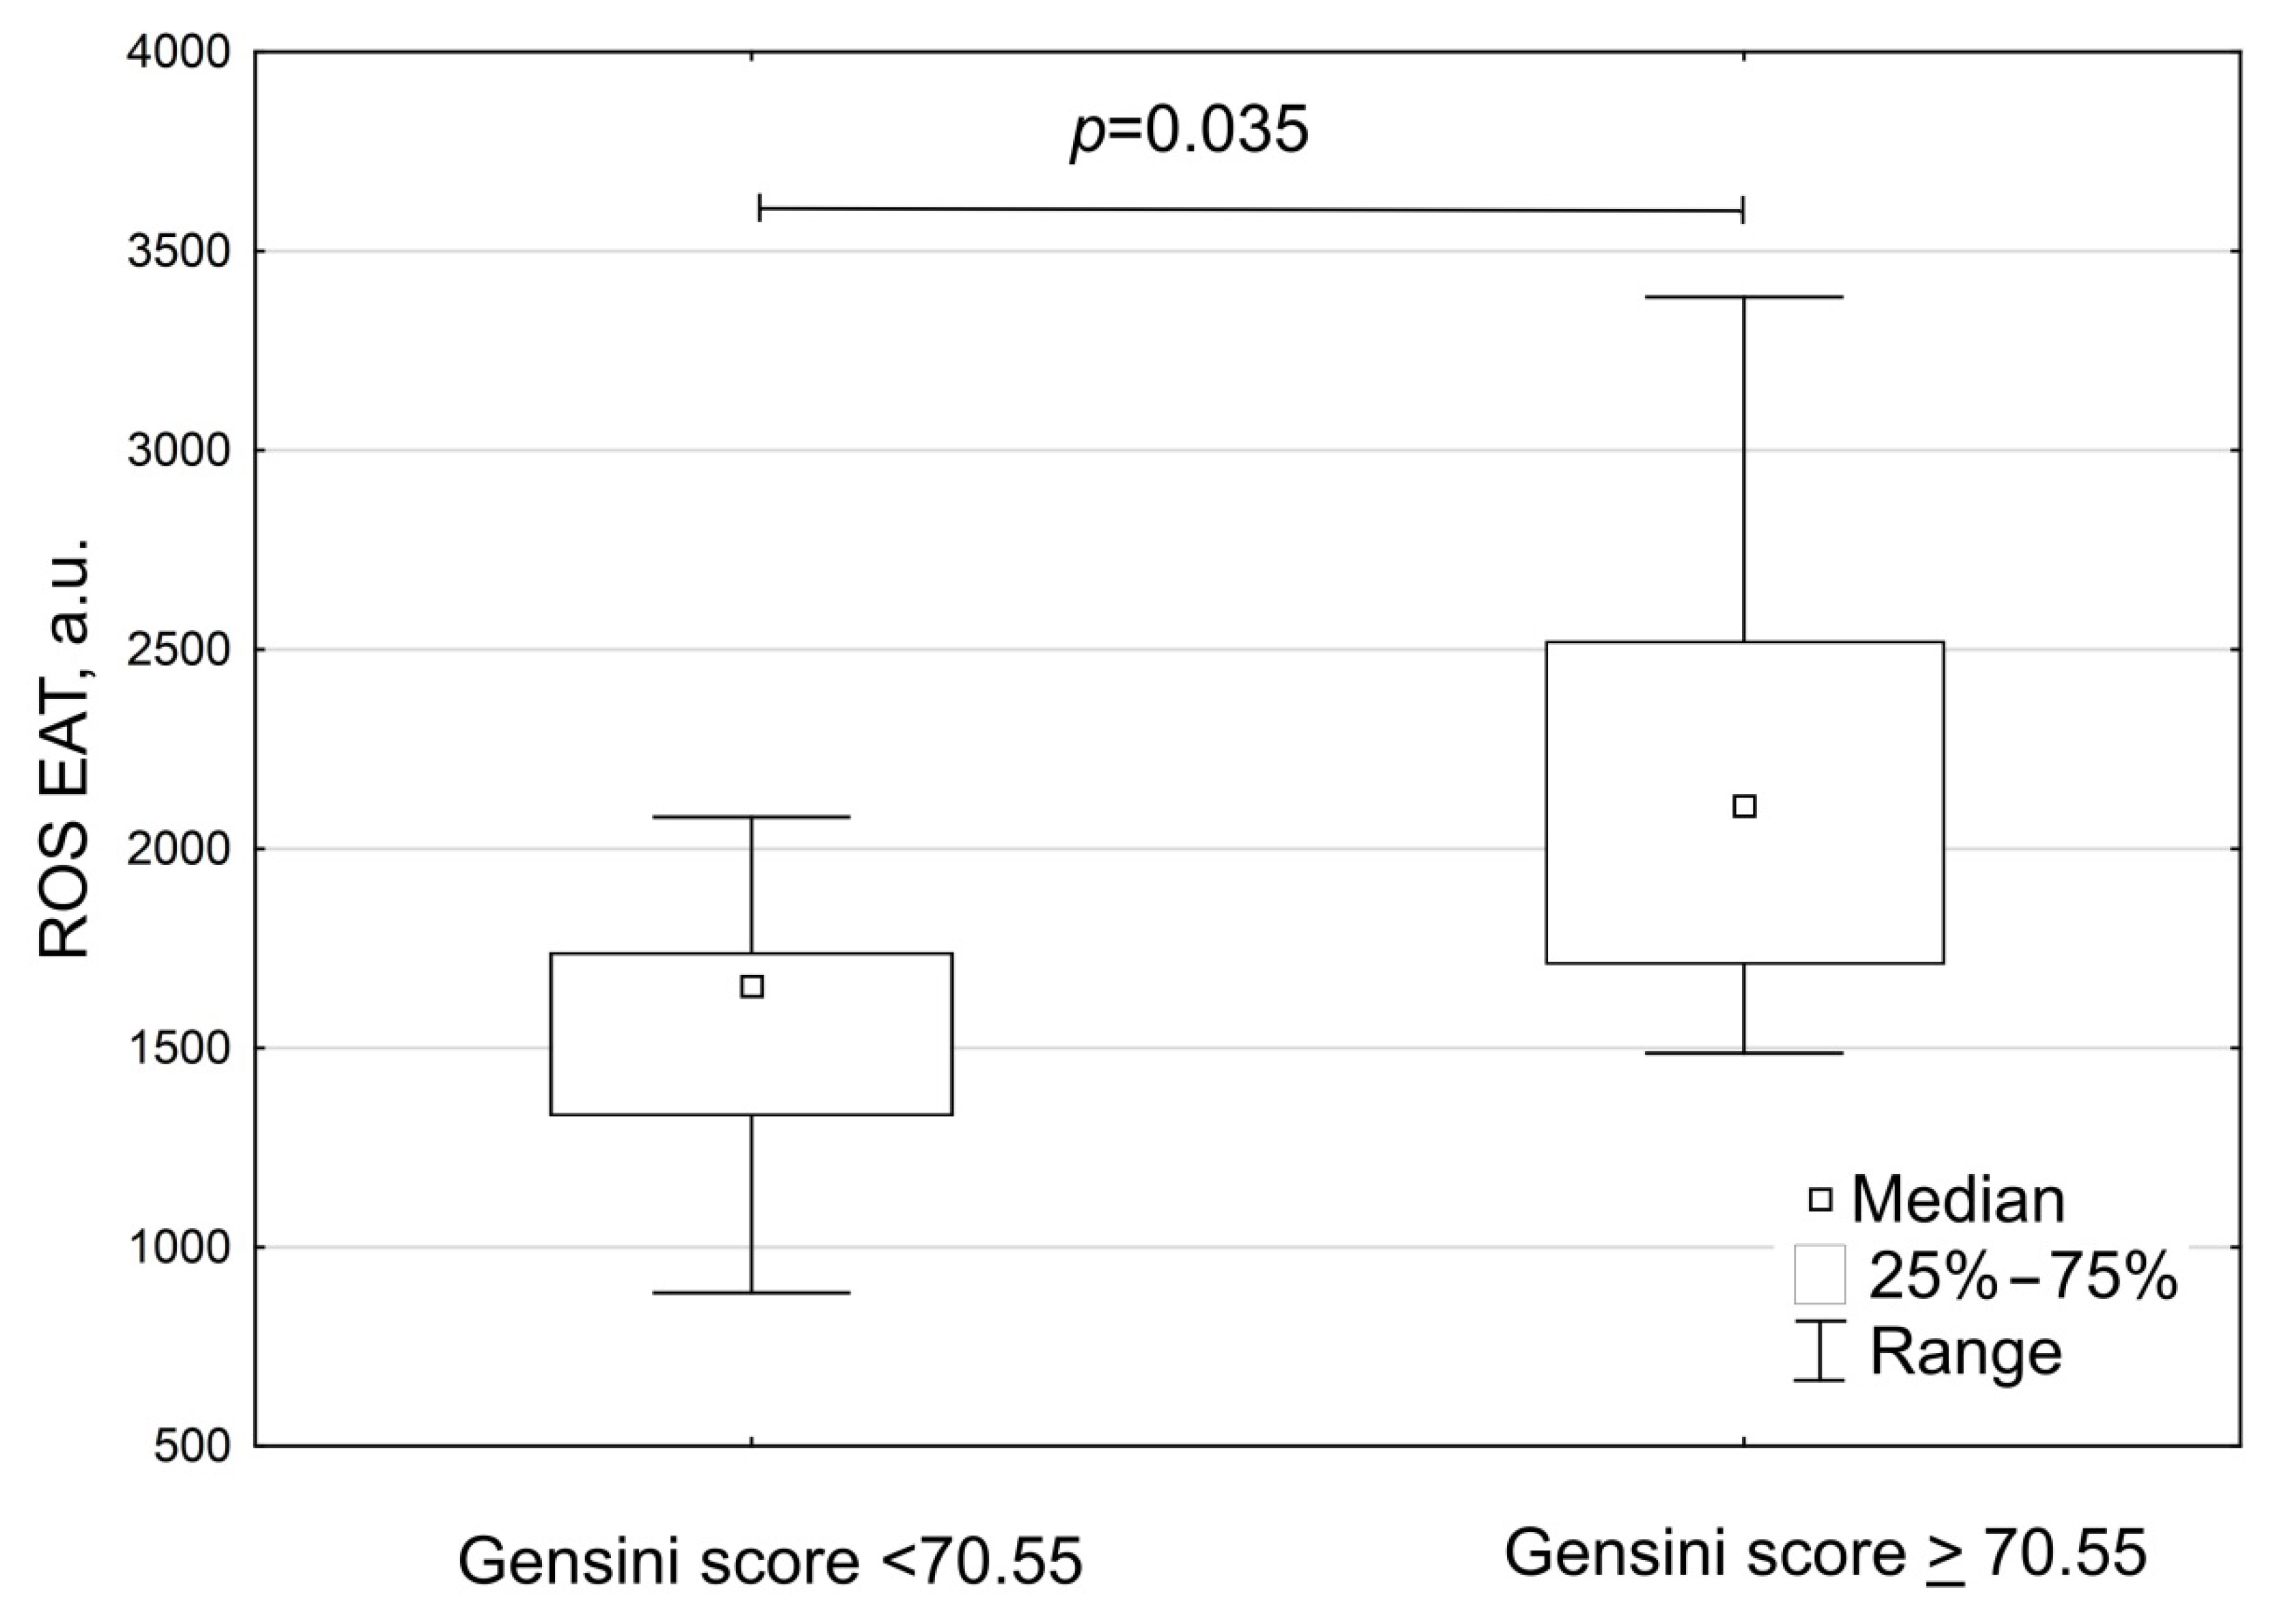
| Parameters | Group A Patients with Gensini Score < 70.55 (n = 11) | Group B Patients with Gensini ≥ 70.55 (n = 8) | p |
|---|---|---|---|
| Gensini score, points | 33.0 (24.5; 69.0) | 115.5 (88.0; 149.8) | <0.001 |
| Gensini score adjusted to gender, points | 48.0 (27.8; 68.5) | 148.6 (114.7; 172.7) | <0.001 |
| EAT thickness, mm | 5.1 (4.4; 5.7) | 4.3 (3.9; 4.8) | 0.075 |
| EAT adipocyte size, μm | 85.5 (79.3; 89.1) | 88.1 (86.5; 90.0) | 0.12 |
Publisher’s Note: MDPI stays neutral with regard to jurisdictional claims in published maps and institutional affiliations. |
© 2022 by the authors. Licensee MDPI, Basel, Switzerland. This article is an open access article distributed under the terms and conditions of the Creative Commons Attribution (CC BY) license (https://creativecommons.org/licenses/by/4.0/).
Share and Cite
Naryzhnaya, N.V.; Koshelskaya, O.A.; Kologrivova, I.V.; Suslova, T.E.; Kharitonova, O.A.; Andreev, S.L.; Gorbunov, A.S.; Kurbatov, B.K.; Boshchenko, A.A. Production of Reactive Oxygen Species by Epicardial Adipocytes Is Associated with an Increase in Postprandial Glycemia, Postprandial Insulin, and a Decrease in Serum Adiponectin in Patients with Severe Coronary Atherosclerosis. Biomedicines 2022, 10, 2054. https://doi.org/10.3390/biomedicines10082054
Naryzhnaya NV, Koshelskaya OA, Kologrivova IV, Suslova TE, Kharitonova OA, Andreev SL, Gorbunov AS, Kurbatov BK, Boshchenko AA. Production of Reactive Oxygen Species by Epicardial Adipocytes Is Associated with an Increase in Postprandial Glycemia, Postprandial Insulin, and a Decrease in Serum Adiponectin in Patients with Severe Coronary Atherosclerosis. Biomedicines. 2022; 10(8):2054. https://doi.org/10.3390/biomedicines10082054
Chicago/Turabian StyleNaryzhnaya, Natalia V., Olga A. Koshelskaya, Irina V. Kologrivova, Tatiana E. Suslova, Olga A. Kharitonova, Sergey L. Andreev, Alexander S. Gorbunov, Boris K. Kurbatov, and Alla A. Boshchenko. 2022. "Production of Reactive Oxygen Species by Epicardial Adipocytes Is Associated with an Increase in Postprandial Glycemia, Postprandial Insulin, and a Decrease in Serum Adiponectin in Patients with Severe Coronary Atherosclerosis" Biomedicines 10, no. 8: 2054. https://doi.org/10.3390/biomedicines10082054
APA StyleNaryzhnaya, N. V., Koshelskaya, O. A., Kologrivova, I. V., Suslova, T. E., Kharitonova, O. A., Andreev, S. L., Gorbunov, A. S., Kurbatov, B. K., & Boshchenko, A. A. (2022). Production of Reactive Oxygen Species by Epicardial Adipocytes Is Associated with an Increase in Postprandial Glycemia, Postprandial Insulin, and a Decrease in Serum Adiponectin in Patients with Severe Coronary Atherosclerosis. Biomedicines, 10(8), 2054. https://doi.org/10.3390/biomedicines10082054