Abstract
Zinc-α2 glycoprotein (ZAG) is an adipokine involved in adipocyte metabolism with potential implications in the pathogenesis of metabolic disorders. Our aim was to evaluate the relationship between visceral (VAT) and subcutaneous adipose tissue (SAT) ZAG expression and metabolic parameters in patients with class III obesity, along with the impact of basal ZAG expression on short- and medium-term outcomes related to bariatric surgery. 41 patients with class III obesity who underwent bariatric surgery were included in this study. ZAG gene expression was quantified in SAT and VAT. Patients were classified into two groups according to SAT and VAT ZAG percentile. Anthropometric and biochemical variables were obtained before and 15 days, 45 days, and 1 year after surgery. The lower basal SAT ZAG expression percentile was associated with higher weight and waist circumference, while the lower basal VAT ZAG expression percentile was associated with higher weight, waist circumference, insulin, insulin resistance, and the presence of metabolic syndrome. Basal SAT ZAG expression was inversely related to weight loss at 45 days after surgery, whereas no associations were found between basal VAT ZAG expression and weight loss after surgery. Additionally, a negative association was observed between basal SAT and VAT ZAG expression and the decrease of gamma-glutamyl transferase after bariatric surgery. Therefore, lower SAT and VAT ZAG expression levels were associated with an adverse metabolic profile. However, this fact did not seem to confer worse bariatric surgery-related outcomes. Further research is needed to assess the clinical significance of the role of ZAG expression levels in the dynamics of hepatic enzymes after bariatric surgery.
1. Introduction
Current epidemiological data show a dramatic increase in worldwide prevalence of overweight and obesity over the last few decades, with more than 2.1 billion people affected globally by these conditions [1]. Obesity is associated with a number of comorbidities such as cardiovascular disease, dyslipidemia, insulin resistance, type 2 diabetes mellitus (T2DM), immune dysfunction, and certain types of cancer [2]. Importantly, this disease constitutes a major health problem as it is associated with an increased risk of morbidity and mortality, causing 3.4 million deaths and 3.9% of years of life lost worldwide [3].
Essentially, the cause of obesity and overweight is an energy imbalance between calories consumed and calories expended. Thus, lifestyle modifications are the cornerstone in the treatment of this disease. However, bariatric surgery (BS) is probably the only available option to achieve long-term maintenance of substantial weight loss and improve obesity-related comorbidities in the most extreme form of obesity, named morbid obesity [4].
In recent years, adipose tissue has been recognized as a major endocrine organ which plays a key role in energy homeostasis. There are two main types of adipose tissue: white adipose tissue (WAT) and brown adipose tissue (BAT) [5]. WAT, in turn, can be classified in subcutaneous WAT (SAT) and visceral WAT (VAT) [5]. In the presence of excess energy supply, WAT expands as a result of cellular hypertrophy and hyperplasia [5,6]. Of note, hypertrophic adipocytes become frequently dysregulated, which leads to an altered release of adipokines [5]. With regard to this fact, zinc-α2-glycoprotein (ZAG) has emerged as a novel adipokine, which may have a role in the adipocyte metabolism as a modulator of lipid mobilization and adipokine production [7]. ZAG expression has been found to be downregulated in subjects with obesity and this fact could contribute to an impaired lipid mobilization and increased fat accumulation in SAT and VAT in this population [8].
On the other hand, there is a well-known link between excess adiposity observed in obesity and insulin resistance (IR) and altered glucose metabolism [9]. In this line, SAT ZAG has been shown to correlate positively with insulin sensitivity in obesity, while circulating ZAG levels are lower in patients with impaired glucose tolerance, T2DM, and polycystic ovary syndrome [10]. Moreover, decreased circulating ZAG levels in serum have been associated with the metabolic syndrome and central obesity and may constitute a useful biomarker for the diagnosis of this disease [11].
Previously, we studied ZAG expression levels in patients with class III obesity [12]. Our analyses showed that VAT ZAG expression levels were higher in patients with morbid obesity and low IR compared with those presenting high IR, and VAT ZAG expression levels were independently related to insulin, homeostatic model assessment of insulin resistance (HOMA-IR), and adiponectin [12]. On the other hand, contradictory results have been reported regarding ZAG levels after BS [13,14]. However, to our knowledge, there are no available studies assessing the influence of ZAG expression on BS outcomes.
Hence, in the current work, our aim was to assess the relation of SAT and VAT ZAG gene expression levels with basal metabolic characteristics of patients with class III obesity and with short- and medium-term BS-related outcomes, evaluating the potential role of SAT and VAT ZAG as predictive markers of BS-related out-comes. The potential implication of the findings of this study may also help to attain a better comprehension of the role of this adipokine in this severe form of obesity.
2. Materials and Methods
2.1. Subjects
A total of 41 patients with class III obesity (body mass index-BMI 54 ± 7 kg/m2), undergoing BS (biliopancreatic diversion of Scopinaro or sleeve gastrectomy), were included in this study.
Clinical, anthropometric, and biochemical data were obtained before and 15 days, 45 days, and 1 year after surgery. Exclusion criteria comprised the presence of T2DM, established cardiovascular disease, arthritis, or acute inflammatory disease, infectious disease, or the administration of drugs at the time of the inclusion that could alter the lipid profile or other biochemical parameters. The study was conducted in accordance with the Declaration of Helsinki and was approved by the Research Ethics Committee of Malaga (CEI_PI-0194-2017). Informed consent was obtained from all patients participating in this study.
2.2. Laboratory Measurements
Blood samples were collected after 12 h of fasting. Serum samples were separated and immediately frozen at −80 °C. Serum biochemical parameters were measured in duplicate. Serum glucose, triglycerides, cholesterol, and high-density lipoprotein (HDL) cholesterol levels were measured by standard enzymatic methods (Randox Laboratories Ltd., Antrium, UK). C-reactive protein (CRP), adiponectin, and leptin levels were measured by enzyme immunoassay (ELISA) kits (BLK Diagnostics, Badalona, Spain, DRG Diagnostics, Marburg, Germany and Mediagnost, Reutlingen, Germany, respectively) [12,15]. Insulin was determined by immunoradiometric assay (BioSource International, Camarillo, CA, USA), showing a 0.3% cross-reaction with proinsulin. HOMA-IR was calculated using the following equation: HOMA-IR = fasting insulin (µIU/mL) × fasting glucose (mol/L)/22.5.
2.3. Visceral and Subcutaneous Adipose Tissue mRNA
We analyzed basal ZAG gene expression levels in VAT and SAT, using the samples obtained during BS. The samples were washed in physiological saline and immediately frozen in liquid nitrogen and stored at −80 °C until analysis. Total RNA was extracted using RNeasy lipid tissue midi kit (QIAGEN Science, Hilden, Germany), and treated with 55 U RNase-free deoxyribonuclease (QIAGEN Science, Hilden, Germany) in accordance with the manufacturer’s instructions. The purity of the RNA was determined by absorbance at 260/absorbance at 280 ratio on the Nanodrop ND-1000 spectrophotometer (Thermo Fisher Scientific Inc. Waltham, MA, USA). Total RNA was reverse transcribed to cDNA by the utilization of a high-capacity cDNA reverse transcription kit (Applied Biosystems, Foster City, CA, USA). RT-qPCR reactions were performed using TaqMan® Gene Expression Assays (Applied Biosystems, Foster City, CA, USA) on an ABI 7500 Fast Real-Time PCR System (Applied Biosystems, Foster City, CA, USA). Additionally, we analyzed the relative basal mRNA expression levels of ZAG (Hs00426651_m1, RefSeq. NM_00185.3). mRNA transcripts were normalized to the expression of cyclophilin A (PPIA) (4326316E, RefSeq. NM_021130.3). Quantification of transcript level by RT-PCR was done by the use of relative Ct method (2−ΔΔCt).
2.4. Statistical Analysis
Data were expressed as mean values ± SD, unless otherwise stated. Clinical and biochemical data were analyzed by mean comparison (t-student test or Mann–Whitney U, depending on the normal distribution). Analysis of variance when the same measurement was made several times on each case was performed by generalized linear model (GLM) repeated measures. After testing the normal distribution of the continuous variables by the Shapiro–Wilk test, we applied logarithmic transformation as needed to ensure normality of skewed variables in GLM repeated measures analysis. Relationships between ZAG gene expression levels and clinical/biochemical variables were analyzed by Spearman’s correlation test. Linear regressions were used to determine the association between variables. The statistical analysis was performed with SPSS (Version 26.0 for Windows; SPSS, Chicago, IL, USA). The level of significance was set at p < 0.05.
3. Results
3.1. Basal Characteristics of the Study Population
Study participants were stratified by the 50th percentile of SAT and VAT ZAG gene expression levels (Figure 1). Clinical and biochemical characteristics of the study participants are shown in Table 1. Significant differences were observed between SAT ZAG groups regarding waist circumference, weight, and some other components of the metabolic syndrome. Similarly, VAT ZAG groups showed differences in waist circumference and weight, and some additional characteristics concerning the metabolic syndrome, such as insulin and HOMA-IR.
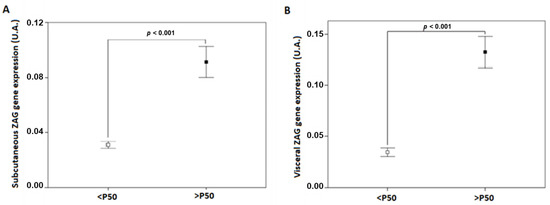
Figure 1.
ZAG gene expression levels in SAT (A) and VAT (B) adipose tissue of patients with class III obesity. P50, the 50th percentile of ZAG; SAT, subcutaneous adipose tissue; VAT, visceral adipose tissue; ZAG, zinc-α2 glycoprotein.

Table 1.
Clinical and biochemical characteristics of studied patients with class III obesity before bariatric surgery (basal) classified by the 50th percentile of SAT and VAT ZAG gene expression.
3.2. Relationship between Basal SAT and VAT ZAG Gene Expression Levels and Clinical Variables
A significant negative correlation was found between basal SAT ZAG gene expression and waist circumference, weight, gamma-glutamyl transferase (GGT), glutamic pyruvic transaminase (GPT), creatinine and uric acid; whereas a significant positive correlation was observed between basal SAT ZAG gene expression and alkaline phosphatase (ALP) and adiponectin (Figure 2). On the other hand, a significant negative correlation was observed between basal VAT ZAG gene expression and waist circumference, weight, BMI, insulin, HOMA-IR, triglycerides, GGT, uric acid and C- reactive protein (CRP) (Figure 2).
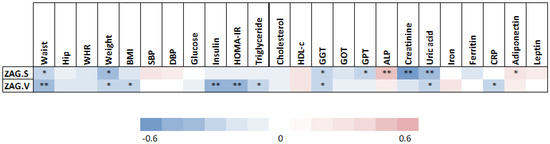
Figure 2.
Correlations between clinical and metabolic parameters and adipose tissue ZAG levels. Abbreviations: ALP, alkaline phosphatase; BMI, body mass index; CRP, c reactive protein; DBP, diastolic blood pressure; GGT, gamma-glutamyl transferase; GOT, glutamic oxaloacetic transaminase; GPT, glutamic pyruvic transaminase; HDL-c, high-density lipoprotein cholesterol; HOMA-IR, homeostasis model assessment of insulin resistance; SBP, systolic blood pressure; WHR, waist to hip ratio; ZAG.S; subcutaneous adipose tissue zinc-α2 glycoprotein; ZAG.V; visceral adipose tissue zinc-α2 glycoprotein. Statistical significance is expressed as: * p < 0.05; ** p < 0.01.
To further analyze the impact of the distinct clinical parameters, we performed different linear regression models, including those parameters that significantly correlated with SAT and VAT ZAG gene expression levels. We included the gene expression levels of SAT ZAG as dependent variable and sex, waist circumference, weight, SBP, GGT, ALP, creatinine, and ferritin levels as independent variables. The first regression model (R2 = 0.270, F = 13, p = 0.001) suggested that 27% of the gene expression levels of SAT ZAG could be explained by a negative effect of creatinine (ß = −0.520, p = 0.001). The second regression model, which included the gene expression levels of VAT ZAG as dependent variable and the presence of metabolic syndrome, waist circumference, weight, insulin, HOMA-IR, and iron levels as independent variables (R2 = 0.422, F = 9, p < 0.001), demonstrated that 42% of VAT ZAG gene expression levels could be explained by a negative effect of waist circumference (ß = −0.276, p = 0.049), metabolic syndrome (ß = −0.306, p = 0.022), and insulin levels (ß = −0.336, p = 0.018).
On the other hand, regression models suggested that SAT ZAG gene expression levels could explain 10% of the variation of waist circumference (R2 = 0.106, ß = −0.326, p = 0.049), 27% of creatinine levels (R2 = 0.270, ß = −0.520, p = 0.001), and 12% of uric acid levels (R2 = 0.121, ß = −0.348, p = 0.035). Moreover, regression models suggested that variations of waist circumference, weight, and BMI (21%, 14%, and 12%, respectively) could be explained by VAT ZAG gene expression levels (R2 = 0.207, ß = −0.455, p = 0.003; R2 = 0.136, ß = −0.369, p = 0.018; R2 = 0.117, ß = −0.342, p = 0.029, respectively). Furthermore, regression models suggested that the variation of 25% of insulin levels and 23% of HOMA-IR could be explained by VAT ZAG gene expression levels (R2 = 0.247, ß = −0.497, p = 0.001; R2 = 0.232, ß = −0.482, p = 0.001, respectively). In addition, 11% of the variation of GGT levels could be explained by VAT ZAG gene expression levels (R2 = 0.107, F = 4.7, ß = −0.327, p = 0.037).
3.3. Changes in the Different Clinical and Analytical Parameters after Bariatric Surgery
Table 2 and Table 3 display the changes in the different clinical and analytical parameters before BS (Basal) and after BS (15 days, 45 days, and 1 year) according to the lower and upper 50th percentile of basal SAT and VAT ZAG gene expression, respectively. Briefly, significant body weight reductions, along with BMI reductions, were observed as early as 15 days after BS in both percentile groups of basal SAT and VAT ZAG gene expression and continued gradually decreasing until 1 year after the intervention. Similar dynamics were found in other parameters such as insulin, HOMA-IR, and leptin. Systolic blood pressure was significantly reduced 15 days after BS in both the lower and the upper percentile of basal SAT and VAT ZAG gene expression and continued until 1 year after BS, whereas similar changes were found in diastolic blood pressure in subjects within the lower percentile of basal SAT and VAT ZAG gene expression. Besides, this subgroup also showed a significant decrease in total cholesterol, triglycerides, and GGT at the end of the study.
Table 2.
Changes in clinical and biochemical variables in patients with class III obesity before bariatric surgery (Basal) and 15 days, 45 days, and 1 year after bariatric surgery according to subcutaneous (SAT) ZAG gene expression levels. Patients were stratified by the 50th percentile of SAT ZAG gene expression levels.
Table 3.
Changes in clinical and biochemical variables in patients with class III obesity before bariatric surgery (Basal) and 15 days, 45 days, and 1 year after bariatric surgery according to visceral (VAT) ZAG gene expression levels. Patients are stratified by the 50th percentile of VAT ZAG gene expression.
3.4. Correlation Analysis between Basal SAT and VAT ZAG Gene Expression and BS Outcomes
A significant negative correlation was found between basal SAT ZAG gene expression and weight loss from baseline at 15 and 45 days (p < 0.05), whereas no statistically significant correlation was detected with regard to this variable and basal SAT ZAG gene expression at 1 year (Figure 3). In addition, basal SAT ZAG gene expression also correlated negatively with BMI reduction at 45 days (p < 0.05), CRP reduction at 45 days (p < 0.05), and GGT decrease at 1 year (p < 0.01), among others. On the other hand, a significant inverse correlation was observed between basal VAT ZAG gene expression and the decrease in GGT levels from baseline at 1 year (p < 0.01), as well as in diastolic blood pressure (p < 0.05), insulin (p < 0.05), and total cholesterol (p < 0.05) at 1 year.

Figure 3.
Correlations between clinical and biochemical parameter changes after surgery and basal adipose tissue ZAG levels. Abbreviations: Δ, percentage decrease ((initial value − final value)/initial value)*100; ALP, alkaline phosphatase; BMI, body mass index; CRP, c reactive protein; DBP, diastolic blood pressure; GGT, gamma-glutamyl transferase; GOT, glutamic oxaloacetic transaminase; GPT, glutamic pyruvic transaminase; HDL-c, high-density lipoprotein cholesterol; HOMA-IR, homeostasis model assessment of insulin resistance; SBP, systolic blood pressure; WHR, waist to hip ratio; ZAG.S; subcutaneous adipose tissue ZAG; ZAG.V; visceral adipose tissue ZAG. Statistical significance is expressed as: * p < 0.05; ** p < 0.01.
3.5. Variables Associated with Basal SAT and VAT ZAG Gene Expression Levels
Linear regression analyses were performed in order to detect independent associations between basal SAT and VAT ZAG gene expression levels and changes in several variables after BS (Table 4 and Table 5). We also analyzed the impact of sex and the presence of metabolic syndrome, as there were differences in ZAG percentile groups. Regression models suggested that basal SAT ZAG gene expression levels could explain 14% and 15% of the variation of weight loss and BMI at 45 days after surgery, whereas no associations were observed between basal VAT ZAG gene expression levels and weight loss over time. Both basal SAT and VAT ZAG gene expression levels could explain between 20–30% of the variation of GGT after BS and between 14–23% of the variation of creatinine after BS.
Table 4.
Regression analysis predicting clinical and biochemical changes using sex and subcutaneous ZAG (ZAG.S) gene expression levels as independent variables.
Table 5.
Regression analysis predicting clinical and biochemical changes using metabolic syndrome and visceral ZAG (ZAG.V) gene expression levels as independent variables.
4. Discussion
In this study, we found that basal SAT and VAT ZAG gene expression levels were associated with adverse metabolic features in individuals with class III obesity. Additionally, our results reveal that basal SAT ZAG gene expression levels are inversely related to short-term weight loss after BS, whereas no medium-term associations between basal SAT/VAT ZAG gene expression levels and weight loss after BS were detected. Several studies have described a close relationship between ZAG gene expression levels and obesity, as well as other components of the metabolic syndrome. In this sense, Gong et al. found that serum ZAG levels were negatively associated with body weight and body fat percentage [15], and Wang et al. showed that serum ZAG levels were decreased in patients with metabolic syndrome and central obesity [11]. In patients with class III obesity, an inverse relationship between the degree of IR and VAT ZAG gene expression levels has been reported, and both VAT and SAT ZAG gene expression showed a direct relationship with the genetic expression of lipolytic enzymes [12]. Thus, ZAG gene expression has been postulated as a master regulator of lipid metabolism and a key adipokine in the pathophysiological pathways involved in obesity and metabolic syndrome [16]. In line with the above, our results showed an independent inverse relationship between basal SAT ZAG gene expression levels and waist circumference and a negative association between basal VAT ZAG gene expression levels and waist circumference, weight, BMI, and some components of the metabolic syndrome, such as HOMA-IR, insulin, and triglycerides.
Interestingly, ZAG gene expression has been reported to be down-regulated in liver tissues of subjects with non-alcoholic fatty liver disease (NAFLD), and over-expression of ZAG may play a protective role against this disease [17,18]. In our population, the lower percentiles of both SAT and VAT ZAG gene expression levels presented higher serum levels of GGT as compared to the higher percentiles, and the correlation analysis revealed an inverse relationship between basal SAT ZAG gene expression levels and both GGT and GPT. In addition, the correlation analysis and the linear regression showed that basal VAT ZAG gene expression levels and GGT were closely associated. These results could be related to a higher prevalence of NAFLD in subjects with decreased ZAG gene expression levels, although it is important to bear in mind that the presence of this disease was not specifically assessed in the study, and normal values of GGT and transaminases do not exclude the presence of NAFLD. On the other hand, a positive correlation was observed between SAT/VAT ZAG gene expression levels and serum levels of creatinine, and independent associations were also found between these parameters after surgery. In this line, elevated circulating levels of ZAG have been linked to kidney impairment [19]. However, since patients included in this study did not present kidney disease, these results should be cautiously interpreted.
In addition to its value as a marker of metabolic derangement in patients with obesity, pre-operative ZAG gene expression levels might affect BS outcomes. In this regard, several changes in basal adipokine expression and pro-inflammatory biomarkers have been suggested to predict BS outcomes [20]. As an example, higher baseline serum levels of CRP were associated with increased weight loss after BS [21]. On the other hand, it is also important to note that extreme body weight may be related to increased inflammatory parameters, such as CRP, which may be associated with increased morbidity and mortality [22]. Beyond the aforementioned inflammatory markers, the study of several adipokines, such as leptin or adiponectin, as predictors of BS outcomes has led to different results [23,24,25]. However, as far as we know, the role of ZAG gene expression levels in predicting BS outcomes has remained unexplored. In the present study, the correlation analysis revealed an inverse relationship between basal SAT ZAG gene expression levels and weight loss percentage from baseline at 15 and 45 days after BS, and a close, negative independent relationship was also found between basal SAT ZAG gene expression levels and percent weight loss at 45 days after BS. Therefore, as opposed to other basal factors, such as SAT fibrosis, which have been associated with decreased fat mass loss percentage after BS [26], our results show that SAT ZAG gene expression levels may have a positive impact on short-term weight loss after BS. Moreover, despite the well-known association between ZAG gene expression and several metabolic disorders, such as visceral obesity and metabolic syndrome, decreased basal SAT/VAT ZAG gene expression levels were not linked to poorer outcomes in terms of weight loss 1 year after the surgical procedure.
Notably, both basal SAT and VAT ZAG gene expression levels showed a negative association with the decrease of GGT from baseline at 1 year after BS in the linear regression analysis. Since GGT may be a surrogate marker of NAFLD and dynamic changes in serum, GGT levels have been associated with an improvement in liver histology in individuals with NAFLD [27,28], and these results might postulate basal SAT/VAT ZAG gene expression levels as a useful marker to predict NAFLD response to BS. However, the patients included in this study did not have a formal diagnosis of NAFLD, and basal GGT levels were significantly higher in the lower percentile of SAT and VAT ZAG gene expression levels, which could have led to greater benefits after BS in this population due to altered baseline characteristics. Thus, further research is needed in order to confirm this hypothesis.
Therefore, in the present study, we show that adipose tissue ZAG expression levels are associated to the metabolic status of patients with morbid obesity, and may have an impact on metabolic outcomes related to bariatric surgery. ZAG is a lipolytic adipokine implicated in the regulation of adipose tissue metabolism and distribution, among other functions [29,30]. Therefore, differences in the expression of ZAG in adipose tissue may reflect the status of fat metabolism and could explain dynamic changes in adipose tissue after bariatric surgery. Further studies are needed to unravel the exact pathophysiological mechanisms of the reported findings.
The main limitations of our study are the reduced sample sized and its retrospective nature. Therefore, prospective large-scale studies are required to assess the role of ZAG gene expression in BS outcomes. Besides, this study was conducted in patients with extreme obesity; hence, these results cannot be extrapolated to other populations. On the other hand, our main strength lies on the novelty of our results as, to our knowledge, this is the first study that evaluates the impact of pre-BS SAT/VAT ZAG gene expression levels on short- and medium-term BS outcomes.
In conclusion, lower SAT/VAT ZAG gene expression levels were linked to an adverse metabolic profile in patients with class III obesity. Besides, SAT ZAG gene expression levels were inversely related to short-term weight loss after BS. Despite the well-described relationship between basal SAT/VAT ZAG and obesity severity/metabolic derangement, this feature was not associated with poorer medium-term outcomes (e.g., in terms of weight loss) after BS. Additionally, the decrease of GGT levels showed a negative relationship with basal SAT/VAT ZAG gene expression. Further investigation is necessary to confirm the value of basal SAT/VAG ZAG gene expression in predicting weight loss and assessing NAFLD improvement after BS.
Author Contributions
Conceptualization, L.G.-S. and M.M.; Formal analysis, H.M.-R., A.G.-J., M.M.; Investigation, J.I.M.-M., L.O.-W., R.S.-H., H.M.-R., J.R.-B., F.J.M.-R., M.T., J.R.-C., F.J.T., E.G.-F., L.G.-S. and M.M.; Methodology, A.R.-M., H.M.-R., E.G.-F. and L.G.-S.; Resources, F.J.T., E.G.-F., L.G.-S. and M.M.; Supervision, F.J.T., E.G.-F., L.G.-S. and M.M.; Writing—review and editing, J.I.M.-M., L.O.-W., F.J.T., E.G.-F., L.G.-S. and M.M. All authors have read and agreed to the published version of the manuscript.
Funding
This study has been co-funded by FEDER funds (“A way to make Europe”). M.M. and L.G.S. are also supported by UMA18-FEDERJA-285 and UMA20-FEDERJA-144, co-funded by Malaga University, Junta de Andalucía and FEDER funds, CB06/03/0018, PI-0297-2018 and PI-0194-2017, co-funded by FEDER funds and Consejería de Salud y Familias, Junta de Andalucía, and CP17/00133, Instituto de Salud Carlos III (ISCIII), Ministry of Science, Innovation and Universities, Spain.
Institutional Review Board Statement
The study was conducted according to the guidelines of the Declaration of Helsinki, and approved by the Research Ethics Committee of the Biomedical Research Institute of Malaga (IBIMA) (protocol code CEI_PI-0194-2017 and date of approval 25 January 2018).
Informed Consent Statement
Informed consent was obtained from all subjects involved in the study.
Data Availability Statement
The data presented in this study are available on request from the corresponding author. The data are not publicly available due to ethical reasons.
Acknowledgments
J.R.-C was supported by postdoctoral contract from Consejería de Salud de la Junta de Andalucía, Spain (RH-0095-2020). LGS was supported by the Miguel Servet program from the ISCIII (Spain) (“Miguel Servet II” program, CPII18/00030) and Nicolas Monardes Program from Consejería de Salud de Andalucía (Spain) (C-0028-2018). EGF was supported by Nicolas Monardes Program from Consejería de Salud de Andalucía (Spain) (C-0031-2016). MM was supported by Miguel Servet I program (CP17/00133) and by PI19/00507 from ISCIII and co-funded by FEDER funds.
Conflicts of Interest
The authors declare that they have no conflict of interest.
References
- Bartolomucci, A.; Parmigiani, S.; Rodgers, R.J.; Vidal-Puig, A.; Allan, S.E.; Siegel, V. The Obese Species: A special issue on obesity and metabolic disorders. DMM Dis. Model Mech. 2012, 5, 563–564. [Google Scholar] [CrossRef] [PubMed]
- Bray, G.A.; Heisel, W.E.; Afshin, A.; Jensen, M.D.; Dietz, W.H.; Long, M.; Kushner, R.F.; Daniels, S.R.; Wadden, T.A.; Tsai, A.G.; et al. The science of obesity management: An endocrine society scientific statement. Endocrinol. Rev. 2018, 39, 79–132. [Google Scholar] [CrossRef] [PubMed]
- Ng, M.; Fleming, T.; Robinson, M.; Thomson, B.; Graetz, N.; Margono, C.; Mullany, E.C.; Biryukov, S.; Abbafati, C.; Abera, S.F.; et al. Global, regional, and national prevalence of overweight and obesity in children and adults during 1980-2013: A systematic analysis for the Global Burden of Disease Study 2013. Lancet 2014, 384, 766–781. [Google Scholar] [CrossRef]
- Nguyen, N.T.; Varela, J.E. Bariatric surgery for obesity and metabolic disorders: State of the art. Nat. Rev. Gastroenterol. Hepatol. 2017, 14, 160–169. [Google Scholar] [CrossRef] [PubMed]
- Choe, S.S.; Huh, J.Y.; Hwang, I.J.; Kim, J.I.; Kim, J.B. Adipose Tissue Remodeling: Its Role in Energy Metabolism and Metabolic Disorders. Front. Endocrinol. 2016, 7, 30. [Google Scholar] [CrossRef] [PubMed]
- Drolet, R.; Richard, C.; Sniderman, A.D.; Mailloux, J.; Fortier, M.; Huot, C.; Rhéaume, C.; Tchernof, A. Hypertrophy and hyperplasia of abdominal adipose tissues in wome. Int. J. Obes. 2008, 32, 283–291. [Google Scholar] [CrossRef]
- Bing, C.; Mracek, T.; Gao, D.; Trayhurn, P. Zinc-α2-glycoprotein: An adipokine modulator of body fat mass. Int. J. Obes. 2010, 34, 1559–1565. [Google Scholar] [CrossRef]
- Mracek, T.; Ding, Q.; Tzanavari, T.; Kos, K.; Pinkney, J.; Wilding, J.; Trayhurn, P.; Bing, C. The adipokine zinc-α2-glycoprotein (ZAG) is downregulated with fat mass expansion in obesity. Clin. Endocrinol. 2010, 72, 334–341. [Google Scholar] [CrossRef]
- Hocking, S.; Samocha-Bonet, D.; Milner, K.-L.; Greenfield, J.R.; Chisholm, D.J. Adiposity and Insulin Resistance in Humans: The Role of the Different Tissue and Cellular Lipid Depots. Endocrinol. Rev. 2013, 34, 463–500. [Google Scholar] [CrossRef]
- Balaz, M.; Vician, M.; Janakova, Z.; Kurdiova, T.; Surova, M.; Imrich, R.; Majercikova, Z.; Penesova, M.; Vlcek, A.; Kiss, A.; et al. Subcutaneous adipose tissue zinc-α2-glycoprotein is associated with adipose tissue and whole-body insulin sensitivity. Obesity 2014, 22, 1821–1829. [Google Scholar] [CrossRef]
- Wang, L.; Liu, M.; Ning, D.; Zhu, H.; Shan, G.; Wang, D.; Ping, B.; Yu, Y.; Yang, H.; Yan, K.; et al. Low Serum ZAG Levels Correlate With Determinants of the Metabolic Syndrome in Chinese Subjects. Front. Endocrinol. 2020, 11, 154. [Google Scholar] [CrossRef] [PubMed]
- Garrido-Sánchez, L.; García-Fuentes, E.; Fernández-García, D.; Escoté, X.; Alcaide, J.; Perez-Martinez, P.; Vendrell, J.; Tinahones, F.J. Zinc-alpha 2-glycoprotein gene expression in adipose tissue is related with insulin resistance and lipolytic genes in morbidly obese patients. PLoS ONE 2012, 7, e33264. [Google Scholar]
- Morse, K.M.; Astbury, N.M.; Walczyszyn, A.; Hashim, S.A.; Geliebter, A. Changes in zinc-α2-glycoprotein (ZAG) plasma concentrations pre and post Roux-En-Y gastric bypass surgery (RYGB) or a very low calorie (VLCD) diet in clinically severe obese patients: Preliminary Study. Integr. Obes. Diabetes 2017, 3, 1–4. [Google Scholar] [CrossRef] [PubMed][Green Version]
- Ergun, S.; Ergun, D.D.; Akinci, O.; Taskin, H.E.; Simsek, G.; Taskin, M.; Uzun, H. The role of laparoscopic sleeve gastrectomy on inflammatory parameters in morbidly obese patients. J. Visc. Surg. 2022, 159, 31–38. [Google Scholar] [CrossRef] [PubMed]
- Gong, F.-Y.; Zhang, S.-J.; Deng, J.-Y.; Zhu, H.-J.; Pan, H.; Li, N.-S.; Shi, Y.-F. Zinc-α2-glycoprotein is involved in regulation of body weight through inhibition of lipogenic enzymes in adipose tissue. Int. J. Obes. 2009, 33, 1023–1030. [Google Scholar] [CrossRef]
- Banaszak, M.; Górna, I.; Przysławski, J. Zinc and the innovative zinc-α2-glycoprotein adipokine play an important role in lipid metabolism: A critical review. Nutrients 2021, 13, 2023. [Google Scholar] [CrossRef]
- Liu, T.; Luo, X.; Li, Z.-H.; Wu, J.-C.; Luo, S.-Z.; Xu, M.-Y. Zinc-α2-glycoprotein 1 attenuates non-alcoholic fatty liver disease by negatively regulating tumour necrosis factor-α. World J. Gastroenterol. 2019, 25, 5451–5468. [Google Scholar] [CrossRef]
- Xiao, X.-H.; Wang, Y.-D.; Qi, X.-Y.; Wang, Y.-Y.; Li, J.-Y.; Li, H.; Zhang, P.-Y.; Liao, H.-L.; Li, M.-H.; Liao, Z.-Z.; et al. Zinc alpha2 glycoprotein protects against obesity-induced hepatic steatosis. Int. J. Obes. 2018, 42, 1418–1430. [Google Scholar] [CrossRef]
- Sörensen-Zender, I.; Beneke, J.; Schmidt, B.M.W.; Menne, J.; Haller, H.; Schmitt, R. Zinc-alpha2-glycoprotein in patients with acute and chronic kidney disease. BMC Nephrol. 2013, 14, 145. [Google Scholar] [CrossRef]
- Keshavjee, S.H.; Schwenger, K.J.P.; Yadav, J.; Jackson, T.D.; Okrainec, A.; Allard, J.P. Factors Affecting Metabolic Outcomes Post Bariatric Surgery: Role of Adipose Tissue. J. Clin. Med. 2021, 10, 714. [Google Scholar] [CrossRef]
- O’Rourke, R.W.; Johnson, G.S.; Purnell, J.Q.; Courcoulas, A.P.; Dakin, G.F.; Garcia, L.; Hinojosa, M.; Mitchell, J.E.; Pomp, A.; Pories, W.J.; et al. Serum biomarkers of inflammation and adiposity in the LABS cohort: Associations with metabolic disease and surgical outcomes. Int. J. Obes. 2019, 43, 285–296. [Google Scholar] [CrossRef] [PubMed]
- Duchnowski, P.; Hryniewiecki, T.; Kusmierczyk, M.; Szymanski, P. The usefulness of selected biomarkers in patients with valve disease. Biomark. Med. 2018, 12, 1341–1346. [Google Scholar] [CrossRef] [PubMed]
- Carbone, F.; Migliola, E.N.; Bonaventura, A.; Vecchié, A.; De Vuono, S.; Ricci, M.A.; Vaudo, G.; Boni, M.; Dallegri, F.; Montecucco, F.; et al. High serum levels of C-reactive protein (CRP) predict beneficial decrease of visceral fat in obese females after sleeve gastrectomy. Nutr. Metab. Cardiovasc. Dis. 2018, 28, 494–500. [Google Scholar] [CrossRef] [PubMed]
- Czupryniak, L.; Pawlowski, M.; Kumor, A.; Szymanski, D.; Loba, J.; Strzelczyk, J. Predicting Maximum Roux-en-Y Gastric Bypass-Induced Weight Reduction—Preoperative Plasma Leptin or Body Weight? Obes. Surg. 2007, 17, 162–167. [Google Scholar] [CrossRef]
- Herder, C.; Peltonen, M.; Svensson, P.-A.; Carstensen, M.; Jacobson, P.; Roden, M.; Carlsson, L.; Sjöström, L. Adiponectin and Bariatric Surgery: Associations With Diabetes and Cardiovascular Disease in the Swedish Obese Subjects Study. Diabetes Care 2014, 37, 1401–1409. [Google Scholar] [CrossRef]
- Divoux, A.; Tordjman, J.; Lacasa, D.; Veyrie, N.; Hugol, D.; Aissat, A.; Guerro-Milo, M.; Poitou, C.; Zucker, J.-L.; Clément, K.; et al. Fibrosis in Human Adipose Tissue: Composition, Distribution, and Link With Lipid Metabolism and Fat Mass Loss. Diabetes 2010, 59, 2817–2825. [Google Scholar] [CrossRef]
- Dixon, J.; Bhathal, P.; O’Brien, P. Weight Loss and Non-alcoholic Fatty Liver Disease: Falls In Gamma-Glutamyl Transferase Concentrations are Associated with Histologic Improvement. Obes. Surg. 2006, 16, 1278–1286. [Google Scholar] [CrossRef]
- Newton, K.P.; Lavine, J.E.; Wilson, L.; Behling, C.; Vos, M.B.; Molleston, J.P.; Rosenthal, P.; Miloh, T.; Fishbein, M.H.; Jain, A.K.; et al. Alanine Aminotransferase and Gamma-Glutamyl Transpeptidase Predict Histologic Improvement in Pediatric Nonalcoholic Steatohepatitis. Hepatology 2021, 73, 937–951. [Google Scholar] [CrossRef]
- Escoté, X.; Aranda, G.; Mora, M.; Casals, G.; Enseñat, J.; Vidal, O.; Esteban, Y.; Halperin, I.; Hanzu, F.A. Zinc alpha-2 glycoprotein is overproduced in Cushing’s syndrome. Endocrinol. Diabetes Nutr. 2017, 64, 26–33. [Google Scholar] [CrossRef]
- Hassan, I.; Waheed, A.; Yadav, S.; Singh, T.P.; Ahmad, F. Zinc A2-Glycoprotein: A Multidisciplinary Protein Md. Mol. Cancer Res. 2008, 6, 892–906. [Google Scholar] [CrossRef]
Publisher’s Note: MDPI stays neutral with regard to jurisdictional claims in published maps and institutional affiliations. |
© 2022 by the authors. Licensee MDPI, Basel, Switzerland. This article is an open access article distributed under the terms and conditions of the Creative Commons Attribution (CC BY) license (https://creativecommons.org/licenses/by/4.0/).