
Increases of Phosphorylated Tau (Ser202/Thr205) in the Olfactory Regions Are Associated with Impaired EEG and Olfactory Behavior in Traumatic Brain Injury Mice

 , , , and
Abstract
:1. Introduction
2. Materials and Methods
2.1. Mice
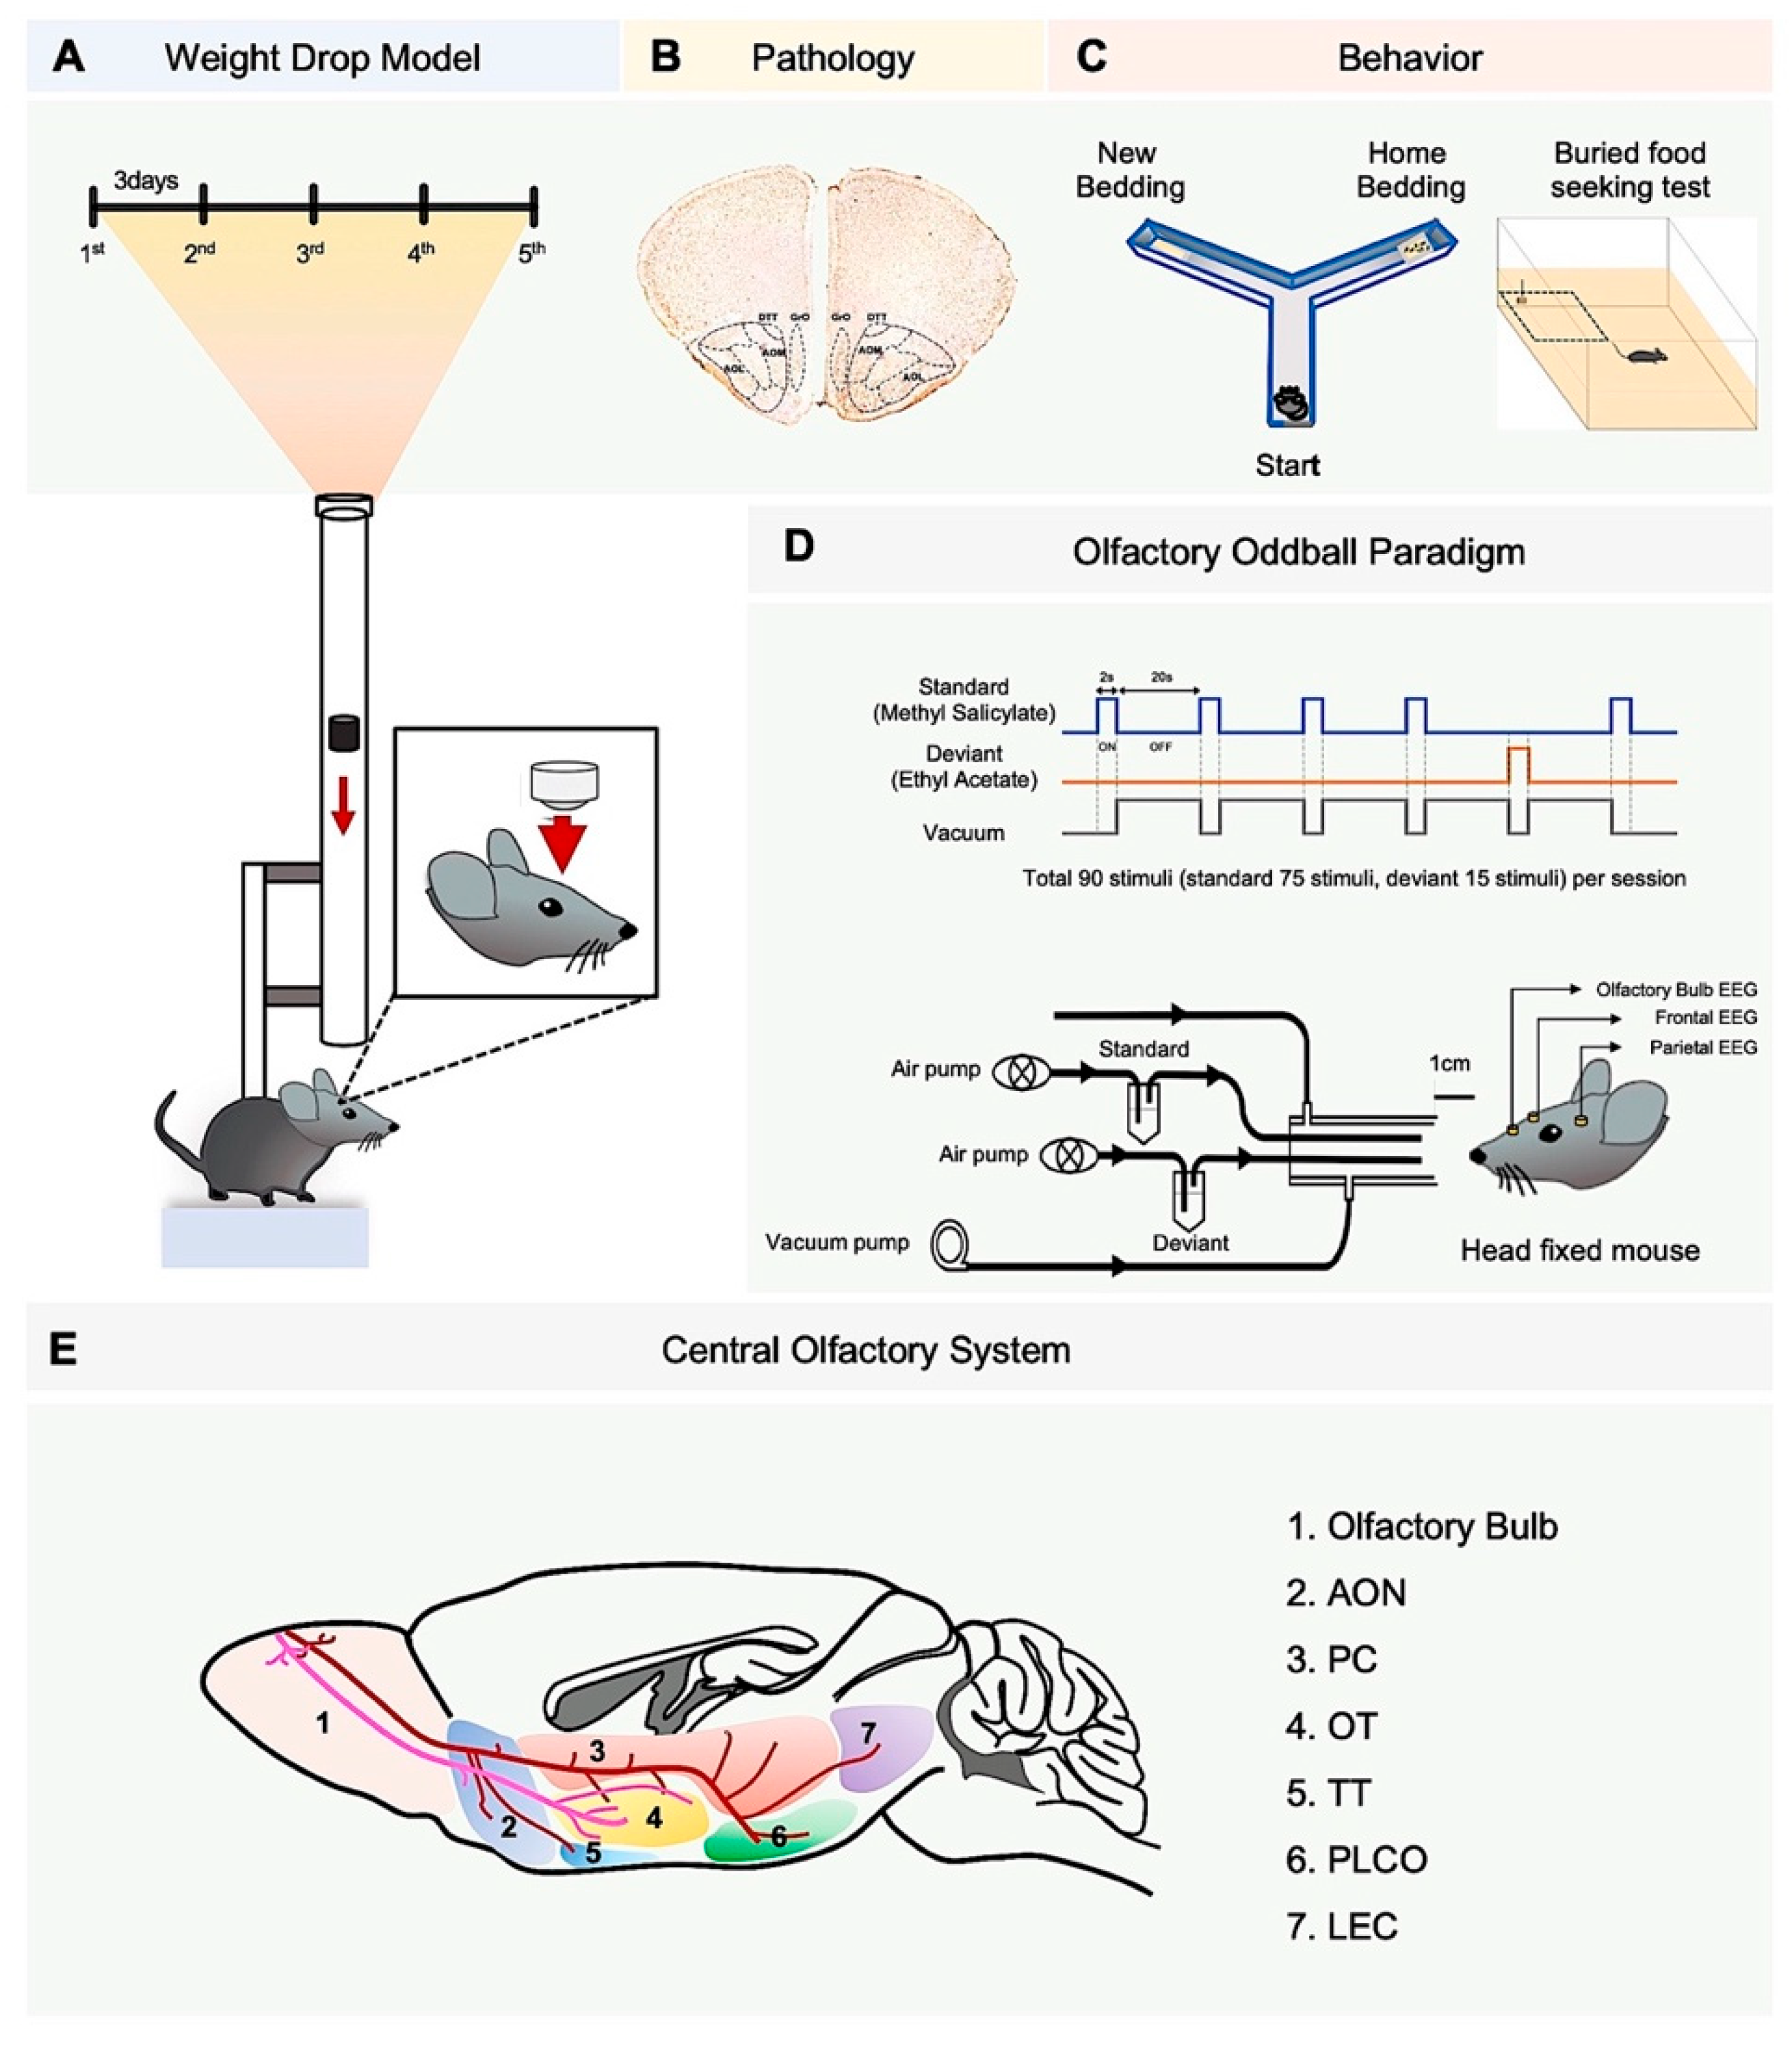
2.2. TBI Model
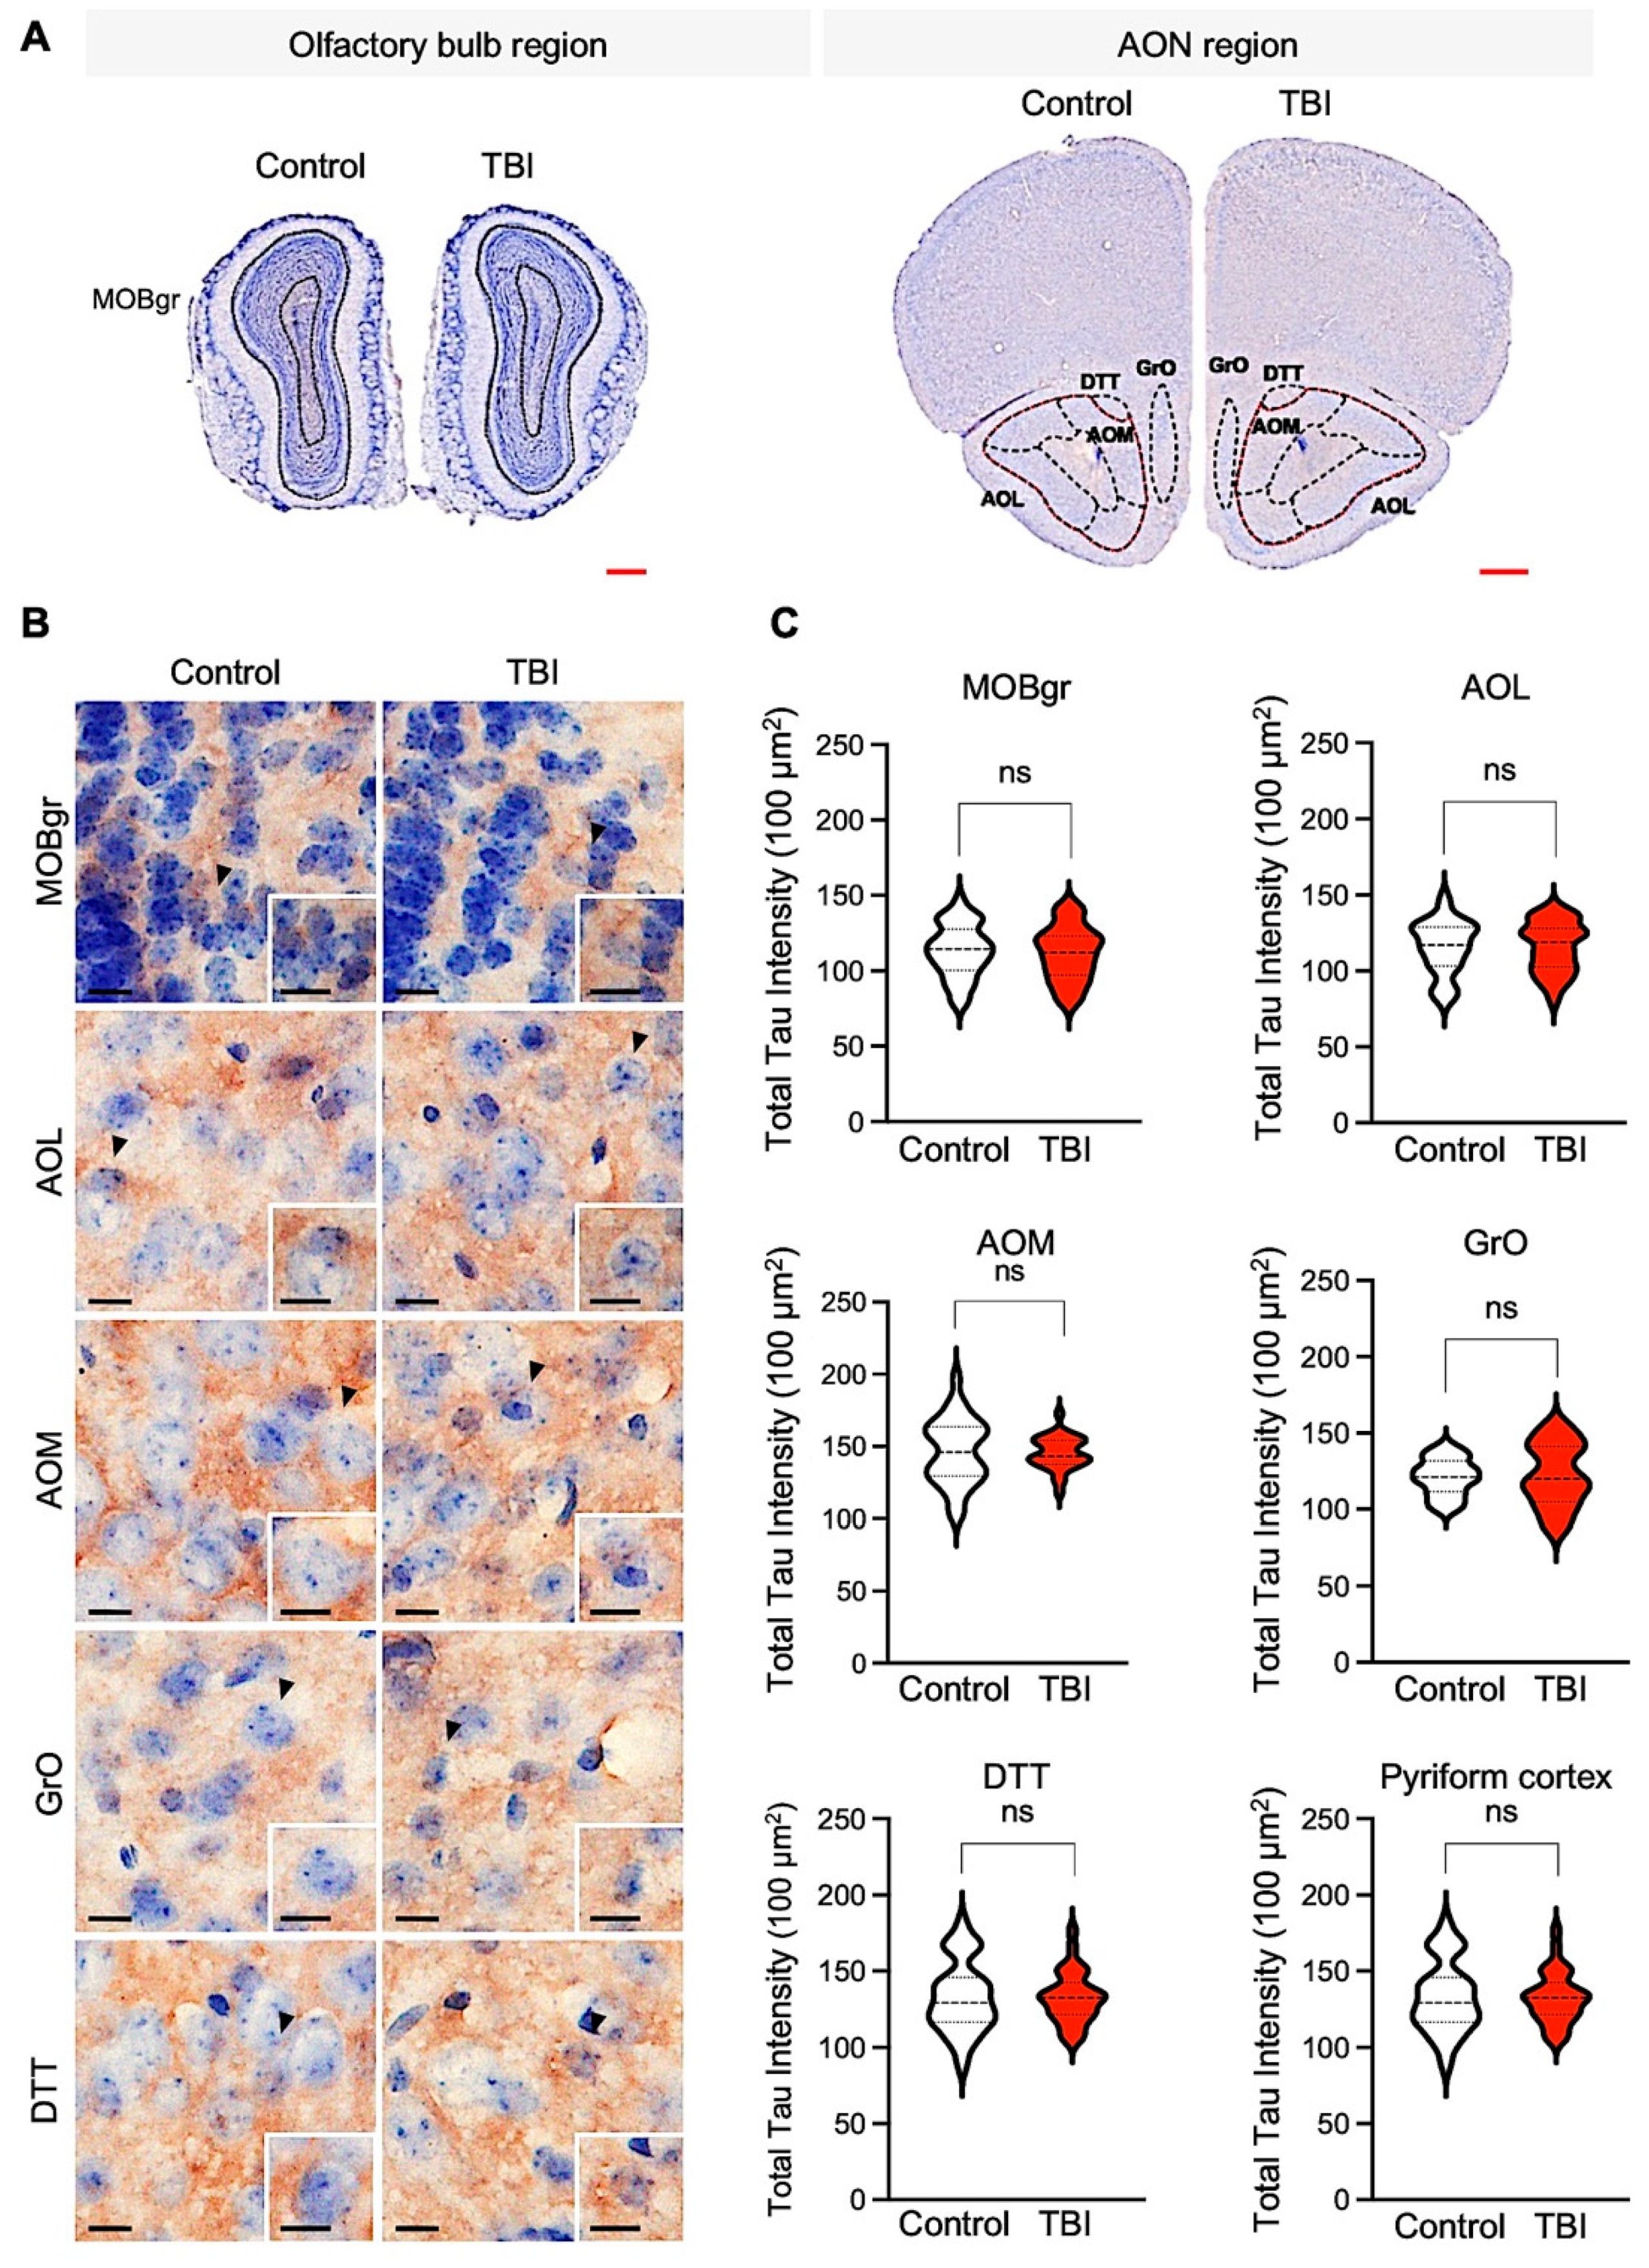
2.3. Immunohistochemistry
2.4. Cresyl Violet (CV) Staining
2.5. Electrode Implantation
2.6. LFP (Local Field Potential) Recording
2.7. Olfactory Oddball Paradigm
2.8. LFP Analysis
2.9. Olfactory Function-Associated Behavior Tests
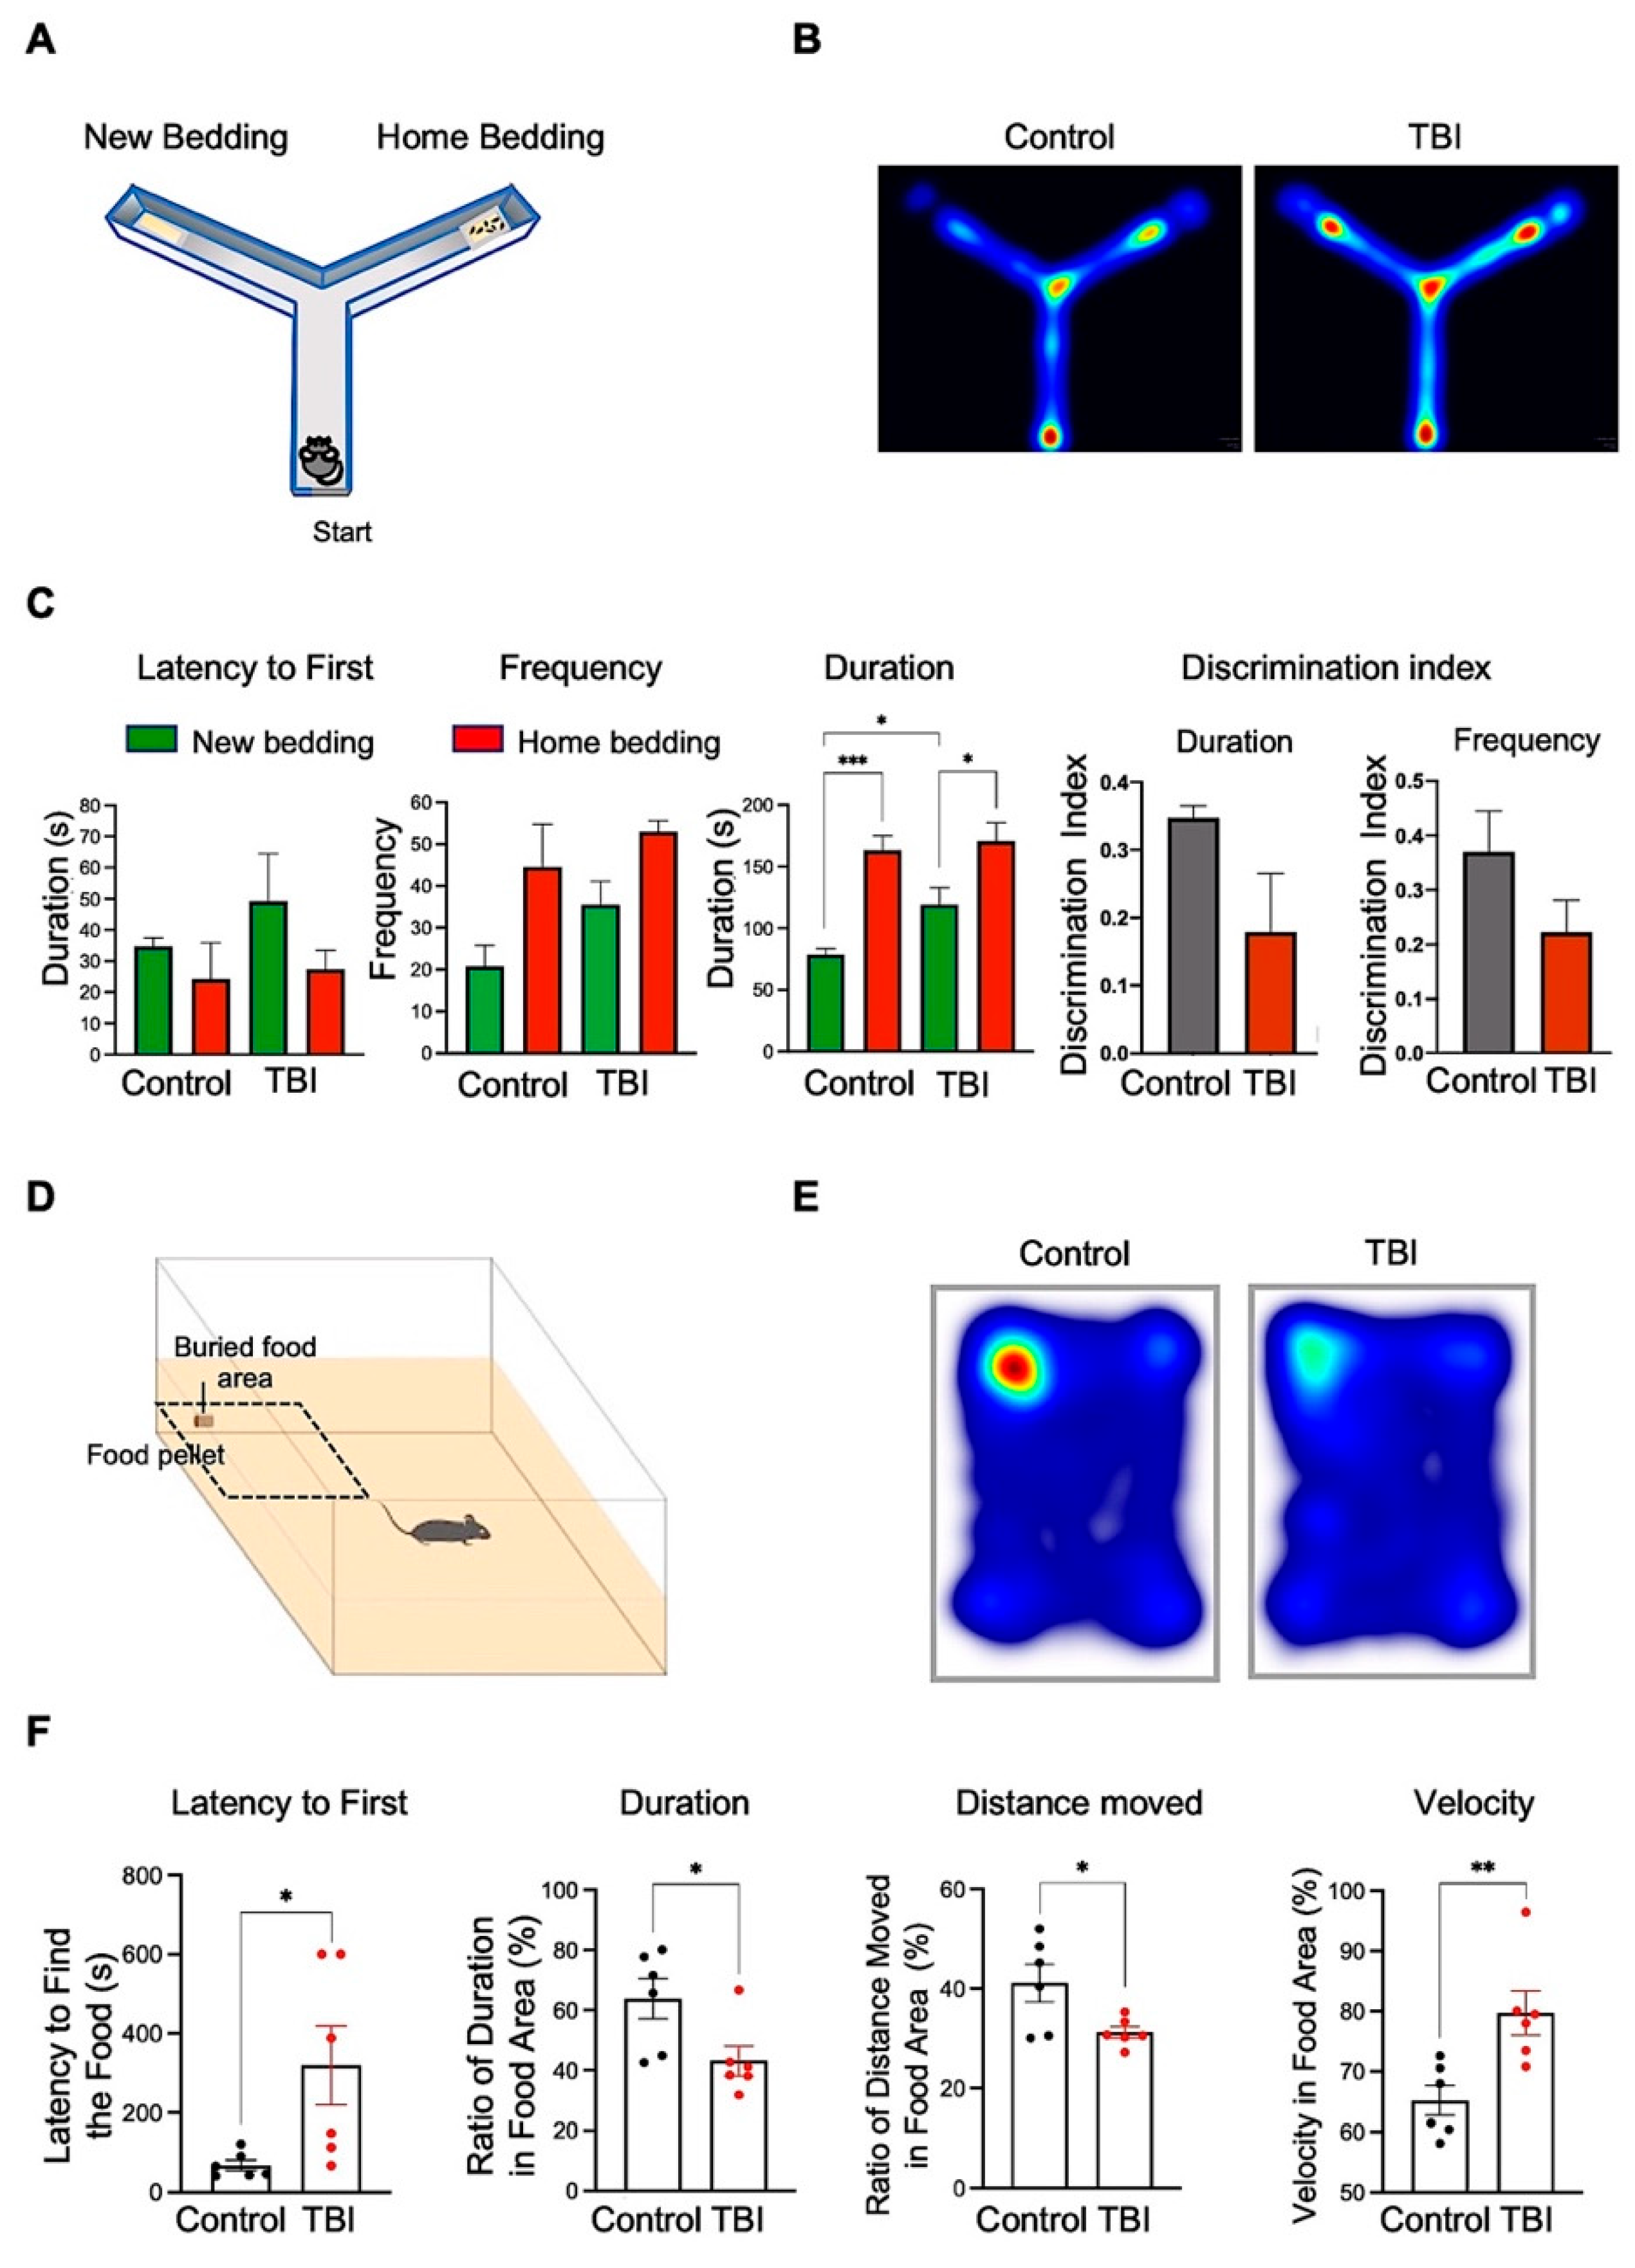
2.9.1. Y-Maze Test
2.9.2. Buried-Food-Seeking Test
2.10. Statistical Analysis
3. Results
3.1. Repetitive TBI Elevates Amyloid Precursor Protein (APP) Immunoreactivity in the Olfactory-Bulb-Associated Areas
3.2. p-Tau Level and Neuronal Cell Size Are Inversely Correlated in Repetitive TBI
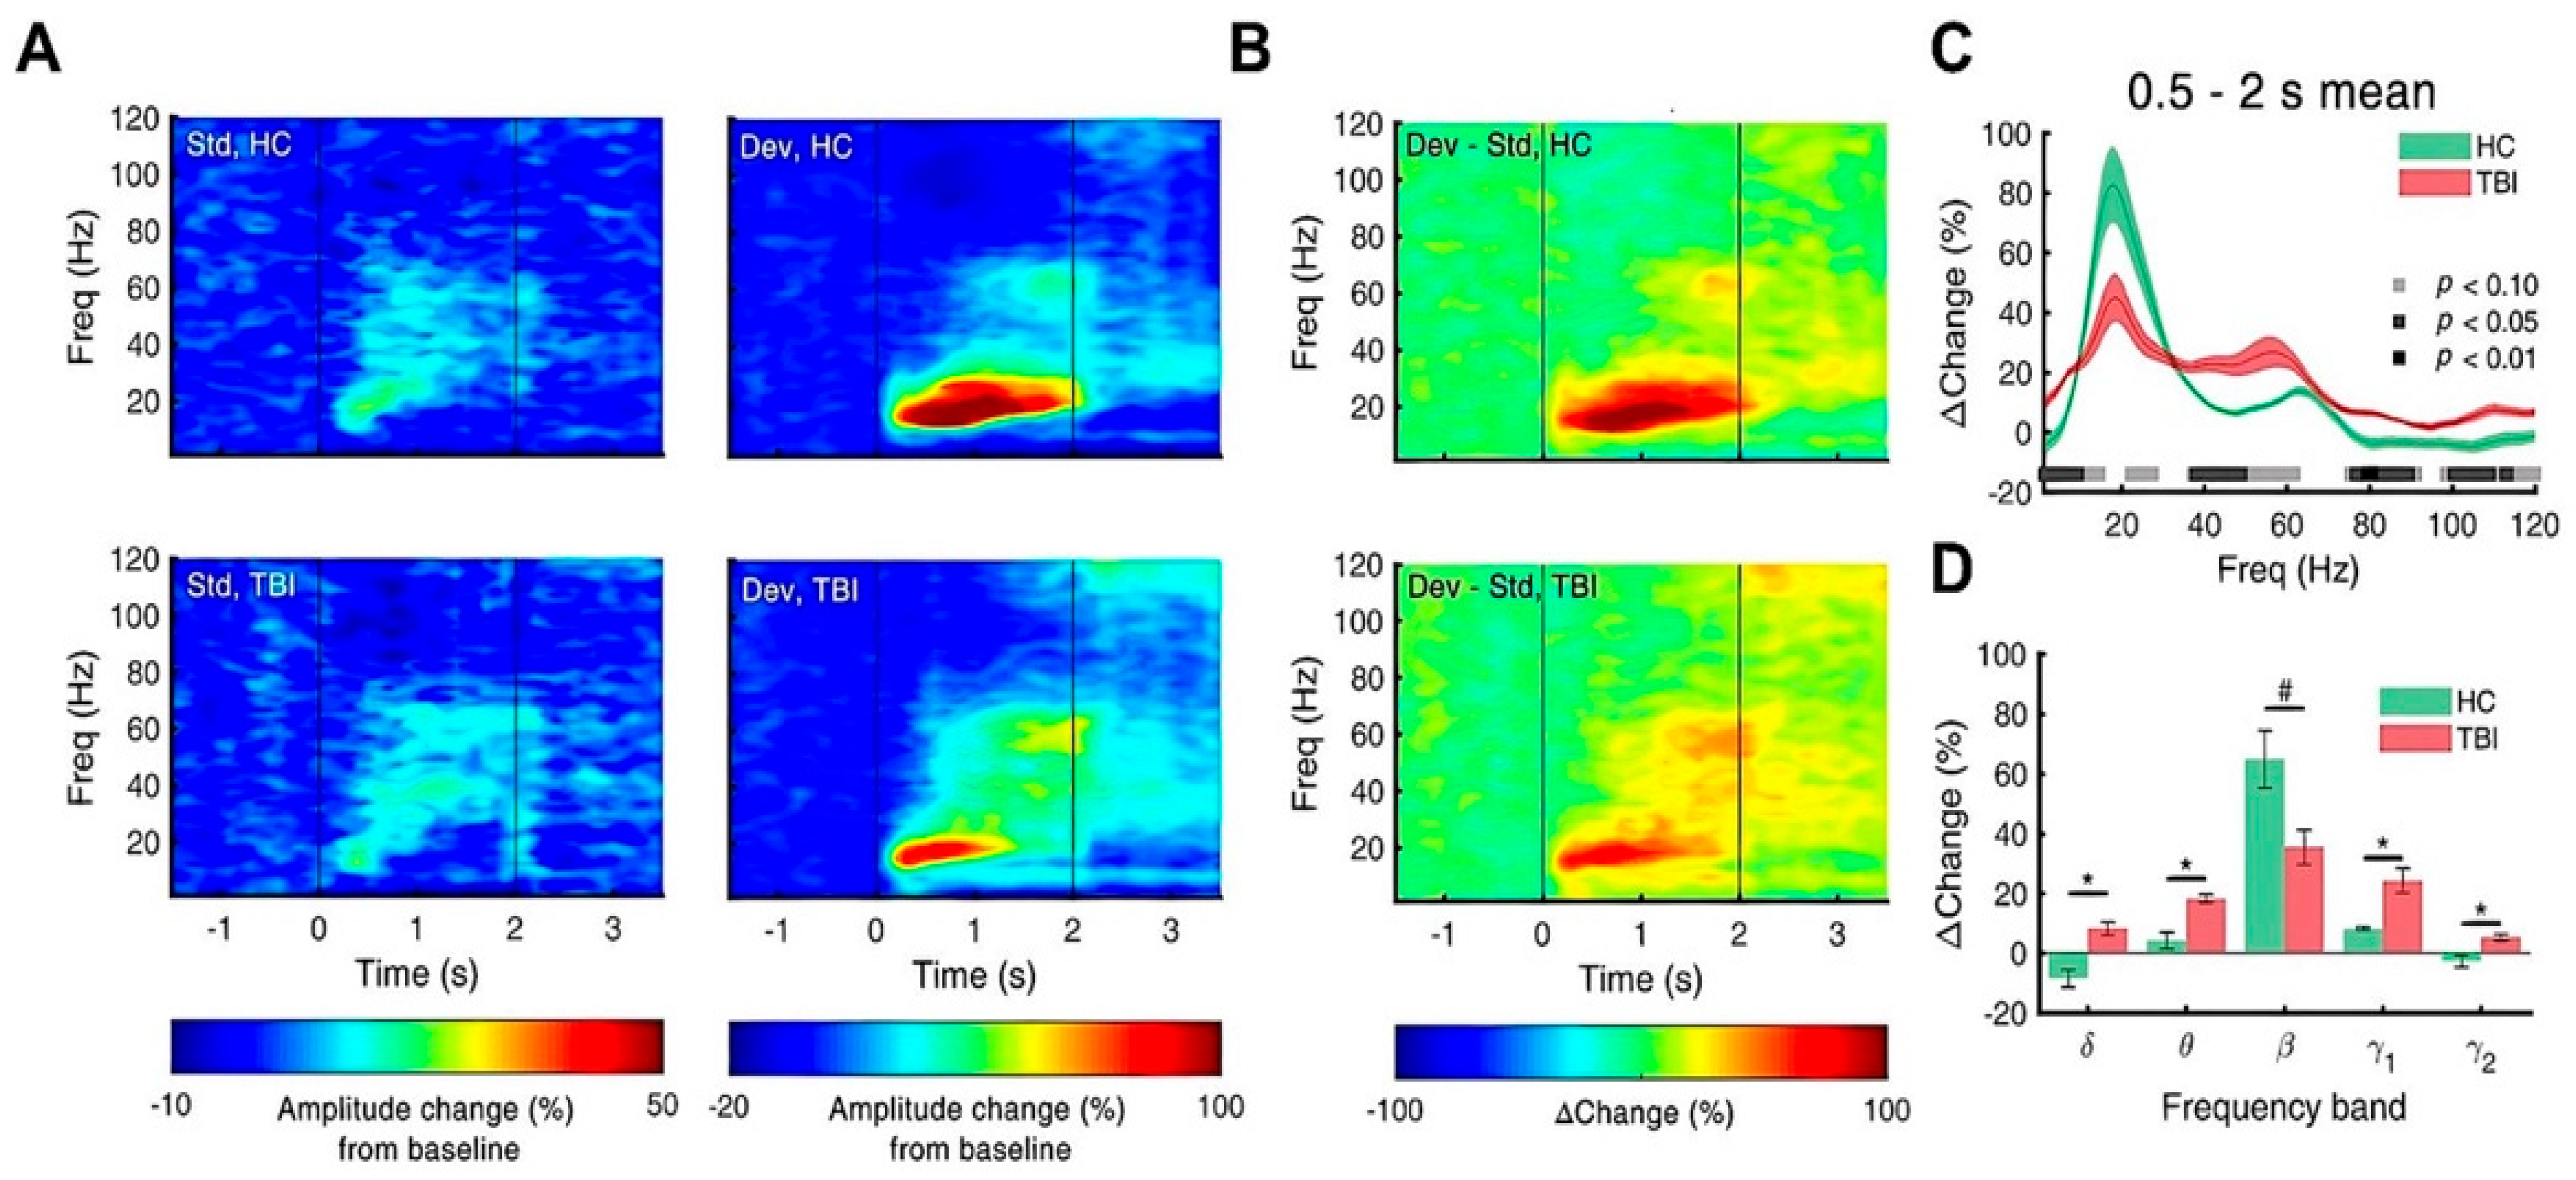
3.3. Repetitive TBI Alters Spectral Power of Slow Oscillations of Olfactory Bulb
3.4. Repetitive TBI Attenuates Response to Deviants
3.5. Repetitive TBI Mice Exhibit Decline of the Olfactory Function-Associated Behaviors
4. Discussion
5. Conclusions
Supplementary Materials
Author Contributions
Funding
Institutional Review Board Statement
Informed Consent Statement
Data Availability Statement
Acknowledgments
Conflicts of Interest
References
- Faul, M.; Coronado, V. Epidemiology of Traumatic Brain Injury. Handb. Clin. Neurol. 2015, 127, 3–13. [Google Scholar] [CrossRef] [PubMed]
- Kaur, P.; Sharma, S. Recent Advances in Pathophysiology of Traumatic Brain Injury. Curr. Neuropharmacol. 2018, 16, 1224–1238. [Google Scholar] [CrossRef] [PubMed]
- Najem, D.; Rennie, K.; Ribecco-Lutkiewicz, M.; Ly, D.; Haukenfrers, J.; Liu, Q.; Nzau, M.; Fraser, D.D.; Bani-Yaghoub, M. Traumatic brain injury: Classification, models, and markers. Biochem. Cell Biol. 2018, 96, 391–406. [Google Scholar] [CrossRef] [PubMed]
- Gudziol, V.; Hoenck, I.; Landis, B.; Podlesek, D.; Bayn, M.; Hummel, T. The impact and prospect of traumatic brain injury on olfactory function: A cross-sectional and prospective study. Eur. Arch. Oto-Rhino-Laryngol. 2013, 271, 1533–1540. [Google Scholar] [CrossRef] [PubMed]
- Callahan, C.D.; Hinkebein, J.H. Assessment of Anosmia after Traumatic Brain Injury: Performance Characteristics of the University of Pennsylvania Smell Identification Test. J. Head Trauma Rehabil. 2002, 17, 251–256. [Google Scholar] [CrossRef] [PubMed]
- Steuer, E.; Schaefer, M.L.; Belluscio, L. Using the Olfactory System as an In Vivo Model To Study Traumatic Brain Injury and Repair. J. Neurotrauma 2014, 31, 1277–1291. [Google Scholar] [CrossRef] [PubMed] [Green Version]
- Ng, S.Y.; Lee, A.Y.W. Traumatic Brain Injuries: Pathophysiology and Potential Therapeutic Targets. Front. Cell. Neurosci. 2019, 13, 528. [Google Scholar] [CrossRef]
- Petraglia, A.L.; Plog, B.A.; Dayawansa, S.; Chen, M.; Dashnaw, M.L.; Czerniecka, K.; Walker, C.T.; Viterise, T.; Hyrien, O.; Iliff, J.J.; et al. The Spectrum of Neurobehavioral Sequelae after Repetitive Mild Traumatic Brain Injury: A Novel Mouse Model of Chronic Traumatic Encephalopathy. J. Neurotrauma 2014, 31, 1211–1224. [Google Scholar] [CrossRef] [Green Version]
- Schneider, T.; Przewłocki, R. Behavioral Alterations in Rats Prenatally Exposed to Valproic Acid: Animal Model of Autism. Neuropsychopharmacology 2004, 30, 80–89. [Google Scholar] [CrossRef]
- Fullard, M.E.; Morley, J.F.; Duda, J.E. Olfactory Dysfunction as an Early Biomarker in Parkinson’s Disease. Neurosci. Bull. 2017, 33, 515–525. [Google Scholar] [CrossRef]
- Alosco, M.L.; Jarnagin, J.; Tripodis, Y.; Platt, M.; Martin, B.; Chaisson, C.E.; Baugh, C.M.; Fritts, N.G.; Cantu, R.C.; Stern, R.A. Olfactory Function and Associated Clinical Correlates in Former National Football League Players. J. Neurotrauma 2017, 34, 772–780. [Google Scholar] [CrossRef] [PubMed] [Green Version]
- Broussard, J.; Acion, L.; De Jesús-Cortés, H.; Yin, T.; Britt, J.K.; Salas, R.; Costa-Mattioli, M.; Robertson, C.; Pieper, A.A.; Arciniegas, D.B.; et al. Repeated mild traumatic brain injury produces neuroinflammation, anxiety-like behaviour and impaired spatial memory in mice. Brain Inj. 2018, 32, 113–122. [Google Scholar] [CrossRef] [PubMed]
- Creeley, C.E.; Wozniak, D.F.; Bayly, P.V.; Olney, J.W.; Lewis, L.M. Multiple Episodes of Mild Traumatic Brain Injury Result in Impaired Cognitive Performance in Mice. Acad. Emerg. Med. 2004, 11, 809–819. [Google Scholar] [CrossRef] [PubMed]
- Hayes, J.P.; Logue, M.W.; Sadeh, N.; Spielberg, J.M.; Verfaellie, M.; Hayes, S.M.; Reagan, A.; Salat, D.H.; Wolf, E.J.; McGlinchey, R.E.; et al. Mild traumatic brain injury is associated with reduced cortical thickness in those at risk for Alzheimer’s disease. Brain 2017, 140, 813–825. [Google Scholar] [CrossRef] [PubMed] [Green Version]
- Mouzon, B.C.; Bachmeier, C.; Ferro, A.; Ojo, J.-O.; Crynen, G.; Acker, C.M.; Davies, P.; Mullan, M.; Stewart, W.; Crawford, F. Chronic neuropathological and neurobehavioral changes in a repetitive mild traumatic brain injury model. Ann. Neurol. 2014, 75, 241–254. [Google Scholar] [CrossRef] [PubMed]
- Xu, L.; Nguyen, J.V.; Lehar, M.; Menon, A.; Rha, E.; Arena, J.; Ryu, J.; Marsh-Armstrong, N.; Marmarou, C.R.; Koliatsos, V.E. Repetitive mild traumatic brain injury with impact acceleration in the mouse: Multifocal axonopathy, neuroinflammation, and neurodegeneration in the visual system. Exp. Neurol. 2016, 275 Pt 3, 436–449. [Google Scholar] [CrossRef]
- Richter, S.; Winzeck, S.; Kornaropoulos, E.N.; Das, T.; Vyvere, T.V.; Verheyden, J.; Williams, G.B.; Correia, M.M.; Menon, D.K.; Newcombe, V.F.J.; et al. Neuroanatomical Substrates and Symptoms Associated With Magnetic Resonance Imaging of Patients With Mild Traumatic Brain Injury. JAMA Netw. Open 2021, 4, e210994. [Google Scholar] [CrossRef]
- Lehmkuhl, A.M.; Dirr, E.R.; Fleming, S.M. Olfactory Assays for Mouse Models of Neurodegenerative Disease. J. Vis. Exp. 2014, e51804, e51804. [Google Scholar] [CrossRef] [Green Version]
- Yang, M.; Crawley, J.N. Simple Behavioral Assessment of Mouse Olfaction. Curr. Protoc. Neurosci. 2009, 48, 8.24.1–8.24.12. [Google Scholar] [CrossRef]
- Kum, J.; Kim, J.W.; Braubach, O.; Ha, J.-G.; Cho, H.-J.; Kim, C.-H.; Han, H.-B.; Choi, J.H.; Yoon, J.-H. Neural Dynamics of Olfactory Perception: Low- and High-Frequency Modulations of Local Field Potential Spectra in Mice Revealed by an Oddball Stimulus. Front. Neurosci. 2019, 13, 478. [Google Scholar] [CrossRef] [Green Version]
- Mychasiuk, R.; Farran, A.; Angoa-Perez, M.; Briggs, D.; Kuhn, D.; Esser, M.J. A Novel Model of Mild Traumatic Brain Injury for Juvenile Rats. J. Vis. Exp. 2014, e51820. [Google Scholar] [CrossRef] [PubMed] [Green Version]
- Seo, J.-S.; Lee, S.; Shin, J.-Y.; Hwang, Y.J.; Cho, H.; Yoo, S.-K.; Kim, Y.; Lim, S.; Kim, Y.K.; Hwang, E.M.; et al. Transcriptome analyses of chronic traumatic encephalopathy show alterations in protein phosphatase expression associated with tauopathy. Exp. Mol. Med. 2017, 49, e333. [Google Scholar] [CrossRef] [PubMed]
- Lee, J.; Hwang, Y.J.; Kim, Y.; Lee, M.Y.; Hyeon, S.J.; Lee, S.; Kim, D.H.; Jang, S.; Im, H.; Min, S.-J.; et al. Remodeling of heterochromatin structure slows neuropathological progression and prolongs survival in an animal model of Huntington’s disease. Acta Neuropathol. 2017, 134, 729–748. [Google Scholar] [CrossRef]
- Tort, A.B.L.; Komorowski, R.; Eichenbaum, H.; Kopell, N. Measuring Phase-Amplitude Coupling Between Neuronal Oscillations of Different Frequencies. J. Neurophysiol. 2010, 104, 1195–1210. [Google Scholar] [CrossRef] [PubMed]
- Vanderwolf, C.; Zibrowski, E.M. Pyriform cortex beta-waves: Odor-specific sensitization following repeated olfactory stimulation. Brain Res. 2001, 892, 301–308. [Google Scholar] [CrossRef]
- Uryu, K.; Chen, X.-H.; Martinez, D.; Browne, K.D.; Johnson, V.E.; Graham, D.I.; Lee, V.M.-Y.; Trojanowski, J.Q.; Smith, D.H. Multiple proteins implicated in neurodegenerative diseases accumulate in axons after brain trauma in humans. Exp. Neurol. 2007, 208, 185–192. [Google Scholar] [CrossRef] [Green Version]
- Ikonomovic, M.D.; Uryu, K.; Abrahamson, E.E.; Ciallella, J.R.; Trojanowski, J.Q.; Lee, V.M.-Y.; Clark, R.S.; Marion, D.W.; Wisniewski, S.; DeKosky, S.T. Alzheimer’s pathology in human temporal cortex surgically excised after severe brain injury. Exp. Neurol. 2004, 190, 192–203. [Google Scholar] [CrossRef]
- Rubenstein, R.; Chang, B.; Yue, J.K.; Chiu, A.; Winkler, E.A.; Puccio, A.M.; Diaz-Arrastia, R.; Yuh, E.L.; Mukherjee, P.; Valadka, A.B.; et al. Comparing Plasma Phospho Tau, Total Tau, and Phospho Tau–Total Tau Ratio as Acute and Chronic Traumatic Brain Injury Biomarkers. JAMA Neurol. 2017, 74, 1063–1072. [Google Scholar] [CrossRef]
- Hampel, H.; Blennow, K.; Shaw, L.M.; Hoessler, Y.C.; Zetterberg, H.; Trojanowski, J.Q. Total and phosphorylated tau protein as biological markers of Alzheimer’s disease. Exp. Gerontol. 2010, 45, 30–40. [Google Scholar] [CrossRef] [Green Version]
- Canolty, R.T.; Knight, R.T. The functional role of cross-frequency coupling. Trends Cogn. Sci. 2010, 14, 506–515. [Google Scholar] [CrossRef] [Green Version]
- Johnson, V.E.; Stewart, W.; Arena, J.D.; Smith, D.H. Traumatic Brain Injury as a Trigger of Neurodegeneration. Adv. Neurobiol. 2017, 15, 383–400. [Google Scholar] [CrossRef]
- Ahmedy, F.; Mazlan, M.; Danaee, M.; Abu Bakar, M.Z. Post-traumatic brain injury olfactory dysfunction: Factors influencing quality of life. Eur. Arch. Oto-Rhino-Laryngol. 2020, 277, 1343–1351. [Google Scholar] [CrossRef] [PubMed]
- Giguère, F.L.; Frasnelli, A.; De Guise, É.; Frasnelli, J. Olfactory, cognitive and affective dysfunction assessed 24 hours and one year after a mild Traumatic Brain Injury (mTBI). Brain Inj. 2019, 33, 1184–1193. [Google Scholar] [CrossRef] [PubMed]
- Xiong, Y.; Mahmood, A.; Chopp, M. Animal models of traumatic brain injury. Nat. Rev. Neurosci. 2013, 14, 128–142. [Google Scholar] [CrossRef] [PubMed] [Green Version]
- Berkner, J.; Mannix, R.; Qiu, J. Clinical Traumatic Brain Injury in the Preclinical Setting. In Injury Models of the Central Nervous System; Methods and Protocols; Kobeissy, F.H., Dixon, C.E., Hayes, R.L., Mondello, S., Eds.; Springer: New York, NY, USA, 2016; pp. 11–28. [Google Scholar]
- DeKosky, S.; Ikonomovic, M.D.; Gandy, S. Traumatic Brain Injury—Football, Warfare, and Long-Term Effects. N. Engl. J. Med. 2010, 363, 1293–1296. [Google Scholar] [CrossRef]
- Jordan, B.D. The clinical spectrum of sport-related traumatic brain injury. Nat. Rev. Neurol. 2013, 9, 222–230. [Google Scholar] [CrossRef]
- Ciofalo, A.; De Vincentiis, M.; Iannella, G.; Zambetti, G.; Giacomello, P.; Altissimi, G.; Greco, A.; Fusconi, M.; Pasquariello, B.; Magliulo, G. Mild traumatic brain injury: Evaluation of olfactory dysfunction and clinical-neurological characteristics. Brain Inj. 2018, 32, 550–556. [Google Scholar] [CrossRef]
- Tran, H.T.; Sanchez, L.; Brody, D.L. Inhibition of JNK by a Peptide Inhibitor Reduces Traumatic Brain Injury–Induced Tauopathy in Transgenic Mice. J. Neuropathol. Exp. Neurol. 2012, 71, 116–129. [Google Scholar] [CrossRef] [Green Version]
- Rubenstein, R.; Sharma, D.R.; Chang, B.; Oumata, N.; Cam, M.; Vaucelle, L.; Lindberg, M.F.; Chiu, A.; Wisniewski, T.; Wang, K.K.W.; et al. Novel Mouse Tauopathy Model for Repetitive Mild Traumatic Brain Injury: Evaluation of Long-Term Effects on Cognition and Biomarker Levels After Therapeutic Inhibition of Tau Phosphorylation. Front. Neurol. 2019, 10, 124. [Google Scholar] [CrossRef] [Green Version]
- Small, C.; Dagra, A.; Martinez, M.; Williams, E.; Lucke-Wold, B. Examining the role of astrogliosis and JNK signaling in post-traumatic epilepsy. Egypt. J. Neurosurg. 2022, 37, 1. [Google Scholar] [CrossRef]
- Jones, S.V.; Heldt, S.A.; Davis, M.; Ressler, K.J. Olfactory-Mediated Fear Conditioning in Mice: Simultaneous Measurements of Fear-Potentiated Startle and Freezing. Behav. Neurosci. 2005, 119, 329–335. [Google Scholar] [CrossRef] [PubMed] [Green Version]
- Otto, T.; Cousens, G.; Herzog, C. Behavioral and neuropsychological foundations of olfactory fear conditioning. Behav. Brain Res. 2000, 110, 119–128. [Google Scholar] [CrossRef]
- Raji, C.A.; Tarzwell, R.; Pavel, D.; Schneider, H.; Uszler, M.; Thornton, J.; Van Lierop, M.; Cohen, P.; Amen, D.G.; Henderson, T. Clinical Utility of SPECT Neuroimaging in the Diagnosis and Treatment of Traumatic Brain Injury: A Systematic Review. PLoS ONE 2014, 9, e91088. [Google Scholar] [CrossRef]
- Kocsis, B.; Pittman-Polletta, B.R.; Roy, A. Respiration-coupled rhythms in prefrontal cortex: Beyond if, to when, how, and why. Anat. Embryol. 2018, 223, 11–16. [Google Scholar] [CrossRef] [Green Version]
- Lockmann, A.L.V.; Tort, A.B.L. Nasal respiration entrains delta-frequency oscillations in the prefrontal cortex and hippocampus of rodents. Anat. Embryol. 2018, 223, 1–3. [Google Scholar] [CrossRef]
- Lockmann, A.L.V.; Laplagne, D.A.; Leão, R.N.; Tort, A.B.L. A Respiration-Coupled Rhythm in the Rat Hippocampus Independent of Theta and Slow Oscillations. J. Neurosci. 2016, 36, 5338–5352. [Google Scholar] [CrossRef] [Green Version]
- Fries, P. A mechanism for cognitive dynamics: Neuronal communication through neuronal coherence. Trends Cogn. Sci. 2005, 9, 474–480. [Google Scholar] [CrossRef]
- Lisman, J.; Buzsaki, G. A Neural Coding Scheme Formed by the Combined Function of Gamma and Theta Oscillations. Schizophr. Bull. 2008, 34, 974–980. [Google Scholar] [CrossRef] [Green Version]
- Antonakakis, M.; Dimitriadis, S.I.; Zervakis, M.; Micheloyannis, S.; Rezaie, R.; Babajani-Feremi, A.; Zouridakis, G.; Papanicolaou, A.C. Altered cross-frequency coupling in resting-state MEG after mild traumatic brain injury. Int. J. Psychophysiol. 2016, 102, 1–11. [Google Scholar] [CrossRef] [Green Version]
- Biskamp, J.; Bartos, M.; Sauer, J.-F. Organization of prefrontal network activity by respiration-related oscillations. Sci. Rep. 2017, 7, srep45508. [Google Scholar] [CrossRef] [Green Version]
- Zhong, W.; Ciatipis, M.; Wolfenstetter, T.; Jessberger, J.; Müller, C.; Ponsel, S.; Yanovsky, Y.; Brankačk, J.; Tort, A.B.L.; Draguhn, A. Selective entrainment of gamma subbands by different slow network oscillations. Proc. Natl. Acad. Sci. USA 2017, 114, 4519–4524. [Google Scholar] [CrossRef] [PubMed] [Green Version]
- Baba, T.; Takeda, A.; Kikuchi, A.; Nishio, Y.; Hosokai, Y.; Hirayama, K.; Hasegawa, T.; Sugeno, N.; Suzuki, K.; Mori, E.; et al. Association of olfactory dysfunction and brain. Metabolism in Parkinson’s disease. Mov. Disord. 2011, 26, 621–628. [Google Scholar] [CrossRef] [PubMed]
- Zibrowski, E.M.; E Hoh, T.; Vanderwolf, C.H. Fast wave activity in the rat rhinencephalon: Elicitation by the odors of phytochemicals, organic solvents, and a rodent predator. Brain Res. 1998, 800, 207–215. [Google Scholar] [CrossRef]
- Vanderwolf, C.; Zibrowski, E.; Wakarchuk, D. The ability of various chemicals to elicit olfactory beta-waves in the pyriform cortex of meadow voles (Microtus pennsylvanicus) and laboratory rats (Rattus norvegicus). Brain Res. 2001, 924, 151–158. [Google Scholar] [CrossRef]
- DeKosky, S.T.; Asken, B.M. Injury cascades in TBI-related neurodegeneration. Brain Inj. 2017, 31, 1177–1182. [Google Scholar] [CrossRef] [Green Version]


| EEG Parameters | Frequency Bands | Frontal Cortex | Parietal Cortex | Olfactory Bulb | |||||||||
|---|---|---|---|---|---|---|---|---|---|---|---|---|---|
| Control (N = 4) | TBI (N = 10) | t-Stat (df = 15) | p-Value | Control (N = 4) | TBI (N = 10) | t-Stat (df = 15) | p-Value | Control (N = 4) | TBI (N = 10) | t-Stat (df = 15) | p-Value | ||
| Amplitude (μV) | Delta | 15.21 (1.99) | 14.66 (2.33) | 0.52 | 0.3056 | 12.99 (2.73) | 13.85 (2.23) | −0.72 | 0.2425 | 23.30 (6.79) | 17.52 (4.99) | 2.02 | 0.0309 |
| Theta | 16.40 (2.20) | 15.81 (2.04) | 0.57 | 0.2898 | 15.49 (3.05) | 16.05 (3.85) | −0.33 | 0.3718 | 17.91 (3.46) | 15.77 (3.17) | 1.33 | 0.1013 | |
| Beta | 5.11 (0.80) | 4.70 (0.51) | 1.28 | 0.1100 | 4.80 (0.74) | 4.77 (0.80) | 0.07 | 0.4708 | 5.12 (1.04) | 4.37 (0.37) | 2.05 | 0.0293 | |
| Low Gamma | 2.59 (0.44) | 2.39 (0.24) | 1.17 | 0.1311 | 2.50 (0.44) | 2.47 (0.24) | 0.21 | 0.4191 | 2.88 (0.56) | 2.73 (0.35) | 0.69 | 0.2492 | |
| High Gamma | 1.52 (0.36) | 1.48 (0.23) | 0.26 | 0.4004 | 1.44 (0.39) | 1.48 (0.19) | −0.27 | 0.3957 | 1.99 (0.44) | 1.97 (0.29) | 0.11 | 0.4586 | |
| Coupling to delta phase (×104) | Beta | 0.54 (0.35) | 0.96 (0.54) | −1.89 | 0.0388 | 1.50 (0.67) | 1.71 (0.62) | −0.69 | 0.2500 | 5.68 (4.32) | 1.71 (0.65) | 2.73 | 0.0077 |
| Low Gamma | 0.49 (0.38) | 0.86 (0.43) | −1.88 | 0.0396 | 0.89 (0.74) | 1.10 (0.35) | −0.76 | 0.2284 | 4.73 (2.83) | 2.53 (1.42) | 2.05 | 0.0289 | |
| High Gamma | 0.72 (0.53) | 1.23 (0.55) | −1.94 | 0.0360 | 0.61 (0.46) | 1.36 (0.86) | −2.18 | 0.0227 | 7.22 (6.18) | 7.11 (8.86) | 0.03 | 0.4884 | |
| EEG Parameters | Frequency Bands | Frontal Cortex | Parietal Cortex | Olfactory Bulb | |||||||||
|---|---|---|---|---|---|---|---|---|---|---|---|---|---|
| Control (N = 4) | TBI (N = 10) | t-Stat (df = 15) | p-Value | Control (N = 4) | TBI (N = 10) | t-Stat (df = 15) | p-Value | Control (N = 4) | TBI (N = 10) | t-Stat (df = 15) | p-Value | ||
| Amplitude Difference (%) | Delta | −1.62 (9.99) | 1.60 (15.87) | −0.49 | 0.3146 | −15.94 (3.90) | −10.13 (11.15) | −1.40 | 0.0915 | −7.38 (17.07) | 9.49 (12.22) | −2.36 | 0.0160 |
| Theta | −4.26 (4.96) | 2.70 (8.17) | −2.09 | 0.0272 | −8.55 (2.41) | −1.48 (7.39) | −2.58 | 0.0105 | 7.69 (13.26) | 20.43 (6.56) | −2.56 | 0.0109 | |
| Beta | 2.95 (7.65) | 7.75 (12.05) | −0.96 | 0.1751 | 3.04 (11.60) | 8.70 (13.43) | −0.92 | 0.1851 | 64.85 (54.11) | 35.49 (34.52) | 1.34 | 0.0985 | |
| Low Gamma | 6.10 (3.06) | 10.49 (3.87) | −2.57 | 0.0106 | 6.63 (4.12) | 11.09 (5.75) | −1.81 | 0.0448 | 8.19 (3.54) | 24.44 (24.92) | −1.82 | 0.0443 | |
| High Gamma | 13.10 (8.50) | 15.81 (10.49) | −0.58 | 0.2855 | 7.05 (6.64) | 14.33 (7.68) | −2.08 | 0.0277 | −3.43 (11.23) | 4.84 (7.29) | −1.82 | 0.0441 | |
Publisher’s Note: MDPI stays neutral with regard to jurisdictional claims in published maps and institutional affiliations. |
© 2022 by the authors. Licensee MDPI, Basel, Switzerland. This article is an open access article distributed under the terms and conditions of the Creative Commons Attribution (CC BY) license (https://creativecommons.org/licenses/by/4.0/).
Share and Cite
Yoon, Y.; Kim, S.; Seol, Y.; Im, H.; Park, U.; Han, H.-B.; Choi, J.H.; Ryu, H. Increases of Phosphorylated Tau (Ser202/Thr205) in the Olfactory Regions Are Associated with Impaired EEG and Olfactory Behavior in Traumatic Brain Injury Mice. Biomedicines 2022, 10, 865. https://doi.org/10.3390/biomedicines10040865
Yoon Y, Kim S, Seol Y, Im H, Park U, Han H-B, Choi JH, Ryu H. Increases of Phosphorylated Tau (Ser202/Thr205) in the Olfactory Regions Are Associated with Impaired EEG and Olfactory Behavior in Traumatic Brain Injury Mice. Biomedicines. 2022; 10(4):865. https://doi.org/10.3390/biomedicines10040865
Chicago/Turabian StyleYoon, Younghyun, SuHyun Kim, YunHee Seol, Hyoenjoo Im, Uiyeol Park, Hio-Been Han, Jee Hyun Choi, and Hoon Ryu. 2022. "Increases of Phosphorylated Tau (Ser202/Thr205) in the Olfactory Regions Are Associated with Impaired EEG and Olfactory Behavior in Traumatic Brain Injury Mice" Biomedicines 10, no. 4: 865. https://doi.org/10.3390/biomedicines10040865
APA StyleYoon, Y., Kim, S., Seol, Y., Im, H., Park, U., Han, H.-B., Choi, J. H., & Ryu, H. (2022). Increases of Phosphorylated Tau (Ser202/Thr205) in the Olfactory Regions Are Associated with Impaired EEG and Olfactory Behavior in Traumatic Brain Injury Mice. Biomedicines, 10(4), 865. https://doi.org/10.3390/biomedicines10040865