Article

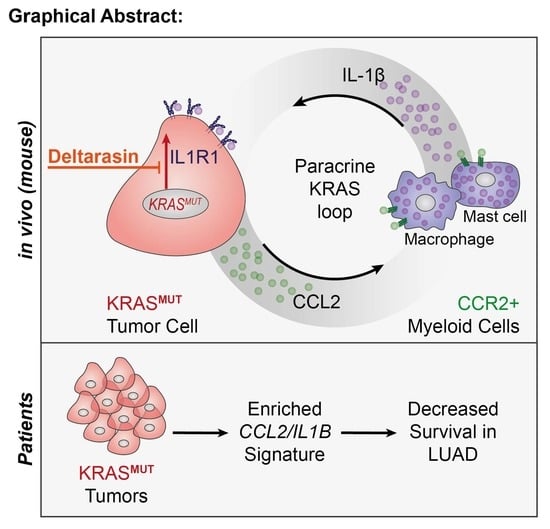
An In Vivo Inflammatory Loop Potentiates KRAS Blockade

by
Kristina A. M. Arendt
1,2,†,
Giannoula Ntaliarda
3,†,
Vasileios Armenis
3,
Danai Kati
3,
Christin Henning
1,2,
Georgia A. Giotopoulou
1,2,3,
Mario A. A. Pepe
1,2,
Laura V. Klotz
1,2,
Anne-Sophie Lamort
1,2,
Rudolf A. Hatz
2,4,5,
Sebastian Kobold
2,6,
Andrea C. Schamberger
1,2,*,‡ and
Georgios T. Stathopoulos
1,2,3,*,‡
1
Comprehensive Pneumology Center (CPC), Institute of Lung Health and Immunity (LHI), Helmholtz Zentrum München, 81377 Munich, Germany
2
Member of the German Center for Lung Research (DZL), 35392 Gießen, Germany
3
Laboratory for Molecular Respiratory Carcinogenesis, Department of Physiology, Faculty of Medicine, University of Patras, 26504 Rio, Greece
4
Center for Thoracic Surgery, University Hospital, Ludwig-Maximilians-Universität (LMU), 81377 Munich, Germany
5
Asklepios Medical Center, 82131 Gauting, Germany
6
Center of Integrated Protein Science Munich (CIPS-M), Division of Clinical Pharmacology, Department of Medicine IV, Klinikum der Universität München, Lindwurmstraße 2a, 80337 Munich, Germany
*
Authors to whom correspondence should be addressed.
These authors contributed equally to this work.
Biomedicines 2022, 10(3), 592; https://doi.org/10.3390/biomedicines10030592
Submission received: 28 January 2022 / Revised: 24 February 2022 / Accepted: 25 February 2022 / Published: 3 March 2022
(This article belongs to the Special Issue Resistance to Targeted Therapies in Human Cancer)

Abstract

:
KRAS (KRAS proto-oncogene, GTPase) inhibitors perform less well than other targeted drugs in vitro and fail clinical trials. To investigate a possible reason for this, we treated human and murine tumor cells with KRAS inhibitors deltarasin (targeting phosphodiesterase-δ), cysmethynil (targeting isoprenylcysteine carboxylmethyltransferase), and AA12 (targeting KRASG12C), and silenced/overexpressed mutant KRAS using custom-designed vectors. We showed that KRAS-mutant tumor cells exclusively respond to KRAS blockade in vivo, because the oncogene co-opts host myeloid cells via a C-C-motif chemokine ligand 2 (CCL2)/interleukin-1 beta (IL-1β)-mediated signaling loop for sustained tumorigenicity. Indeed, KRAS-mutant tumors did not respond to deltarasin in C-C motif chemokine receptor 2 (Ccr2) and Il1b gene-deficient mice, but were deltarasin-sensitive in wild-type and Ccr2-deficient mice adoptively transplanted with wild-type murine bone marrow. A KRAS-dependent pro-inflammatory transcriptome was prominent in human cancers with high KRAS mutation prevalence and poor predicted survival. Our findings support that in vitro cellular systems are suboptimal for anti-KRAS drug screens, as these drugs function to suppress interleukin-1 receptor 1 (IL1R1) expression and myeloid IL-1β-delivered pro-growth effects in vivo. Moreover, the findings support that IL-1β blockade might be suitable for therapy for KRAS-mutant cancers.

Graphical Abstract

1. Introduction

Since its discovery, the Kirsten rat sarcoma virus (KRAS) proto-oncogene GTPase (encoded by the human KRAS and the murine Kras genes) has become the holy grail of anticancer therapy [1,2]. The KRAS oncoprotein possesses a unique molecular structure that potentiates it as a driver of multiple cancer cell hallmarks (including proliferation, migration, metastasis, angiogenesis, inflammation, and apoptosis evasion), but also renders it non-actionable due to the absence of a druggable deep pocket [2,3]. KRAS point mutations that constitutively activate GTPase function occur most frequently in codons 12, 13, and 61, and are particularly frequent in pancreatic (70%), colorectal (35%), and lung (20%) adenocarcinomas [3,4]. However, full KRAS GTPase activity and downstream signaling additionally prerequires its integration into the cell membrane, which is facilitated by the post-translational lipidation and membrane transport of KRAS by various enzymes, such as farnesyltransferase (FT), geranylgeranytransferase (GGT), isoprenylcysteine carboxyl methyltransferase (ICMT), phosphodiesterase-δ (PDEδ), and others [3,5]. To this end, therapeutic attempts to inhibit KRAS lipidation by targeting FT/GGT/ICMT were recently coupled with the development of PDEδ blockers and of allosteric and covalent inhibitors of mutated KRASG12C [6,7,8,9].
Despite coordinated efforts [1], anti-KRAS drug discovery lags behind other oncogene targets [3], and only one single KRASG12C inhibitor (sotorasib) was recently approved by the FDA for non-small-cell lung cancer (NSCLC) [10,11]. In addition to molecular structural considerations [5], the mode of KRAS oncogenic functions could be a reason for this. To this end, Janes and collaborators recently reported a discordance between the in vitro and the in vivo effects of a newly developed covalent KRASG12C inhibitor [9]. This observation is relevant to other reports describing how KRAS-dependence is linked to signatures of intravital-restricted processes such as inflammation and epithelial-to-mesenchymal transition [12,13,14] and how pro-inflammatory properties of KRAS mutations potentiate malignant pleural effusions in mice [15,16].
Here, we hypothesized that KRAS effects and druggability are preferentially at play in vivo. We tested the efficacy of three different KRAS inhibitors with divergent modes of action in vitro and in vivo using a battery of 30 natural and transduced human and murine cancer cell lines and four different methods to integrally assess tumor cell growth. We consistently show that KRAS inhibitors exerted ubiquitous in vitro effects irrespective of cellular KRAS mutation status, but were specifically effective against KRAS-mutant tumors in vivo. Using transcriptome analyses of cell lines expressing endogenous or exogenous wild-type or mutant Kras alleles, Ccr2 (C-C motif chemokine receptor 2) and Il1b (interleukin-1 beta, IL-1β) gene-deficient mice, as well as adoptive bone marrow transfer, we show that mutant KRAS established a proinflammatory CCL2 (C-C motif chemokine ligand 2)/IL-1β-mediated signaling loop to host myeloid cells in vivo, which is required for KRAS-mediated tumorigenicity and, importantly, for specific KRAS inhibitor efficacy. The KRAS/CCL2/IL1B transcript signature was further shown to be enriched in human tumors with higher KRAS mutation frequencies and to portend poor survival. Our data show that intact inflammatory tumor-to-host interactions were required for full KRAS inhibitor efficacy and imply that in vitro drug screens might not be optimal for KRAS inhibitor discovery.

2. Materials and Methods

2.1. Cell Culture

NCI-H358, NCI-H358M, NCI-H460, NCI-H520, NCI-H1299, NCI-H1944, NCI-H3122 (referred to hereafter omitting NCI), EKVX, A549, LLC, B16F10, and PANO2 cell lines were obtained from the National Cancer Institute (Frederick, MD, USA); MC38 cells were a gift from Dr. Timothy S. Blackwell (Vanderbilt University; Nashville, TN, USA) and AE17 cells from Dr. YC Gary Lee (University of Western Australia, Perth, Australia) [15,16,17]. FULA1 (FVB urethane-induced lung adenocarcinoma 1) and CULA (C57BL/6 urethane-induced lung adenocarcinoma) cell lines were isolated from the lungs of FVB and C57BL/6 mice, respectively, harboring primary lung adenocarcinomas induced by urethane [15,18,19]. Human and murine cell lines were cultured in Roswell Park Memorial Institute (RPMI)-1640 and Dulbecco’s Modified Eagle Medium (DMEM), respectively, both supplemented with 10% FBS and 100 IU/mL penicillin/streptomycin, and were maintained in a humidified incubator at 37 °C with 95% air/ 5% CO2. Cell lines were authenticated annually using the short tandem repeat method and were tested negative for Mycoplasma spp. biannually with the MycoAlert Mycoplasma Detection Kit (LONZA; Verviers, Belgium).

2.2. Drugs

Deltarasin (CAS #1440898-82-7; Tocris Bio-Techne #5424; Wiesbaden-Nordenstadt, Germany), KRASG12C inhibitor 12 (AA12; CAS #1469337-95-8; Selleckchem #S7331; Houston, TX, USA), and cysmethynil (CAS #851636-83-4; Cayman Chemicals #14745; Ann Arbor, MI, USA) were dissolved in dimethylsulfoxide (DMSO) until 10 mM stock concentration and stored at −80 °C. For in vitro and in vivo experiments, drugs were further diluted in saline. Equimolar DMSO solutions were used as controls.

2.3. Cellular Assays

In vitro cell proliferation was determined using the water soluble tetrazolium-1 [2-(4-iodophenyl)-3-(4-nitrophenyl)-5-(2,4-disulphophenyl)-2H-teterazolium; WST-8] assay (Bimake; Munich, Germany). For this, 3000 cells/well were plated in triplicates in 96-well plates in 5% FBS-containing media and allowed to adhere overnight, followed by treatment with different drug concentrations. WST-8 reagent was added 72 h later according to the manufacturer’s protocol and absorbance at 450 nm was measured 1–4 h later on a TECAN Sunrise microplate reader (Männedorf, Switzerland). For the colony formation assay, 300 cells were plated in triplicates in 6-well plates in 5% FBS-containing media and were treated 24 h later with 1–2 µM deltarasin; media were replaced with drug-free media 72 h later, and cells were incubated until ≤ 50 colonies formed. Colonies were fixed with 80% ethanol, stained with 0.5% crystal violet, counted and photographed. All cellular experiments were independently repeated at least twice.

2.4. Western Immunoblotting

Cellular protein lysates were prepared using Radio-Immunoprecipitation Assay (RIPA) buffer containing phosphatase/protease inhibitor cocktail (Thermo Fisher; Waltham, MA, USA), separated via SDS-PAGE, and transferred to nitrocellulose membranes according to standard protocols. Anti-total (t)-extracellular-signal regulated kinase (ERK), anti-phospho (p)-ERK, and anti-glyceraldehyde 3-phosphate dehydrogenase (GAPDH) antibodies were obtained from Santa Cruz Biotechnology (Houston, TX, USA) (Supplementary Table S1).

2.5. Constructs

Short-hairpin (sh) RNA-mediated Kras-silenced (shKras) LLC, AE17, and MC38 cells, as well as B16F10 and PANO2 cells overexpressing custom-made plasmid encoding KrasG12C (pKrasG12C; Addgene #64372; GFP-KrasG12C_2B_puro), were produced as described elsewhere [15]. H3122 and EKVX cells were stably transfected with pKrasG12C or its homologous GFP backbone plasmid without KrasG12C (pC; Addgene #64336; Bicistronic_GFP_ires_puro) using previously established methods (Supplementary Figure S5) [15]. All plasmids were produced in-house, deposited, validated, and re-purchased from Addgene (Watertown, MA, USA). Lentiviral shRNA targeting murine C-C motif chemokine ligand 2 (Ccl2) was purchased from Santa Cruz Biotechnology (random control shRNA sc-108080-V, GFP control shRNA sc-108084-V, murine shCcl2 sc-43914-SH). For stable shRNA and plasmid transfection, 105 tumor cells in 6-well culture vessels were transfected with 5 μg DNA using XFect (Takara; Kusatsu, Japan) and clones were selected with puromycin (2–10 μg/mL).

2.6. Mice

FVB/NJ (FVB; #001800), C57BL/6J (C57BL/6; #000664), B6.129P2-Cxcr1tm1Dgen/J (Cxcr1−/−, C-X-C motif chemokine receptor 1; #005820) [17], B6.129S4-Ccr2tm1Ifc/J (Ccr2−/−, C-C motif chemokine receptor 2; #004999) [16], B6.129S2(C)-Cxcr2tm1Mwm/J (Cxcr2+/−, C-X-C motif chemokine receptor 2; #006848) [17], and B6(Cg)-Rag2tm1.1Cgn/J (Rag2−/−, recombination activating gene 2; #008449) mice were obtained from Jackson Laboratory (Bar Harbor, ME, USA) and Il1btm1Yiw mice (Il1b−/−, interleukin-1 beta; MGI #2157396) [20] were a kind gift from Dr. Yoichiro Iwakura (Tokyo University of Sciences; Tokyo, Japan). All mice were bred at the Center for Animal Models of Disease of the University of Patras (Patras, Greece). Ccr2−/− mice were back-crossed to the FVB strain for > F12. Experimental mice were weight- (20–30 g), sex-, and age- (6–12 weeks) matched; both female and male mice were used and 284 mice were enrolled in total. In more detail, 25 FVB (21 for tumor experiments and 4 as bone marrow donors), 151 C57BL/6 (all for tumor experiments), 15 Cxcr1−/− (all on the C57BL/6 background for tumor experiments), 34 Ccr2−/− (12 on the C57BL/6 and 18 on the FVB backgrounds for tumor experiments and 4 on the FVB background as bone marrow donors), 12 Cxcr2+/− (all on the C57BL/6 background for tumor experiments), 32 Rag2−/− (all on the C57BL/6 background for tumor experiments), and 15 Il1b−/− (all on the C57BL/6 background for tumor experiments) mice were used.

2.7. In Vivo Tumor Models and Drug Treatments

For in vivo injections, 106 cells suspended in 50 µL PBS were implanted subcutaneously (sc) in the rear flank. Tumor dimensions (length, L; width, W; depth, D) were monitored serially using calipers and tumor volume (V) was calculated as   V = π L W D / 6 . Drug treatments were initiated when tumors reached 100 mm3 volume and consisted of daily intraperitoneal (ip) deltarasin (15 mg/Kg in 100 μL saline 1% DMSO) or 100 μL saline 1% DMSO. Animals were monitored daily for sickness and were euthanized using CO2 when in distress or when tumors reached 2–3 cm3 volume, whichever came first.

2.8. Microarrays, PCR, GSEA, and Kaplan-Meier Analyses

Isogenic cell line doublets stably expressing shC or shKras (LLC, MC38, and AE17 cells) and pC or pKrasG12C (PANO2 and B16F10 cells) were generated as described elsewhere [15]. Benign samples including whole murine lungs, tracheal epithelial cells (TEC; cultured out from murine tracheas), and bone marrow-derived macrophages (BMDM; cultured from murine bone marrow via weekly incubation with 20 ng/mL M-CSF (macrophage colony-stimulating factor)) and mast cells (BMMC; cultured from murine bone marrow via monthly incubation with 100 ng/mL IL-3 plus KITL (kit ligand) were prepared as described elsewhere [16,19,20]. Cellular RNA was isolated using Trizol (Thermo Fisher), followed by RNAeasy column purification and genomic DNA removal (Qiagen; Hilden, Germany). For each analysis, 1 μg RNA was reverse-transcribed using oligo(dT)18 and the iScript Advanced cDNA synthesis kit for RT-qPCR (Bio-Rad Laboratories; Hercules, CA, USA). Il1r1/IL1R1 (interleukin-1 receptor 1) and Gapdh/GAPDH qPCR was performed using specific primers (Supplementary Table S2) and Lightcycler 480 Sybr Green I Master Mix (Roche Diagnostics; Mannheim, Germany) in a Lightcycler 480 II (Roche Diagnostics). Ct values from triplicate reactions were analyzed using the 2−ΔCT method as detailed elsewhere [17]. mRNA abundance was determined relative to Gapdh/GAPDH and is given as 2−ΔCT = 2−(Ct of Il1r1/IL1R1)−(Ct of Gapdh/GAPDH). Mouse microarrays were obtained as described elsewhere [15,16,17]. Briefly, triplicate cultures of 106 cells were subjected to RNA extraction as above, 5 μg of pooled total RNA were tested for RNA quality on an ABI2000 Bioanalyzer (Agilent; Santa Clara, CA, USA), labelled, and hybridized to GeneChip Mouse Gene 2.0 ST arrays (Affymetrix; Santa Clara, CA, USA). Analyses using Affymetrix Expression/Transcriptome Analysis Consoles consisted of normalization of all arrays together using a Lowess multi-array algorithm, intensity-dependent estimation of noise for statistical analysis of differential expression, and unsupervised hierarchical clustering of microarray data and WikiPathway analysis. Murine microarray data are publicly available at the Gene Expression Omnibus (GEO) database (http://www.ncbi.nlm.nih.gov/geo/; Accession ID: GSE58190; last accessed: 4 March 2019). Gene set enrichment analyses (GSEA) were performed using publicly available Human Gene 1.0 ST microarray data obtained from GEO. The following datasets were used: GSE31852, with gene expression profiles of 121 biopsies from patients with lung adenocarcinoma (LUAD) with EGFR (epidermal growth factor receptor) (n = 17), KRAS (n = 21), or neither of the two (n = 83) mutations (Biomarker-integrated Approaches of Targeted Therapy for Lung Cancer Elimination (BATTLE) trial); GSE43458, with gene expression profiles of LUAD from smokers and never-smokers (n = 40 each), as well as normal lung tissue from never-smokers (n = 30), also from the BATTLE trial; and GSE103512, with gene expression profiles of breast (n = 65), colorectal (n = 55), and non-small-cell lung (n = 60) cancer patients from a Roche dataset. Kaplan-Meier analyses were performed using KM-plotter (http://www.kmplot.com; last accessed: 15 October 2021) [21]. All patients were included and overall survival and all stages/grades were set as parameters.

2.9. ELISA

Murine and human CCL2 levels of cell culture supernatants were detected using appropriate ELISA kits (Peprotech; London, UK). For sample preparation, cells were incubated with IC60 deltarasin for 72 h before collection of cell-free supernatants for CCL2 measurements and whole cellular lysates for normalization of CCL2 levels to total cellular protein.

2.10. Immunofluorescence

Paraffin-embedded mouse tissue blocks were cut into 3 µm-thick sections, deparaffinized via ethanol gradient, rehydrated, and boiled in sodium citrate pH 6.0 for 10 min for antigen retrieval. After post-fixation and permeabilization, tissue sections were co-stained with either AlexaFluor488-conjugated mouse monoclonal anti-IL-1β antibody and rabbit polyclonal anti-CCR2 antibody or AlexaFluor488-conjugated mouse monoclonal anti-IL1R1 antibody and rabbit polyclonal anti-CCL2 antibody (Supplementary Table S2). After counterstaining with 300 nM 4′,6-diamidino-2-phenylindole (DAPI), slides were evaluated on an AxioImager.M2 (Zeiss; Jena, Germany) and digital images were processed with Fiji academic software (https://fiji.sc/; last accessed: 15 October 2021). Control stains were carried out with isotype controls for normal mouse IgG1/ IgG2a (Alexa Fluor® 488 conjugated; sc-3891/sc-3890) and secondary antibody only.

2.11. Bone marrow replacement

For adoptive bone marrow transplants (BMT), bone marrow cells were flushed from both femurs and tibias of wild-type (WT) or Ccr2−/− mice (all back-crossed >F12 to the FVB background) using fully supplemented DMEM. Ccr2−/− mice (all FVB) received 1 × 10⁷ bone marrow cells intravenously (iv) from WT or Ccr2−/− mice 12 h after total-body irradiation (900 Rad), as described elsewhere [16,17,20]. One mouse in each experiment was not engrafted and was observed until moribund on days 5–15 post-irradiation. One month was allowed for full bone marrow reconstitution of chimeras prior to tumor cell injections.

2.12. Statistics

Sample size was calculated using G*power (http://www.gpower.hhu.de/; last accessed: 15 October 2021) [22]. In specific, we set out to determine the biologically (>50%) and statistically (α = 0.05; β = 0.20) significant differences between two unmatched independent groups with SD ~30% of mean using two-tailed t-tests, yielding n = 7/group. Hence, experiments with n = 5 mice/group were considered in batches until the achievement of probability (p) < 0.05 with α < 0.05 or p > 0.05 with β < 0.20, whichever came first. Two-way ANOVA was employed to achieve further reduction. Results are given as mean ± SD. Sample size (n) refers to biological replicates. Differences between means were assessed using one-way or two-way ANOVAs with Bonferroni post-tests. Fifty- and sixty-percent inhibitory concentrations (IC50/60) were calculated using nonlinear regression, a logarithmic inhibitor-response model, unweighted least squares regression without outlier elimination and constraints, and extra sum-of-squares F-test comparisons. p < 0.05 was considered significant. Statistics and plots were calculated on Prism versions 5.0, 6.0, and 8.0 (GraphPad; San Diego, CA, USA).

3. Results

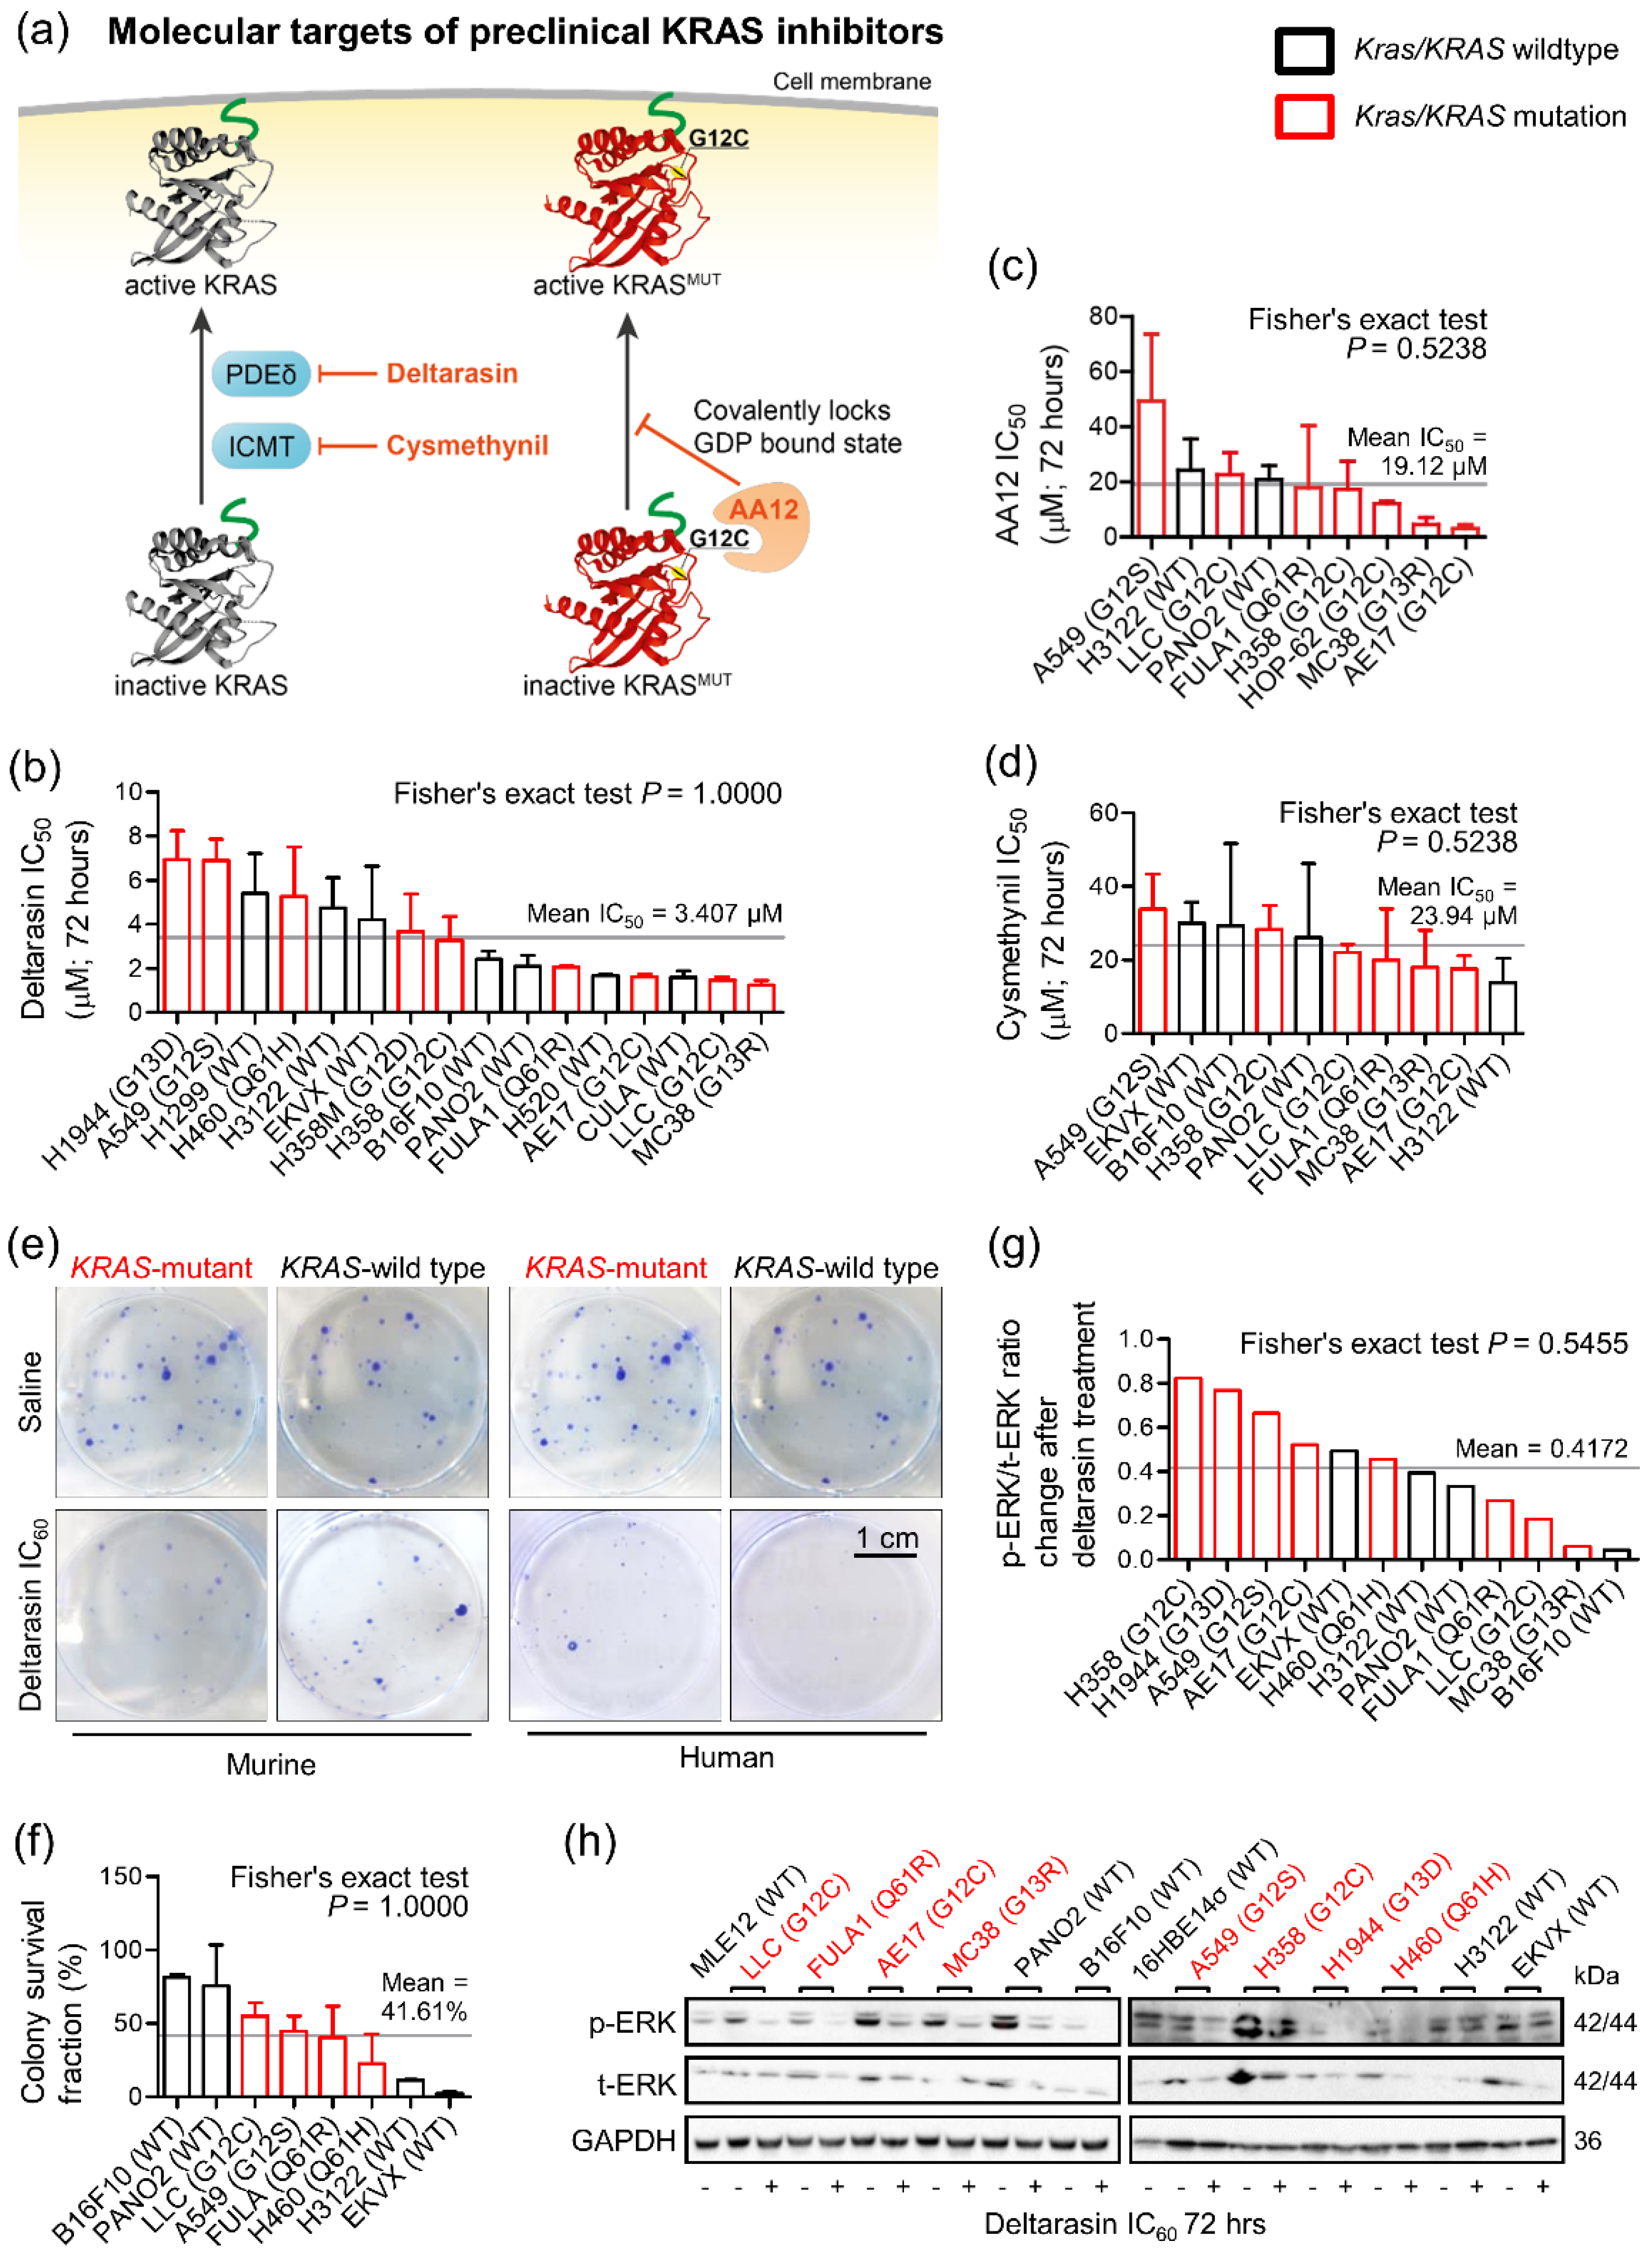
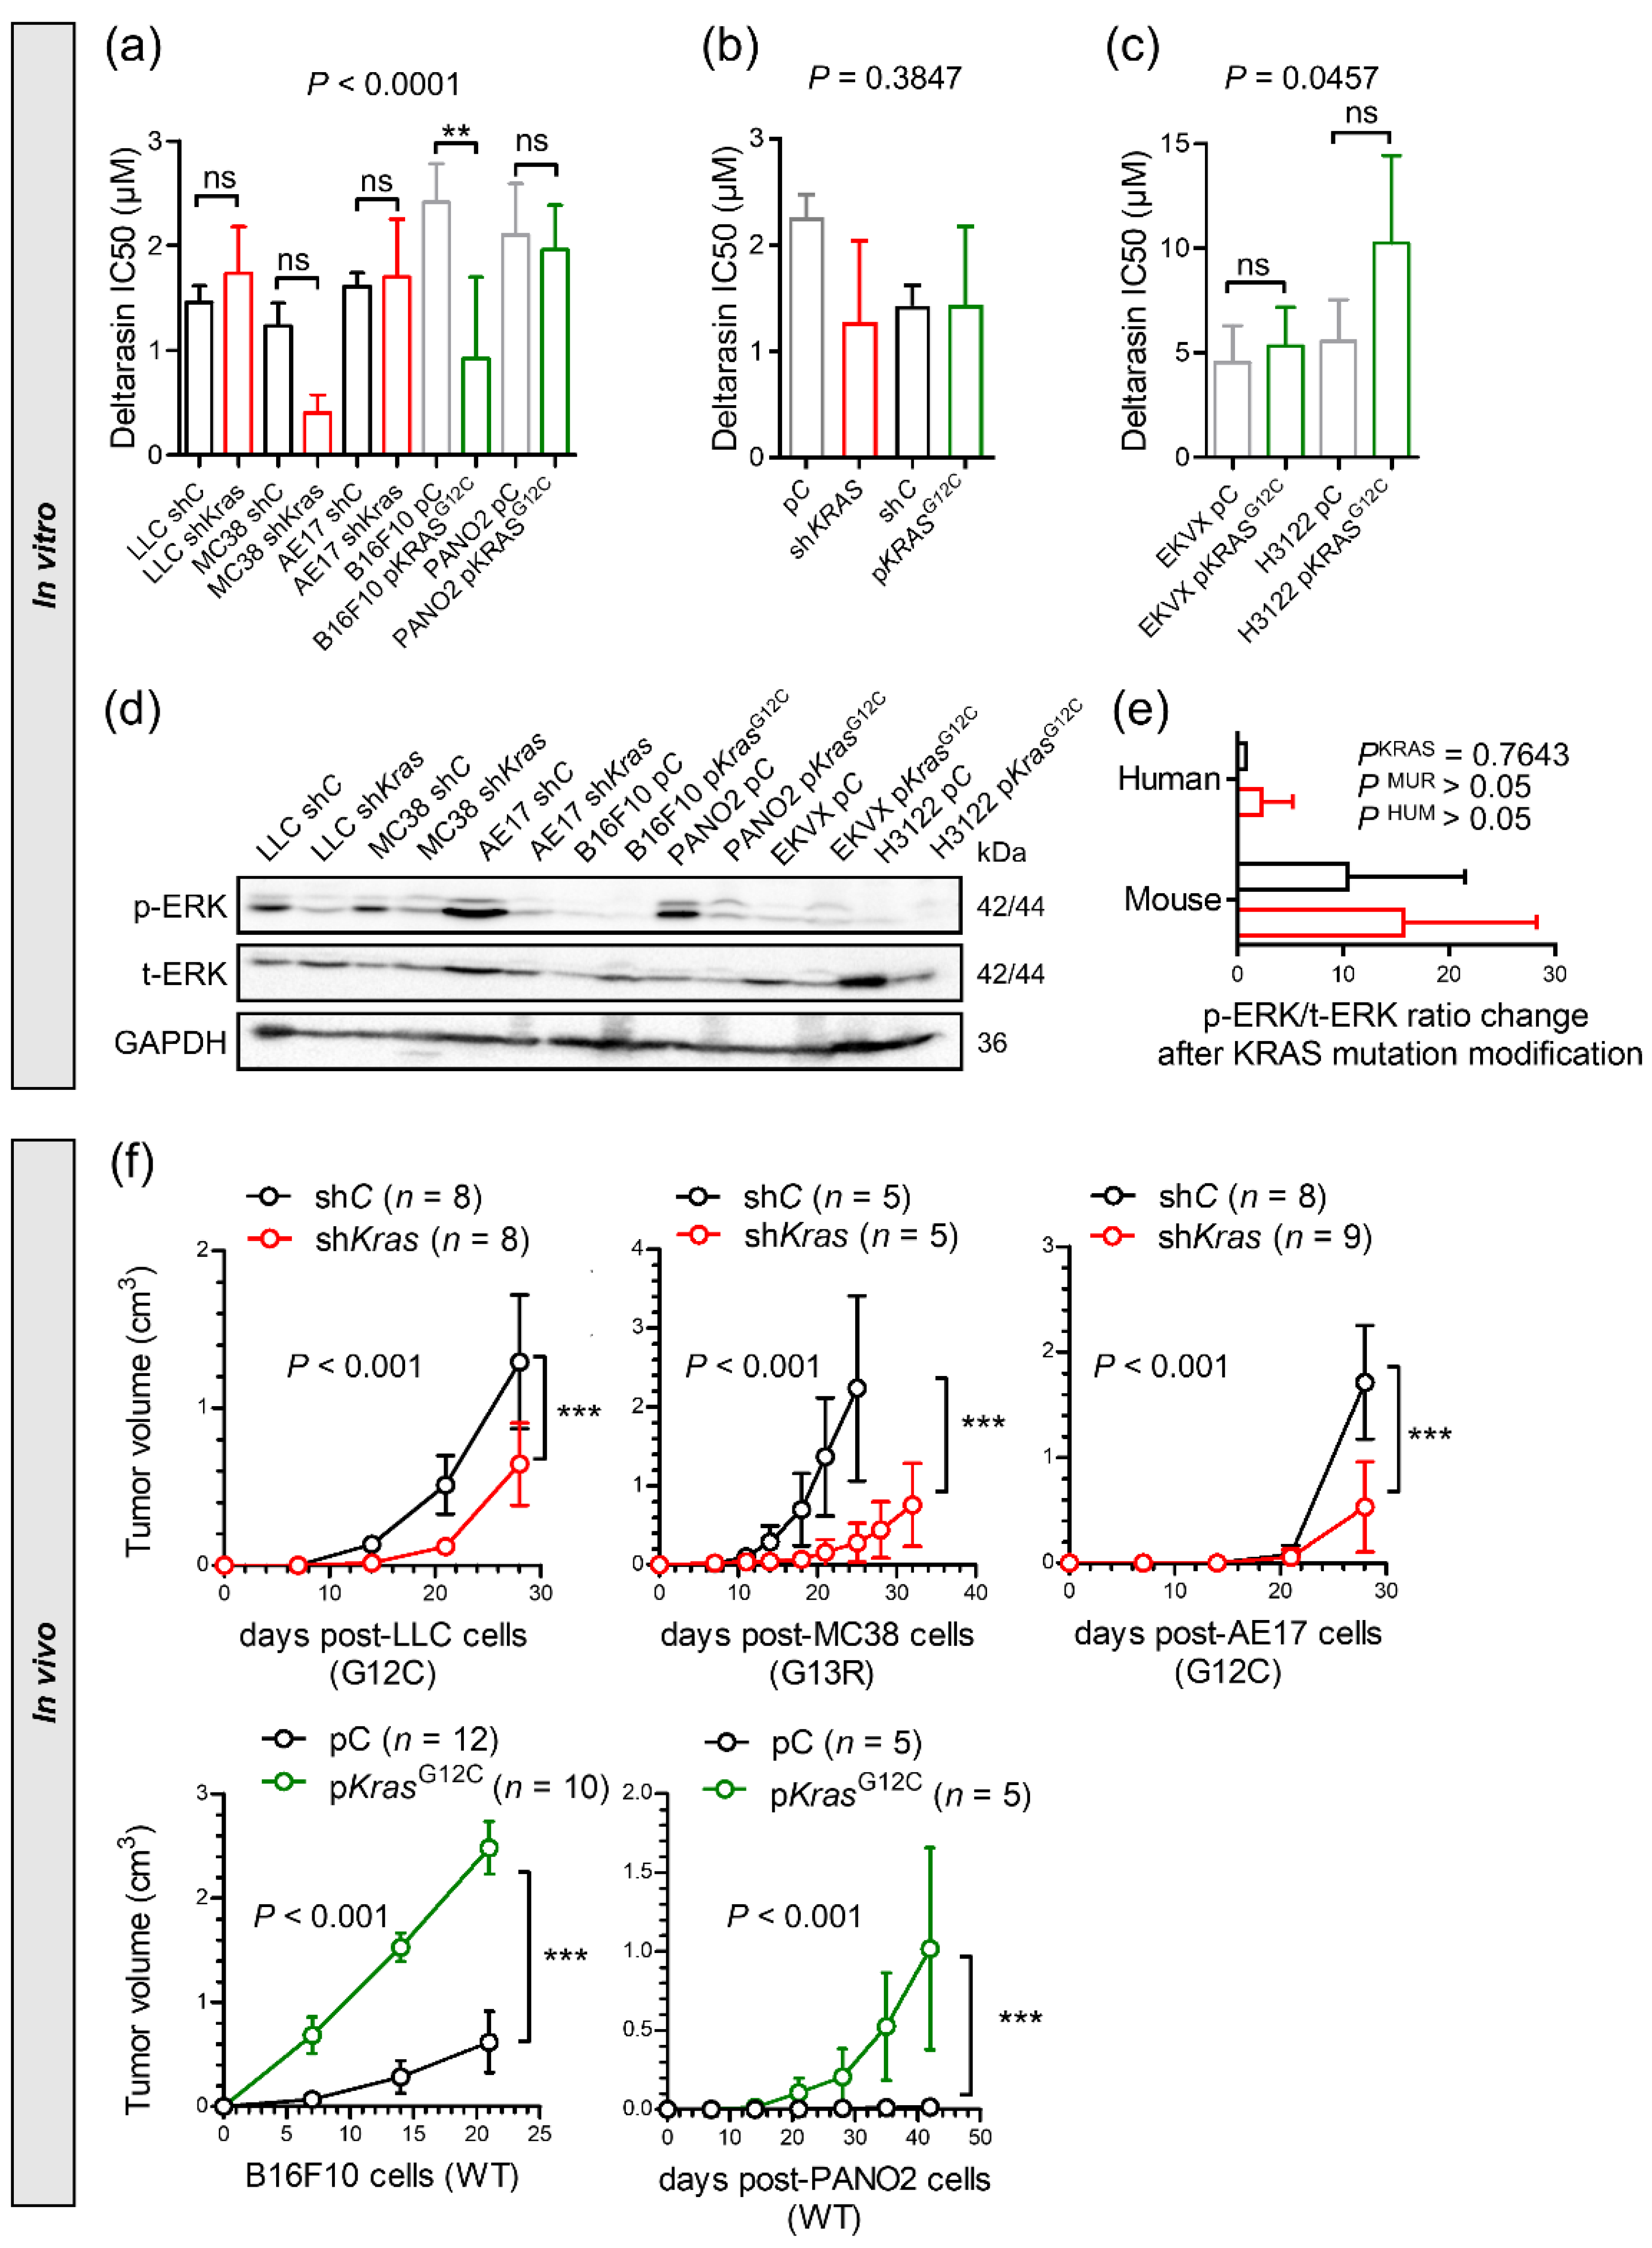
3.1. Mutation-Independent Effects of KRAS Inhibitors In Vitro

We initially investigated the cellular responses of a battery of human and murine cell lines with known KRAS/Kras (KRAS proto-oncogene, GTPase) mutation status [4,15,16,17] (Supplementary Figure S1a,b) to three preclinical KRAS inhibitors: deltarasin, targeting PDEδ (phosphodiesterase-δ) [7], AA12, allosterically targeting KRASG12C [8], and cysmethynil, targeting ICMT (isoprenylcysteine carboxylmethyltransferase) [6] (Figure 1a). For this, widely used assays were employed based on literature searches (Figure S1c). Initially, IC50 values were calculated from WST-8 assays performed after 72 h of treatment with half-log-incremental drug concentrations. Unexpectedly, all three KRAS inhibitors showed comparable efficacy across all cell lines tested, independent of their KRAS/Kras mutation status (Figure 1b–d and Supplementary Figure S2). Importantly, overall in vitro efficacy of all three drugs was modest, with IC50 values between 1–50 µM (Supplementary Tables S3–S5), while deltarasin had the lowest IC50 value. A literature search revealed that this was generally true for developmental KRAS inhibitors compared with tyrosine kinase inhibitors, which are effective at drug doses under 100 nM (Figure S1d).
To extend these results, we analyzed the response of eight selected murine and human cell lines to IC60 concentrations of deltarasin in an in vitro colony formation assay. Again, deltarasin efficacy was independent of KRAS/Kras mutation status (Figure 1e,f; Supplementary Figure S3). Since KRAS activates the mitogen-activated protein kinase cascade, inducing phosphorylation of ERK (extracellular-signal-regulated kinase), we quantified t- and p-ERK relative to GAPDH (glyceraldehyde-3-phosphate dehydrogenase) in 12 murine and human cell lines treated with saline or IC60 deltarasin. In line with the above results, deltarasin inhibited p-ERK independent of cellular KRAS/Kras mutation status (Figure 1g,h; Supplementary Figure S4).
Thus, pharmacologic KRAS inhibition did not reveal KRAS-dependence in vitro.

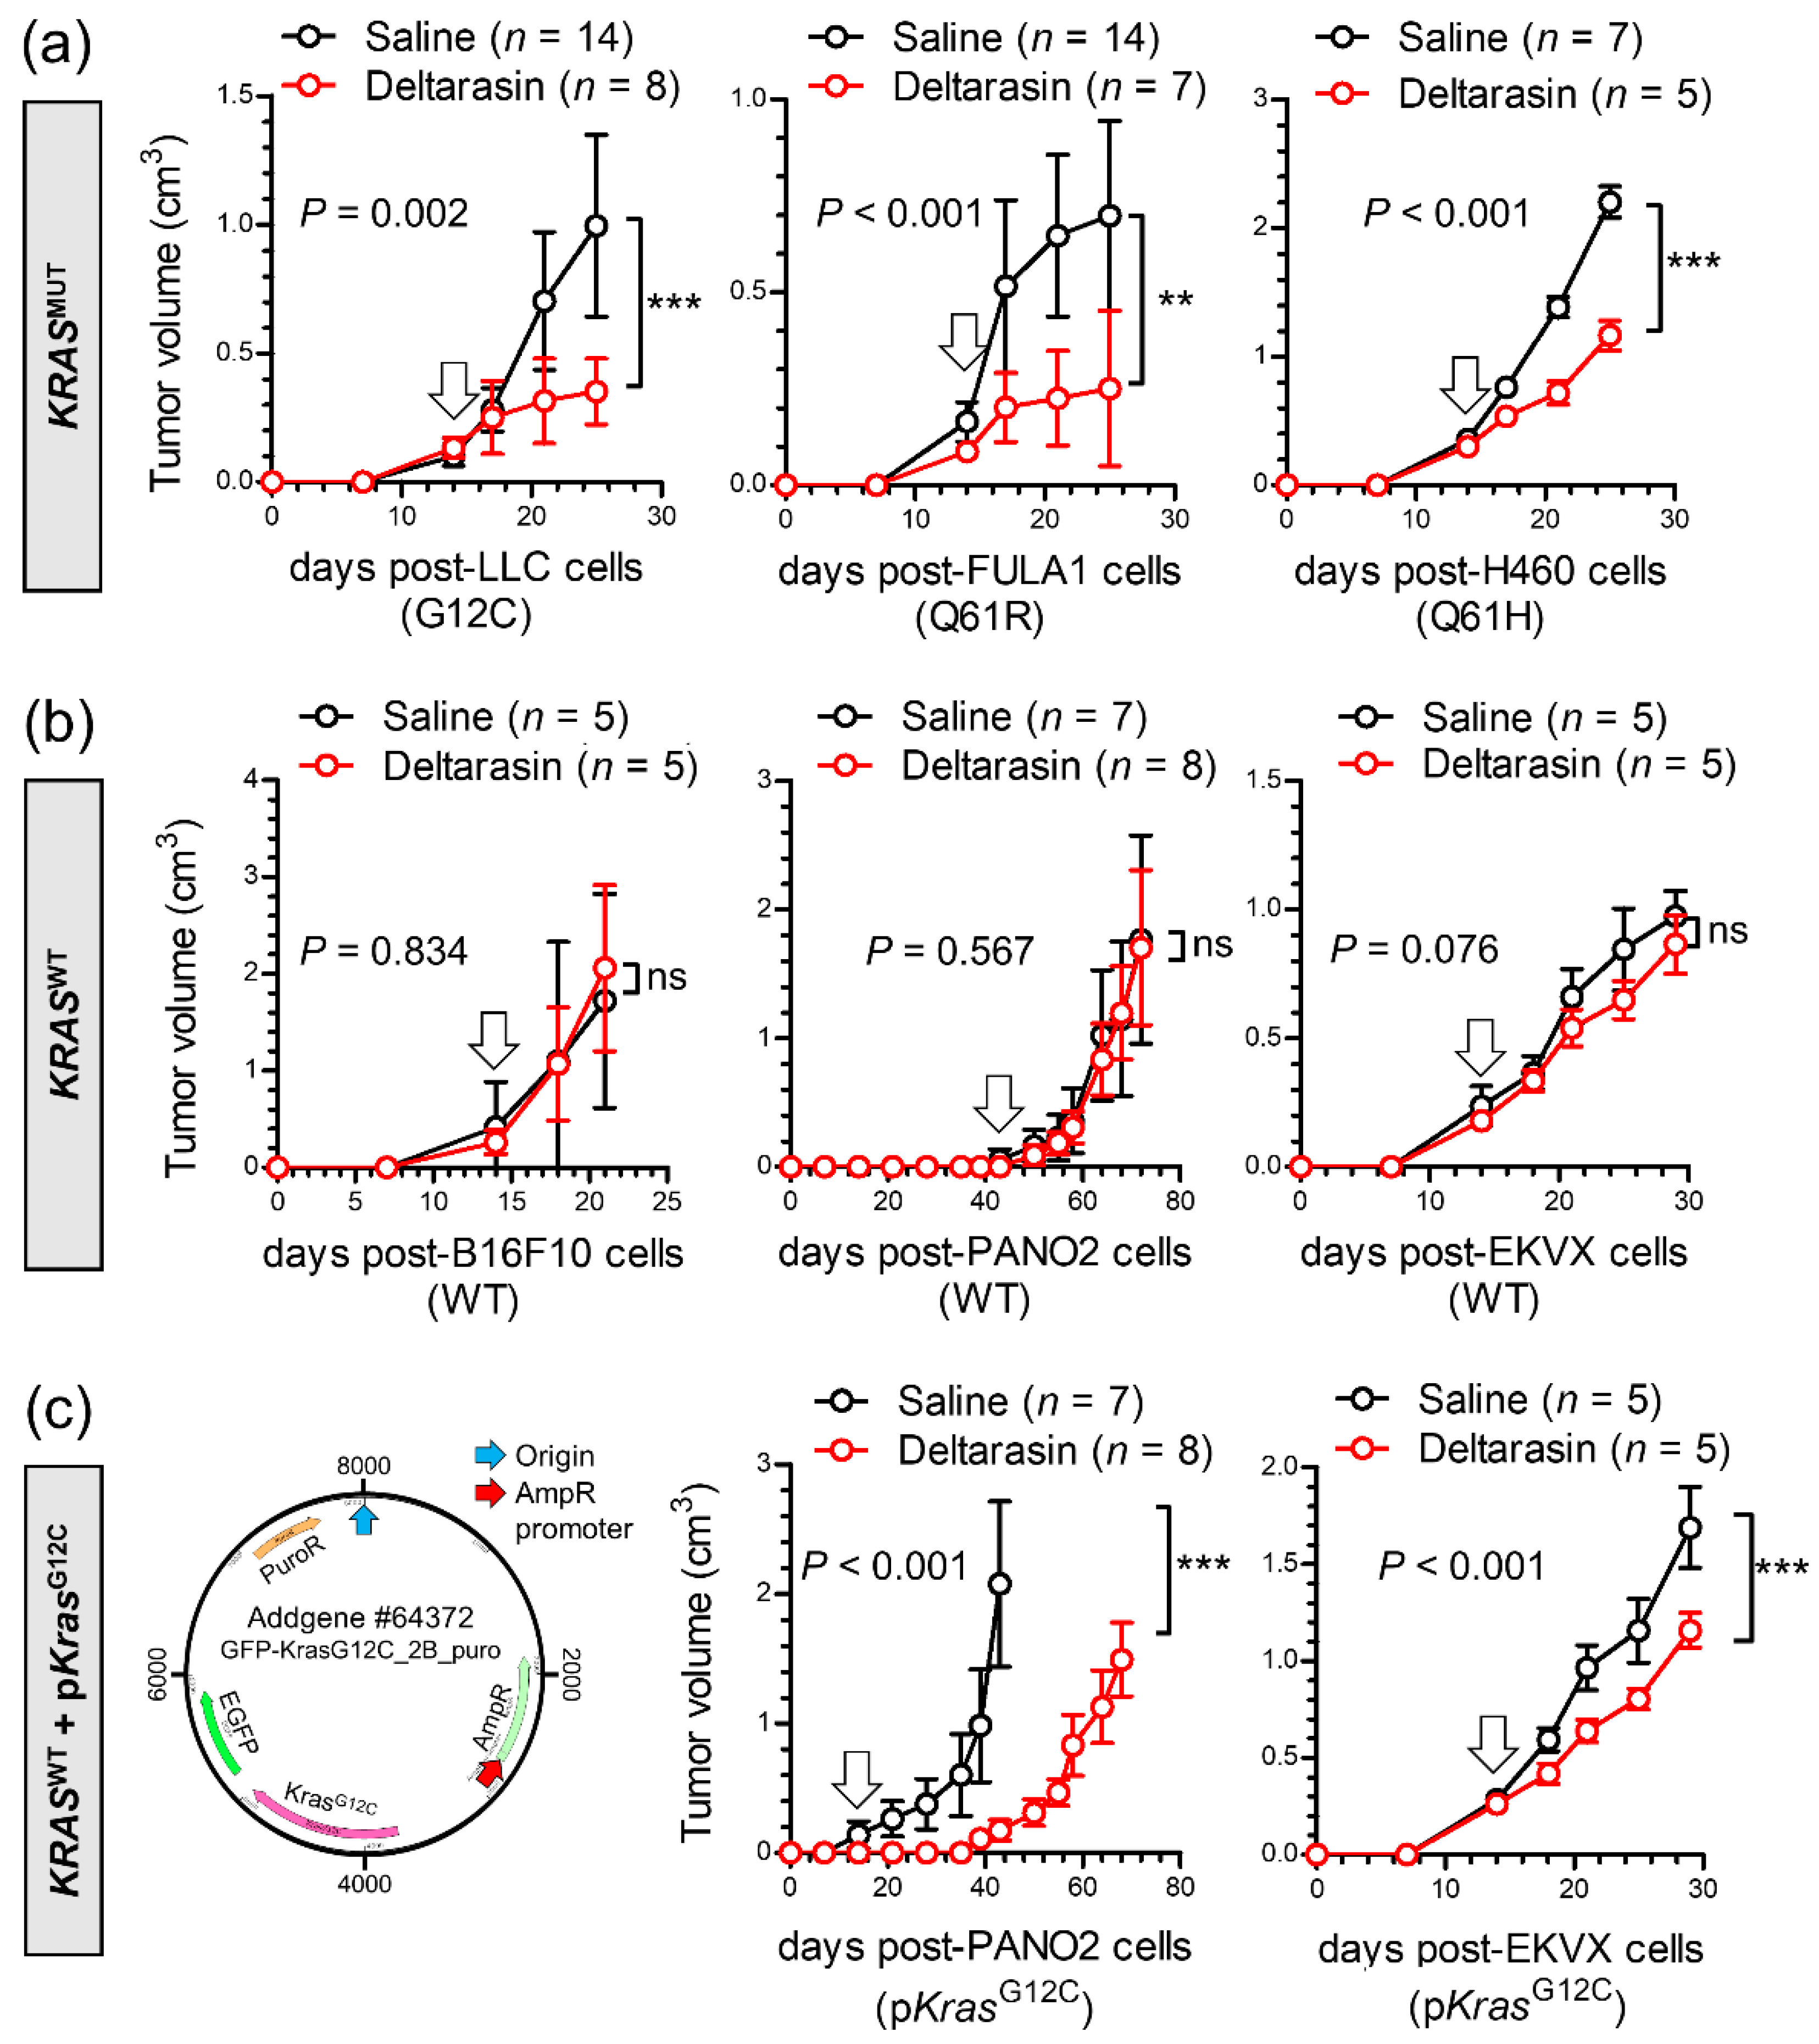
3.2. Specific In Vivo Effects of Deltarasin against KRAS-Mutant Tumors

To replicate these results in vivo, we induced subcutaneous tumors in C57BL/6, FVB, and Rag2−/− (recombination activating gene 2) mice using six different cancer cell lines and initiated daily intraperitoneal saline or deltarasin (15 mg/Kg in saline) treatments after tumor establishment (tumor volume ≥ 100 mm3; latency ≥ 14 days post-sc injection). We pursued the inclusion of the other inhibitors in animal triage, but were unfortunately not successful in obtaining approval, largely due to the past extensive testing of cysmethynil and the sparse existing safety data for AA12 compared to our extensive experience with deltarasin [15,16]. Interestingly, deltarasin selectively inhibited the subcutaneous growth of murine and human KRAS-mutant tumors (Figure 2a), but had no effect on KRAS-WT tumors (Figure 2b). Moreover, forced overexpression of pKrasG12C in KRAS-WT mouse and human cancer cells accelerated tumor growth and restored the response to the drug (Figure 2c).
Taken together, these data show that deltarasin-mediated KRAS inhibition selectively halted the growth of KRAS-mutant cancer cells in vivo.

3.3. Genetic KRAS Manipulation Reveals Contrasting KRAS-Dependencies In Vitro and In Vivo

To further validate the observed in vivo-restricted specificity of deltarasin, we overexpressed anti-Kras-specific shRNA (shKras) in Kras-mutant parental cell lines or pKrasG12C in Kras-WT parental cell lines [15]. In accordance with pharmacologic KRAS inhibition, genetic Kras modulation did not impact the in vitro response of cancer cell lines to deltarasin, as determined by WST-8 IC50 values and ERK activation levels (Figure 3a–e, Supplementary Figures S5 and S6). In contrast to the lack of Kras-dependence in vitro, mutant Kras was required and sufficient for sustained tumor growth in vivo (Figure 3f): murine cell lines expressing shKras displayed statistically (p < 0.001) and biologically (50–90% inhibition) significantly decreased tumor growth compared with parental cell lines expressing shC. Correspondingly, pKrasG12C overexpression accelerated tumor growth compared with overexpression of pC.
Collectively, these results supported that, similar to drug-based KRAS inhibition, genetic Kras modulation selectively impacts tumor growth in vivo.

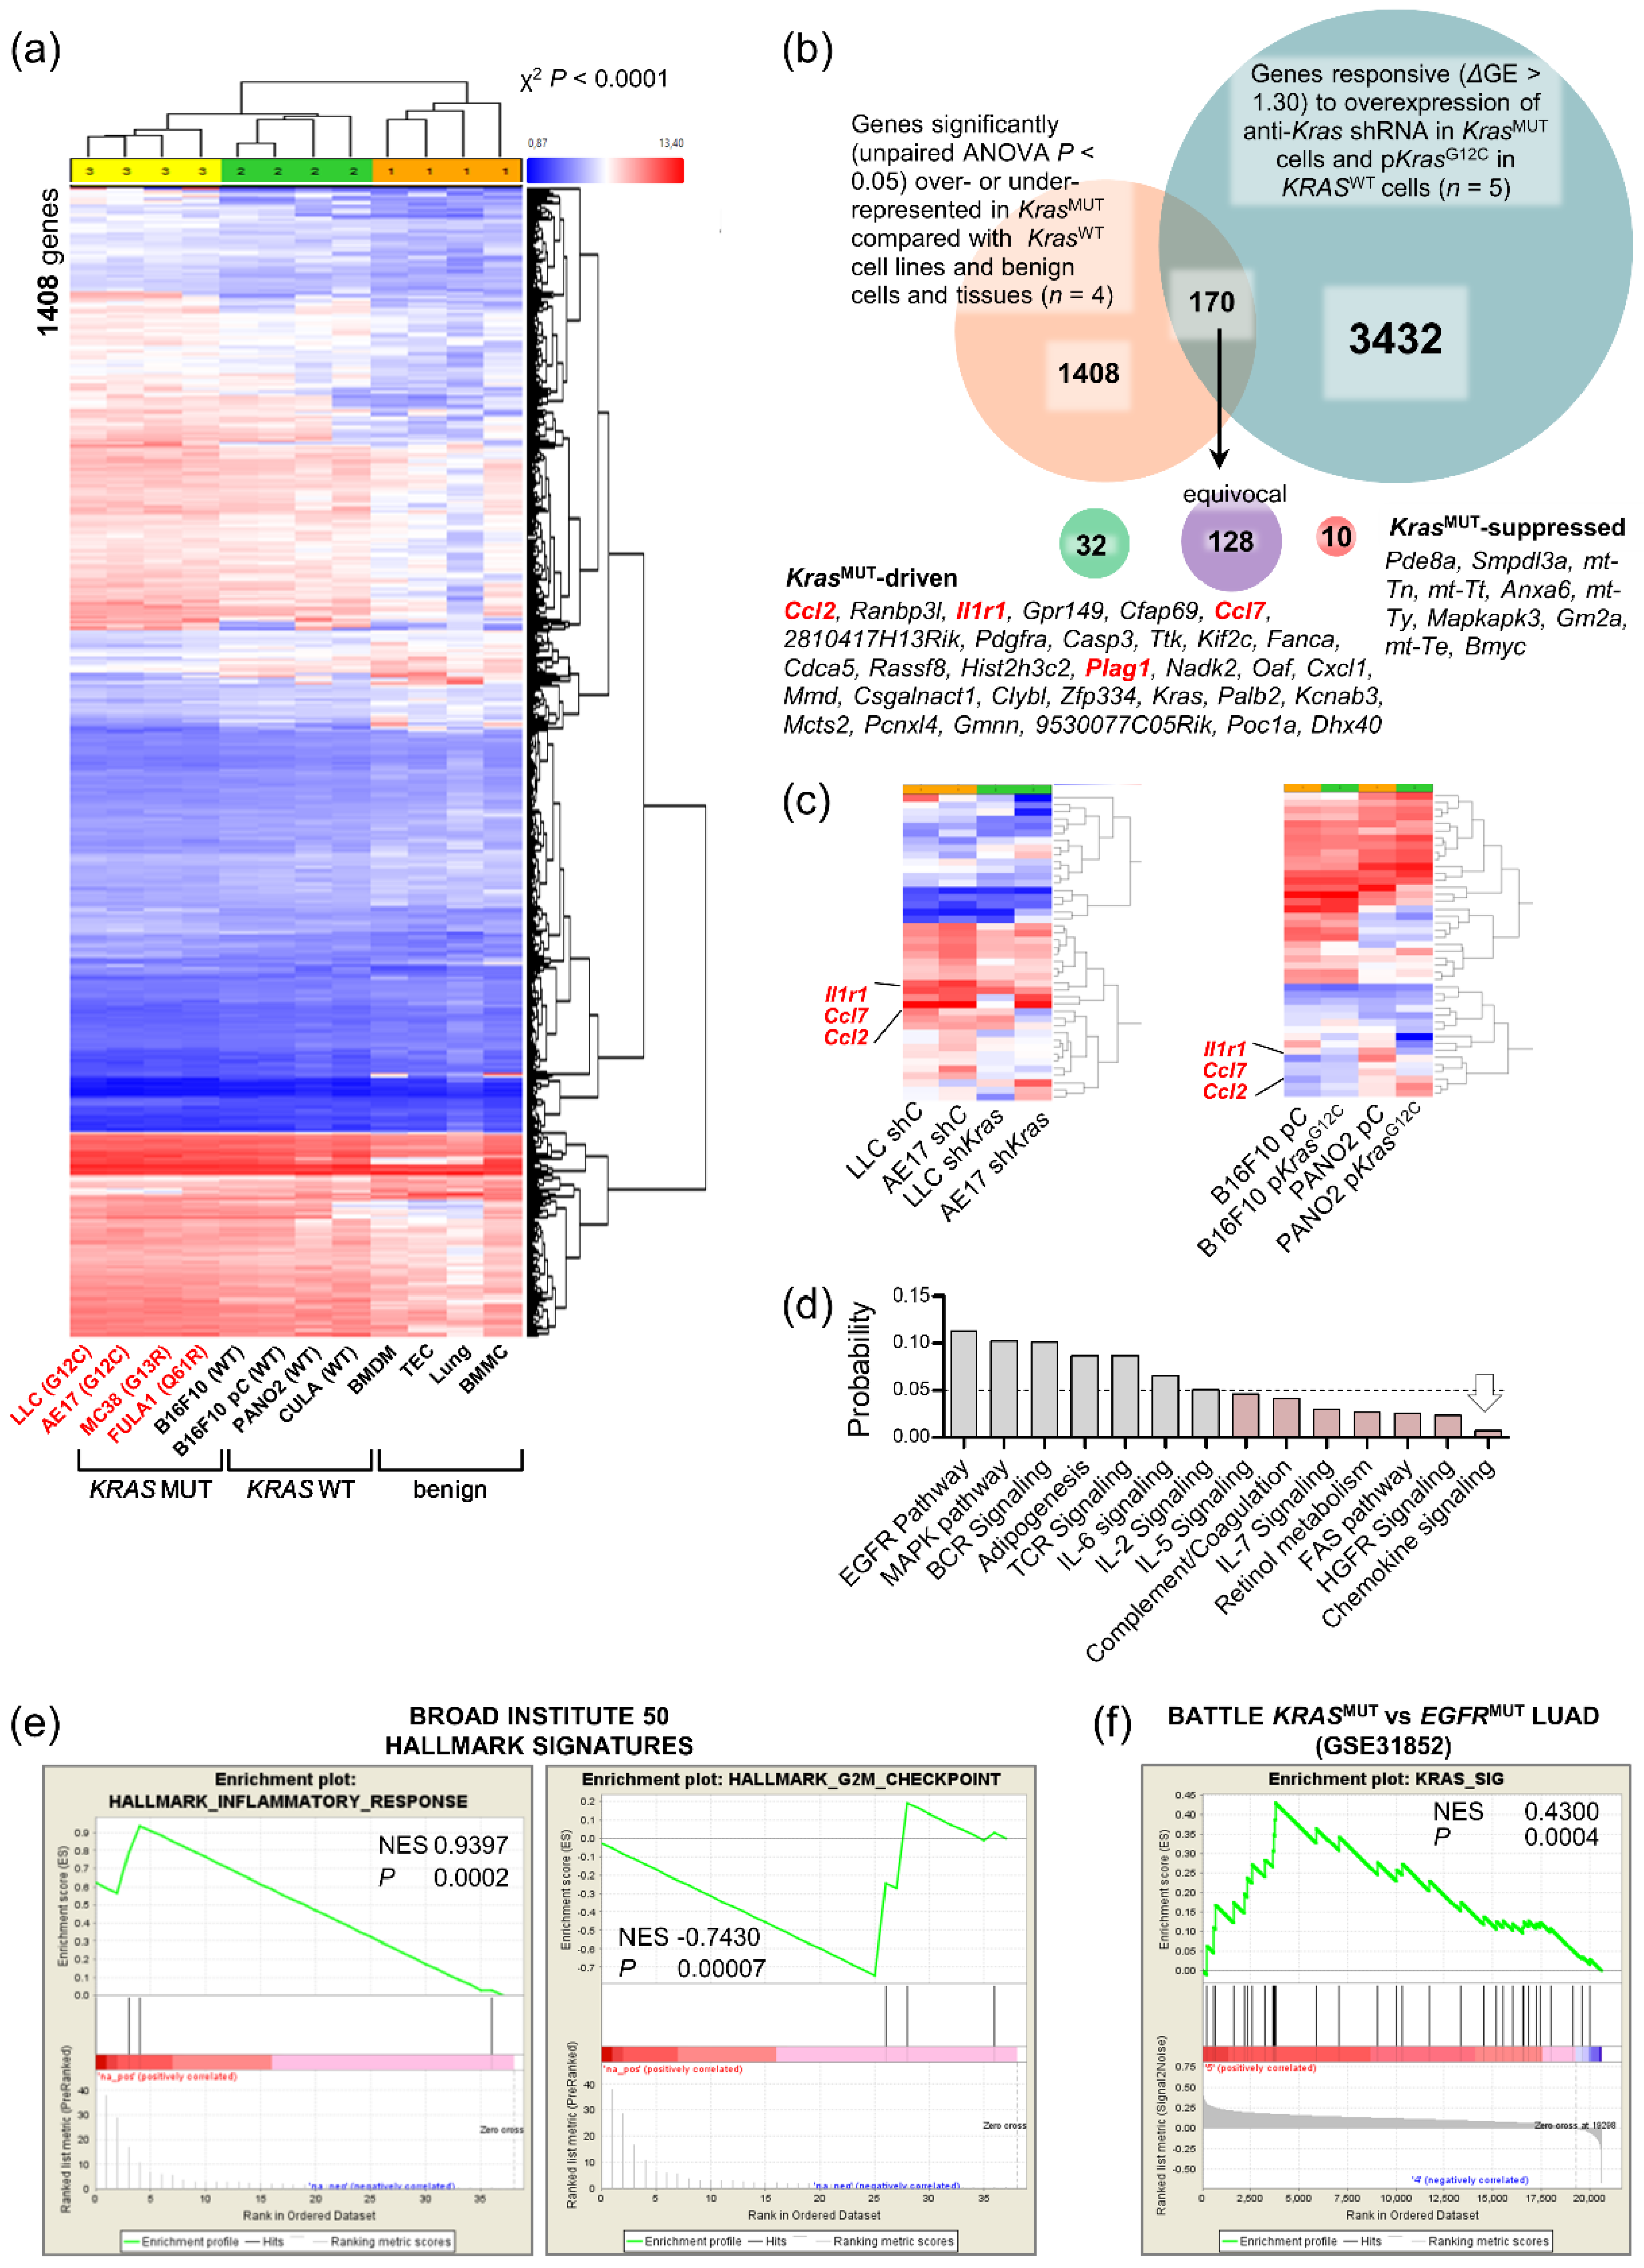
3.4. A Mutant Kras Transcriptome Signature Contains Ccl2 and Il1b

In an effort to identify mutant-Kras-driven genes responsible for in vivo restricted KRAS-dependence, we analyzed the global transcriptomes of the parental and Kras-modulated murine cell lines described above and of benign samples (whole lungs, tracheal epithelial cells (TEC), and bone marrow-derived macrophages (BMDM) and mast cells (BMMC)). Unsupervised hierarchical clustering showed absolute segregation of benign, Kras-WT, and Kras-mutant samples by 1408 differentially expressed genes (ΔGE) using an ANOVA p < 0.05 threshold (Figure 4a,b). Paired analyses of the five isogenic cancer cell line doublets with modulated Kras (LLC, MC38, and AE17 cells expressing shC versus shKras and PANO2 and B16F10 cells expressing pC versus pKrasG12C) identified another 3432 Kras-responsive transcripts. Out of the 170 transcripts that were present in both gene sets, 42 were both differentially represented in benign, Kras-WT, and Kras-mutant samples and responsive (ΔGE > 1.40) to Kras modulation, including Kras per se (Figure 4b, Supplementary Table S6). Interestingly, Il1r1 (interleukin-1 receptor 1), Ccl7 (C-C-motif chemokine ligand 7), and Ccl2 were among those genes and were clustered tightly together (Figure 4c), and chemokine signaling was the pathway most significantly perturbed by Kras modulation on WikiPathway analysis (Figure 4d) [23].
We next translated our 42-gene murine mutant Kras signature to their 37 human orthologues using Orthoretriever (http://lighthouse.ucsf.edu/orthoretriever/; last accessed: 15 October.2021) and ran GSEA (http://software.broadinstitute.org/gsea/index.jsp; last accessed: 15 October 2021) [24]. Interestingly, our humanized mutant KRAS signature was enriched in only two of the Broad Institute’s 50 hallmark signatures: positively in the signature “inflammatory response” and negatively in the signature “G2M-checkpoint” (Figure 4e). Moreover, this mutant KRAS signature was significantly positively enriched in KRAS- versus EGFR (epidermal growth factor receptor)-mutant LUAD (lung adenocarcinoma; GSE43458) from the BATTLE trial [25,26] (Figure 4f). In connection with this, we recently reported that mutant KRAS drives CCL2 and Il1R1 expression in establishing inflammatory feedback loops with interleukin-1 beta (IL-1β)-secreting myeloid cells in malignant pleural effusions [15,16,20].
Collectively, the data further supported that in vivo-restricted mutant KRAS-dependence is mediated by proinflammatory signals to CCR2+ (C-C motif chemokine receptor) IL-1β-secreting host cells.

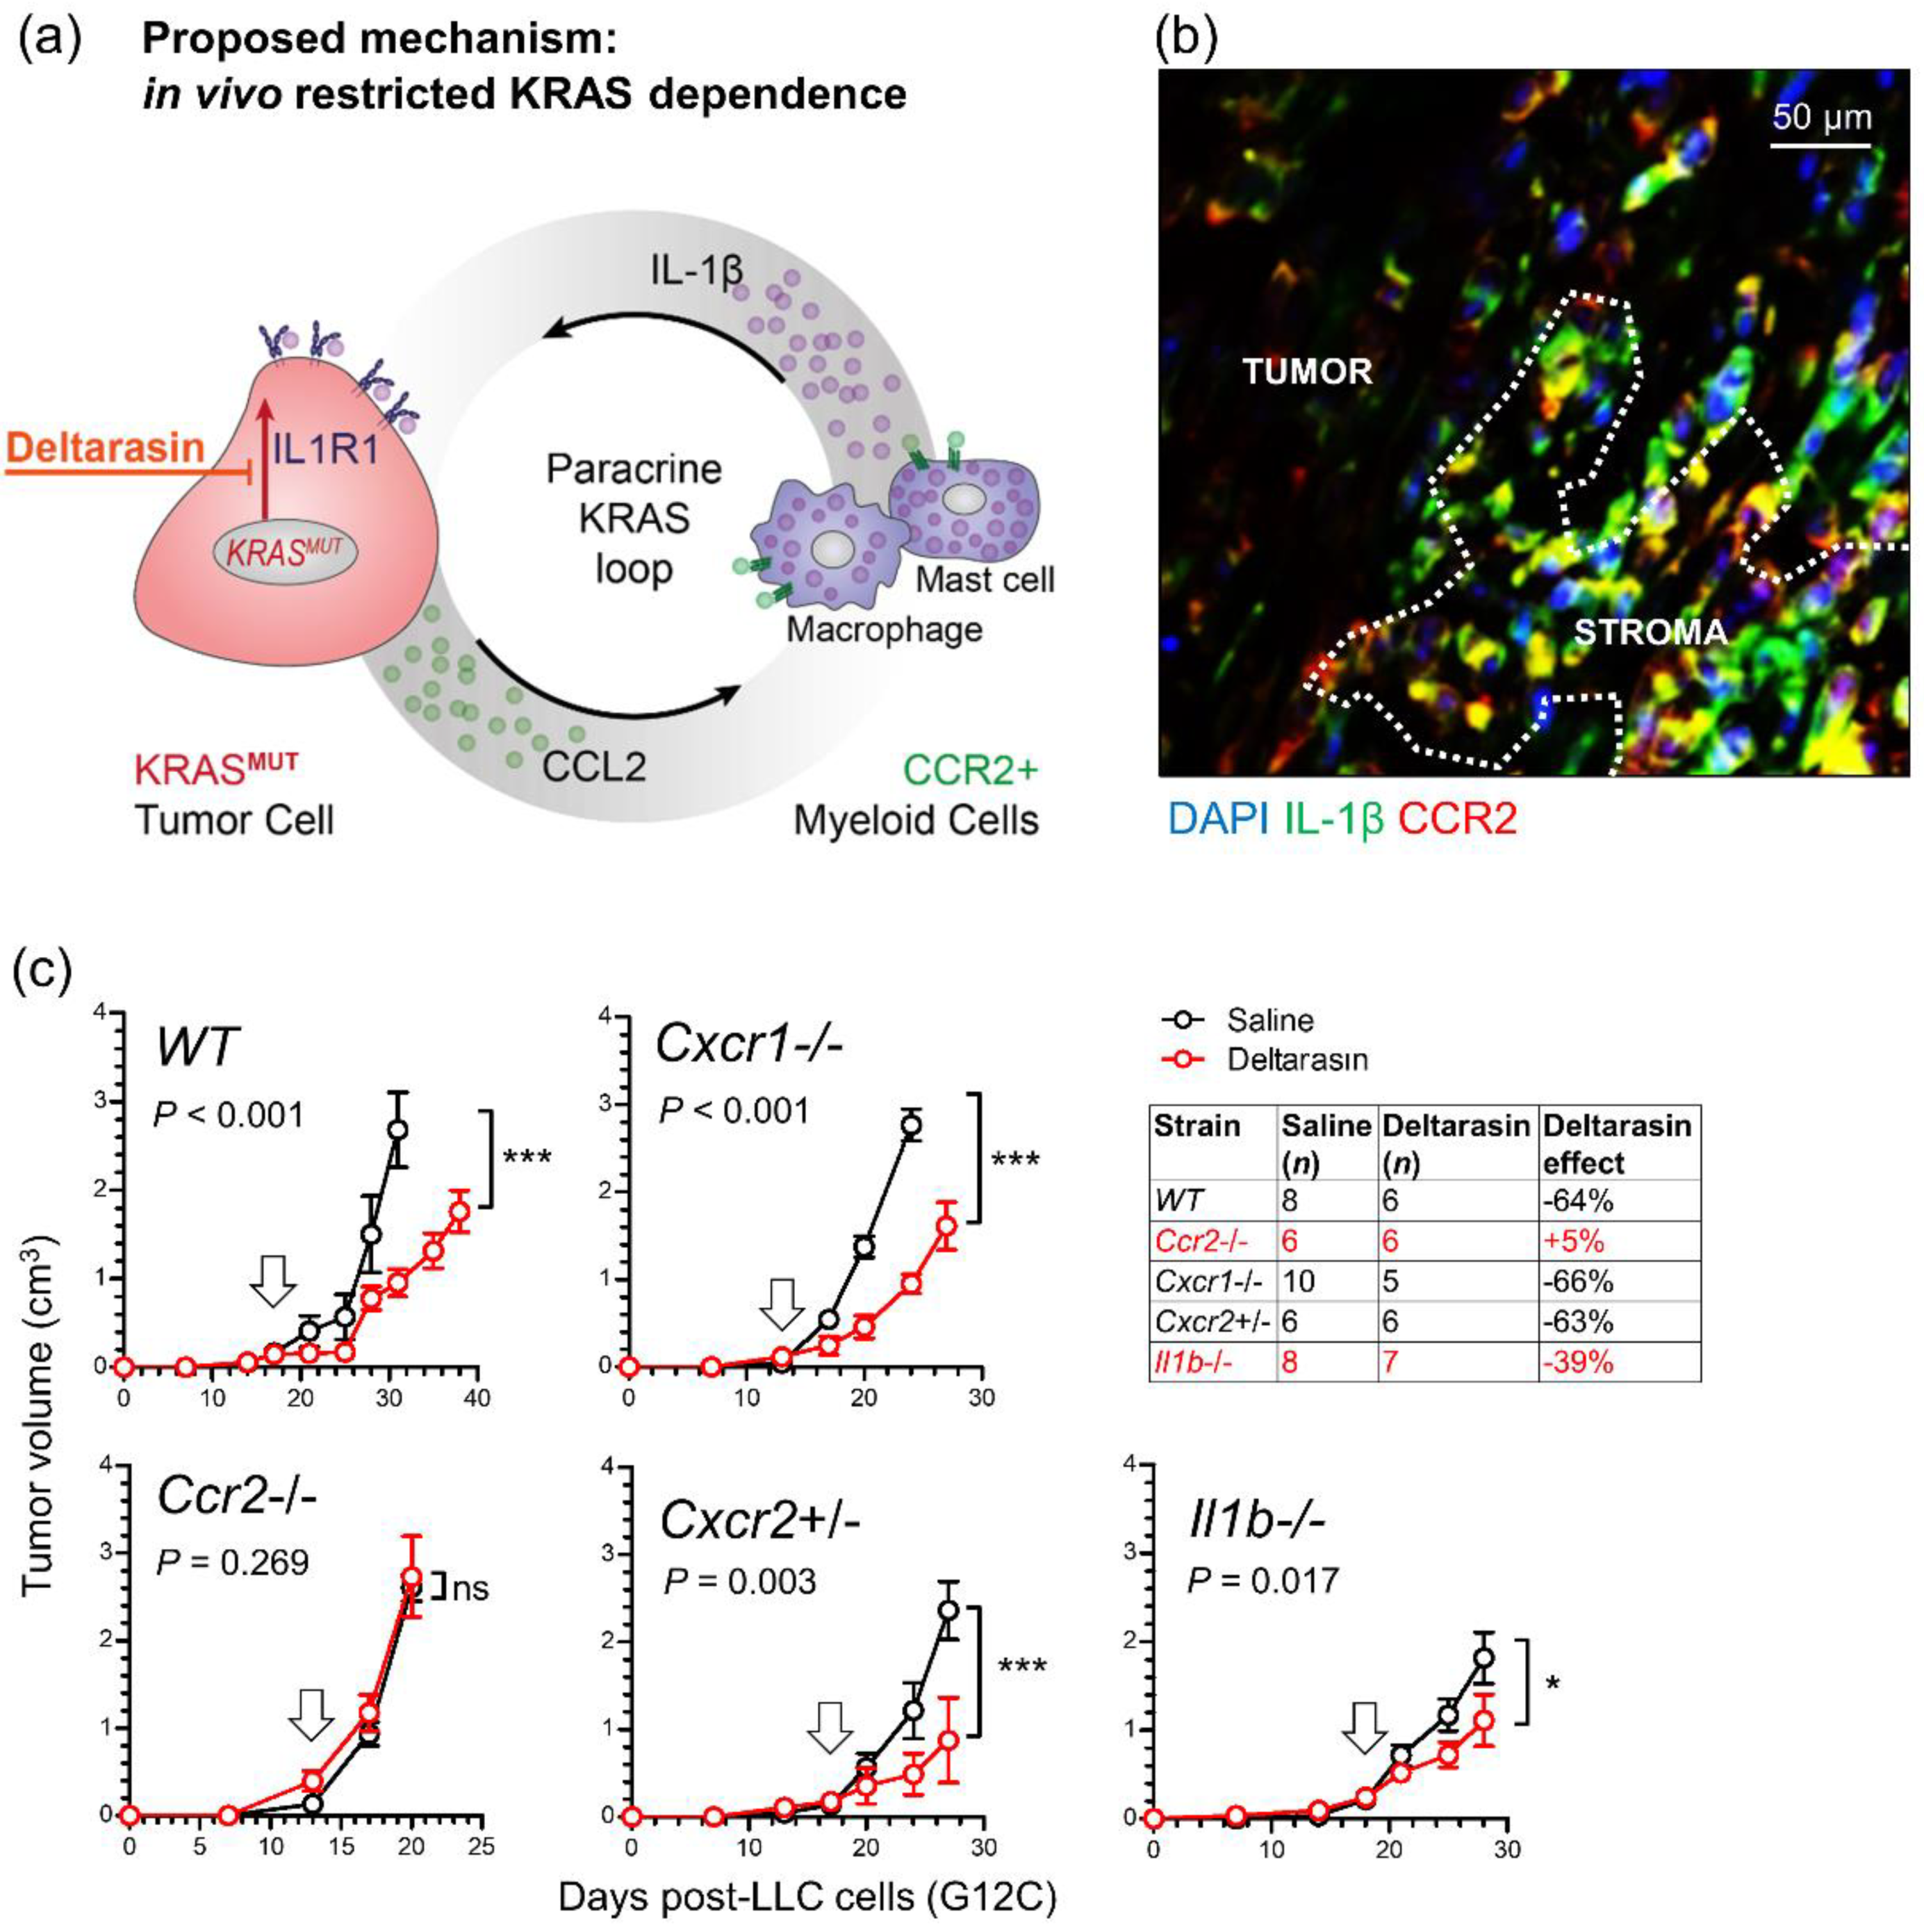
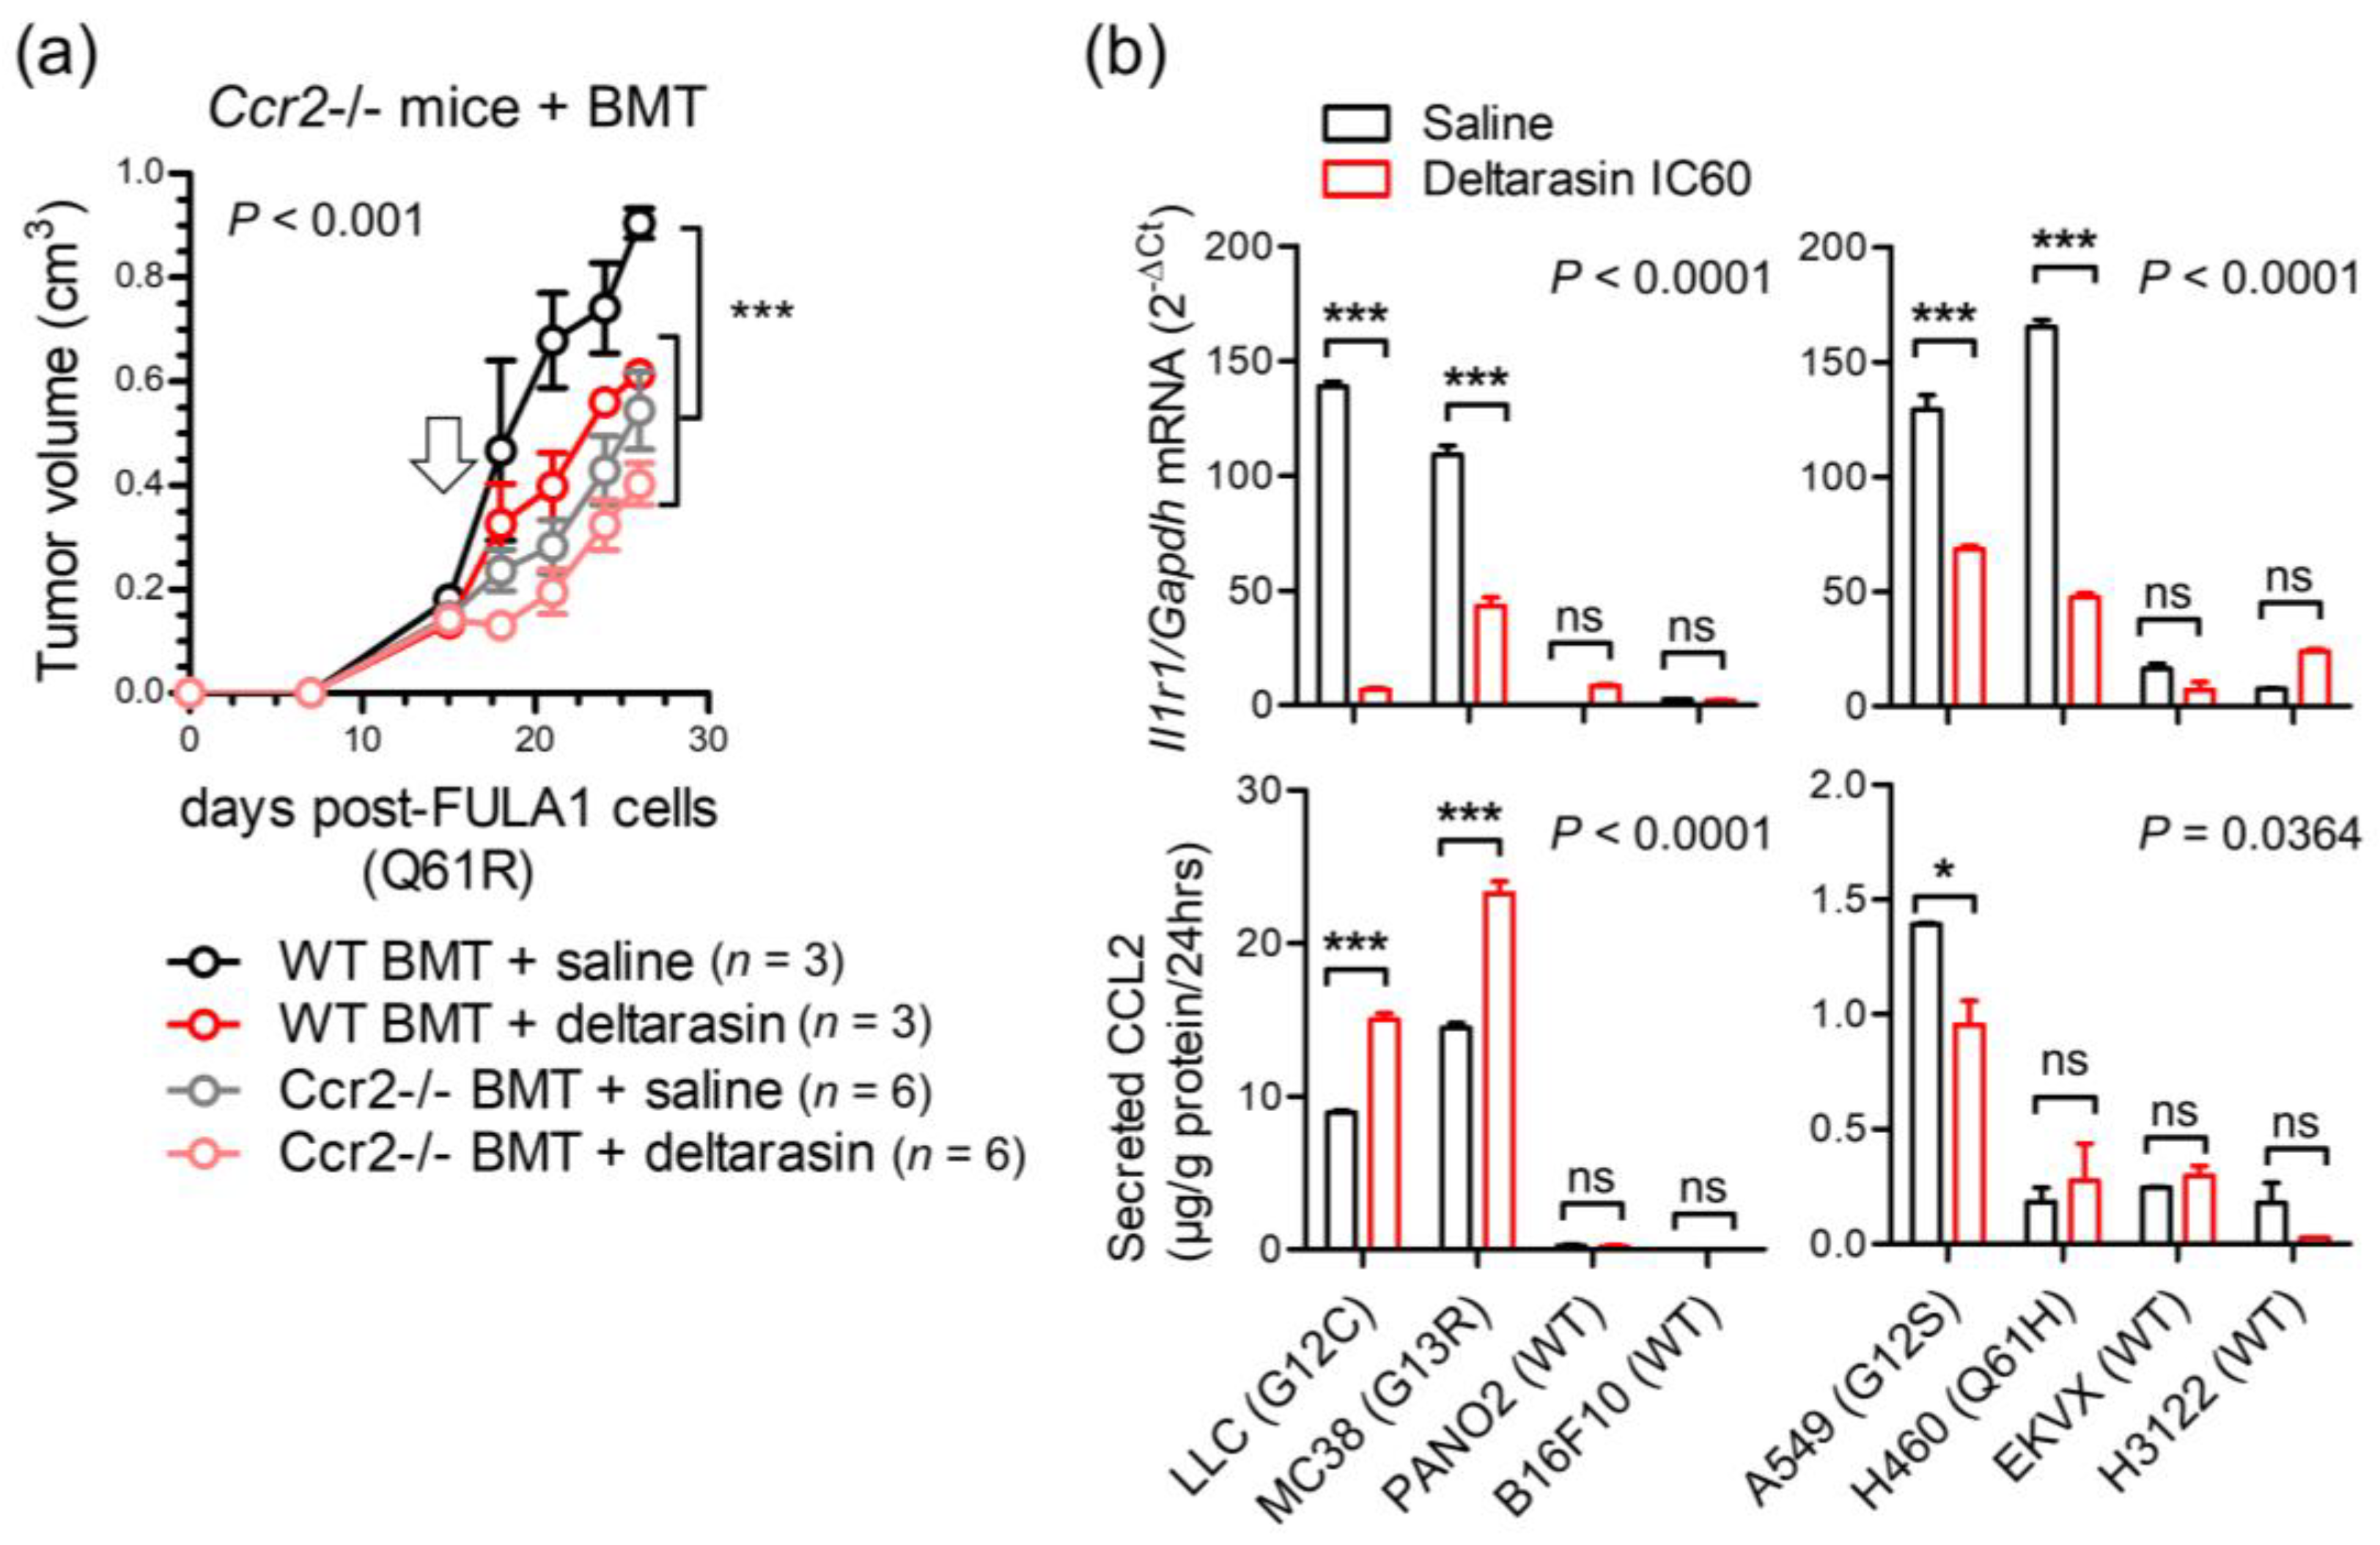
3.5. CCR2+ IL-1β-Secreting Myeloid Cells Potentiate In Vivo KRAS-Dependence

These results led us to the hypothesis that CCR2+ IL-1β-secreting myeloid cells are required for in vivo KRAS-dependence (Figure 5a). Indeed, numerous such cells co-expressing CCR2 and IL-1β were identified in the stromata of our experimental Kras-mutant tumors using immunohistochemistry (Figure 5b). To definitively test our hypothesis, we induced flank tumors by injecting 106 LLC cells (KrasG12C) subcutaneously into syngeneic C57BL/6 mice competent (WT) or deficient (Il1b−/−, Ccr2−/−) [18,20] in the Il1b and Ccr2 genes. Mice haplo/diplo-insufficient in the Cxcr1 (C-X-C motif chemokine receptor 1) and Cxcr2 chemokine receptor genes (Cxcr1−/−, Cxcr2+/−) [17] were employed as additional controls for Ccr2−/− mice and daily intraperitoneal saline or 15 mg/Kg deltarasin treatments were initiated when tumors reached 100 mm3 volumes. Expectedly, deltarasin treatment statistically and biologically significantly inhibited LLC tumor growth in WT, Cxcr1−/−, and Cxcr2+/− mice. However, deltarasin effects were diminished in Il1b−/− and completely abrogated in Ccr2−/− mice (Figure 5c). To exclude the possibility of developmental effects in knockout mice, we total-body-irradiated (900 Rad) Ccr2−/− mice and performed adoptive bone marrow transplants (BMT) from WT or Ccr2−/− donors, as described previously [16,20]. For this experiment, WT and Ccr2−/− mice back-crossed > F12 to the FVB strain were used together with syngeneic FULA1 cells (KrasQ61R) to obtain results with another cell line harboring a different Kras mutation and a broad mutation spectrum relevant to human KRAS-mutant LUAD [19]. Again, daily intraperitoneal saline or deltarasin treatments were started when tumors > 100 mm3 were established. Expectedly, Ccr2−/− chimeras receiving Ccr2−/− BMT did not respond to deltarasin, but Ccr2−/− chimeras receiving WT BMT displayed markedly increased tumor growth as well as statistically and biologically significant inhibition from deltarasin treatment (Figure 6a). Collectively, these results indicated that myeloid CCR2 and IL-1β are required for deltarasin efficacy against Kras-mutant tumors in vivo.

3.6. Deltarasin Limits IL-1β Sensing by KRAS-Mutant Tumor Cells

We next interrogated the mechanism of in vivo-restricted deltarasin dependence. Based on the microarray-derived mutant Kras signature that encompassed Ccl2 and Il1r1 (Figure 4) and our previous reports on mutant KRAS-mediated transcriptional regulation of CCL2 and IL1R1 [15,16], we tested whether deltarasin blocks expression of these two genes (Figure 6b). Indeed, KRAS-mutant mouse and human cancer cell lines displayed markedly increased baseline Il1r1/IL1R1 mRNA expression compared with WT cell lines, and significantly downregulated Il1r1/IL1R1 transcript levels after deltarasin treatment (Figure 6b, upper panel). By comparison, only some KRAS-mutant cell lines displayed increased baseline CCL2 protein secretion compared with WT cell lines, and CCL2 elaboration was not consistently blocked by deltarasin treatment (Figure 6b, lower panel), suggesting that deltarasin-mediated downregulation of Il1r1/IL1R1 expression delivered the bulk of the drug’s in vivo effects (Figure 5a).

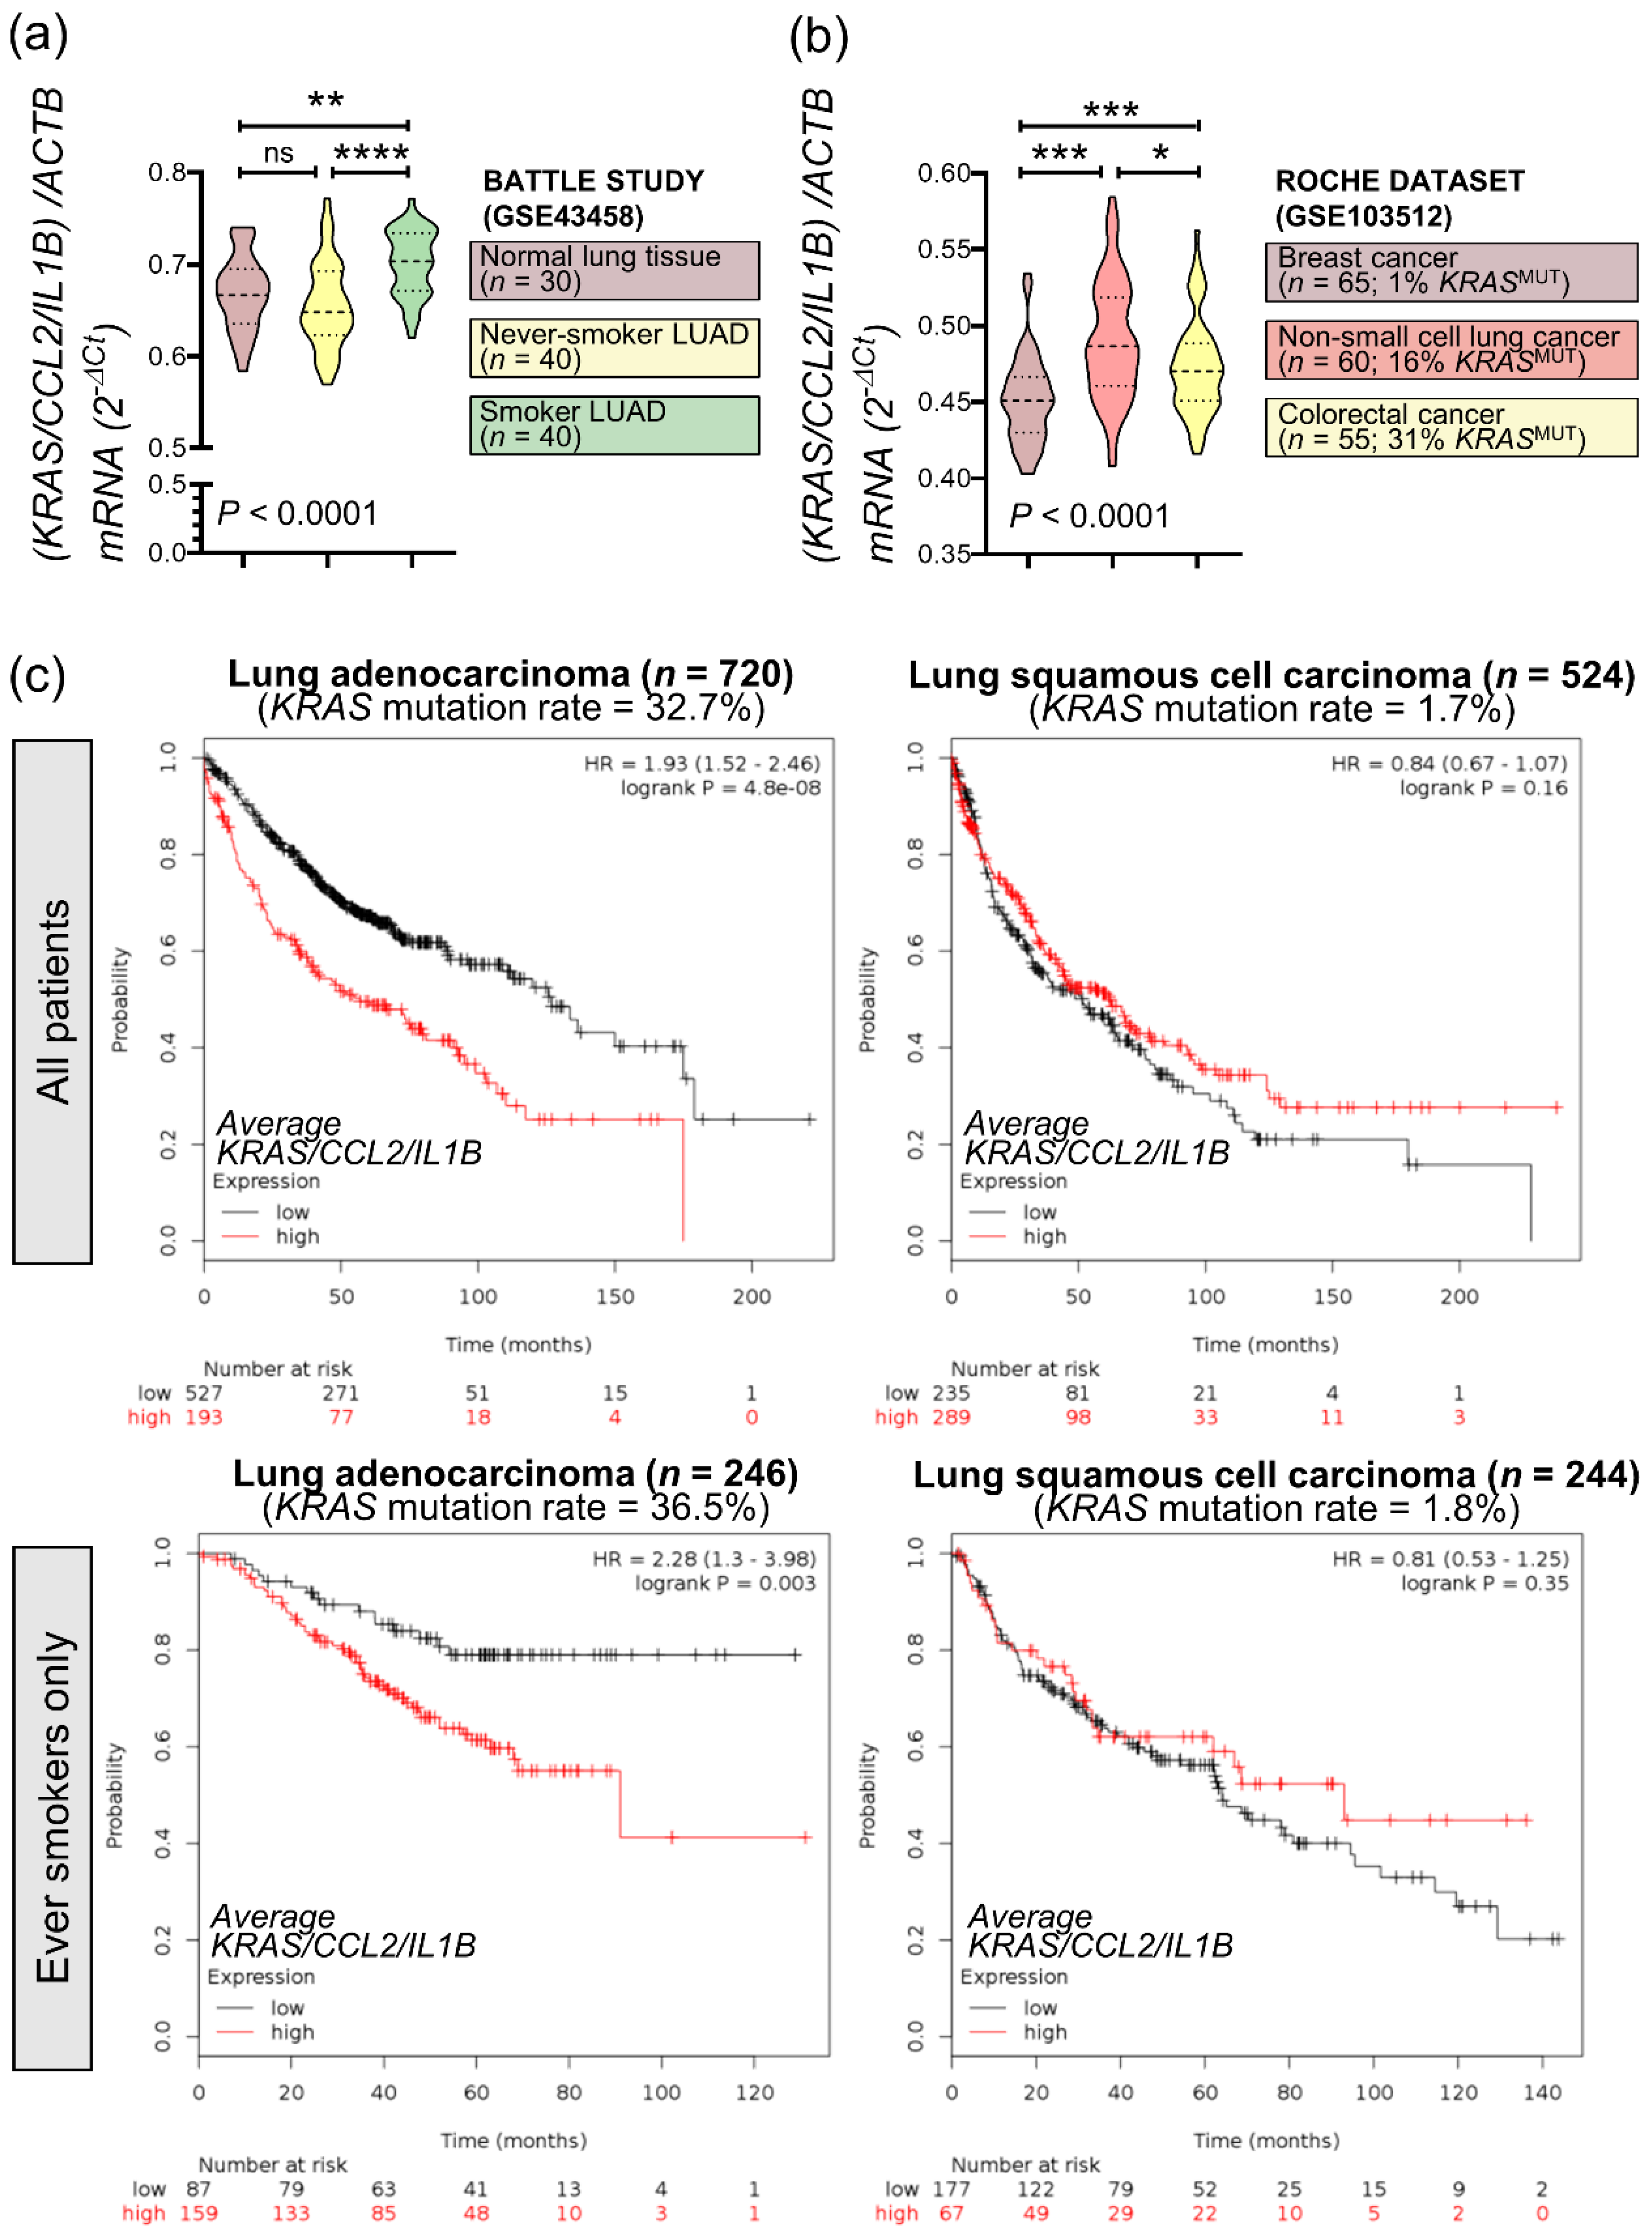
3.7. An Inflammatory CCL2/IL1B Signature in KRAS-Mutant Human Cancers

To investigate the relevance of our findings to KRAS-mutant human cancers, we analyzed the average expression of KRAS, CCL2, and IL1B genes in public data (GSE43458) from the BATTLE trial [25,26]. Interestingly, mean KRAS/CCL2/IL1B expression was statistically significantly increased in smokers’ LUAD (n = 40) compared with never-smokers’ LUAD (n = 40) and normal lung tissue samples (n = 30) (Figure 7a). Since KRAS mutations are more frequent in the LUAD of smokers [27], this finding suggested that our inflammatory signature was overrepresented in tumors with higher KRAS mutation frequencies. This was also true in another dataset from patients with breast, colorectal, and lung cancer (GSE103512) [28], where mean KRAS/CCL2/IL1B expression was significantly higher in lung and colorectal cancer, which have higher KRAS mutation rates [4], compared with breast cancer (Figure 7b).
Finally, online Kaplan-Meier analyses (http://www.kmplot.com, accessed on 15 October 2021) [21] using lung cancer patient data were performed (Figure 7c). These revealed that in patients with LUAD (a tumor with high KRAS mutation frequency), high KRAS/CCL2/IL1B expression levels portended 93% increased odds of death regardless of smoking status (Figure 7c, upper left). By contrast, KRAS/CCL2/IL1B expression did not impact the survival of patients with squamous cell lung carcinoma (a tumor with low KRAS mutation frequency) (Figure 7c, upper right). When exclusively smokers were examined (thereby enriching the sample for KRAS-mutant patients), high KRAS/CCL2/IL1B expression levels portended 128% increased odds of death in LUAD (Figure 7c, lower left) and continued to have no impact on the survival of patients with squamous cell lung carcinoma (Figure 7c, lower right).
Taken together, these data suggested that KRAS/CCL2/IL1B transcripts are overexpressed in human KRAS-mutant cancers and detrimentally affect survival. Importantly, the proposed KRAS-driven inflammatory loop may be clinically relevant.

4. Discussion

We hypothesized that mutant KRAS (KRAS proto-oncogene, GTPase) dependence occurs non-cell-autonomously and that KRAS inhibitor effects are delivered in vivo. We used 30 cancer cell lines with different KRAS mutations and multiple in vitro assays to show that both pharmacologic and genetic KRAS inhibition is selectively effective against KRAS-mutant murine and human tumors in vivo. Using isogenic cell lines with intact or compromised mutant KRAS signaling, we identified a novel KRAS-mutation-specific transcriptome signature that is surprisingly dominated by inflammatory response genes, including CCL2 (C-C-motif chemokine ligand 2) and IL1B (interleukin-1 beta, IL-1β). We further employed several transgenic mouse strains and adoptive bone marrow transfer experiments to show that effective pharmacologic KRAS blockade in vivo is dependent on the presence of CCR2+ (C-C motif chemokine receptor 2) IL-1β-secreting myeloid cells in the tumor microenvironment. Finally, we showed that the KRAS blocker deltarasin acts to downregulate IL1R1 (interleukin-1 receptor 1) expression in KRAS-mutant tumor cells and that the proposed KRAS/CCL2/IL1B signature is enriched in human cancers with high KRAS mutation frequencies, in which it portends a dismal prognosis. Our results imply that conventional cell-based screens for the discovery and development of novel KRAS blockers might be suboptimal, and that IL-1β inhibition may be specifically effective against KRAS-mutant cancers.
A long line of evidence supports that homotypic two-dimensional cancer cell cultures are not optimal for the study of KRAS-dependence. Singh et al. established a “RAS-dependency index” in a large panel of human lung and pancreatic cancer cell lines, systematically addressing the variable of in vitro efficacy of KRAS inhibition [12]. Project DRIVE, a comprehensive synthetic lethality screen applying > 150,000 shRNAs on 7837 genes and 398 cancer cell lines (https://oncologynibr.shinyapps.io/drive/, accessed on 15 October 2021), identified no lethal interaction partners for KRAS in vitro, a finding that urged the authors to state: “… the data here raise the likelihood that no single synthetic lethal gene will be found across all KRAS mutant tumors … commonly used KRAS mutant models are not KRAS dependent, when interrogated as monolayer cell cultures … ablating KRAS dependence will need to carefully consider these findings …” [14]. Recently, Janes et al. developed ARS-1620, a new covalent G12C-specific KRAS inhibitor that is highly effective in vivo, but not in vitro [9]. The authors developed three-dimensional co-culture systems and state: “We use ARS-1620 to dissect oncogenic KRAS dependency and demonstrate that monolayer culture formats significantly underestimate KRAS dependency in vivo”. Despite the tremendous progress contributed by the above-referenced work, the mechanism(s) of the observed in vivo-restricted KRAS-dependence remained obscure prior to this report.
To this end, multiple lines of work support the notion that the paracrine effects of KRAS and other RAS oncogenes overshadow their cell-autonomous impact. A pioneering report identified how RAS oncogenes utilize paracrine IL-8 signaling to induce angiogenesis in vivo [13,29]. We determined how KRAS-mutant cancer cells depend on paracrine CCL2 signaling to myeloid cells, including mononuclear and mast cells, to induce vascular permeability and angiogenesis during malignant pleural effusion development [15,20]. In turn, myeloid-derived IL-1β was found to selectively trigger non-canonical nuclear factor (NF)-κΒ activation in KRAS-mutant cancer cells via IL1R1 and inhibitor of NF-κΒ kinase α (ΙΚΚα), with the latter presenting a marked therapeutic target in mouse models of pre-metastatic and advanced lung cancer [16,30]. Here, we showed how deltarasin functions to abrogate a mutant KRAS-initiated in vivo inflammatory loop of tumor-derived CCL2 and myeloid-secreted IL-1β by downregulating the IL1R1 expression of KRAS-mutant tumor cells and thereby abolishing their receptivity to myeloid IL-1β signals. We identified CCR2+ myeloid cells that provide IL-1β to the microenvironment of KRAS-mutant tumors and showed that they are required for mutant KRAS dependence in vivo. Data from syngeneic mouse models of global host Ccr2 and Il1b gene deficiency and of focal myeloid Ccr2 reconstitution are further supported by human cancer xenograft experiments in Rag2−/− (recombination activating gene 2) mice, which lack B- and T-cell function but feature intact myeloid cells [31], to collectively identify the proposed inflammatory loop that potentiates KRAS blockade. The growing evidence that KRAS is a key modulator of the inflammatory tumor microenvironment and immune escape was recently extensively reviewed by Hamarsheh and colleagues [32]. Interestingly, recent studies also indicate the association between KRAS mutation and anti-tumor immunity. For instance, the first approved KRASG12C inhibitor, sotorasib (AMG510), resulted in a pro-inflammatory tumor microenvironment in immune-compentent mice and anti-tumor activity in clinical trials [33], while oncogenic KRASG12D promotes a pro-inflammatory RAC1 (rac family small GTPase 1)/ROS (reactive oxygen species)/NLRP3 (NLR family pyrin domain containing 3)/IL-1β axis additionally to its canonical oncogenic driver function [34].
In addition to Kras, Ccl2, and Il1b, a battery of other transcripts originated within the signature of KRAS-mutant cancers derived from the transcriptomes of our cell lines, providing synthetic lethality candidates for in vivo KRAS dependency for future research. This signature includes signal transducers Ranbp3l (RAN binding protein 3 like), Gpr149 (G protein-coupled receptor 149), and Rassf8 (Ras association domain family member 8), inflammatory messengers Ccl7, Cxcl1 (C-X-C motif chemokine ligand 1), and Casp3 (caspase 3), cell surface receptors Pdgfra (platelet derived growth factor receptor alpha) and Ttk (TTK protein kinase), and cell cycle genes and tumor suppressors Cdca5 (cell division cycle associated 5), Hist2h3c2 (histone cluster 2 H3 family member C2), Plag1 (pleomorphic adenoma gene 1), Fanca (FA complementation group A), and Gmnn (geminin DNA replication inhibitor), among others. The importance of some of these candidates is worth mentioning: Cxcl1 was recently found to mediate the effects of KRAS-IKKα addiction during malignant pleural effusion development [16]; Casp3 is a central effector of compensatory tumor proliferation and radiotherapy resistance [35]; and Gmnn was recently found to function as a tumor suppressor in lung and colon cancer [36]. Surprisingly, Kras mutation status imprinted the transcriptomes of our cell lines more profoundly than their tissues of origin, causing them to cluster together in an unsupervised fashion. Furthermore, our KRAS-mutation signature was enriched in human KRAS-mutant cancers and predicted poor survival, a fact that further validates this gene set. Most importantly, the mutant KRAS signature was dominated by the inflammatory response pathway according to both WikiPathways analysis and GSEA, highlighting the notion that the oncogene functions in a proinflammatory fashion.
In addition to fostering the battle to drug KRAS, the present work bears significant clinical implications by pinning CCL2 and IL-1β as key inflammatory addiction partners of mutant KRAS. Although targeting CCL2 with neutralizing antibodies yielded promising preclinical results [15,20,37,38,39,40], clinical trials of the anti-human CCL2 antibody carlumab were hampered by limited drug efficacy and tolerability [41,42,43]. In contrast, targeting IL-1β with canakinumab has raised enthusiasm and holds great promise in cancer therapy. In this regard, the Canakinumab Anti-inflammatory Thrombosis Outcomes Study (CANTOS), a randomized trial on the role of IL-1β inhibition in atherosclerosis, secondarily aimed at establishing whether low (50 mg), medium (150 mg), or high (300 mg)-dose canakinumab given sc every three months might alter cancer incidence [44,45]. The results astonished, with total cancer mortality decreasing by 51% in the high-dose group, incident lung cancer decreasing by 39% in the medium-dose and by 67% in the high-dose groups, and lung cancer mortality decreasing by 77% in the high-dose group. Although our results showing diminished deltarasin efficacy with Il1b−/− mice were less impressive compared with the complete abrogation of deltarasin effects in Ccl2−/− mice, we believe that this is attributable to redundant IL-1α (interleukin-1 alpha) signaling in the former and that targeting IL-1β might be specifically effective against KRAS-mutant cancers [46,47,48,49,50]. This is plausible according to CANTOS results, since canakinumab effects in decreasing lung cancer incidence and mortality were double in current than in past smokers overall, and quadruple when the high-dose group was examined alone, with current smokers having higher KRAS mutation rates than never-smokers [4,25,26,27]. Our results suggest that canakinumab might be selectively effective against KRAS-mutant cancers and warrant an a posteriori analysis of CANTOS results with respect to KRAS mutation status. In addition, the inflammatory loop described herein needs to be tested and validated in a new molecular subtype of malignant pleural mesothelioma we recently discovered [51].

5. Conclusions

In summary, we showed that KRAS-mutant cancer cells express CCL2 and IL1R1 to initiate an inflammatory signaling loop with CCR2/IL-1β-expressing myeloid cells. Our work indicated that this crosstalk is required for KRAS-dependence and blockade, which targets IL1R1 expression. The data set a rational framework for the future development of effective KRAS inhibitors and design of clinical trials aimed at targeting IL-1β in cancer.

Supplementary Materials

The following are available online at https://www.mdpi.com/article/10.3390/biomedicines10030592/s1, Figure S1: Mutation status of cell lines used in this study, in vitro assays used in cancer research and comparative efficacy of KRAS versus tyrosine kinase inhibitors, Figure S2: Response of KRAS-mutant tumor cells to KRAS inhibitors analyzed via WST-1 assay, Figure S3: Response of KRAS-mutant tumor cells to KRAS inhibitors analyzed via colony formation assay, Figure S4: Uncropped blots for Figure 1h, Figure S5: Validation of pKrasG12C transduction in human cell lines H3122 and EKVX, Figure S6: Uncropped blots for Figure 3d; Table S1: Antibodies used in this study, Table S2: Oligonucleotides for qPCR, Table S3: Deltarasin effects on a battery of murine and human cancer cell lines, Table S4: AA12 effects on a battery of murine and human cancer cell lines, Table S5: Cysmethynil effects on a battery of murine and human cancer cell lines, Table S6: A 42-gene mutant KRAS signature identified from microarray analyses.

Author Contributions

Conceptualization, G.T.S. and A.C.S.; Data curation, K.A.M.A. and G.T.S.; Formal analysis, K.A.M.A., G.A.G., M.A.A.P. and G.T.S.; Funding acquisition, G.T.S.; Investigation, K.A.M.A., G.N., V.A., D.K., C.H., L.V.K. and A.-S.L.; Methodology, K.A.M.A., G.N., G.A.G. and M.A.A.P.; Project administration, G.T.S.; Resources, R.A.H., S.K. and G.T.S.; Supervision, G.T.S.; Visualization, A.C.S.; Writing—original draft, K.A.M.A.; Writing—review and editing, A.C.S. and G.T.S. All authors have read and agreed to the published version of the manuscript.

Funding

This research was funded by the European Research Council 2010 Starting Independent Investigator and 2015 Proof of Concept Grants (260524 and 679345, to GTS), and by a European Respiratory Society 2013 Romain Pauwels Research Award (to GTS).

Institutional Review Board Statement

The study was conducted according to the guidelines of the Declaration of Helsinki, and approved by the Veterinary Administration of the Prefecture of Western Greece (approval # 366456/1461) and by the Government of Upper Bavaria (approval # 55.2-1-54-2532-194-2016), and conducted according to Directive 2010/63/EU (http://eurlex.europa.eu/legal-content/EN/TXT/?uri=CELEX%3A32010L0063; last accessed: 15 October 2021).

Informed Consent Statement

Not applicable.

Data Availability Statement

All microarray data have been deposited at GEO (http://www.ncbi.nlm.nih.gov/geo/, Last accessed: 15 October 2021; Accession ID: GSE130624) and are accessible using the link https://www.ncbi.nlm.nih.gov/geo/query/acc.cgi?acc=GSE130624, Last accessed: 15 October 2021, (murine microarrays). Published studies that were re-analyzed are freely accessible using the links: https://www.ncbi.nlm.nih.gov/geo/query/acc.cgi?acc=GSE43458, Last accessed: 15 October 2021, https://www.ncbi.nlm.nih.gov/geo/query/acc.cgi?acc=GSE31852, Last accessed: 15 October 2021 and https://www.ncbi.nlm.nih.gov/geo/query/acc.cgi?acc=GSE103512, Last accessed: 15 October 2021.

Acknowledgments

The authors thank the University of Patras Center for Animal Models of Disease for experimental support.

Conflicts of Interest

The authors declare no conflict of interest.

References

  1. Esposito, D.; Stephen, A.G.; Turbyville, T.J.; Holderfield, M. New weapons to penetrate the armor: Novel reagents and assays developed at the NCI RAS Initiative to enable discovery of RAS therapeutics. Semin. Cancer Biol. 2019, 54, 174–182. [Google Scholar] [CrossRef] [PubMed]
  2. Downward, J. Targeting RAS signalling pathways in cancer therapy. Nat. Rev. Cancer 2003, 3, 11–22. [Google Scholar] [CrossRef] [PubMed]
  3. Stephen, A.G.; Esposito, D.; Bagni, R.K.; McCormick, F. Dragging ras back in the ring. Cancer Cell 2014, 25, 272–281. [Google Scholar] [CrossRef] [PubMed] [Green Version]
  4. Tate, J.G.; Bamford, S.; Jubb, H.C.; Sondka, Z.; Beare, D.M.; Bindal, N.; Boutselakis, H.; Cole, C.G.; Creatore, C.; Dawson, E.; et al. COSMIC: The Catalogue of Somatic Mutations in Cancer. Nucleic Acids Res. 2019, 47, D941–D947. [Google Scholar] [CrossRef] [PubMed] [Green Version]
  5. Simanshu, D.; Nissley, D.V.; McCormick, F. RAS Proteins and Their Regulators in Human Disease. Cell 2017, 170, 17–33. [Google Scholar] [CrossRef] [PubMed] [Green Version]
  6. Winter-Vann, A.M.; Baron, R.A.; Wong, W.; Cruz, J.D.; York, J.D.; Gooden, D.M.; Bergo, M.O.; Young, S.; Toone, E.J.; Casey, P.J. A small-molecule inhibitor of isoprenylcysteine carboxyl methyltransferase with antitumor activity in cancer cells. Proc. Natl. Acad. Sci. USA 2005, 102, 4336–4341. [Google Scholar] [CrossRef] [Green Version]
  7. Zimmermann, G.; Papke, B.; Ismail, S.; Vartak, N.; Chandra, A.; Hoffmann, M.; Hahn, S.; Triola, G.; Wittinghofer, A.; Bastiaens, P.I.H.; et al. Small molecule inhibition of the KRAS-PDEδ interaction impairs oncogenic KRAS signalling. Nature 2013, 497, 638–642. [Google Scholar] [CrossRef]
  8. Ostrem, J.M.; Peters, U.; Sos, M.L.; Wells, J.A.; Shokat, K.M. K-Ras(G12C) inhibitors allosterically control GTP affinity and effector interactions. Nature 2013, 503, 548–551. [Google Scholar] [CrossRef] [Green Version]
  9. Janes, M.R.; Zhang, J.; Li, L.-S.; Hansen, R.; Peters, U.; Guo, X.; Chen, Y.; Babbar, A.; Firdaus, S.J.; Darjania, L.; et al. Targeting KRAS Mutant Cancers with a Covalent G12C-Specific Inhibitor. Cell 2018, 172, 578–589. [Google Scholar] [CrossRef] [Green Version]
  10. Skoulidis, F.; Li, B.T.; Dy, G.K.; Price, T.J.; Falchook, G.S.; Wolf, J.; Italiano, A.; Schuler, M.; Borghaei, H.; Barlesi, F.; et al. Sotorasib for Lung Cancer with KRAS p.G12C Mutation. N. Engl. J. Med. 2021, 384, 2371–2381. [Google Scholar] [CrossRef]
  11. Blair, H.A. Sotorasib: First Approval. Drugs 2021, 81, 1573–1579. [Google Scholar] [CrossRef] [PubMed]
  12. Singh, A.; Greninger, P.; Rhodes, D.; Koopman, L.; Violette, S.; Bardeesy, N.; Settleman, J. A gene expression signature associated with “K-Ras addiction” reveals regulators of EMT and tumor cell survival. Cancer Cell 2009, 15, 489–500. [Google Scholar] [CrossRef] [PubMed] [Green Version]
  13. Sparmann, A.; Bar-Sagi, D. Ras-induced interleukin-8 expression plays a critical role in tumor growth and angiogenesis. Cancer Cell 2004, 6, 447–458. [Google Scholar] [CrossRef] [PubMed] [Green Version]
  14. McDonald, E.R., III; De Weck, A.; Schlabach, M.R.; Billy, E.; Mavrakis, K.J.; Hoffman, G.R.; Belur, D.; Castelletti, D.; Frias, E.; Gampa, K.; et al. Project DRIVE: A Compendium of Cancer Dependencies and Synthetic Lethal Relationships Uncovered by Large-Scale, Deep RNAi Screening. Cell 2017, 170, 577–592.e10. [Google Scholar] [CrossRef] [Green Version]
  15. Agalioti, T.; Giannou, A.D.; Krontira, A.; Kanellakis, N.I.; Kati, D.; Vreka, M.; Pepe, M.; Spella, M.; Lilis, I.; Zazara, D.E.; et al. Mutant KRAS promotes malignant pleural effusion formation. Nat. Commun. 2017, 8, 15205. [Google Scholar] [CrossRef]
  16. Marazioti, A.; Lilis, I.; Vreka, M.; Apostolopoulou, H.; Kalogeropoulou, A.; Giopanou, I.; Giotopoulou, G.A.; Krontira, A.C.; Iliopoulou, M.; Kanellakis, N.I.; et al. Myeloid-derived IL-1ß drives oncogenic KRAS-NF-kB addiction in malignant pleural effusion. Nat. Commun. 2018, 9, 672. [Google Scholar] [CrossRef] [Green Version]
  17. Giannou, A.D.; Marazioti, A.; Kanellakis, N.I.; Giopanou, I.; Lilis, I.; Zazara, D.E.; Ntaliarda, G.; Kati, D.; Armenis, V.; Giotopoulou, G.A.; et al. NRAS destines tumor cells to the lungs. EMBO Mol. Med. 2017, 9, 672–686. [Google Scholar] [CrossRef]
  18. Giopanou, I.; Lilis, I.; Papaleonidopoulos, V.; Agalioti, T.; Kanellakis, N.I.; Spiropoulou, N.; Spella, M.; Stathopoulos, G.T. Tumor–derived osteopontin isoforms cooperate with TRP53 and CCL2 to promote lung metastasis. Oncoimmunology 2017, 6, e1256528. [Google Scholar] [CrossRef] [Green Version]
  19. Kanellakis, I.N.; Giannou, A.D.; Pepe, A.A.M.; Agalioti, T.; Zazara, E.D.; Giopanou, I.; Psallidas, I.; Spella, M.; Μarazioti, A.; Arendt, K.A.M.; et al. Tobacco chemical-induced mouse lung adenocarcinoma cell lines pin the prolactin orthologue proliferin as a lung tumour promoter. Carcinogenesis 2019, 40, 1352–1362. [Google Scholar] [CrossRef]
  20. Giannou, A.D.; Marazioti, A.; Spella, M.; Kanellakis, N.I.; Apostolopoulou, H.; Psallidas, I.; Prijovich, Z.M.; Vreka, M.; Zazara, D.E.; Lilis, I.; et al. Mast cells mediate malignant pleural effusion formation. J. Clin. Invest. 2015, 125, 2317–2334. [Google Scholar] [CrossRef]
  21. Gyorffy, B.; Surowiak, P.; Budczies, J.; Lánczky, A. Online survival analysis software to assess the prognostic value of biomarkers using transcriptomic data in non-small-cell lung cancer. PLoS ONE 2013, 8, e82241. [Google Scholar] [CrossRef] [PubMed] [Green Version]
  22. Faul, F.; Erdfelder, E.; Lang, A.-G.; Buchner, A. G*Power 3: A flexible statistical power analysis program for the social, behavioral, and biomedical sciences. Behav. Res. Methods 2007, 39, 175–191. [Google Scholar] [CrossRef] [PubMed]
  23. Kelder, T.; van Iersel, M.P.; Hanspers, K.; Kutmon, M.; Conklin, B.R.; Evelo, C.T.; Pico, A.R. WikiPathways: Building research communities on biological pathways. Nucleic Acids Res. 2012, 40, D1301–D1307. [Google Scholar] [CrossRef] [PubMed] [Green Version]
  24. Subramanian, A.; Tamayo, P.; Mootha, V.K.; Mukherjee, S.; Ebert, B.L.; Gillette, M.A.; Paulovich, A.; Pomeroy, S.L.; Golub, T.R.; Lander, E.S.; et al. Gene set enrichment analysis: A knowledge-based approach for interpreting genome-wide expression profiles. Proc. Natl. Acad. Sci. USA 2005, 102, 15545–15550. [Google Scholar] [CrossRef] [Green Version]
  25. Kim, E.S.; Herbst, R.S.; Wistuba, I.I.; Lee, J.J.; Blumenschein, G.R., Jr.; Tsao, A.; Stewart, D.J.; Hicks, M.E.; Erasmus, J.; Gupta, S.; et al. The BATTLE trial: Personalizing therapy for lung cancer. Cancer Discov. 2011, 1, 44–53. [Google Scholar] [CrossRef] [Green Version]
  26. Kabbout, M.; Garcia, M.M.; Fujimoto, J.; Liu, D.D.; Woods, D.; Chow, C.-W.; Mendoza, G.; Momin, A.A.; James, B.P.; Solis, L.; et al. ETS2 mediated tumor suppressive function and MET oncogene inhibition in human non-small cell lung cancer. Clin. Cancer Res. 2013, 19, 3383–3395. [Google Scholar] [CrossRef] [Green Version]
  27. Campbell, J.D.; Alexandrov, A.; Kim, J.; Wala, J.; Berger, A.H.; Pedamallu, C.S.; Shukla, S.A.; Guo, G.; Brooks, A.N.; Murray, B.A.; et al. Distinct patterns of somatic genome alterations in lung adenocarcinomas and squamous cell carcinomas. Nat. Genet. 2016, 48, 607–616. [Google Scholar] [CrossRef] [Green Version]
  28. Brouwer-Visser, J.; Cheng, W.-Y.; Bauer-Mehren, A.; Maisel, D.; Lechner, K.; Andersson, E.; Dudley, J.T.; Milletti, F. Regulatory T-cell Genes Drive Altered Immune Microenvironment in Adult Solid Cancers and Allow for Immune Contextual Patient Subtyping. Cancer Epidemiol. Biomarkers Prev. 2018, 27, 103–112. [Google Scholar] [CrossRef] [Green Version]
  29. Karin, M. Inflammation and cancer: The long reach of Ras. Nat. Med. 2005, 11, 20–21. [Google Scholar] [CrossRef]
  30. Vreka, M.; Lilis, I.; Papageorgopoulou, M.; Giotopoulou, G.A.; Lianou, M.; Giopanou, I.; Kanellakis, N.I.; Spella, M.; Agalioti, T.; Armenis, V.; et al. IκB Kinase α Is Required for Development and Progression of KRAS-Mutant Lung Adenocarcinoma. Cancer Res. 2018, 78, 2939–2951. [Google Scholar] [CrossRef] [Green Version]
  31. Hao, Z.; Rajewsky, K. Homeostasis of peripheral B cells in the absence of B cell influx from the bone marrow. J. Exp. Med. 2001, 194, 1151–1164. [Google Scholar] [CrossRef] [PubMed]
  32. Hamarsheh, S.; Groß, O.; Brummer, T.; Zeiser, R. Immune modulatory effects of oncogenic KRAS in cancer. Nat. Commun. 2020, 11, 5439. [Google Scholar] [CrossRef] [PubMed]
  33. Canon, J.; Rex, K.; Saiki, A.Y.; Mohr, C.; Cooke, K.; Bagal, D.; Gaida, K.; Holt, T.; Knutson, C.G.; Koppada, N.; et al. The clinical KRAS(G12C) inhibitor AMG 510 drives anti-tumour immunity. Nature 2019, 575, 217–223. [Google Scholar] [CrossRef] [PubMed]
  34. Hamarsheh, S.; Osswald, L.; Saller, B.S.; Unger, S.; De Feo, D.; Vinnakota, J.M.; Konantz, M.; Uhl, F.M.; Becker, H.; Lübbert, M.; et al. Oncogenic KrasG12D causes myeloproliferation via NLRP3 inflammasome activation. Nat. Commun. 2020, 11, 1659. [Google Scholar] [CrossRef] [Green Version]
  35. Huang, Q.; Li, F.; Liu, X.; Li, W.; Shi, W.; Liu, F.-F.; O’Sullivan, B.; He, Z.; Peng, Y.; Tan, A.C.; et al. Caspase 3-mediated stimulation of tumor cell repopulation during cancer radiotherapy. Nat. Med. 2011, 17, 860–866. [Google Scholar] [CrossRef]
  36. Champeris Tsaniras, S.; Villiou, M.; Giannou, A.D.; Nikou, S.; Petropoulos, M.; Pateras, I.S.; Tserou, P.; Karousi, F.; Lalioti, M.-A.; Gorgoulis, V.G.; et al. Geminin ablation in vivo enhances tumorigenesis through increased genomic instability. J. Pathol. 2018, 246, 134–140. [Google Scholar] [CrossRef]
  37. Marazioti, A.; Kairi, C.A.; Spella, M.; Giannou, A.D.; Magkouta, S.; Giopanou, I.; Papaleonidopolous, V.; Kalomenidis, I.; Snyder, L.A.; Kardamakis, D.; et al. Beneficial impact of CCL2 and CCL12 neutralization on experimental malignant pleural effusion. PLoS ONE 2013, 8, e71207. [Google Scholar] [CrossRef] [Green Version]
  38. Qian, B.-Z.; Li, J.; Zhang, H.; Kitamura, T.; Zhang, J.; Campion, L.R.; Kaiser, E.A.; Snyder, L.A.; Pollard, J.W. CCL2 recruits inflammatory monocytes to facilitate breast-tumour metastasis. Nature 2011, 475, 222–225. [Google Scholar] [CrossRef] [Green Version]
  39. Fridlender, Z.G.; Buchlis, G.; Kapoor, V.; Cheng, G.; Sun, J.; Singhal, S.; Crisanti, M.C.; Wang, L.-C.S.; Heitjan, D.; Snyder, L.A.; et al. CCL2 blockade augments cancer immunotherapy. Cancer Res. 2010, 70, 109–118. [Google Scholar] [CrossRef] [Green Version]
  40. Loberg, R.D.; Ying, C.; Craig, M.; Day, L.L.; Sargent, E.; Neeley, C.; Wojno, K.; Snyder, L.A.; Yan, L.; Pienta, K.J. Targeting CCL2 with systemic delivery of neutralizing antibodies induces prostate cancer tumor regression in vivo. Cancer Res. 2007, 67, 9417–9424. [Google Scholar] [CrossRef] [Green Version]
  41. Brana, I.; Calles, A.; Lorusso, P.M.; Yee, L.K.; Puchalski, T.A.; Seetharam, S.; Zhong, B.; De Boer, C.J.; Tabernero, J.; Calvo, E. Carlumab, an anti-C-C chemokine ligand 2 monoclonal antibody, in combination with four chemotherapy regimens for the treatment of patients with solid tumors: An open-label, multicenter phase 1b study. Target Oncol. 2015, 10, 111–123. [Google Scholar] [CrossRef] [PubMed]
  42. Sandhu, S.K.; Papadopoulos, K.; Fong, P.C.; Patnaik, A.; Messiou, C.; Olmos, D.; Wang, G.; Tromp, B.J.; Puchalski, T.A.; Balkwill, F.; et al. A first-in-human, first-in-class, phase I study of carlumab (CNTO 888), a human monoclonal antibody against CC-chemokine ligand 2 in patients with solid tumors. Cancer Chemother. Pharmacol. 2013, 71, 1041–1050. [Google Scholar] [CrossRef] [PubMed]
  43. Pienta, K.J.; Machiels, J.-P.; Schrijvers, D.; Alekseev, B.; Shkolnik, M.; Crabb, S.J.; Li, S.; Seetharam, S.; Puchalski, T.A.; Takimoto, C.; et al. Phase 2 study of carlumab (CNTO 888), a human monoclonal antibody against CC-chemokine ligand 2 (CCL2), in metastatic castration-resistant prostate cancer. Invest. New Drugs 2013, 31, 760–768. [Google Scholar] [CrossRef]
  44. Ridker, P.M.; Everett, B.M.; Thuren, T.; MacFadyen, J.G.; Chang, W.H.; Ballantyne, C.; Fonseca, F.; Nicolau, J.; Koenig, W.; Anker, S.D.; et al. CANTOS Trial Group. Antiinflammatory Therapy with Canakinumab for Atherosclerotic Disease. N. Engl. J. Med. 2017, 377, 1119–1131. [Google Scholar] [CrossRef] [PubMed]
  45. Ridker, P.M.; MacFadyen, J.G.; Thuren, T.; Everett, B.M.; Libby, P.; Glynn, R.J.; Group, C.T. Effect of interleukin–1β inhibition with canakinumab on incident lung cancer in patients with atherosclerosis: Exploratory results from a randomised, double–blind, placebo–controlled trial. Lancet 2017, 390, 1833–1842. [Google Scholar] [CrossRef]
  46. Song, X.; Voronov, E.; Dvorkin, T.; Fima, E.; Cagnano, E.; Benharroch, D.; Shendler, Y.; Bjorkdhal, O.; Segal, S.; Dinarello, C.A.; et al. Differential effects of IL–1 alpha and IL–1 beta on tumorigenicity patterns and invasiveness. J. Immunol. 2003, 171, 6448–6456. [Google Scholar] [CrossRef]
  47. Voronov, E.; Shouval, D.S.; Krelin, Y.; Cagnano, E.; Benharroch, D.; Iwakura, Y.; Dinarello, C.A.; Apte, R.N. IL–1 is required for tumor invasiveness and angiogenesis. Proc. Natl. Acad. Sci. USA 2003, 100, 2645–2650. [Google Scholar] [CrossRef] [Green Version]
  48. Voigt, C.; May, P.; Gottschlich, A.; Markota, A.; Wenk, D.; Gerlach, I.; Voigt, S.; Stathopoulos, G.T.; Arendt, K.A.M.; Heise, C.; et al. Cancer cells induce interleukin-22 production from memory CD4+T cells via interleukin-1 to promote tumor growth. Proc. Natl. Acad. Sci. USA 2017, 114, 12994–12999. [Google Scholar] [CrossRef] [Green Version]
  49. Apte, R.N.; Voronov, E. Is interleukin-1 a good or bad ‘guy’ in tumor immunobiology and immunotherapy? Immunol. Rev. 2008, 222, 222–241. [Google Scholar] [CrossRef]
  50. Dinarello, C.A.; Simon, A.; van der Meer, J.W.M. Treating inflammation by blocking interleukin-1 in a broad spectrum of diseases. Nat. Rev. Drug Discov. 2012, 11, 633–652. [Google Scholar] [CrossRef] [Green Version]
  51. Marazioti, A.; Krontira, A.C.; Behrend, S.J.; Giotopoulou, G.A.; Ntaliarda, G.; Blanquart, C.; Bayram, H.; Iliopolou, M.; Vreka, M.; Trassl, L.; et al. KRAS signaling in malignant pleural mesothelioma. EMBO Mol. Med. 2022, 14, e13631. [Google Scholar] [CrossRef] [PubMed]
Figure 1. Pharmacologic evidence for KRAS mutation-independence in vitro. Different mouse and human tumor cell lines with (red) and without (black) Kras/KRAS mutations (codon changes are given in parentheses) were assessed for cell viability via colorimetric WST-8-assay, for colony formation via crystal violet-stained colony counts, and for ERK phosphorylation via phospho (p)- and total (t)-ERK immunoblots after 72-h treatments with three different KRAS inhibitors (n = 3/data-point). (a) Graphical scheme displaying molecular targets of preclinical KRAS inhibitors AA12, cysmethynil, and deltarasin. 3D protein structures obtained from RCSB PDB: human KRASWT (5VQ8, black), human KRASG12C (4LDJ, red). (bd) IC50 of deltarasin (b), AA12 (c), and cysmethynil (d) as assessed via WST-8 assay. (e,f) Representative images of colonies after saline or IC60 deltarasin treatment (e) and colony survival fraction (f) after IC60 deltarasin, normalized to saline treatment. (g,h) Quantification of normalized p-ERK/t-ERK signal change after IC60 deltarasin, normalized to GAPDH (g) and representative immunoblots (h). (bd,f,g) Data presented as mean ± SD. Grey lines represent the mean of all cell lines tested, which was used to dichotomize cell lines into sensitive and resistant. p, probability according to Fisher’s exact test for cross-tabulation of Kras/KRAS mutation status to drug sensitivity/resistance. KRAS, KRAS proto-oncogene GTPase; WT, wild-type; GAPDH, glyceraldehyde 3-phosphate dehydrogenase; ERK, extracellular-signal regulated kinase.
Biomedicines 10 00592 g001
Figure 2. Deltarasin-mediated demonstration of KRAS mutation-dependence in vivo. Different mouse and human tumor cell lines with ((a); KRASMUT) and without ((b); KRASWT) endogenous Kras/KRAS mutations (codon changes are given in parentheses), as well as KRASWT cell lines forcedly expressing a plasmid encoding mutant murine KrasG12C ((c); pKrasG12C), were injected into the rear flank (106 tumor cells sc) of C57BL/6 (LLC, B16F10, and PANO2 cells), FVB (FULA1 cells), or Rag2−/− (H460 and EKVX cells) mice. After tumor establishment (tumor volume > 100 mm3; arrows), mice were randomly allocated to daily ip treatments with 100 μL saline (black) or 15 mg/ Kg deltarasin in 100 μL saline (red). Tumor growth was assessed by measuring three vertical tumor dimensions. Data presented as mean ± SD. n, sample size; p, overall probability, two-way ANOVA; ns, **, and ***: p > 0.05, p < 0.01, and p < 0.001, respectively, Bonferroni post-test. Rag2, recombination activating gene 2; sc, subcutaneously; ip, intraperitoneal.
Biomedicines 10 00592 g002
Figure 3. Genetic manipulation of Kras reveals in vivo-restricted KRAS dependence. (a) Different murine parental (black/grey: stably expressing random shRNA, shC, or control plasmid, pC) or Kras-modified (red: stably expressing shKras; green: stably expressing mutant KrasG12C plasmid, pKrasG12C) tumor cell lines were assessed for cell viability (IC50 via WST-8-assay; n = 2–4/data-point) after 72 h of deltarasin treatment. (b) Summary of averaged deltarasin IC50 values from all cell lines from (a) (n = 2–3 cell lines/group). (c) Human parental (black/grey: stably expressing control plasmid pC) or KRAS-modified (green: stably expressing pKrasG12C) tumor cell lines were assessed for cell viability via WST-8 assay (n = 2–5/data-point) after 72 h of deltarasin treatment. (d) Immunoblots of cell lines from (a) for p-ERK, t-ERK and GAPDH. (e) Quantification of normalized p-ERK/t-ERK signal from (d). Data were summarized by mutation status and origin. (f) The five cell line doublets from (a) were injected into the rear flank (106 tumor cells sc) of C57BL/6 mice for induction of flank tumors via genetically modified cells (red, shKras; green, pKrasG12C) or control cells (black, shC or pC). p, overall probability according to one-way (ac) and two-way (e,f) ANOVA. ns, **, and ***: p > 0.05, p < 0.01, and p < 0.001, respectively, for the indicated comparisons via Bonferroni post-tests. Data are presented as mean ± SD.
Biomedicines 10 00592 g003
Figure 4. A 42-gene inflammatory signature of KRAS-dependence. (a) Unsupervised hierarchical clustering of gene expression of Kras-mutant and Kras-WT cancer cell lines, as well as benign cells and tissues. (b) Venn diagram of analytical strategy of transcriptome analysis. (c) Unsupervised hierarchical clustering of gene expression of Kras-modified cancer cell line doublets revealing co-clustering of Il1r1 (interleukin-1 receptor 1) and Ccl2 (C-C-motif chemokine ligand 2). (d) WikiPathway analysis showing pathways significantly overrepresented in the KRAS signature. (e) GSEA of 37 human orthologues of the murine KRAS signature against the Broad Institute’s 50 hallmark signatures, showing positive enrichment in the “inflammatory response” and negative enrichment in the “G2M checkpoint” signatures. NES, normalized enrichment score; p, family-wise error rate probability. (f) GSEA of 37 human orthologues of the murine KRAS signature against KRAS- (n = 21) versus EGFR-mutant (n = 17) lung adenocarcinomas (LUAD) from BATTLE revealing positive enrichment of our KRAS signature in human KRAS-mutant LUAD. NES, normalized enrichment score; p, family-wise error rate probability; EGFR, epidermal growth factor receptor.
Biomedicines 10 00592 g004
Figure 5. A requirement for host Ccr2 and IL1b for KRAS dependence in vivo. (a) Graphical scheme of the proposed mechanism of in vivo restricted KRAS dependence. (b) Representative image of CCR2/IL-1β-co-staining of a KRAS-mutant tumor from a Rag2−/− mouse showing co-localization of the two proteins in the tumor stroma. Image was taken using an AxioImager.M2 (Zeiss; Jena, Germany) with a 60× objective. (c) Syngeneic C57BL/6 mice competent (WT) or deficient (Il1b−/−, Ccr2−/−) [18,20] in the Il1b and Ccr2 genes or haplo/diplo-insufficient in the Cxcr1 and Cxcr2 chemokine receptor genes (Cxcr1−/−, Cxcr2+/−) received 106 LLC cells (KrasG12C) sc followed by daily ip saline (black) or 15 mg/Kg deltarasin (red) treatments initiated when tumors reached 100 mm3 volumes (arrows). Data are presented as mean ± SD. p, overall probabilities according to two-way ANOVA; ns, *, and ***: p > 0.05, p < 0.05, and p < 0.001 for the indicated comparisons via Bonferroni post-tests. Table shows animal numbers used and percentile tumor inhibition by deltarasin compared with saline. Ccr2, C-C motif chemokine receptor; IL-1β, interleukin-1 beta; Cxcr1/Cxcr2, C-X-C motif chemokine receptor 1/2.
Biomedicines 10 00592 g005
Figure 6. In vivo KRAS-dependence requires myeloid Ccr2 and is abolished by deltarasin treatment via downregulation of IL1R1 expression in KRAS-mutant cancer cells. (a) Total-body-irradiated (900 Rad) Ccr2−/− mice received adoptive BMT from WT or Ccr2−/− donors (all back-crossed > F12 to the FVB strain). After one month allowed for chimeric bone marrow reconstitution, chimeras received 106 syngeneic FULA1 cells (KrasQ61R) sc [19]. Daily ip saline or deltarasin (15 mg/Kg in saline) treatments were started when tumors > 100 mm3 were established (arrow). Data are presented as mean ± SD. p, overall probabilities according to two-way ANOVA; ***: p < 0.001 for the indicated comparisons via Bonferroni post-tests. (b) Il1r1/IL1R1 mRNA expression via qPCR (top) and CCL2 protein secretion via ELISA (bottom) of mouse (left) and human (right) cancer cell lines treated with saline or deltarasin IC60 for 72 h. Data are presented as mean ± SD. p, overall probabilities according to two-way ANOVA; ns, *, and ***: p > 0.05, p < 0.05 and p < 0.001, respectively, for the indicated comparisons via Bonferroni post-tests.
Biomedicines 10 00592 g006
Figure 7. Mean expression of KRAS/CCL2/IL1B is increased in KRAS-mutant cancers and predicts poor survival. (a) Average KRAS/CCL2/IL1B expression normalized to ACTB in lung adenocarcinomas (LUAD) from smokers and never-smokers and normal lung tissue from never-smokers from the BATTLE study (GSE43458) [25,26]. (b) KRAS/CCL2/IL1B expression normalized to ACTB in breast, non-small cell lung, and colorectal cancer (ROCHE study GSE103512). KRAS mutation frequencies of these tumor types are from COSMIC [4]. (c) Kaplan-Meier analyses of lung cancer patients stratified by average KRAS/CCL2/IL1B expression performed using http://www.kmplot.com, accessed on 15 October 2021 [21]. KRAS mutation frequencies are from the Campbell cohort [27]. Top: all patients; Bottom: ever-smokers only. (a,b) Data are presented as violin plots. p, overall probability according to one-way ANOVA. ns, *, **, and ***: p > 0.05, p < 0.05, p < 0.01, and p < 0.001, respectively, for the indicated comparisons via Bonferroni post-tests. ACTB, beta-actin.
Biomedicines 10 00592 g007
Publisher’s Note: MDPI stays neutral with regard to jurisdictional claims in published maps and institutional affiliations.

