
The Impact of Cerebral Perfusion on Mesenchymal Stem Cells Distribution after Intra-Arterial Transplantation: A Quantitative MR Study

 , , , , ,
  ,
, 
Abstract
:1. Introduction
2. Materials and Methods
2.1. Cell Culture
2.2. Animals
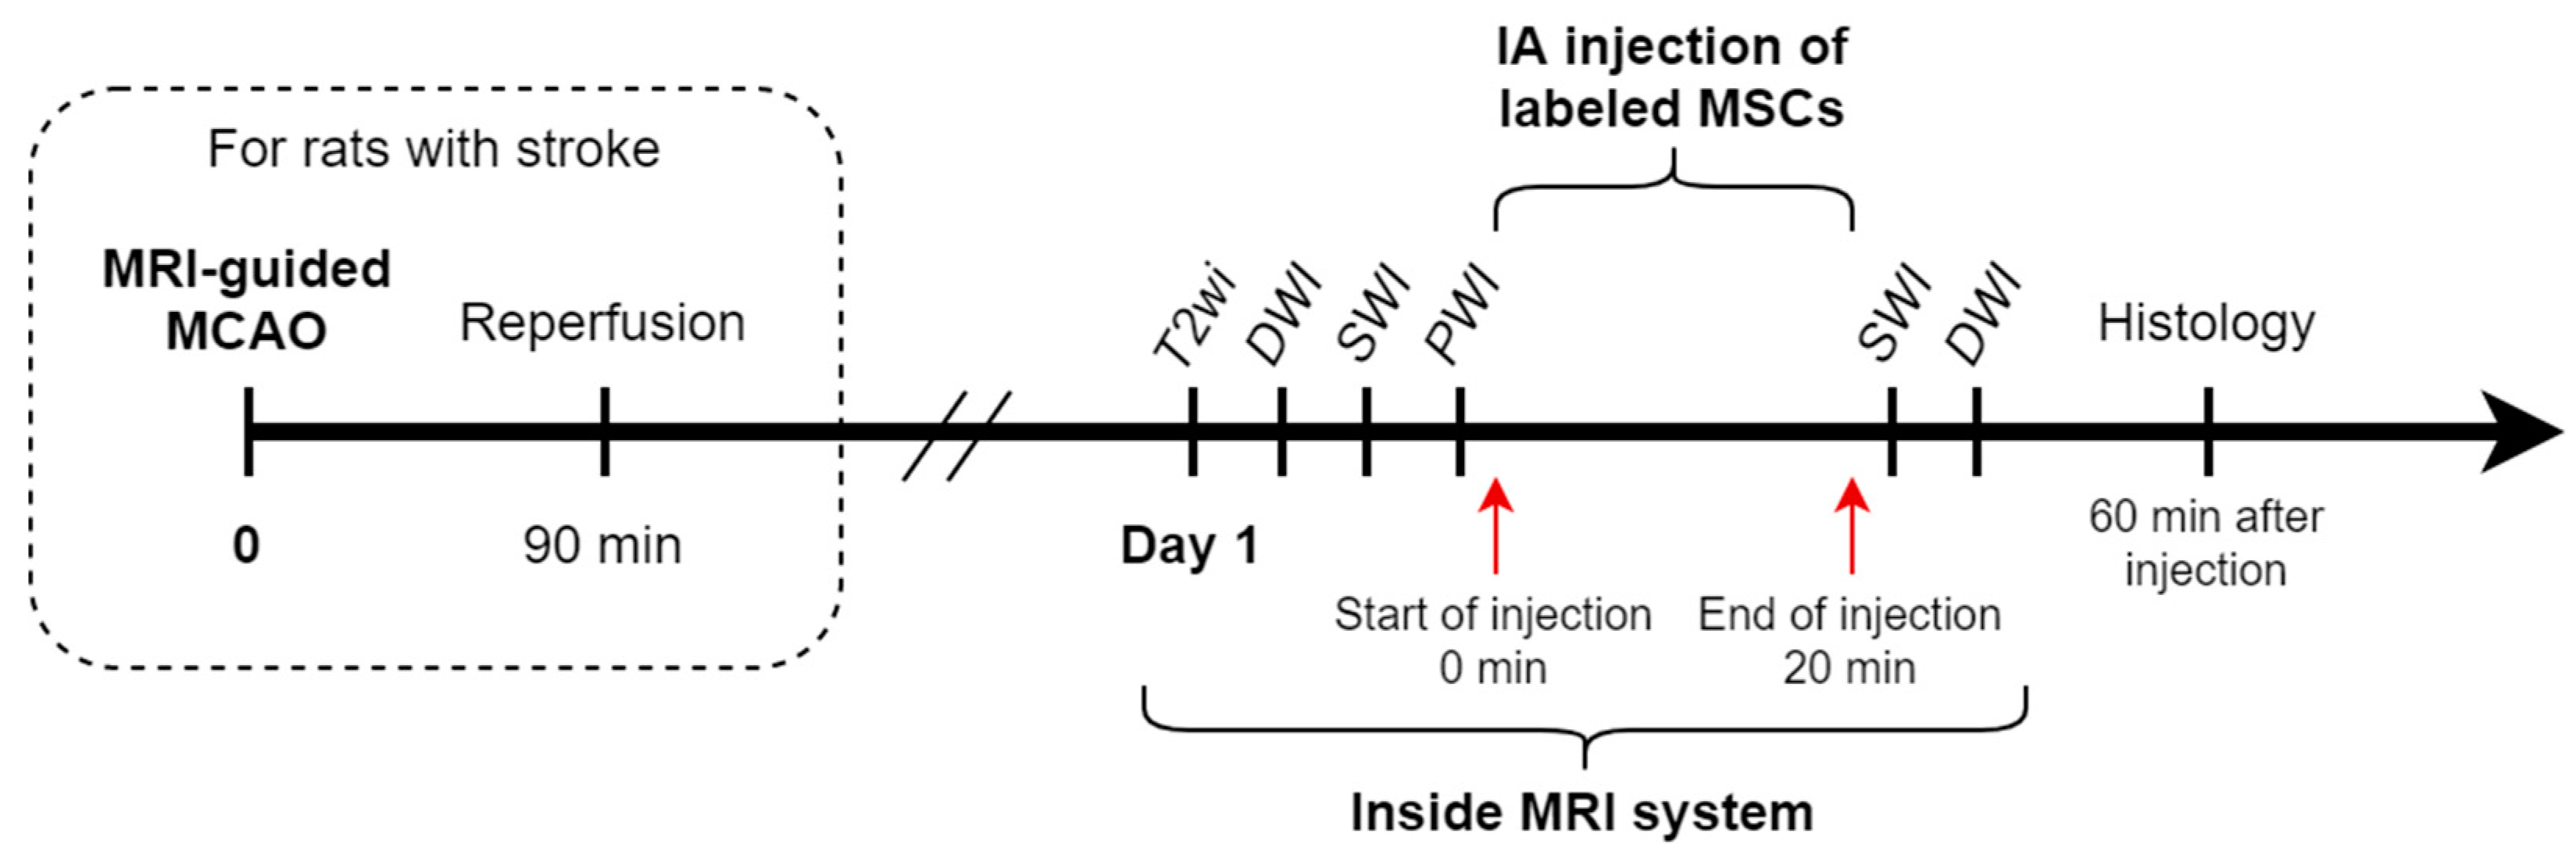
2.3. Study Design
2.4. Transient Middle Cerebral Artery Occlusion Model
2.5. Cell Transplantation
2.6. MRI
2.7. Data Analysis
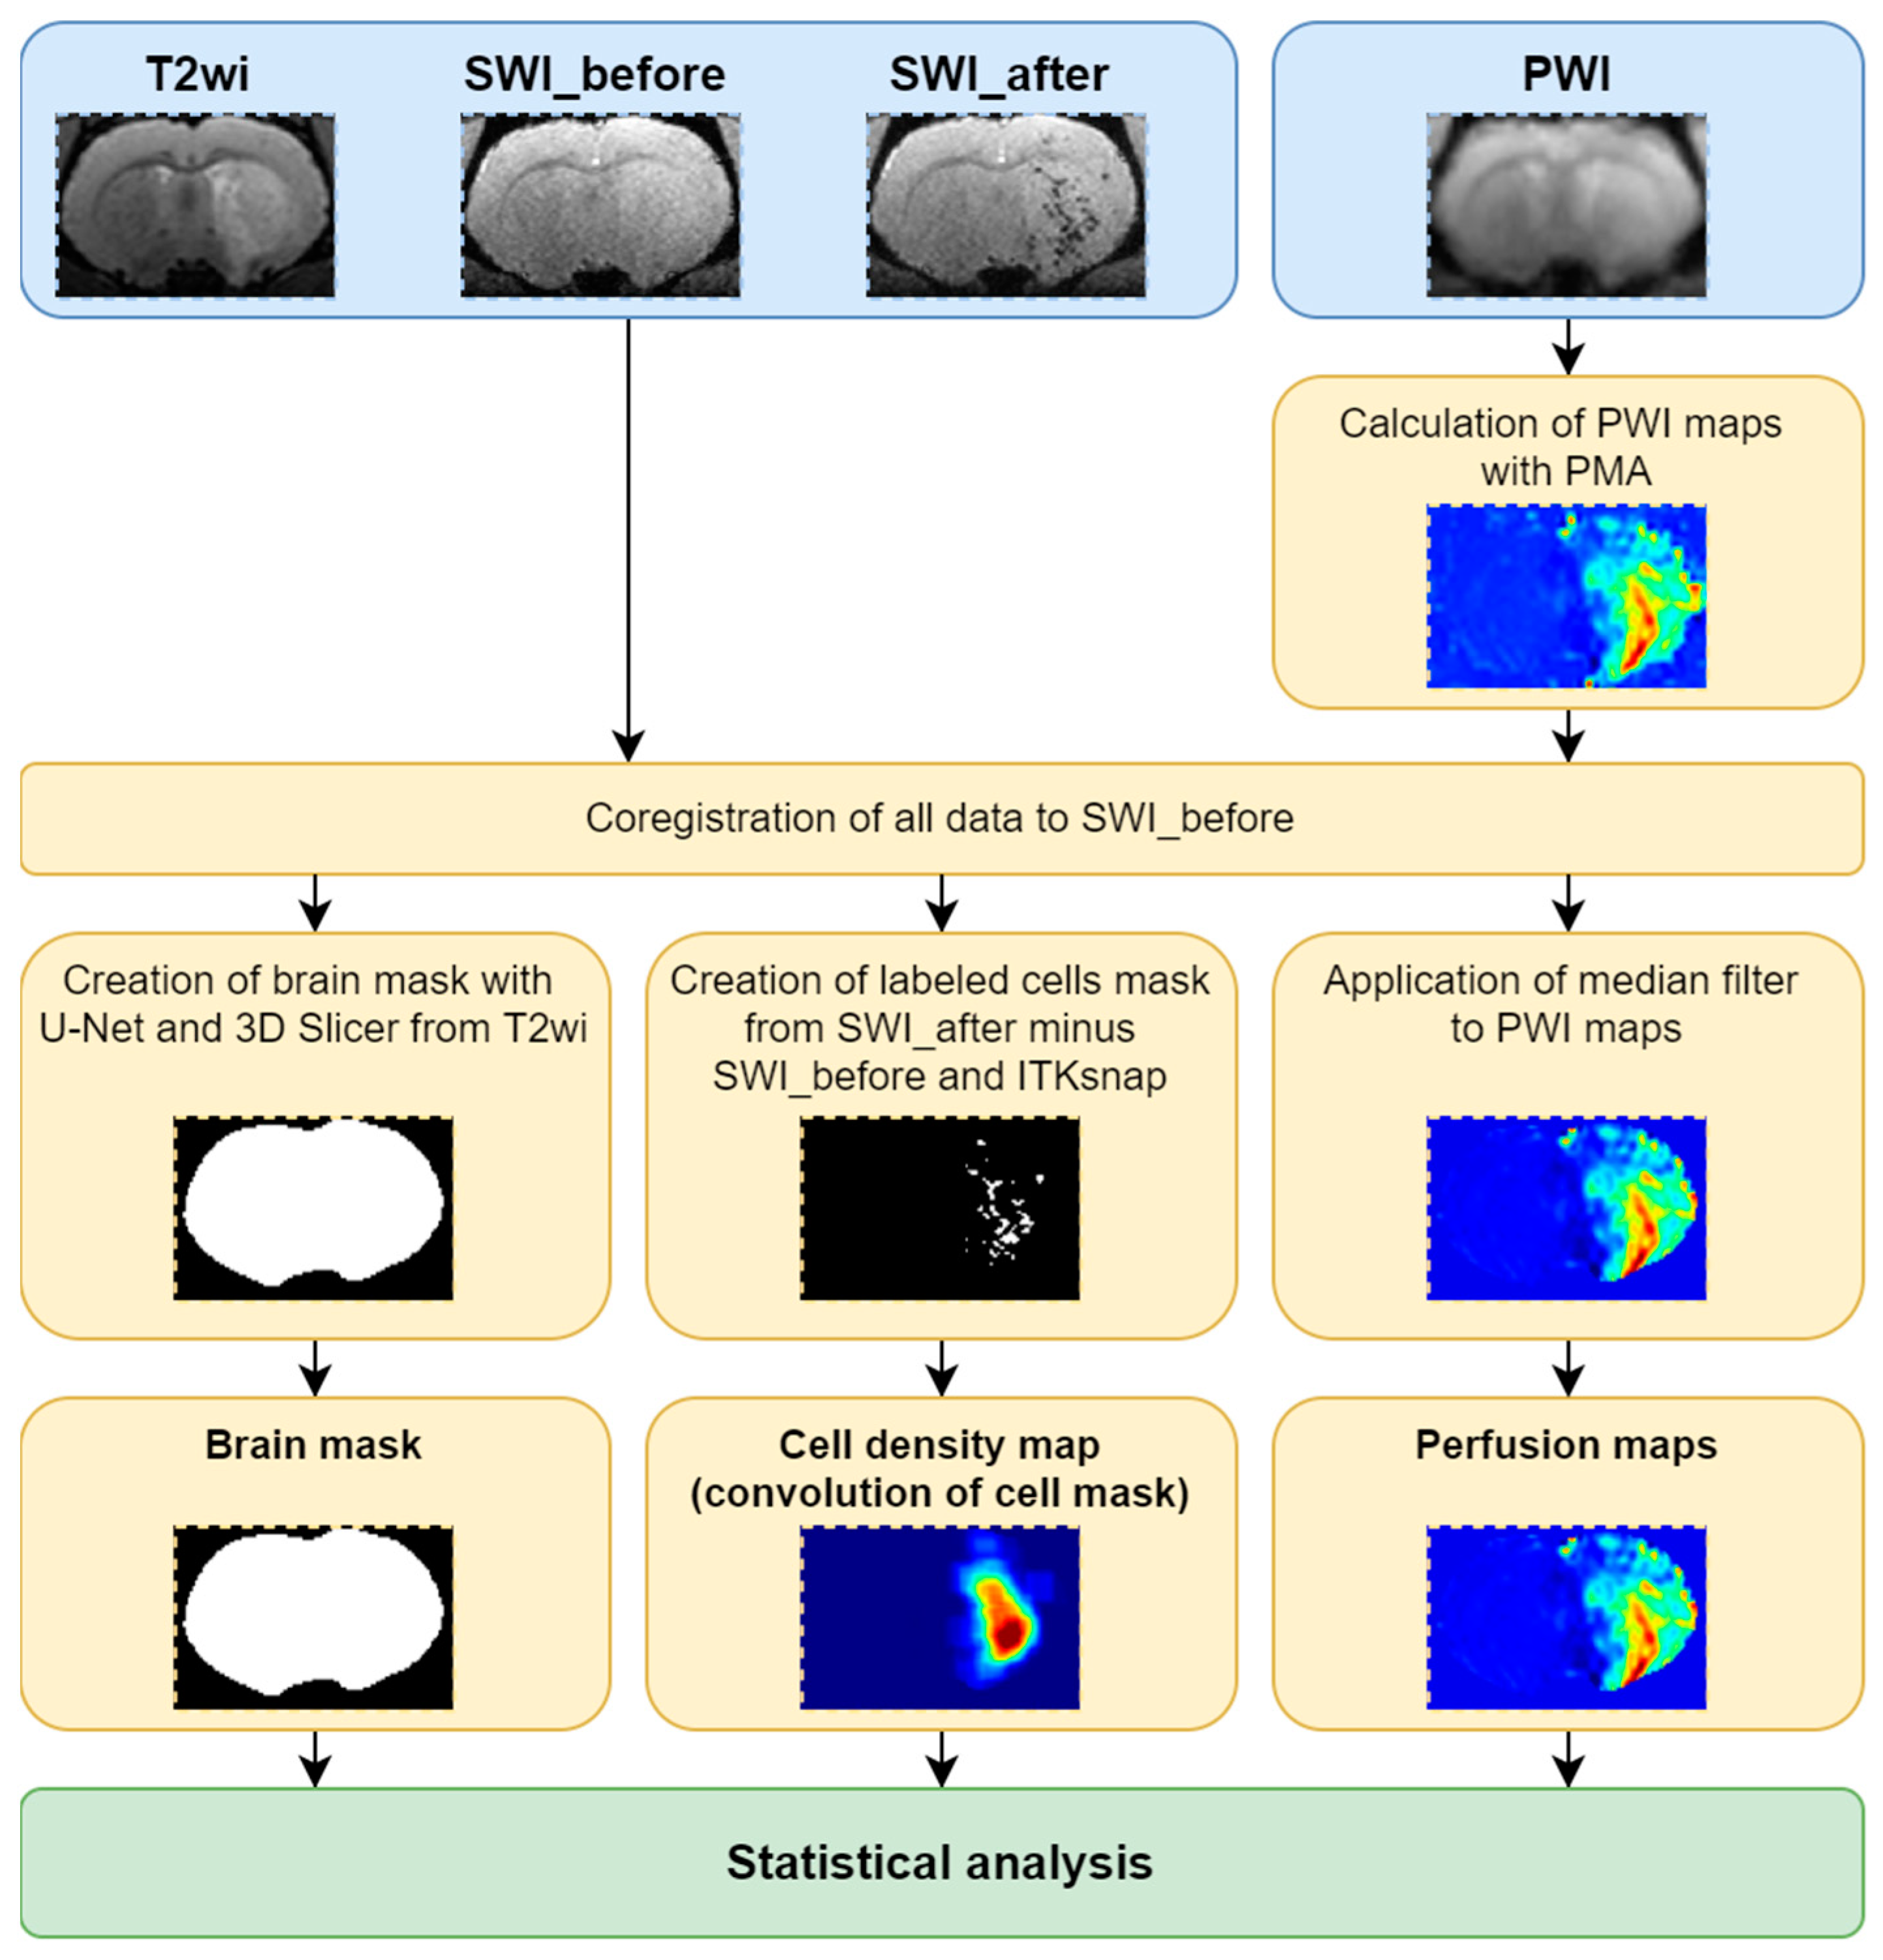
- All data were sorted and PWI maps were obtained using perfusion mismatch analyzer (PMA version 5.0.5358.55864, http://asist.umin.jp/ access date 20 November 2021) software (copyright owner: Kohsuke Kudo) provided by ASIST-JAPAN. Maps presenting the following basic parameters were calculated before deconvolution (Figure 3):
- Time to peak (TTP)-is the time to reach a peak of contrast bolus;
- Normalized signal drop (ΔS/S or dSoverS)-the relative difference between pre-contrast signal intensity and the lowest signal intensity during the passage of contrast bolus;
- Maximum slope (MS)-the maximum ratio of signal intensity changes to time;
- Cerebral blood volume (CBV-AUC)-area under the curve;
- Additional maps presenting the following basic parameters were calculated after deconvolution analysis based on standard singular value decomposition (sSVD):
- Cerebral blood flow (CBF-sSVD)-the volume of blood passing through unit volume of brain tissue in one minute;
- Cerebral blood volume (CBV-sSVD)-the volume of blood in brain tissue;
- Mean transit time (MTT-sSVD)-length of time during which a certain volume of blood is spent in the cerebral capillary circulation;
- TTP of residue function (Tmax-sSVD)-the time to a maximum of the residue function obtained by deconvolution.
- All data were converted to NIfTI file format.
- The PWI raw data were registered to the first SWI (acquired before the cells’ injection) and the transformation matrix was saved.
- All PWI maps were registered to the first SWI using calculated transformation matrix.
- The second SWI acquired after cells’ injection was registered to the first SWI.
- The cell distribution mask was calculated by finding differences between the first and second SWI.
- Whole brain segmentation was performed using the U-Net skull stripping tool [27].
- Obtained brain mask was resampled to the first SWI.
- The brain mask was cleaned with 3D Slicer (https://www.slicer.org/ access date 20 November 2021 [28]).
- The cell distribution mask was cropped by the brain mask.
- The cell distribution mask was finally cleaned with ITK-SNAP (http://www.itksnap.org/ access date 20 November 2021 [29]).
- Filtered PWI maps were corrupted by the brain mask.
- The cell distribution density map, was calculated with convolution and application of a median filter to PWI maps was performed.
- The brain mask, cell distribution density map and filtered PWI maps were used for statistical analysis.
2.8. Statistical Analysis
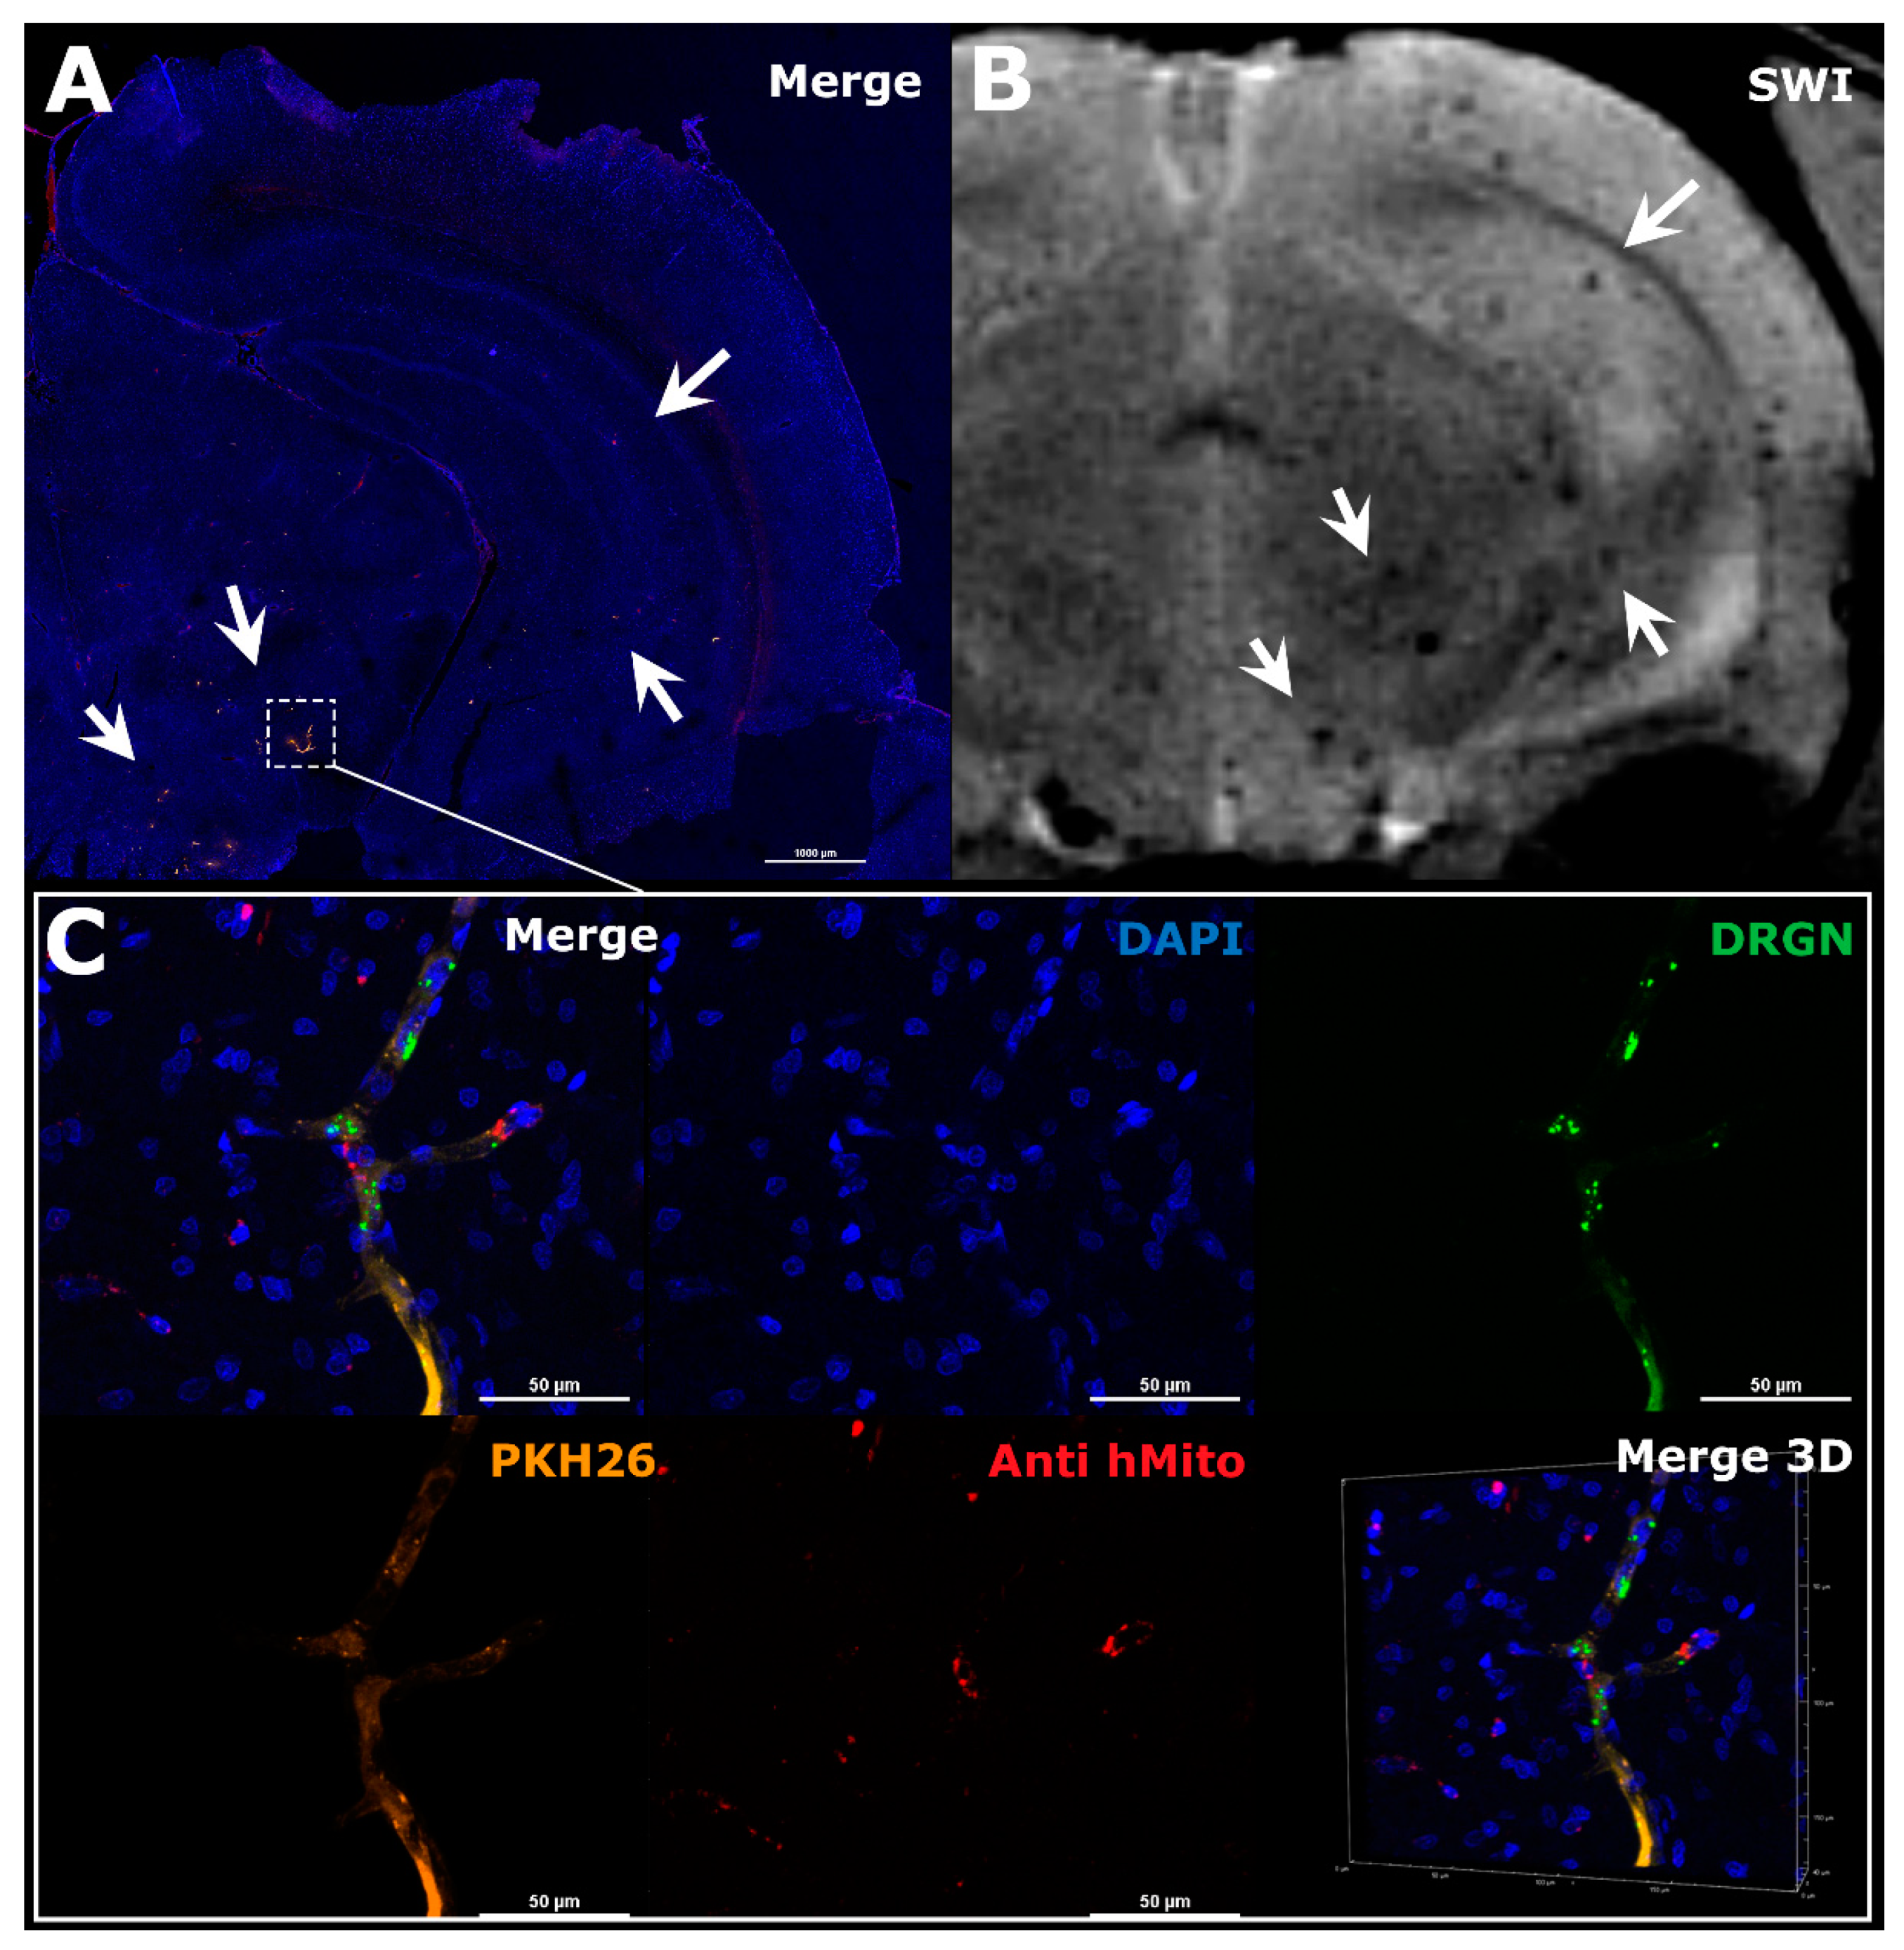
2.9. Immunocytochemistry and Microscopy
3. Results
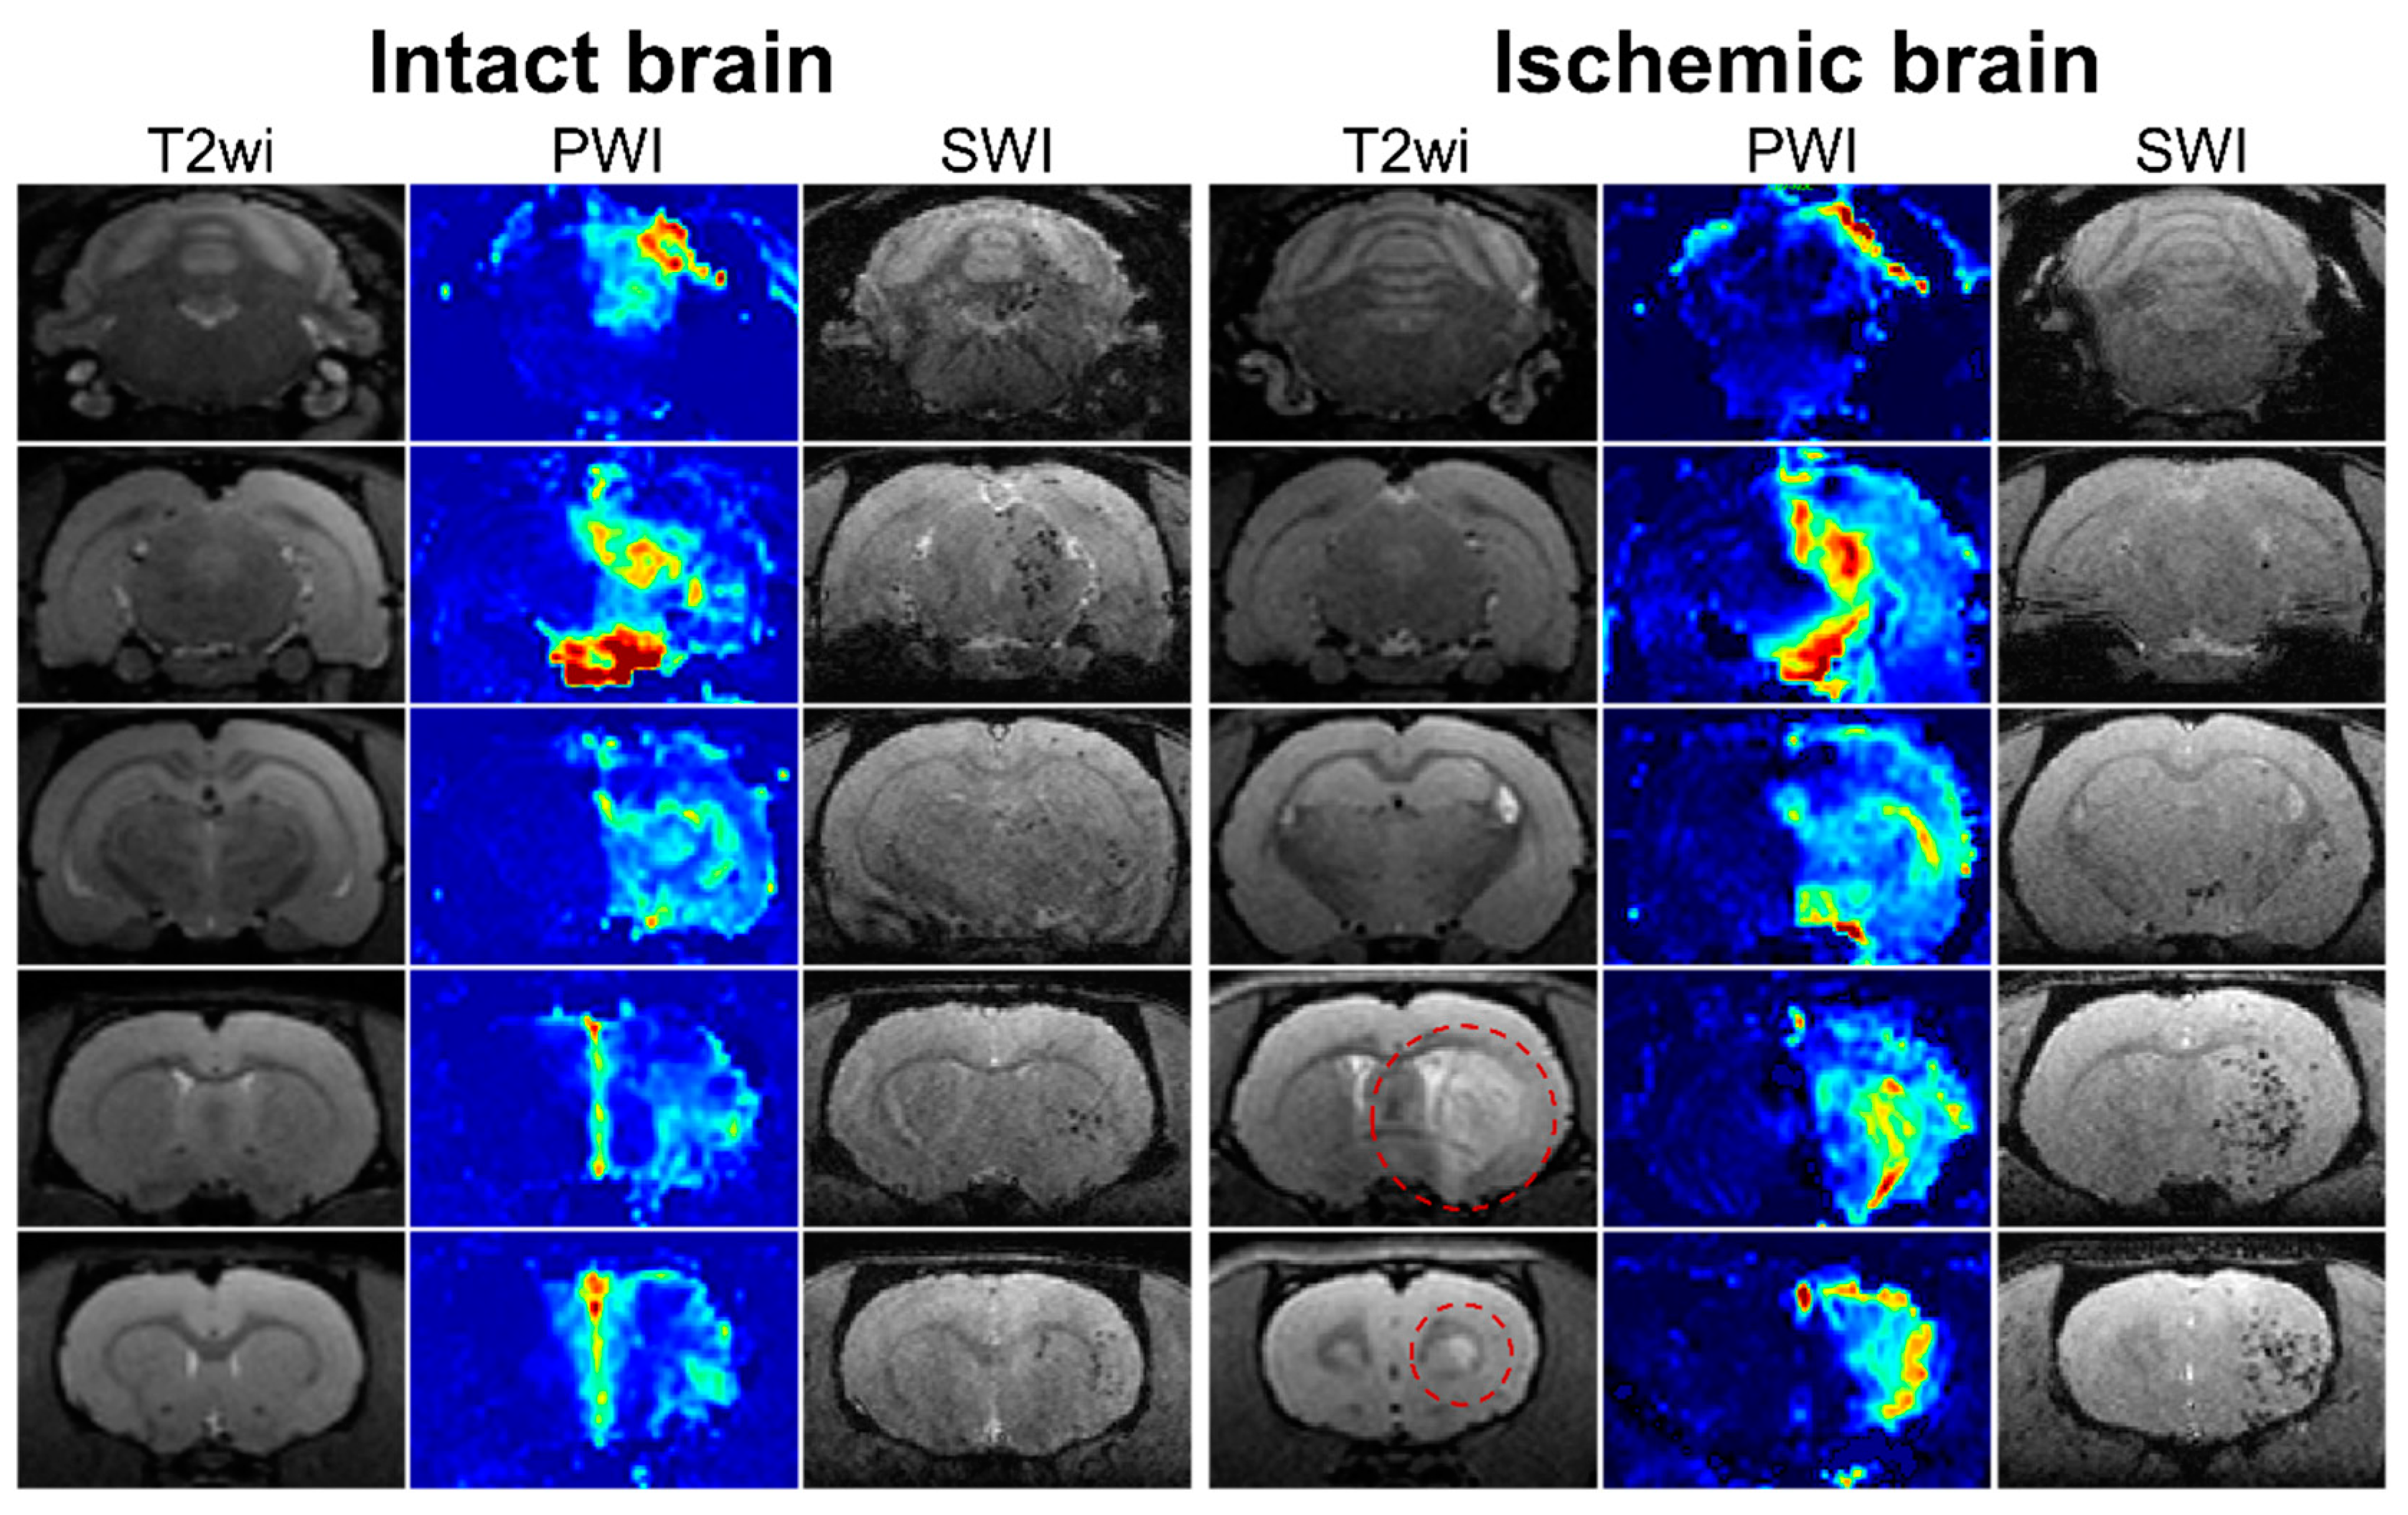
3.1. Visualization of MSCs Distribution in Rat Brain and Perfusion Maps
3.2. Evaluation of the Difference between the Two Experimental Groups
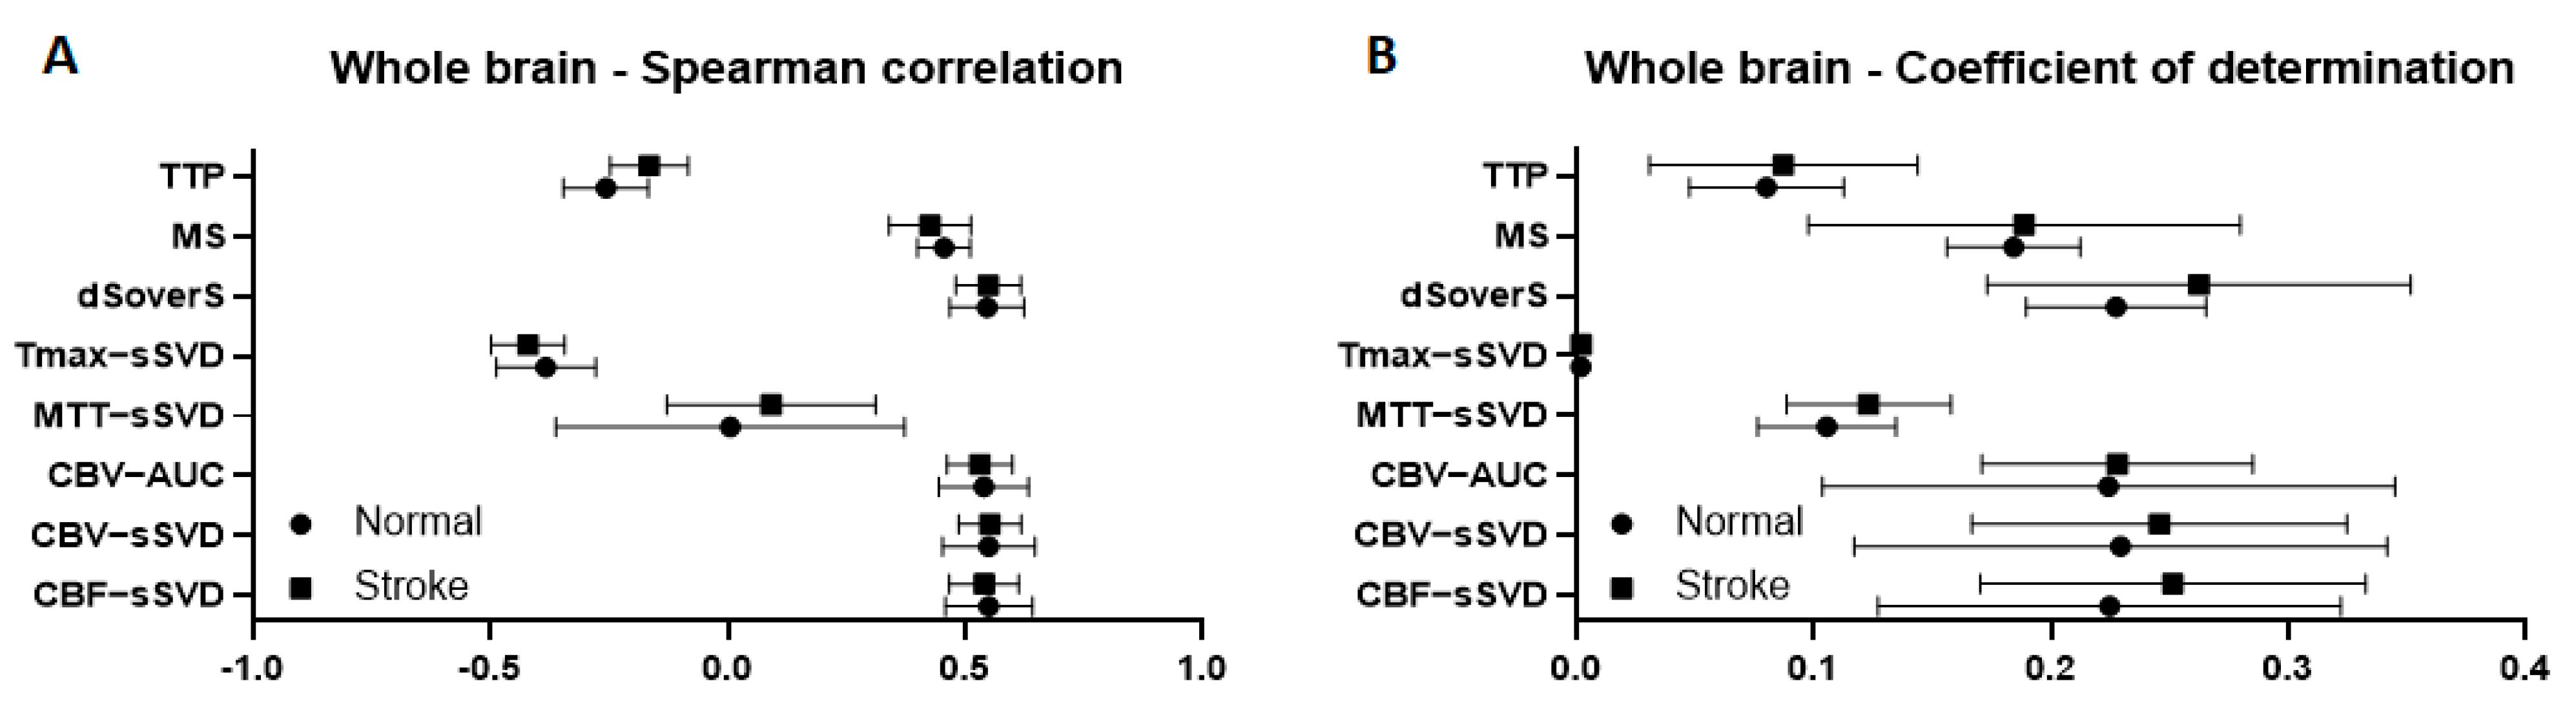
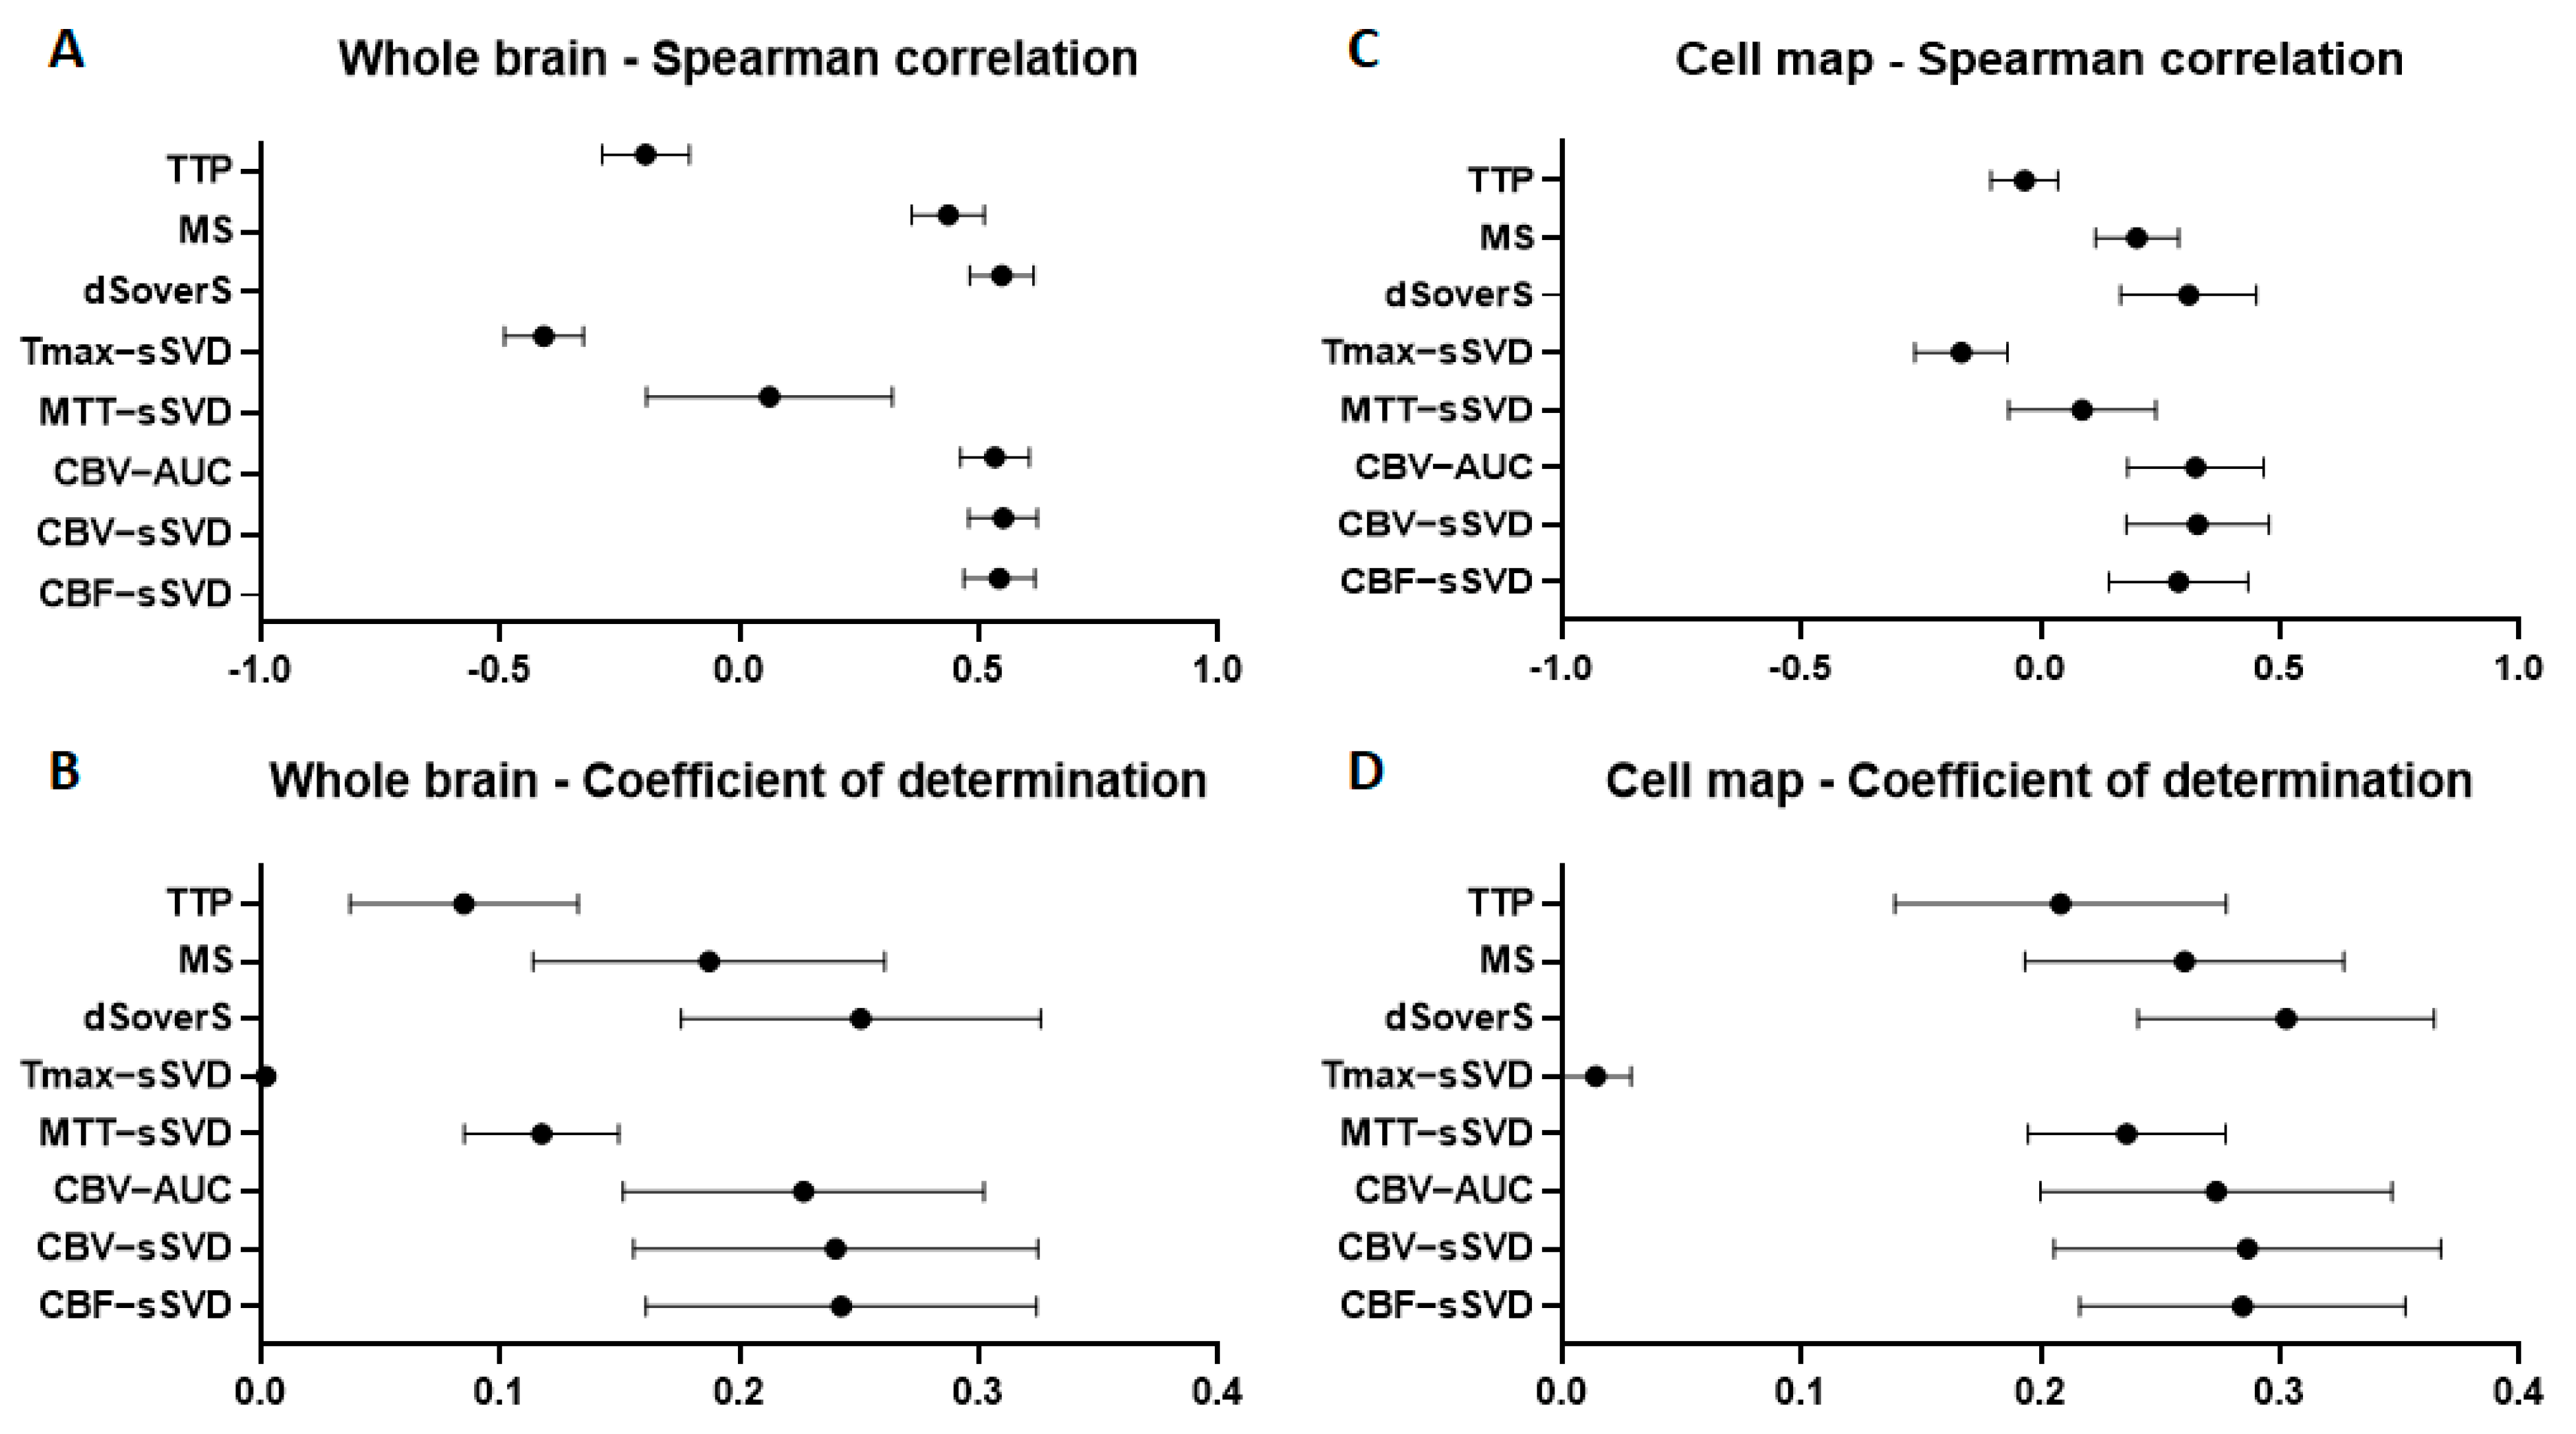
3.3. Correlation between Brain Perfusion Parameters and Cell Density in the Whole Brain
3.4. Correlation between Brain Perfusion Parameters and Cell Density in the Areas of Their Accumulation
4. Discussion
Supplementary Materials
Author Contributions
Funding
Institutional Review Board Statement
Informed Consent Statement
Data Availability Statement
Acknowledgments
Conflicts of Interest
References
- Andrzejewska, A.; Dabrowska, S.; Lukomska, B.; Janowski, M. Mesenchymal Stem Cells for Neurological Disorders. Adv. Sci. 2021, 8, 2002944. [Google Scholar] [CrossRef] [PubMed]
- Namestnikova, D.D.; Cherkashova, E.A.; Sukhinich, K.K.; Gubskiy, I.L.; Leonov, G.E.; Gubsky, L.V.; Majouga, A.G.; Yarygin, K.N. Combined cell therapy in the treatment of neurological disorders. Biomedicines 2020, 8, 1–16. [Google Scholar] [CrossRef] [PubMed]
- Nguyen, H.; Zarriello, S.; Coats, A.; Nelson, C.; Kingsbury, C.; Gorsky, A.; Rajani, M.; Neal, E.G.; Borlongan, C.V. Stem cell therapy for neurological disorders: A focus on aging. Neurobiol. Dis. 2019, 126, 85–104. [Google Scholar] [CrossRef] [PubMed]
- Rascón-Ramírez, F.J.; Esteban-García, N.; Barcia, J.A.; Trondin, A.; Nombela, C.; Sánchez-Sánchez-Rojas, L. Are We Ready for Cell Therapy to Treat Stroke? Front. Cell Dev. Biol. 2021, 9, 621645. [Google Scholar] [CrossRef] [PubMed]
- Li, W.; Shi, L.; Hu, B.; Hong, Y.; Zhang, H.; Li, X.; Zhang, Y. Mesenchymal Stem Cell-Based Therapy for Stroke: Current Understanding and Challenges. Front. Cell. Neurosci. 2021, 15, 10. [Google Scholar] [CrossRef]
- Guzman, R.; Janowski, M.; Walczak, P. Intra-arterial delivery of cell therapies for stroke. Stroke 2018, 49, 1075–1082. [Google Scholar] [CrossRef]
- Namestnikova, D.D.; Gubskiy, I.L.; Revkova, V.A.; Sukhinich, K.K.; Melnikov, P.A.; Gabashvili, A.N.; Cherkashova, E.A.; Vishnevskiy, D.A.; Kurilo, V.V.; Burunova, V.V.; et al. Intra-Arterial Stem Cell Transplantation in Experimental Stroke in Rats: Real-Time MR Visualization of Transplanted Cells Starting with Their First Pass through the Brain With Regard to the Therapeutic Action. Front. Neurosci. 2021, 15, 179. [Google Scholar] [CrossRef]
- Malysz-Cymborska, I.; Golubczyk, D.; Kalkowski, L.; Kwiatkowska, J.; Zawadzki, M.; Głodek, J.; Holak, P.; Sanford, J.; Milewska, K.; Adamiak, Z.; et al. Intra-arterial transplantation of stem cells in large animals as a minimally-invasive strategy for the treatment of disseminated neurodegeneration. Sci. Rep. 2021, 11, 1–10. [Google Scholar] [CrossRef]
- Powers, W.J.; Rabinstein, A.A.; Ackerson, T.; Adeoye, O.M.; Bambakidis, N.C.; Becker, K.; Biller, J.; Brown, M.; Demaerschalk, B.M.; Hoh, B.; et al. Guidelines for the early management of patients with acute ischemic stroke: 2019 update to the 2018 guidelines for the early management of acute ischemic stroke a guideline for healthcare professionals from the American Heart Association/American Stroke A. Stroke 2019, 50, E344–E418. [Google Scholar] [CrossRef]
- Berge, E.; Whiteley, W.; Audebert, H.; De Marchis, G.M.; Fonseca, A.C.; Padiglioni, C.; de la Ossa, N.P.; Strbian, D.; Tsivgoulis, G.; Turc, G. European Stroke Organisation (ESO) guidelines on intravenous thrombolysis for acute ischaemic stroke. Eur. Stroke J. 2021, 6, I. [Google Scholar] [CrossRef]
- Yarygin, K.N.; Namestnikova, D.D.; Sukhinich, K.K.; Gubskiy, I.L.; Majouga, A.G.; Kholodenko, I.V.; Hoogduijn, J.; Dahlke, M.-H. Cell Therapy of Stroke: Do the Intra-Arterially Transplanted Mesenchymal Stem Cells Cross the Blood–Brain Barrier? Cells 2021, 10, 2997. [Google Scholar] [CrossRef]
- Battistella, V.; De Freitas, G.R.; Da Fonseca, L.M.B.; Mercante, D.; Gutfilen, B.; Goldenberg, R.C.S.; Vieira Dias, J.; Kasai-Brunswick, T.H.; Wajnberg, E.; Rosado-De-Castro, P.H.; et al. Safety of autologous bone marrow mononuclear cell transplantation in patients with nonacute ischemic stroke. Regen. Med. 2011, 6, 45–52. [Google Scholar] [CrossRef] [PubMed]
- Moniche, F.; Gonzalez, A.; Gonzalez-Marcos, J.R.; Carmona, M.; Piñero, P.; Espigado, I.; Garcia-Solis, D.; Cayuela, A.; Montaner, J.; Boada, C.; et al. Intra-arterial bone marrow mononuclear cells in ischemic stroke: A pilot clinical trial. Stroke 2012, 43, 2242–2244. [Google Scholar] [CrossRef] [PubMed]
- Friedrich, M.A.G.; Martins, M.P.; Araújo, M.D.; Klamt, C.; Vedolin, L.; Garicochea, B.; Raupp, E.F.; El Ammar, J.S.; Machado, D.C.; da Costa, J.C.; et al. Intra-arterial infusion of autologous bone marrow mononuclear cells in patients with moderate to severe middle cerebral artery acute ischemic stroke. Cell Transplant. 2012, 21, S13–S21. [Google Scholar] [CrossRef] [PubMed]
- Banerjee, S.; Bentley, P.; Hamady, M.; Marley, S.; Davis, J.; Shlebak, A.; Nicholls, J.; Williamson, D.A.; Jensen, S.L.; Gordon, M.; et al. Intra-Arterial Immunoselected CD34+ Stem Cells for Acute Ischemic Stroke. Stem Cells Transl. Med. 2014, 3, 1322–1330. [Google Scholar] [CrossRef]
- Hess, D.C.; Wechsler, L.R.; Clark, W.M.; Savitz, S.I.; Ford, G.A.; Chiu, D.; Yavagal, D.R.; Uchino, K.; Liebeskind, D.S.; Auchus, A.P.; et al. Safety and efficacy of multipotent adult progenitor cells in acute ischaemic stroke (MASTERS): A randomised, double-blind, placebo-controlled, phase 2 trial. Lancet Neurol. 2017, 16, 360–368. [Google Scholar] [CrossRef]
- Savitz, S.I.; Yavagal, D.; Rappard, G.; Likosky, W.; Rutledge, N.; Graffagnino, C.; Alderazi, Y.; Elder, J.A.; Chen, P.R.; Budzik, R.F.; et al. A Phase 2 Randomized, Sham-Controlled Trial of Internal Carotid Artery Infusion of Autologous Bone Marrow-Derived ALD-401 Cells in Patients With Recent Stable Ischemic Stroke (RECOVER-Stroke). Circulation 2019, 139, 192–205. [Google Scholar] [CrossRef]
- Walczak, P.; Wojtkiewicz, J.; Nowakowski, A.; Habich, A.; Holak, P.; Xu, J.; Adamiak, Z.; Chehade, M.; Pearl, M.S.; Gailloud, P.; et al. Real-time MRI for precise and predictable intra-arterial stem cell delivery to the central nervous system. J. Cereb. Blood Flow Metab. 2017, 37, 2346–2358. [Google Scholar] [CrossRef] [Green Version]
- Ullah, M.; Liu, D.D.; Thakor, A.S. Mesenchymal Stromal Cell Homing: Mechanisms and Strategies for Improvement. iScience 2019, 15, 421–438. [Google Scholar] [CrossRef] [Green Version]
- Guzman, R.; De Los Angeles, A.; Cheshier, S.; Choi, R.; Hoang, S.; Liauw, J.; Schaar, B.; Steinberg, G. Intracarotid injection of fluorescence activated cell-sorted CD49d-positive neural stem cells improves targeted cell delivery and behavior after stroke in a mouse stroke model. Stroke 2008, 39, 1300–1306. [Google Scholar] [CrossRef] [Green Version]
- Burunova, V.V.; Gisina, A.M.; Kholodenko, I.V.; Lupatov, A.Y.; Shragina, O.A.; Yarygin, K.N. Standardization of biochemical profile of mesenchymal cell materials by probing the level of dehydrogenase activity. Bull. Exp. Biol. Med. 2010, 149, 497–501. [Google Scholar] [CrossRef] [PubMed]
- Namestnikova, D.; Gubskiy, I.; Kholodenko, I.; Melnikov, P.; Sukhinich, K.; Gabashvili, A.; Vishnevskiy, D.; Soloveva, A.; Abakumov, M.; Vakhrushev, I.; et al. Methodological aspects of MRI of transplanted superparamagnetic iron oxide-labeled mesenchymal stem cells in live rat brain. PLoS ONE 2017, 12, e0186717. [Google Scholar] [CrossRef] [PubMed] [Green Version]
- Namestnikova, D.; Gubskiy, I.; Gabashvili, A.; Sukhinich, K.; Melnikov, P.; Vishnevskiy, D.; Soloveva, A.; Vitushev, E.; Chekhonin, V.; Gubsky, L.; et al. MRI evaluation of frequent complications after intra-arterial transplantation of mesenchymal stem cells in rats. J. Phys. Conf. Ser. 2017, 886, 012012. [Google Scholar] [CrossRef] [Green Version]
- Gubskiy, I.L.; Namestnikova, D.D.D.; Cherkashova, E.A.E.A.; Chekhonin, V.P.V.P.; Baklaushev, V.P.V.P.; Gubsky, L.V.L.V.; Yarygin, K.N. MRI Guiding of the Middle Cerebral Artery Occlusion in Rats Aimed to Improve Stroke Modeling. Transl. Stroke Res. 2018, 9, 417–425. [Google Scholar] [CrossRef] [Green Version]
- Van Rossum, G.; Drake, F.L. Python 3 Reference Manual; CreateSpace Independent Publishing Platform: Scotts Valley, CA, USA, 2009. [Google Scholar]
- Kluyver, T.; Ragan-Kelley, B.; Pérez, F.; Granger, B.; Bussonnier, M.; Frederic, J.; Kelley, K.; Hamrick, J.; Grout, J.; Corlay, S.; et al. Jupyter Notebooks—A publishing format for reproducible computational workflows. In Positioning and Power in Academic Publishing: Players, Agents and Agendas; Loizides, F., Schmidt, B., Eds.; IOS Press: Amsterdam, The Netherlands, 2016; pp. 87–90. [Google Scholar]
- Hsu, L.M.; Wang, S.; Ranadive, P.; Ban, W.; Chao, T.H.H.; Song, S.; Cerri, D.H.; Walton, L.R.; Broadwater, M.A.; Lee, S.H.; et al. Automatic Skull Stripping of Rat and Mouse Brain MRI Data Using U-Net. Front. Neurosci. 2020, 14, 568614. [Google Scholar] [CrossRef]
- Fedorov, A.; Beichel, R.; Kalpathy-Cramer, J.; Finet, J.; Fillion-Robin, J.C.; Pujol, S.; Bauer, C.; Jennings, D.; Fennessy, F.; Sonka, M.; et al. 3D Slicer as an image computing platform for the Quantitative Imaging Network. Magn. Reson. Imaging 2012, 30, 1323–1341. [Google Scholar] [CrossRef] [Green Version]
- Yushkevich, P.A.; Piven, J.; Hazlett, H.C.; Smith, R.G.; Ho, S.; Gee, J.C.; Gerig, G. User-guided 3D active contour segmentation of anatomical structures: Significantly improved efficiency and reliability. Neuroimage 2006, 31, 1116–1128. [Google Scholar] [CrossRef] [Green Version]
- González, R.G.; Schaefer, P.W.; Buonanno, F.S.; Schwamm, L.H.; Budzik, R.F.; Rordorf, G.; Wang, B.; Sorensen, A.G.; Koroshetz, W.J. Diffusion-weighted MR imaging: Diagnostic accuracy in patients imaged within 6 h of stroke symptom onset. Radiology 1999, 210, 155–162. [Google Scholar] [CrossRef]
- Moseley, M.E.; Kucharczyk, J.; Mintorovitch, J.; Cohen, Y.; Kurhanewicz, J.; Derugin, N.; Asgari, H.; Norman, D. Diffusion-weighted MR imaging of acute stroke: Correlation with T2-weighted and magnetic susceptibility-enhanced MR imaging in cats. AJNR Am. J. Neuroradiol. 1990, 11, 423. [Google Scholar]
- Kleindorfer, D.O.; Towfighi, A.; Chaturvedi, S.; Cockroft, K.M.; Gutierrez, J.; Lombardi-Hill, D.; Kamel, H.; Kernan, W.N.; Kittner, S.J.; Leira, E.C.; et al. 2021 Guideline for the prevention of stroke in patients with stroke and transient ischemic attack; A guideline from the American Heart Association/American Stroke Association. Stroke 2021. [CrossRef]
- Sato, K.T.; Wang, D.; Lewandowski, R.J.; Ryu, R.K.; Klein, R.A.; Salem, R.; Larson, A.C.; Omary, R.A. Four-dimensional transcatheter intraarterial perfusion MRI monitoring of radiofrequency ablation of rabbit VX2 liver tumors. J. Magn. Reson. Imaging 2011, 34, 563–569. [Google Scholar] [CrossRef] [PubMed] [Green Version]
- Gaba, R.C.; Jin, B.; Wang, D.; Lewandowski, R.J.; Ragin, A.B.; Larson, A.C.; Salem, R.; Omary, R.A. Locoregional chemoembolic delivery: Prediction with transcatheter intraarterial perfusion MRI. Am. J. Roentgenol. 2012, 198, 1196–1202. [Google Scholar] [CrossRef] [PubMed]
- Larson, A.C.; Wang, D.; Atassi, B.; Sato, K.T.; Ryu, R.K.; Lewandowski, R.J.; Nemcek, A.A.; Mulcahy, M.F.; Kulik, L.M.; Miller, F.H.; et al. Transcatheter intraarterial perfusion: MR monitoring of chemoembolization for hepatocellular carcinoma—Feasibility of initial clinical translation. Radiology 2008, 246, 964–971. [Google Scholar] [CrossRef]
- Amemiya, S.; Akahane, M.; Aoki, S.; Abe, O.; Kamada, K.; Saito, N.; Ohtomo, K. Dynamic contrast-enhanced perfusion MR imaging with SPIO: A pilot study. Investig. Radiol. 2009, 44, 503–508. [Google Scholar] [CrossRef] [PubMed]
- Xiao, Y.D.; Paudel, R.; Liu, J.; Ma, C.; Zhang, Z.S.; Zhou, S.K. MRI contrast agents: Classification and application (Review). Int. J. Mol. Med. 2016, 38, 1319–1326. [Google Scholar] [CrossRef] [Green Version]
- Khabbal, J.; Kerkelä, E.; Mitkari, B.; Raki, M.; Nystedt, J.; Mikkonen, V.; Bergström, K.; Laitinen, S.; Korhonen, M.; Jolkkonen, J. Differential clearance of rat and human bone marrow-derived mesenchymal stem cells from the brain after intra-arterial infusion in rats. Cell Transplant. 2015, 24, 819–828. [Google Scholar] [CrossRef] [Green Version]
- Mitkari, B.; Kerkelä, E.; Nystedt, J.; Korhonen, M.; Mikkonen, V.; Huhtala, T.; Jolkkonen, J. Intra-arterial infusion of human bone marrow-derived mesenchymal stem cells results in transient localization in the brain after cerebral ischemia in rats. Exp. Neurol. 2013, 239, 158–162. [Google Scholar] [CrossRef]
- Nitzsche, F.; Müller, C.; Lukomska, B.; Jolkkonen, J.; Deten, A.; Boltze, J. Concise Review: MSC Adhesion Cascade—Insights into Homing and Transendothelial Migration. Stem Cells 2017, 35, 1446–1460. [Google Scholar] [CrossRef] [Green Version]
- Do, P.T.; Wu, C.C.; Chiang, Y.H.; Hu, C.J.; Chen, K.Y. Mesenchymal stem/stromal cell therapy in blood-brain barrier preservation following ischemia: Molecular mechanisms and prospects. Int. J. Mol. Sci. 2021, 22, 45. [Google Scholar] [CrossRef]
- Leibacher, J.; Henschler, R. Biodistribution, migration and homing of systemically applied mesenchymal stem/stromal cells Mesenchymal Stem/Stromal Cells—An update. Stem Cell Res. Ther. 2016, 7, 1–12. [Google Scholar] [CrossRef] [Green Version]
- Momjian-Mayor, I.; Baron, J.C. The pathophysiology of watershed infarction in internal carotid artery disease: Review of cerebral perfusion studies. Stroke 2005, 36, 567–577. [Google Scholar] [CrossRef] [PubMed] [Green Version]
- Mangla, R.; Kolar, B.; Almast, J.; Ekholm, S.E. Border zone infarcts: Pathophysiologic and imaging characteristics. Radiographics 2011, 31, 1201–1214. [Google Scholar] [CrossRef] [PubMed]


Publisher’s Note: MDPI stays neutral with regard to jurisdictional claims in published maps and institutional affiliations. |
© 2022 by the authors. Licensee MDPI, Basel, Switzerland. This article is an open access article distributed under the terms and conditions of the Creative Commons Attribution (CC BY) license (https://creativecommons.org/licenses/by/4.0/).
Share and Cite
Gubskiy, I.L.; Namestnikova, D.D.; Revkova, V.A.; Cherkashova, E.A.; Sukhinich, K.K.; Beregov, M.M.; Melnikov, P.A.; Abakumov, M.A.; Chekhonin, V.P.; Gubsky, L.V.; et al. The Impact of Cerebral Perfusion on Mesenchymal Stem Cells Distribution after Intra-Arterial Transplantation: A Quantitative MR Study. Biomedicines 2022, 10, 353. https://doi.org/10.3390/biomedicines10020353
Gubskiy IL, Namestnikova DD, Revkova VA, Cherkashova EA, Sukhinich KK, Beregov MM, Melnikov PA, Abakumov MA, Chekhonin VP, Gubsky LV, et al. The Impact of Cerebral Perfusion on Mesenchymal Stem Cells Distribution after Intra-Arterial Transplantation: A Quantitative MR Study. Biomedicines. 2022; 10(2):353. https://doi.org/10.3390/biomedicines10020353
Chicago/Turabian StyleGubskiy, Ilya L., Daria D. Namestnikova, Veronica A. Revkova, Elvira A. Cherkashova, Kirill K. Sukhinich, Mikhail M. Beregov, Pavel A. Melnikov, Maxim A. Abakumov, Vladimir P. Chekhonin, Leonid V. Gubsky, and et al. 2022. "The Impact of Cerebral Perfusion on Mesenchymal Stem Cells Distribution after Intra-Arterial Transplantation: A Quantitative MR Study" Biomedicines 10, no. 2: 353. https://doi.org/10.3390/biomedicines10020353
APA StyleGubskiy, I. L., Namestnikova, D. D., Revkova, V. A., Cherkashova, E. A., Sukhinich, K. K., Beregov, M. M., Melnikov, P. A., Abakumov, M. A., Chekhonin, V. P., Gubsky, L. V., & Yarygin, K. N. (2022). The Impact of Cerebral Perfusion on Mesenchymal Stem Cells Distribution after Intra-Arterial Transplantation: A Quantitative MR Study. Biomedicines, 10(2), 353. https://doi.org/10.3390/biomedicines10020353