
Proteomic Analysis of Mouse Kidney Tissue Associates Peroxisomal Dysfunction with Early Diabetic Kidney Disease

 , , ,
, , , 
Abstract
:1. Introduction
2. Results
2.1. Physiopathologic Characterization of Ins2Akita and db/db Mouse Models
2.2. Glomerular Proteome Profiles from Ins2Akita Mice Revealed Prominent Changes in Mitochondrial and Peroxisomal Proteins in Early and Late DKD
2.3. Validation of Findings in Late T2D DKD Animal Model and Cross-Omics Validation, Further Confirming Peroxisomal Changes in DKD

| Description | Symbol | Ratio | Transcriptomics Expression (Nephroseq; in DKD vs. Controls) (Ref.) | Single-Cell Human Kidney Transcriptomics Expression (Wilson et al. [41]) | ||
|---|---|---|---|---|---|---|
| db/db vs. WT Kidney Cortex 6 Months | Ins2Akita vs. WT Glomeruli 2 Months | Ins2Akita vs. WT Glomeruli 4 Months | ||||
| Nucleoside diphosphate-linked moiety X | NUDT19 | 0.236 | 0.25 | 0.23 | Decrease [40] | not detected |
| Peroxisomal sarcosine oxidase | PIPOX | 0.406 | 0.567 | 0.615 | Decrease [39] | not detected |
| Alpha-methylacyl-CoA racemase | AMACR | 0.185 | 0.52 | 0.56 | Decrease [39] | decrease |
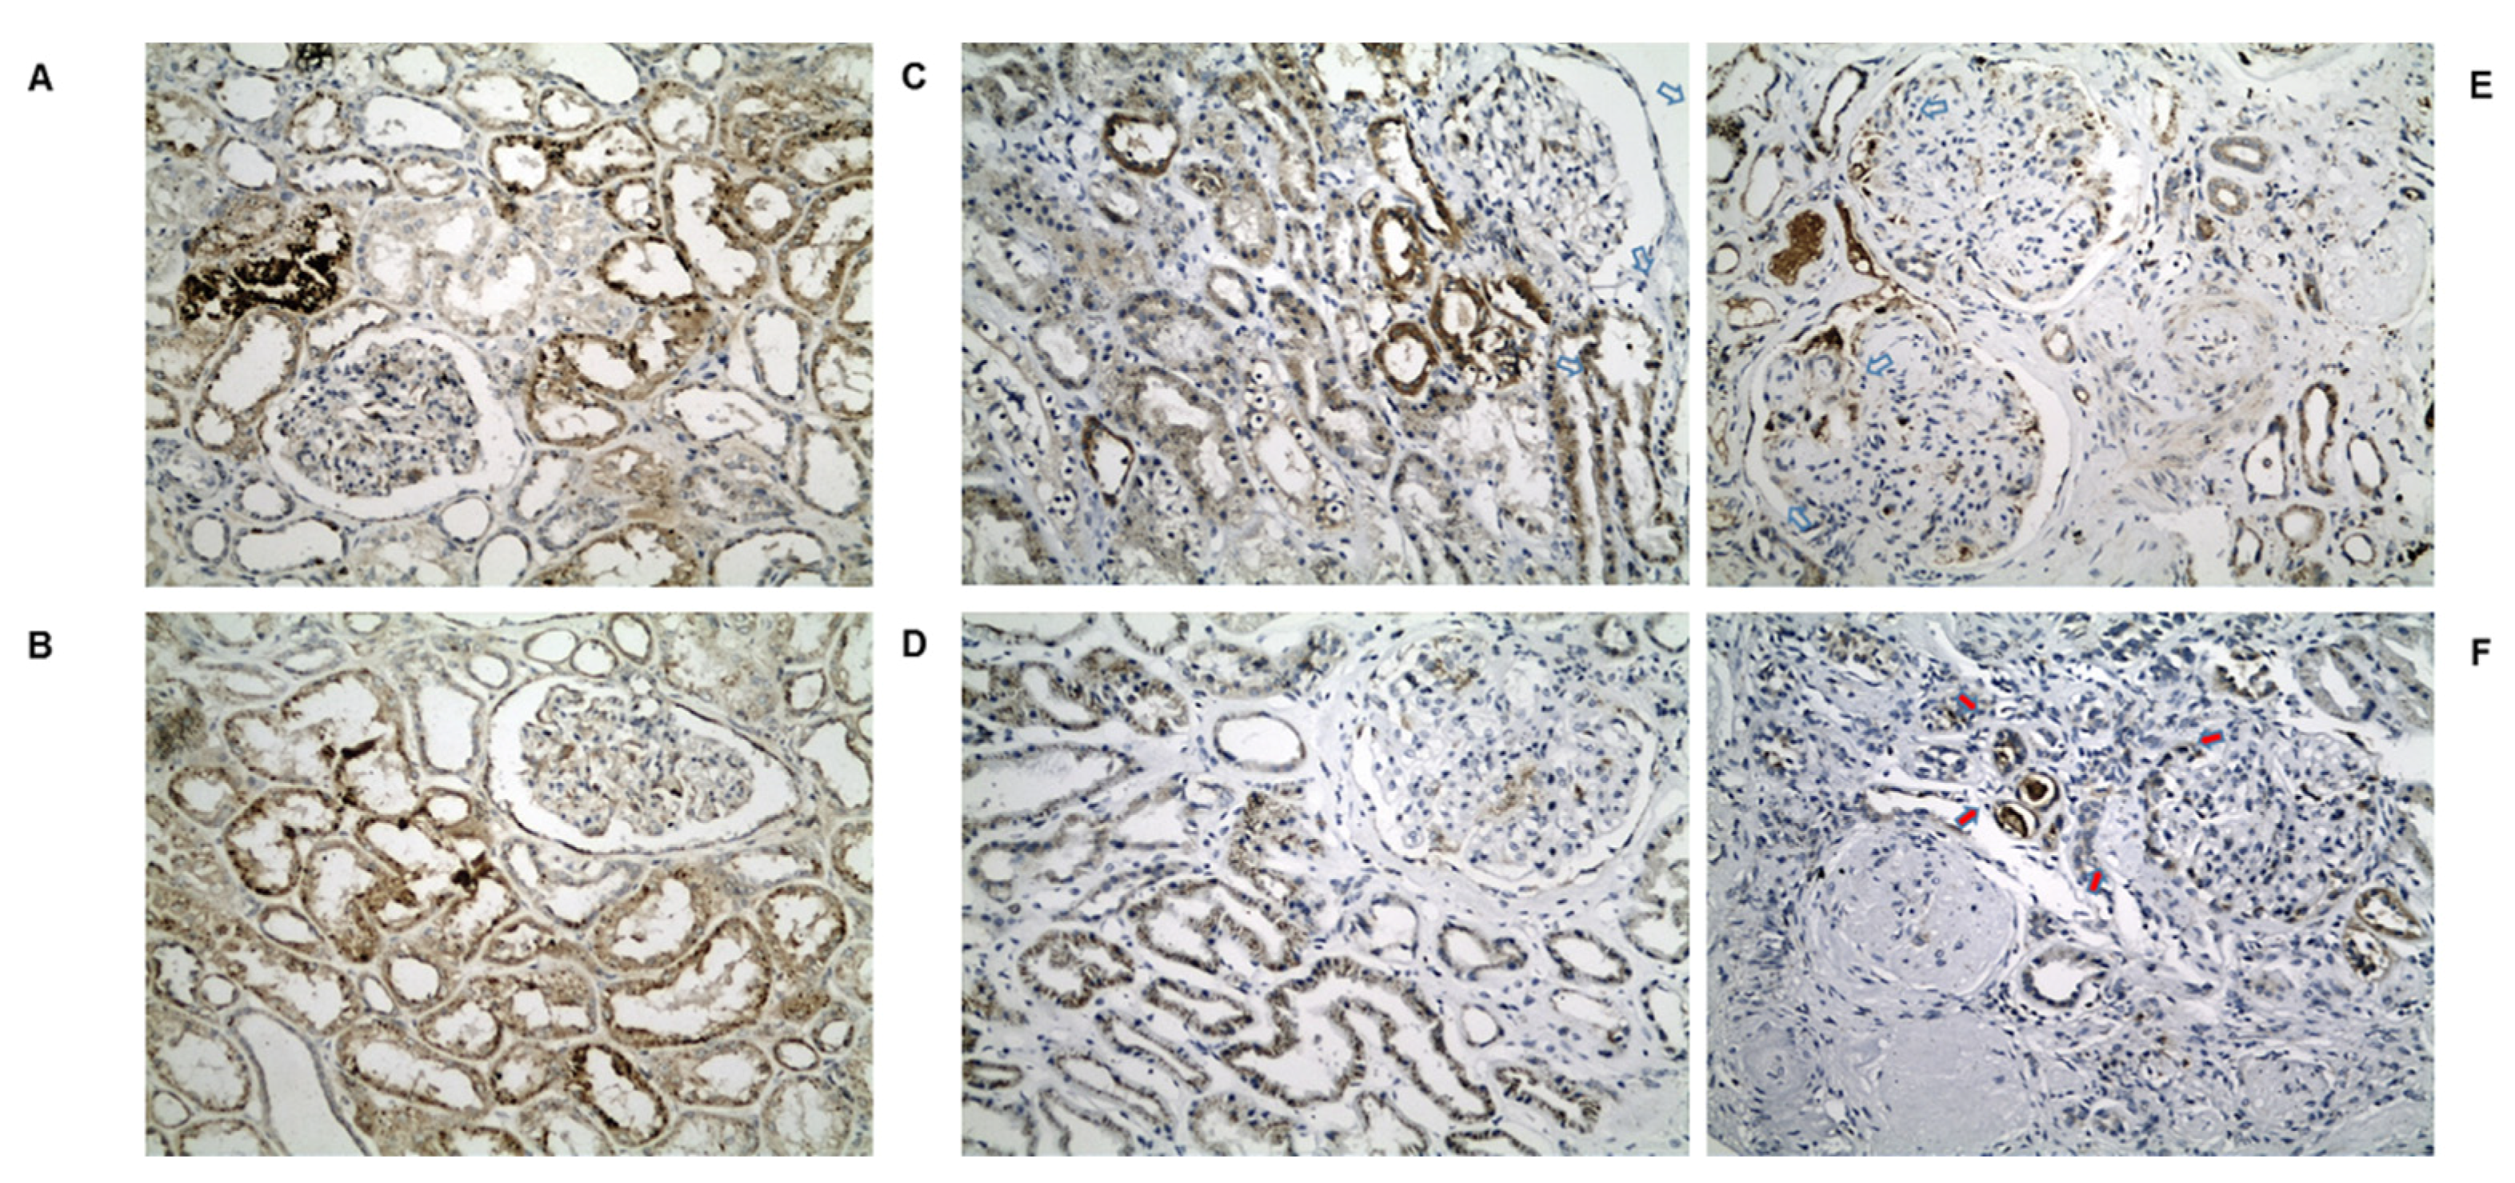
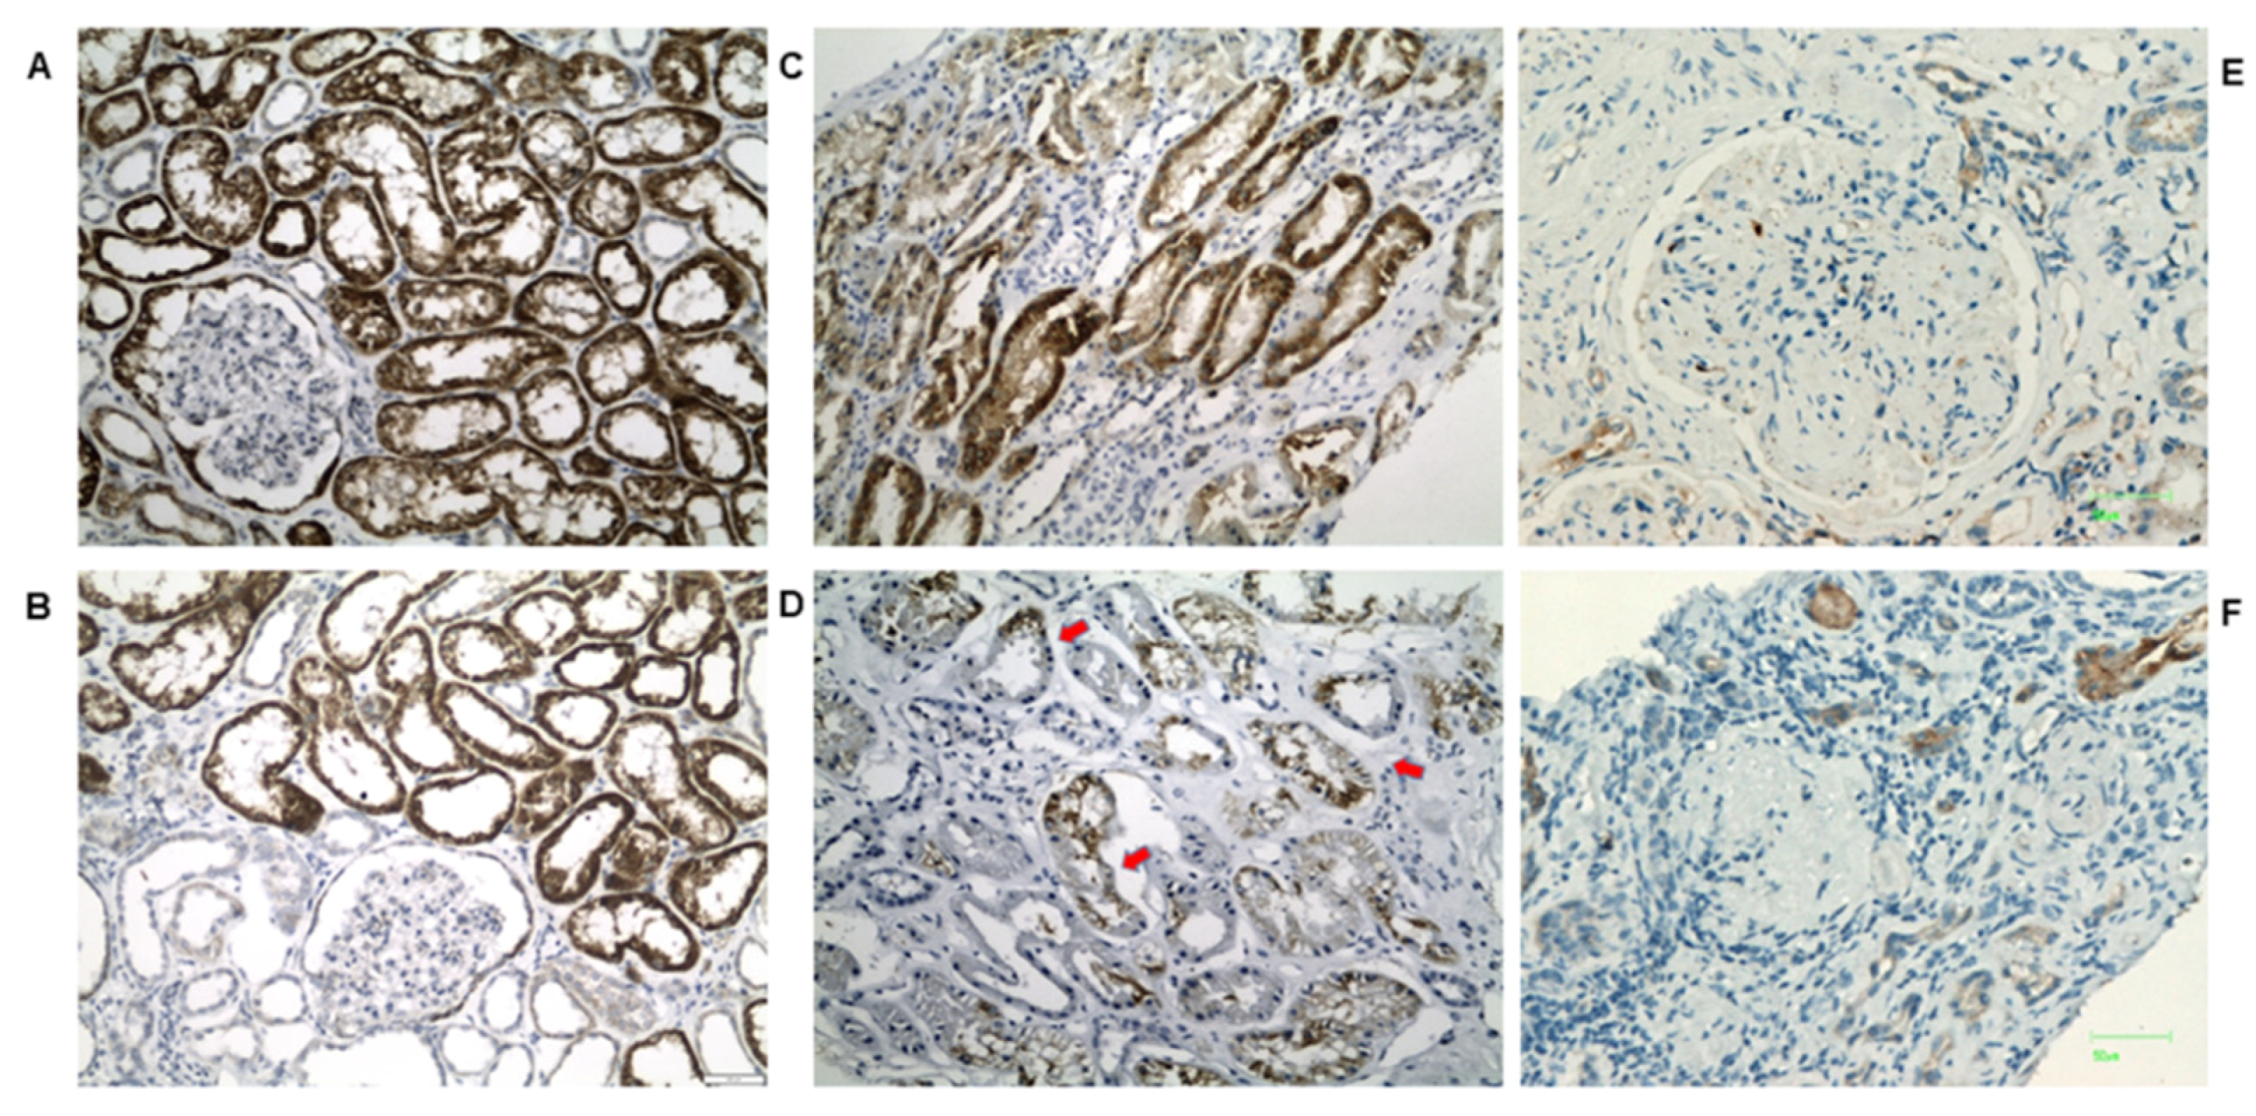
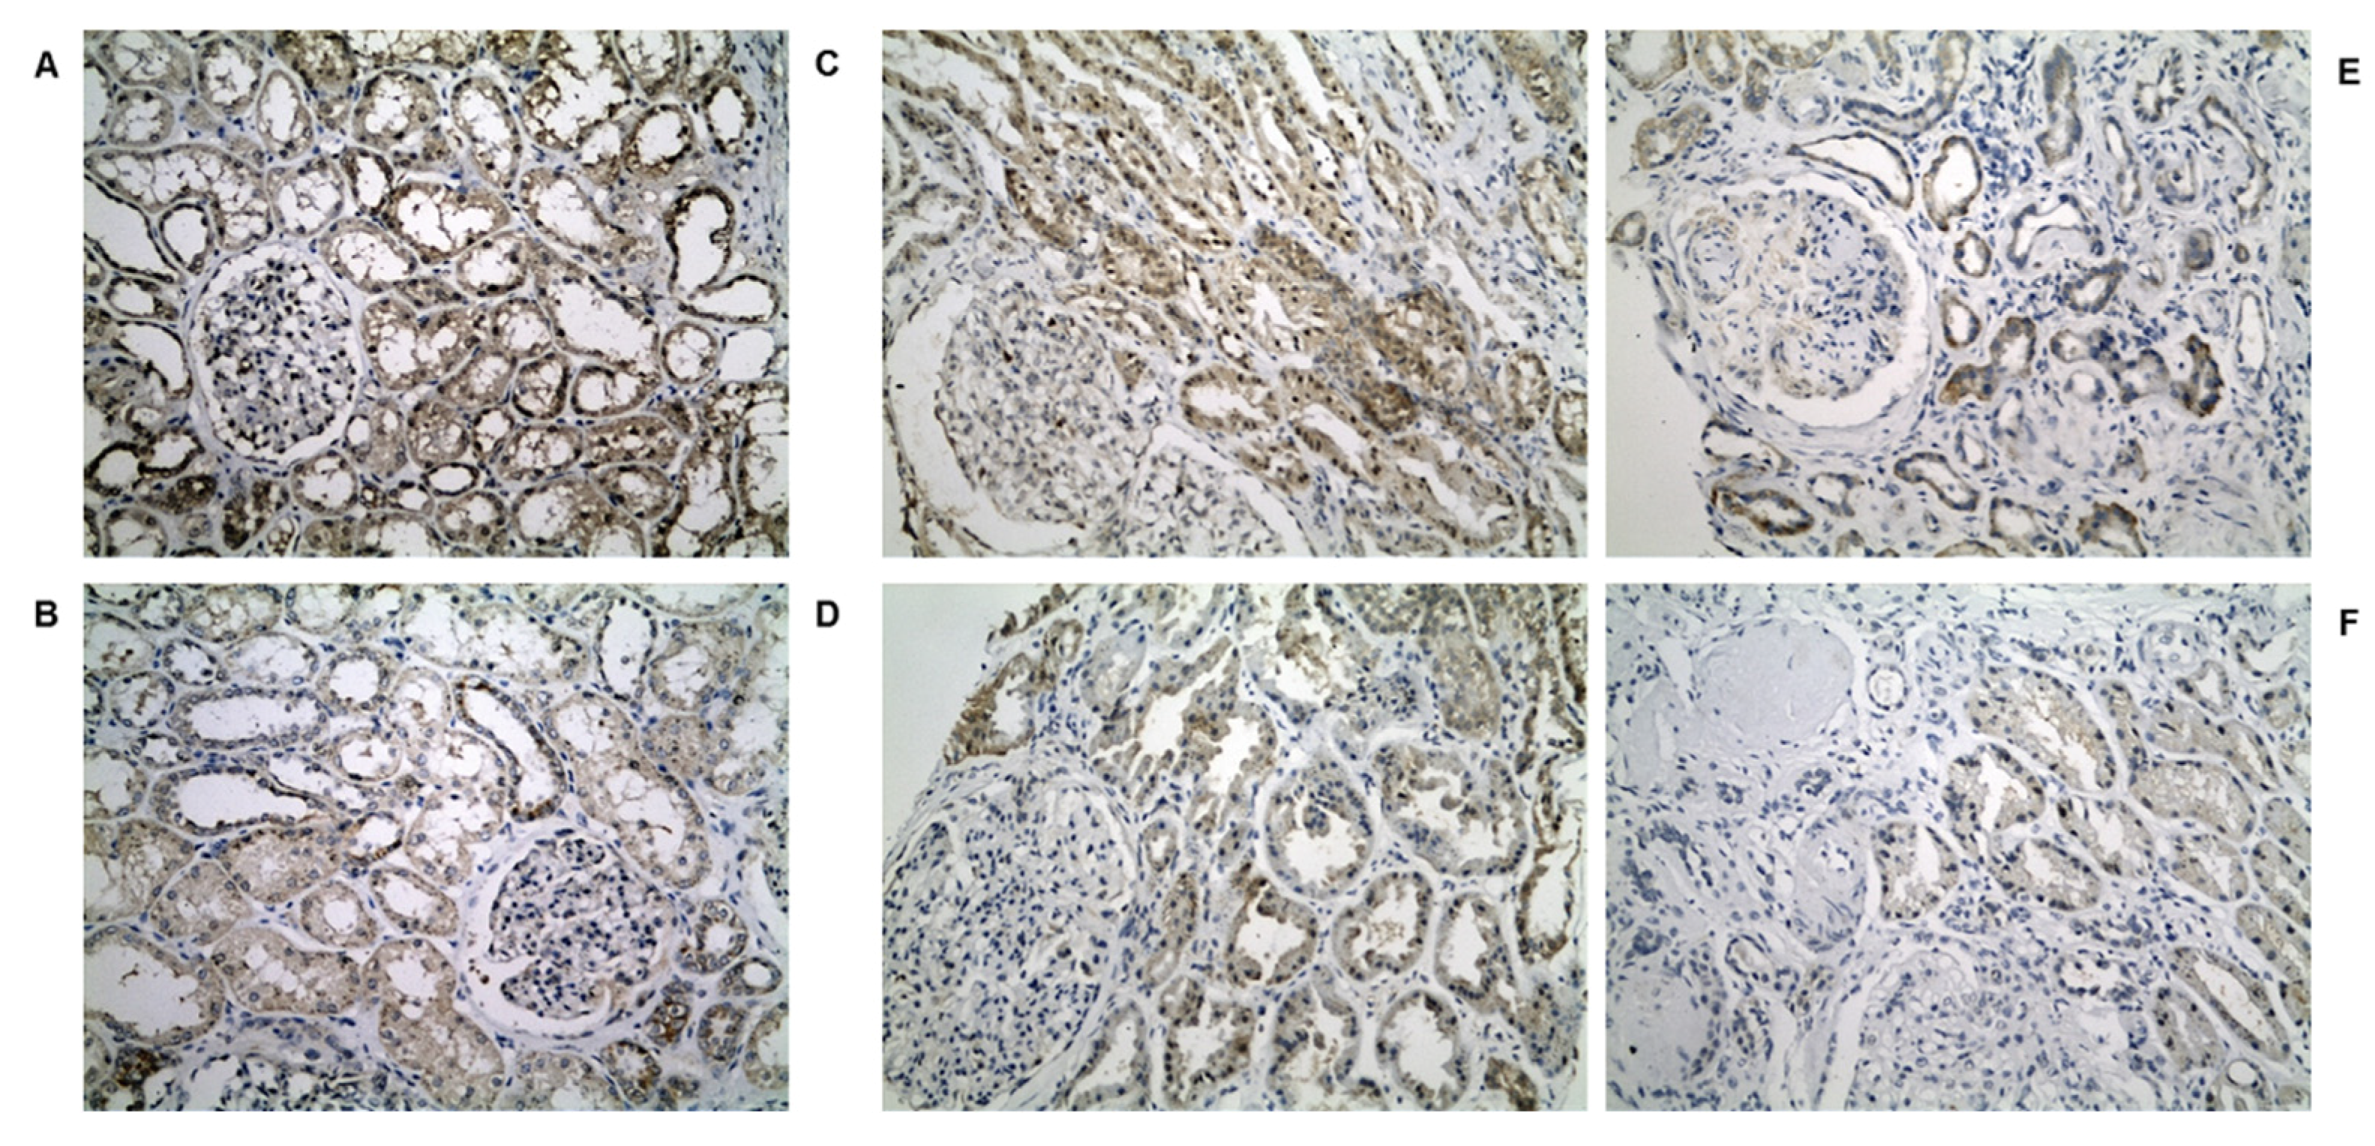
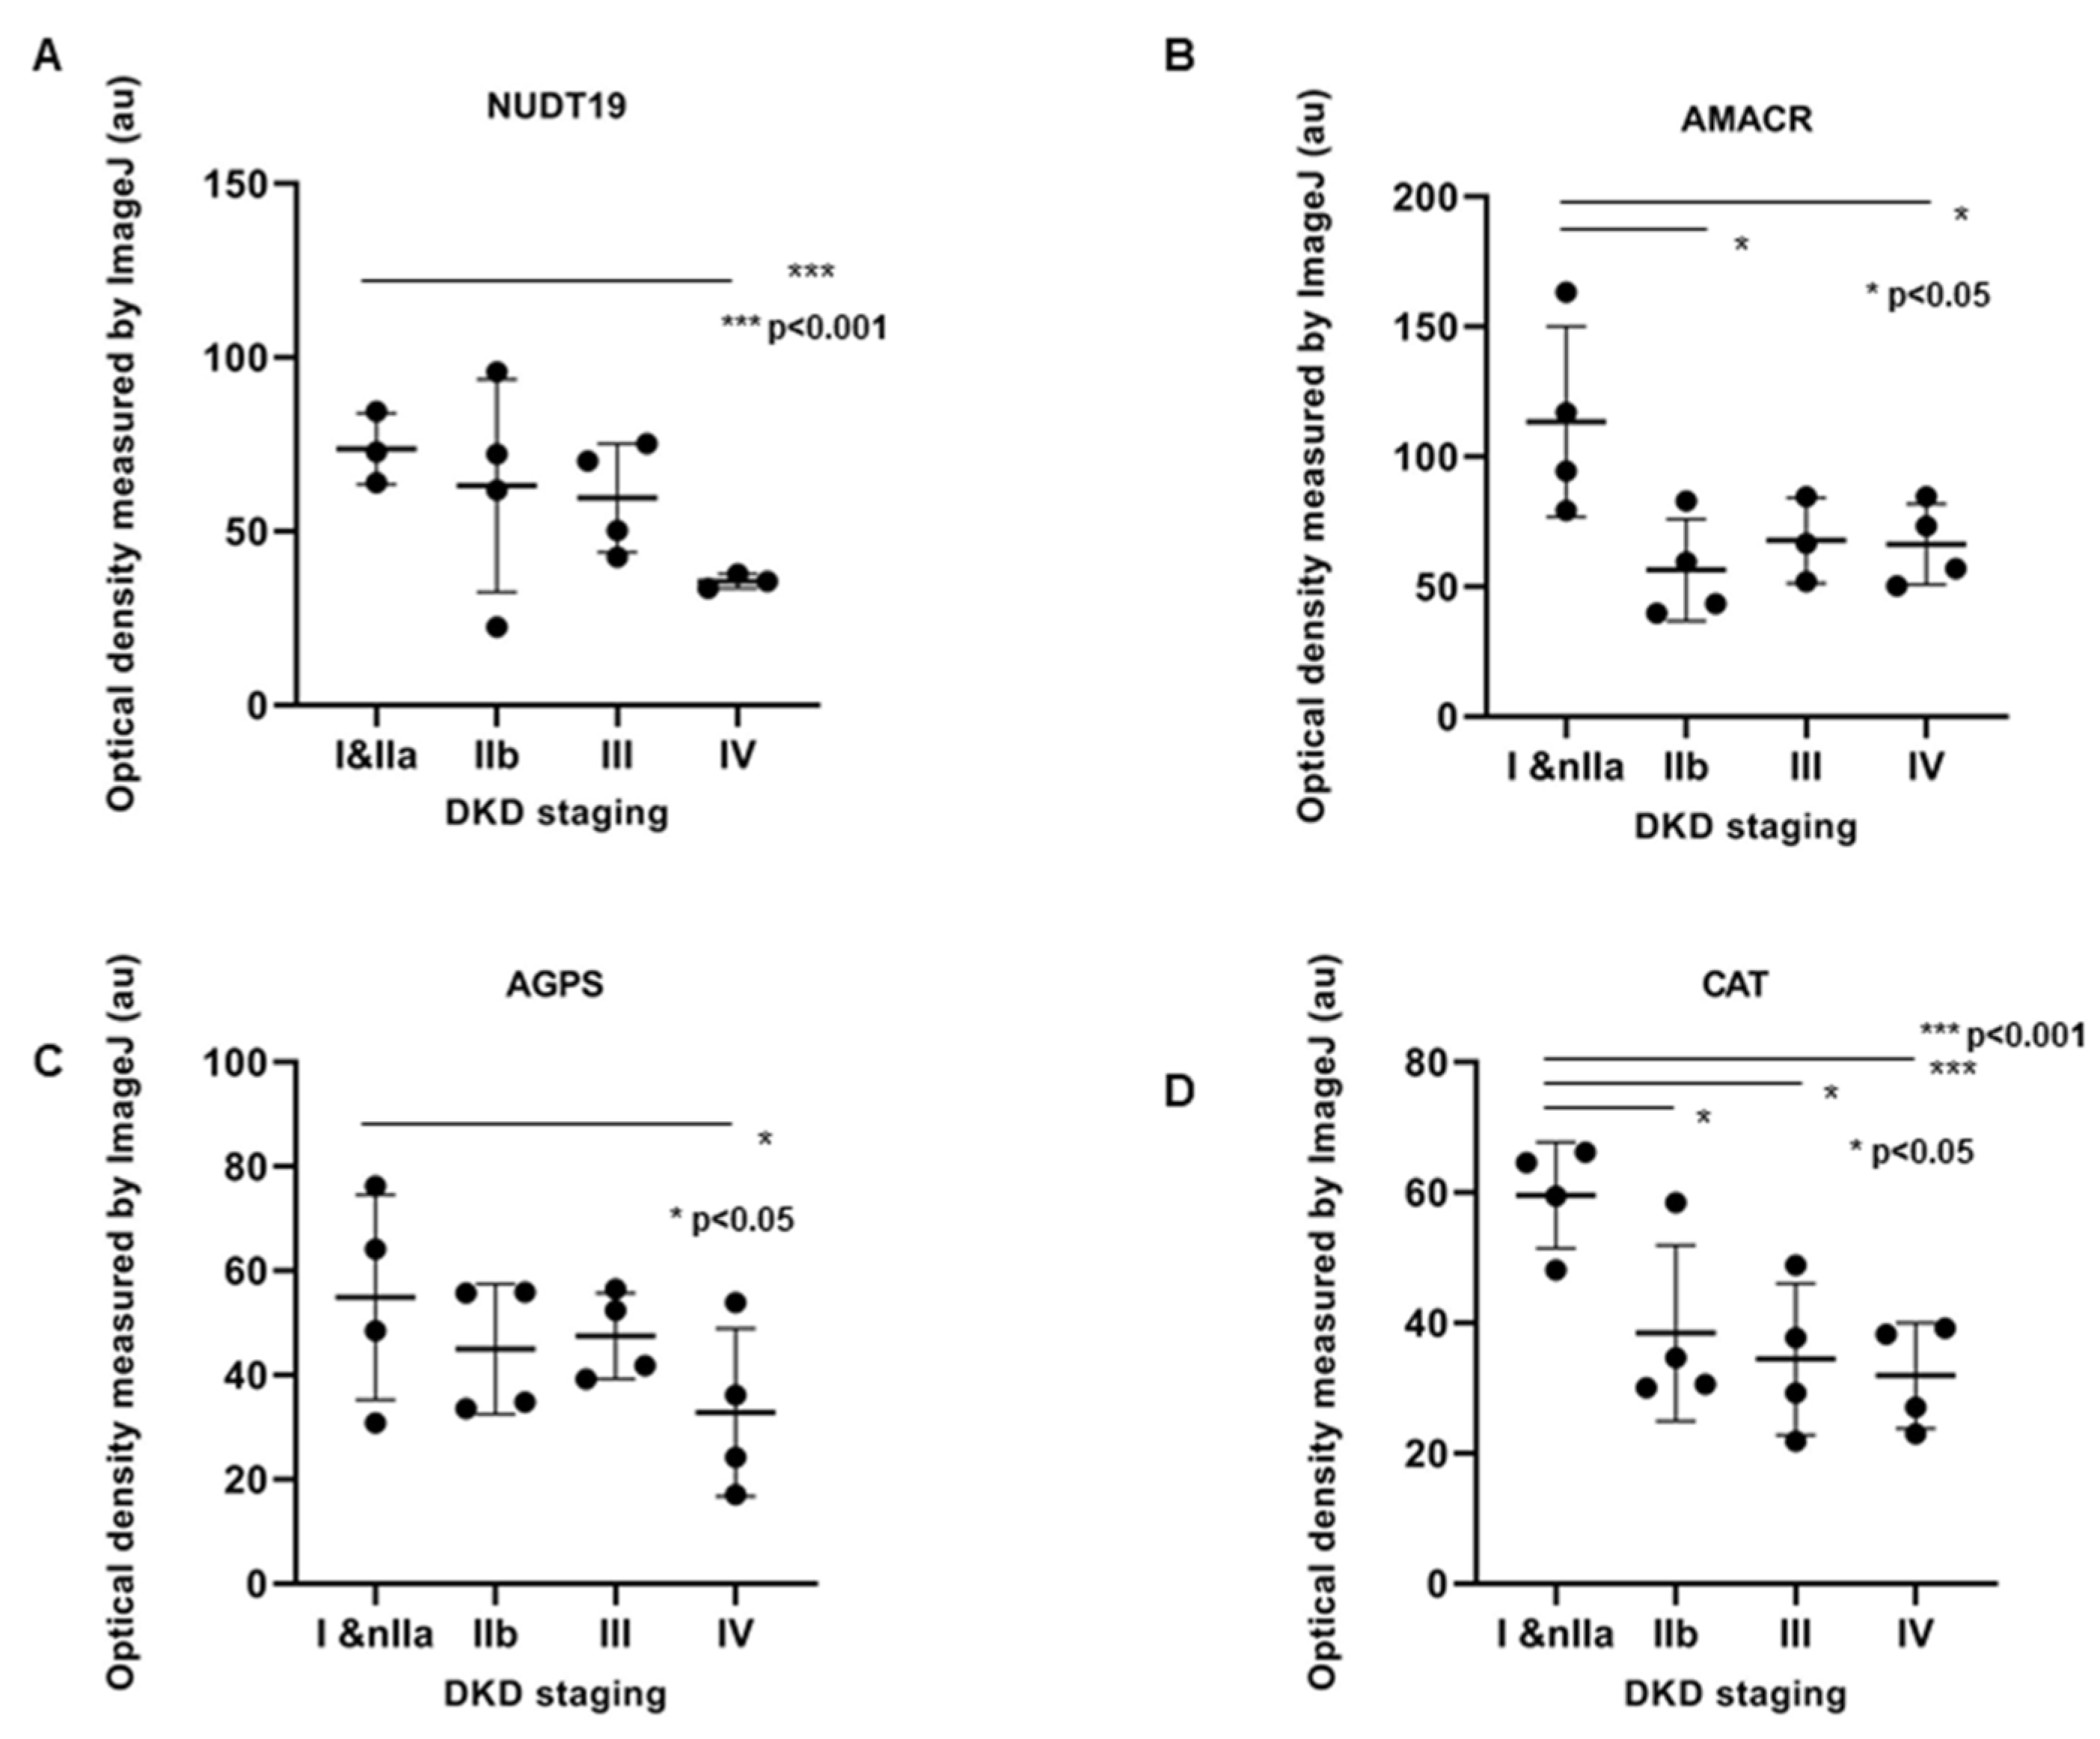
2.4. IHC Validation of Peroxisomal Deregulation in Human DKD Patients
3. Discussion
4. Conclusions
5. Materials and Methods
5.1. Animals
5.2. Isolation of Glomeruli
5.3. Murine Kidney Histology
5.4. Biochemical Analysis
5.5. Sample Preparation for Proteomics
5.6. LC–MS/MS Analysis
5.7. MS Data Processing
5.8. Functional Analysis
5.9. Investigation through Transcriptomics Data Analysis
5.10. Clinical Material
5.11. Immunohistochemistry of Human DKD Specimens
5.12. Evaluation of Immunohistochemistry
5.13. Statistical Analysis of Proteomics Data
Supplementary Materials
Author Contributions
Funding
Institutional Review Board Statement
Informed Consent Statement
Data Availability Statement
Acknowledgments
Conflicts of Interest
References
- International Diabetes Federation. IDF Diabetes Atlas, 9th ed.; International Diabetes Federation: Brussels, Belgium, 2019. [Google Scholar]
- Zheng, Y.; Ley, S.H.; Hu, F.B. Global aetiology and epidemiology of type 2 diabetes mellitus and its complications. Nat. Rev. Endocrinol. 2018, 14, 88–98. [Google Scholar] [CrossRef]
- Amatruda, M.; Gembillo, G.; Giuffrida, A.E.; Santoro, D.; Conti, G. The Aggressive Diabetic Kidney Disease in Youth-Onset Type 2 Diabetes: Pathogenetic Mechanisms and Potential Therapies. Medicina 2021, 57, 868. [Google Scholar] [CrossRef]
- Kainz, A.; Hronsky, M.; Stel, V.S.; Jager, K.J.; Geroldinger, A.; Dunkler, D.; Heinze, G.; Tripepi, G.; Oberbauer, R. Prediction of prevalence of chronic kidney disease in diabetic patients in countries of the European Union up to 2025. Nephrol. Dial. Transplant. 2015, 30, iv113–iv118. [Google Scholar] [CrossRef] [PubMed]
- Gembillo, G.; Ingrasciotta, Y.; Crisafulli, S.; Luxi, N.; Siligato, R.; Santoro, D.; Trifirò, G. Kidney Disease in Diabetic Patients: From Pathophysiology to Pharmacological Aspects with a Focus on Therapeutic Inertia. Int. J. Mol. Sci. 2021, 22, 4824. [Google Scholar] [CrossRef]
- Narres, M.; Claessen, H.; Droste, S.; Kvitkina, T.; Koch, M.; Kuss, O.; Icks, A. The incidence of end-stage renal disease in the diabetic (compared to the non-diabetic) population: A sys-tematic review. PLoS ONE 2016, 11, e0147329. [Google Scholar] [CrossRef] [PubMed]
- Halimi, J.-M. The emerging concept of chronic kidney disease without clinical proteinuria in diabetic patients. Diabetes Metab. 2012, 38, 291–297. [Google Scholar] [CrossRef] [PubMed]
- Santoro, D.; Torreggiani, M.; Pellicanò, V.; Cernaro, V.; Messina, R.; Longhitano, E.; Siligato, R.; Gembillo, G.; Esposito, C.; Piccoli, G. Kidney Biopsy in Type 2 Diabetic Patients: Critical Reflections on Present Indications and Diagnostic Alternatives. Int. J. Mol. Sci. 2021, 22, 5425. [Google Scholar] [CrossRef]
- Badal, S.S.; Danesh, F.R. New Insights into Molecular Mechanisms of Diabetic Kidney Disease. Am. J. Kidney Dis. 2014, 63, S63–S83. [Google Scholar] [CrossRef] [PubMed] [Green Version]
- Hathaway, C.K.; Gasim, A.M.H.; Grant, R.; Chang, A.S.; Kim, H.-S.; Madden, V.J.; Bagnell, C.R., Jr.; Jennette, J.C.; Smithies, O.; Kakoki, M. Low TGFβ1 expression prevents and high expression exacerbates diabetic nephropathy in mice. Proc. Natl. Acad. Sci. USA 2015, 112, 5815–5820. [Google Scholar] [CrossRef] [Green Version]
- Lopez-Sanz, L.; Bernal, S.; Recio, C.; Lazaro, I.; Oguiza, A.; Melgar, A.; Jimenez-Castilla, L.; Egido, J.; Gomez-Guerrero, C. SOCS1-targeted therapy ameliorates renal and vascular oxidative stress in diabetes via STAT1 and PI3K inhibition. Lab. Investig. 2018, 98, 1276–1290. [Google Scholar] [CrossRef]
- Jing, Z.; Hu, L.; Su, Y.; Ying, G.; Ma, C.; Wei, J. Potential signaling pathway through which Notch regulates oxidative damage and apoptosis in renal tubular epithelial cells induced by high glucose. J. Recept. Signal Transduct. 2021, 41, 357–362. [Google Scholar] [CrossRef] [PubMed]
- Srivastava, S.P.; Zhou, H.; Setia, O.; Liu, B.; Kanasaki, K.; Koya, D.; Dardik, A.; Fernandez-Hernando, C.; Goodwin, J. Loss of endothelial glucocorticoid receptor accelerates diabetic nephropathy. Nat. Commun. 2021, 12, 1–15. [Google Scholar] [CrossRef] [PubMed]
- Srivastava, S.P.; Li, J.; Takagaki, Y.; Kitada, M.; Goodwin, J.E.; Kanasaki, K.; Koya, D. Endothelial SIRT3 regulates myofibroblast metabolic shifts in diabetic kidneys. iScience 2021, 24, 102390. [Google Scholar] [CrossRef]
- Klein, J.; Caubet, C.; Camus, M.; Makridakis, M.; Denis, C.; Gilet, M.; Feuillet, G.; Rascalou, S.; Neau, E.; Garrigues, L.; et al. Connectivity mapping of glomerular proteins identifies dimethylaminoparthenolide as a new inhibitor of diabetic kidney disease. Sci. Rep. 2020, 10, 14898. [Google Scholar] [CrossRef]
- Granata, S.; Zaza, G.; Simone, S.; Villani, G.; Latorre, D.; Pontrelli, P.; Carella, M.; Schena, F.P.; Grandaliano, G.; Pertosa, G. Mitochondrial dysregulation and oxidative stress in patients with chronic kidney disease. BMC Genom. 2009, 10, 388. [Google Scholar] [CrossRef] [Green Version]
- Daenen, K.; Andries, A.; Mekahli, D.; Van Schepdael, A.; Jouret, F.; Bammens, B. Oxidative stress in chronic kidney disease. Pediatr. Nephrol. 2019, 34, 975–991. [Google Scholar] [CrossRef] [PubMed] [Green Version]
- Youssef, N.; Noureldein, M.; Njeim, R.; Ghadieh, H.E.; Harb, F.; Azar, S.T.; Fares, N.; Eid, A.A. Reno-Protective Effect of GLP-1 Receptor Agonists in Type1 Diabetes: Dual Action on TRPC6 and NADPH Oxidases. Biomed. 2021, 9, 1360. [Google Scholar] [CrossRef]
- Tagawa, A.; Yasuda, M.; Kume, S.; Yamahara, K.; Nakazawa, J.; Chin-Kanasaki, M.; Araki, H.; Araki, S.-I.; Koya, D.; Asanuma, K.; et al. Impaired Podocyte Autophagy Exacerbates Proteinuria in Diabetic Nephropathy. Diabetes 2015, 65, 755–767. [Google Scholar] [CrossRef] [Green Version]
- Yoshibayashi, M.; Kume, S.; Yasuda-Yamahara, M.; Yamahara, K.; Takeda, N.; Osawa, N.; Chin-Kanasaki, M.; Nakae, Y.; Yokoi, H.; Mukoyama, M.; et al. Protective role of podocyte autophagy against glomerular endothelial dysfunction in diabetes. Biochem. Biophys. Res. Commun. 2020, 525, 319–325. [Google Scholar] [CrossRef]
- Oberg, B.P.; McMenamin, E.; Lucas, F.L.; McMonagle, E.; Morrow, J.; Ikizler, T.A.; Himmelfarb, J. Increased prevalence of oxidant stress and inflammation in patients with moderate to severe chronic kidney disease. Kidney Int. 2004, 65, 1009–1016. [Google Scholar] [CrossRef] [Green Version]
- Kang, H.M.; Ahn, S.H.; Choi, P.; Ko, Y.-A.; Han, S.H.; Chinga, F.; Park, A.S.D.; Tao, J.; Sharma, K.; Pullman, J.; et al. Defective fatty acid oxidation in renal tubular epithelial cells has a key role in kidney fibrosis development. Nat. Med. 2015, 21, 37–46. [Google Scholar] [CrossRef]
- Duni, A.; Liakopoulos, V.; Roumeliotis, S.; Peschos, D.; Dounousi, E. Oxidative Stress in the Pathogenesis and Evolution of Chronic Kidney Disease: Untangling Ariadne’s Thread. Int. J. Mol. Sci. 2019, 20, 3711. [Google Scholar] [CrossRef] [Green Version]
- Izquierdo-Lahuerta, A.; Martínez-García, C.; Medina-Gómez, G. Lipotoxicity as a trigger factor of renal disease. J. Nephrol. 2016, 29, 603–610. [Google Scholar] [CrossRef]
- Herman-Edelstein, M.; Scherzer, P.; Tobar, A.; Levi, M.; Gafter, U. Altered renal lipid metabolism and renal lipid accumulation in human diabetic nephropathy. J. Lipid Res. 2014, 55, 561–572. [Google Scholar] [CrossRef] [Green Version]
- Townsend, R.R.; Guarnieri, P.; Argyropoulos, C.; Blady, S.; Boustany-Kari, C.M.; Devalaraja-Narashimha, K.; Morton, L.; Mottl, A.K.; Patel, U.; Palmer, M.; et al. Rationale and design of the Transformative Research in Diabetic Nephropathy (TRIDENT) Study. Kidney Int. 2020, 97, 10–13. [Google Scholar] [CrossRef] [PubMed]
- Heerspink, H.J.L.; Jongs, N.; Chertow, G.M.; Langkilde, A.M.; McMurray, J.J.V.; Correa-Rotter, R.; Rossing, P.; Sjöström, C.D.; Stefansson, B.V.; Toto, R.D.; et al. Effect of dapagliflozin on the rate of decline in kidney function in patients with chronic kidney disease with and without type 2 diabetes: A prespecified analysis from the DAPA-CKD trial. Lancet Diabetes Endocrinol. 2021, 9, 743–754. [Google Scholar] [CrossRef]
- Perkovic, V.; Jardine, M.J.; Neal, B.; Bompoint, S.; Heerspink, H.J.L.; Charytan, D.M.; Edwards, R.; Agarwal, R.; Bakris, G.; Bull, S.; et al. Canagliflozin and Renal Outcomes in Type 2 Diabetes and Nephropathy. N. Engl. J. Med. 2019, 380, 2295–2306. [Google Scholar] [CrossRef] [Green Version]
- Delanaye, P.; Wissing, K.M.; Scheen, A.J. Sodium–glucose cotransporter 2 inhibitors: Renal outcomes according to baseline albuminuria. Clin. Kidney J. 2021, 14, 2463–2471. [Google Scholar] [CrossRef] [PubMed]
- Giugliano, D.; Maiorino, M.I.; Bellastella, G.; Longo, M.; Chiodini, P.; Esposito, K. GLP-1 receptor agonists for prevention of cardiorenal outcomes in type 2 diabetes: An updated meta-analysis including the REWIND and PIONEER 6 trials. Diabetes Obes. Metab. 2019, 21, 2576–2580. [Google Scholar] [CrossRef]
- Kanasaki, K.; Shi, S.; Kanasaki, M.; He, J.; Nagai, T.; Nakamura, Y.; Ishigaki, Y.; Kitada, M.; Srivastava, S.P.; Koya, D. Linagliptin-Mediated DPP-4 Inhibition Ameliorates Kidney Fibrosis in Streptozotocin-Induced Diabetic Mice by Inhibiting Endothelial-to-Mesenchymal Transition in a Therapeutic Regimen. Diabetes 2014, 63, 2120–2131. [Google Scholar] [CrossRef] [PubMed] [Green Version]
- Wang, J.; Xiang, H.; Lu, Y.; Wu, T.; Ji, G. New progress in drugs treatment of diabetic kidney disease. Biomed. Pharmacother. 2021, 141, 111918. [Google Scholar] [CrossRef]
- Barrera-Chimal, J.; Lima-Posada, I.; Bakris, G.L.; Jaisser, F. Mineralocorticoid receptor antagonists in diabetic kidney disease—Mechanistic and therapeutic effects. Nat. Rev. Nephrol. 2021, 18, 1–15. [Google Scholar] [CrossRef] [PubMed]
- Kitada, M.; Ogura, Y.; Koya, D. Rodent models of diabetic nephropathy: Their utility and limitations. Int. J. Nephrol. Renov. Dis. 2016, ume 9, 279–290. [Google Scholar] [CrossRef] [Green Version]
- Susztak, K.; Raff, A.C.; Schiffer, M.; Böttinger, E.P. Glucose-induced reactive oxygen species cause apoptosis of podocytes and podocyte depletion at the onset of diabetic nephropathy. Diabetes 2006, 55, 225–233. [Google Scholar] [CrossRef]
- Katsuda, Y.; Ohta, T.; Shinohara, M.; Bin, T.; Yamada, T. Diabetic mouse models. Open J. Anim. Sci. 2013, 3, 334–342. [Google Scholar] [CrossRef] [Green Version]
- Waanders, L.F.; Chwalek, K.; Monetti, M.; Kumar, C.; Lammert, E.; Mann, M. Quantitative proteomic analysis of single pancreatic islets. Proc. Natl. Acad. Sci. USA 2009, 106, 18902–18907. [Google Scholar] [CrossRef] [Green Version]
- Woroniecka, K.I.; Park, A.S.D.; Mohtat, D.; Thomas, D.B.; Pullman, J.M.; Susztak, K. Transcriptome Analysis of Human Diabetic Kidney Disease. Diabetes 2011, 60, 2354–2369. [Google Scholar] [CrossRef] [Green Version]
- Schmid, H.; Boucherot, A.; Yasuda, Y.; Henger, A.; Brunner, B.; Eichinger, F.; Nitsche, A.; Kiss, E.; Bleich, M.; Gröne, H.-J.; et al. Modular Activation of Nuclear Factor-κB Transcriptional Programs in Human Diabetic Nephropathy. Diabetes 2006, 55, 2993–3003. [Google Scholar] [CrossRef] [Green Version]
- Hodgin, J.B.; Nair, V.; Zhang, H.; Randolph, A.; Harris, R.C.; Nelson, R.G.; Weil, E.J.; Cavalcoli, J.D.; Patel, J.M.; Brosius, F.C.; et al. Identification of Cross-Species Shared Transcriptional Networks of Diabetic Nephropathy in Human and Mouse Glomeruli. Diabetes 2013, 62, 299–308. [Google Scholar] [CrossRef] [Green Version]
- Wilson, P.C.; Wu, H.; Kirita, Y.; Uchimura, K.; Ledru, N.; Rennke, H.G.; Welling, P.A.; Waikar, S.S.; Humphreys, B.D. The single-cell transcriptomic landscape of early human diabetic nephropathy. Proc. Natl. Acad. Sci. USA 2019, 116, 19619–19625. [Google Scholar] [CrossRef] [PubMed] [Green Version]
- Amiri, F.S. Intracellular organelles in health and kidney disease. Néphrologie Thérapeutique 2019, 15, 9–21. [Google Scholar] [CrossRef] [PubMed]
- Lukey, M.J.; Wilson, K.F.; A Cerione, R. Therapeutic strategies impacting cancer cell glutamine metabolism. Futur. Med. Chem. 2013, 5, 1685–1700. [Google Scholar] [CrossRef] [Green Version]
- Cheng, S.; Rhee, E.P.; Larson, M.; Lewis, G.D.; McCabe, E.L.; Shen, D.; Palma, M.J.; Roberts, L.; Dejam, A.; Souza, A.L.; et al. Metabolite Profiling Identifies Pathways Associated With Metabolic Risk in Humans. Circulation 2012, 125, 2222–2231. [Google Scholar] [CrossRef] [Green Version]
- Bao, Y.; Zhao, T.; Wang, X.; Qiu, Y.; Su, M.; Jia, W.; Jia, W. Metabonomic Variations in the Drug-Treated Type 2 Diabetes Mellitus Patients and Healthy Volunteers. J. Proteome Res. 2009, 8, 1623–1630. [Google Scholar] [CrossRef] [PubMed]
- Newgard, C.B. Interplay between Lipids and Branched-Chain Amino Acids in Development of Insulin Resistance. Cell Metab. 2012, 15, 606–614. [Google Scholar] [CrossRef] [Green Version]
- Menge, B.A.; Schrader, H.; Ritter, P.R.; Ellrichmann, M.; Uhl, W.; Schmidt, W.E.; Meier, J.J. Selective amino acid deficiency in patients with impaired glucose tolerance and type 2 diabetes. Regul. Pept. 2010, 160, 75–80. [Google Scholar] [CrossRef] [PubMed]
- Ferrannini, E.; Natali, A.; Camastra, S.; Nannipieri, M.; Mari, A.; Adam, K.-P.; Milburn, M.V.; Kastenmüller, G.; Adamski, J.; Tuomi, T.; et al. Early Metabolic Markers of the Development of Dysglycemia and Type 2 Diabetes and Their Physiological Significance. Diabetes 2013, 62, 1730–1737. [Google Scholar] [CrossRef] [Green Version]
- Simmons, R.M.; McKnight, S.M.; Edwards, A.K.; Wu, G.; Satterfield, M.C. Obesity increases hepatic glycine dehydrogenase and aminomethyltransferase expression while dietary glycine supplementation reduces white adipose tissue in Zucker diabetic fatty rats. Amino Acids 2020, 52, 1413–1423. [Google Scholar] [CrossRef]
- Gar, C.; Rottenkolber, M.; Prehn, C.; Adamski, J.; Seissler, J.; Lechner, A. Serum and plasma amino acids as markers of prediabetes, insulin resistance, and incident diabetes. Crit. Rev. Clin. Lab. Sci. 2017, 55, 21–32. [Google Scholar] [CrossRef]
- Alves, A.; Bassot, A.; Bulteau, A.-L.; Pirola, L.; Morio, B. Glycine Metabolism and Its Alterations in Obesity and Metabolic Diseases. Nutrients 2019, 11, 1356. [Google Scholar] [CrossRef] [Green Version]
- Palmer, N.D.; Stevens, R.D.; Antinozzi, P.A.; Anderson, A.; Bergman, R.N.; Wagenknecht, L.E.; Newgard, C.B.; Bowden, D.W. Metabolomic Profile Associated With Insulin Resistance and Conversion to Diabetes in the Insulin Resistance Atherosclerosis Study. J. Clin. Endocrinol. Metab. 2015, 100, E463–E468. [Google Scholar] [CrossRef]
- Sekhar, R.V.; McKay, S.V.; Patel, S.G.; Guthikonda, A.P.; Reddy, V.T.; Balasubramanyam, A.; Jahoor, F. Glutathione Synthesis Is Diminished in Patients with Uncontrolled Diabetes and Restored by Dietary Supplementation with Cysteine and Glycine. Diabetes Care 2010, 34, 162–167. [Google Scholar] [CrossRef] [Green Version]
- Yamakado, M.; Nagao, K.; Imaizumi, A.; Tani, M.; Toda, A.; Tanaka, T.; Jinzu, H.; Miyano, H.; Yamamoto, H.; Daimon, T.; et al. Plasma Free Amino Acid Profiles Predict Four-Year Risk of Developing Diabetes, Metabolic Syndrome, Dyslipidemia and Hypertension in Japanese Population. Sci. Rep. 2015, 5, 11918. [Google Scholar] [CrossRef]
- Lanza, I.; Zhang, S.; Ward, L.E.; Karakelides, H.; Raftery, D.; Nair, K.S. Quantitative Metabolomics by 1H-NMR and LC-MS/MS Confirms Altered Metabolic Pathways in Diabetes. PLoS ONE 2010, 5, e10538. [Google Scholar] [CrossRef] [Green Version]
- Neinast, M.; Murashige, D.; Arany, Z. Branched chain amino acids. Annu. Rev. Physiol. 2019, 81, 139–164. [Google Scholar] [CrossRef]
- Cai, F.; Zhou, X.; Jia, Y.; Yao, W.; Lv, J.; Liu, G.; Yang, L. Identification of Key Genes of Human Advanced Diabetic Nephropathy Independent of Proteinuria by Transcriptome Analysis. BioMed Res. Int. 2020, 2020, 1–14. [Google Scholar] [CrossRef]
- Van Veldhoven, P.P. Biochemistry and genetics of inherited disorders of peroxisomal fatty acid metabolism. J. Lipid Res. 2010, 51, 2863–2895. [Google Scholar] [CrossRef] [PubMed] [Green Version]
- Wanders, R.; Ferdinandusse, S.; Brites, P.; Kemp, S. Peroxisomes, lipid metabolism and lipotoxicity. Biochim. Biophys. Acta (BBA) Mol. Cell Biol. Lipids 2010, 1801, 272–280. [Google Scholar] [CrossRef] [PubMed]
- Silcox, A.; Burdett, K.; Connock, M.J. Reduced levels of peroxisomal enzymes in the kidney of the genetically obese (ob/ob) mouse. Contrast with liver. Biochem. Int. 1983, 7, 273–280. [Google Scholar] [PubMed]
- Proctor, G.; Jiang, T.; Iwahashi, M.; Wang, Z.; Li, J.; Levi, M. Regulation of Renal Fatty Acid and Cholesterol Metabolism, Inflammation, and Fibrosis in Akita and OVE26 Mice with Type 1 Diabetes. Diabetes 2006, 55, 2502–2509. [Google Scholar] [CrossRef] [Green Version]
- Vasko, R. Peroxisomes and Kidney Injury. Antioxidants Redox Signal. 2016, 25, 217–231. [Google Scholar] [CrossRef] [Green Version]
- Houten, S.M.; Denis, S.; Argmann, C.A.; Jia, Y.; Ferdinandusse, S.; Reddy, J.K.; Wanders, R.J.A. Peroxisomal L-bifunctional enzyme (Ehhadh) is essential for the production of medium-chain dicarboxylic acids. J. Lipid Res. 2012, 53, 1296–1303. [Google Scholar] [CrossRef] [PubMed] [Green Version]
- Violante, S.; Achetib, N.; van Roermund, C.W.T.; Hagen, J.; Dodatko, T.; Vaz, F.M.; Waterham, H.R.; Chen, H.; Baes, M.; Yu, C.; et al. Peroxisomes can oxidize medium- and long-chain fatty acids through a pathway involving ABCD3 and HSD17B4. FASEB J. 2019, 33, 4355–4364. [Google Scholar] [CrossRef] [PubMed]
- Kumar, A.; Shiloach, J.; Betenbaugh, M.J.; Gallagher, E.J. The beta-3 adrenergic agonist (CL-316,243) restores the expression of down-regulated fatty acid oxidation genes in type 2 diabetic mice. Nutr. Metab. 2015, 12, 8. [Google Scholar] [CrossRef] [Green Version]
- Gholaminejad, A.; Fathalipour, M.; Roointan, A. Comprehensive analysis of diabetic nephropathy expression profile based on weighted gene co-expression network analysis algorithm. BMC Nephrol. 2021, 22, 1–13. [Google Scholar] [CrossRef]
- Brites, P.; Waterham, H.R.; Wanders, R.J. Functions and biosynthesis of plasmalogens in health and disease. Biochim. Biophys. Acta (BBA) Mol. Cell Biol. Lipids 2004, 1636, 219–231. [Google Scholar] [CrossRef]
- Wallner, S.; Schmitz, G. Plasmalogens the neglected regulatory and scavenging lipid species. Chem. Phys. Lipids 2011, 164, 573–589. [Google Scholar] [CrossRef]
- Oresic, M.; Simell, S.; Sysi-Aho, M.; Nanto-Salonen, K.; Seppanen-Laakso, T.; Parikka, V.; Katajamaa, M.; Hekkala, A.; Mattila, I.; Keskinen, P.; et al. Dysregulation of lipid and amino acid metabolism precedes islet autoimmunity in children who later progress to type 1 diabetes. J. Exp. Med. 2008, 205, 2975–2984. [Google Scholar] [CrossRef] [PubMed] [Green Version]
- Lindfors, E.; Gopalacharyulu, P.V.; Halperin, E.; Oresic, M. Detection of Molecular Paths Associated with Insulitis and Type 1 Diabetes in Non-Obese Diabetic Mouse. PLoS ONE 2009, 4, e7323. [Google Scholar] [CrossRef] [Green Version]
- Colas, R.; Pruneta-Deloche, V.; Guichardant, M.; Luquain-Costaz, C.; Cugnet-Anceau, C.; Moret, M.; Vidal, H.; Moulin, P.; Lagarde, M.; Calzada, C. Increased Lipid Peroxidation in LDL from Type-2 Diabetic Patients. Lipids 2010, 45, 723–731. [Google Scholar] [CrossRef] [Green Version]
- Natarajan, S.K.; Muthukrishnan, E.; Khalimonchuk, O.; Mott, J.; Becker, D.F. Evidence for Pipecolate Oxidase in Mediating Protection Against Hydrogen Peroxide Stress. J. Cell. Biochem. 2017, 118, 1678–1688. [Google Scholar] [CrossRef] [PubMed] [Green Version]
- Van Schaftingen, E.; Rzem, R.; Marbaix, A.; Collard, F.; Veiga-Da-Cunha, M.; Linster, C.L. Metabolite proofreading, a neglected aspect of intermediary metabolism. J. Inherit. Metab. Dis. 2013, 36, 427–434. [Google Scholar] [CrossRef] [PubMed]
- Dahabieh, M.S.; Di Pietro, E.; Jangal, M.; Goncalves, C.; Witcher, M.; Braverman, N.E.; del Rincón, S.V. Peroxisomes and cancer: The role of a metabolic specialist in a disease of aberrant metabolism. Biochim. Biophys. Acta 2018, 1870, 103–121. [Google Scholar] [CrossRef] [PubMed]
- Fall, T.; Salihovic, S.; Brandmaier, S.; Nowak, C.; Ganna, A.; Gustafsson, S.; Broeckling, C.; Prenni, J.; Kastenmüller, G.; Peters, A.; et al. Non-targeted metabolomics combined with genetic analyses identifies bile acid synthesis and phospholipid metabolism as being associated with incident type 2 diabetes. Diabetologia 2016, 59, 2114–2124. [Google Scholar] [CrossRef] [Green Version]
- Shumar, S.A.; Kerr, E.W.; Geldenhuys, W.J.; Montgomery, G.E.; Fagone, P.; Thirawatananond, P.; Saavedra, H.; Gabelli, S.; Leonardi, R. Nudt19 is a renal CoA diphosphohydrolase with biochemical and regulatory properties that are distinct from the hepatic Nudt7 isoform. J. Biol. Chem. 2018, 293, 4134–4148. [Google Scholar] [CrossRef] [PubMed] [Green Version]
- Hunt, M.C.; Tillander, V.; Alexson, S.E. Regulation of peroxisomal lipid metabolism: The role of acyl-CoA and coenzyme A metabolizing enzymes. Biochimie 2014, 98, 45–55. [Google Scholar] [CrossRef]
- Ebaid, H.; Bashandy, S.A.E.; Abdel-Mageed, A.M.; Al-Tamimi, J.; Hassan, I.; Alhazza, I.M. Folic acid and melatonin mitigate diabetic nephropathy in rats via inhibition of oxidative stress. Nutr. Metab. 2020, 17, 1–14. [Google Scholar] [CrossRef] [PubMed] [Green Version]
- Hwang, I.; Lee, J.; Huh, J.Y.; Park, J.; Lee, H.B.; Ho, Y.-S.; Ha, H. Catalase Deficiency Accelerates Diabetic Renal Injury Through Peroxisomal Dysfunction. Diabetes 2012, 61, 728–738. [Google Scholar] [CrossRef] [Green Version]
- Oguro, A.; Fujita, N.; Imaoka, S. Regulation of Soluble Epoxide Hydrolase (sEH) in Mice with Diabetes: High Glucose Suppresses sEH Expression. Drug Metab. Pharmacokinet. 2009, 24, 438–445. [Google Scholar] [CrossRef] [PubMed] [Green Version]
- Jung, O.; Jansen, F.; Mieth, A.; Barbosa-Sicard, E.; Pliquett, R.U.; Babelova, A.; Morisseau, C.; Hwang, S.H.; Tsai, C.; Hammock, B.D.; et al. Inhibition of the Soluble Epoxide Hydrolase Promotes Albuminuria in Mice with Progressive Renal Disease. PLoS ONE 2010, 5, e11979. [Google Scholar] [CrossRef] [Green Version]
- Pollegioni, L.; Sacchi, S.; Murtas, G. Human D-Amino Acid Oxidase: Structure, Function, and Regulation. Front. Mol. Biosci. 2018, 5, 107. [Google Scholar] [CrossRef] [PubMed] [Green Version]
- Satav, J.G.; Dave, K.R.; Katyare, S.S. Influence of Insulin Status on Extra-Mitochondrial Oxygen Metabolism in the Rat. Horm. Metab. Res. 2000, 32, 57–61. [Google Scholar] [CrossRef] [PubMed]
- Latosinska, A.; Davalieva, K.; Makridakis, M.; Mullen, W.; Schanstra, J.P.; Vlahou, A.; Mischak, H.; Frantzi, M. Molecular Changes in Tissue Proteome During Prostate Cancer Development: Proof-of-Principle Investigation. Diagnostics 2020, 10, 655. [Google Scholar] [CrossRef]
- Makridakis, M.; Vlahou, A. GeLC-MS: A sample preparation method for proteomics analysis of minimal amount of tissue. Methods Mol. Biol. 2018, 1788, 165–175. [Google Scholar]
- Latosinska, A.; Vougas, K.; Makridakis, M.; Klein, J.; Mullen, W.; Abbas, M.; Stravodimos, K.; Katafigiotis, I.; Merseburger, A.S.; Zoidakis, J.; et al. Comparative Analysis of Label-Free and 8-Plex iTRAQ Approach for Quantitative Tissue Proteomic Analysis. PLoS ONE 2015, 10, e0137048. [Google Scholar] [CrossRef] [PubMed]
- Tervaert, T.W.C.; Mooyaart, A.L.; Amann, K.; Cohen, A.H.; Cook, H.T.; Drachenberg, C.B.; Ferrario, F.; Fogo, A.B.; Haas, M.; de Heer, E.; et al. Pathologic Classification of Diabetic Nephropathy. J. Am. Soc. Nephrol. 2010, 21, 556–563. [Google Scholar] [CrossRef] [Green Version]
- eGFR Calculator. National Kidney Foundation. Available online: https://www.kidney.org/professionals/kdoqi/gfr_calculator (accessed on 30 November 2021).
- Stevens, P.E.; Levin, A. Kidney disease: Improving global outcomes chronic kidney disease guideline development work group members. Evaluation and management of chronic kidney disease: Synopsis of the kidney disease: Improving global outcomes 2012 clinical practice guideline. Ann. Intern. Med. 2013, 158, 825–830. [Google Scholar] [CrossRef] [Green Version]


| GO Term | Term p Value Corrected with BH | Group Genes |
|---|---|---|
| Cholesterol biosynthesis | 0.008 | Acat2, Lbr, Nsdhl |
| Regulation of ornithine decarboxylase (ODC) | 0.011 | Nqo1, Psmd11, Psmd3 |
| Metabolism of polyamines | 0.014 | Nqo1, Psmd11, Psmd3 |
| Peroxisomal protein import | 9.05 × 10⁻¹⁰ | Acox1, Agps, Crot, Dao, Ehhadh, Nudt19, Pecr, Pipox, Scp2 |
| Peroxisomal lipid metabolism | 9.54 × 10⁻¹⁰ | Acox1, Aldh3a2, Crot, Ehhadh, Nudt19, Pecr, Scp2 |
| Protein localization | 1.14 × 10⁻⁹ | Acox1, Agps, Aldh3a2, Crot, Dao, Ehhadh, Nudt19, Pecr, Pipox, Scp2 |
| Fatty acid metabolism | 1.31 × 10⁻⁶ | Acox1, Aldh3a2, Crot, Cyp4b1, Ehhadh, Ggt1, Nudt19, Pecr, Scp2 |
| GO Term | Term p Value Corrected with BH | Group Genes |
|---|---|---|
| Metabolism of amino acids and derivatives | 1.41 × 10⁻⁷ | Aass, Acad8, Aldh4a1, Amt, Cth, Dmgdh, Gcat, Gcsh, Gldc, Gls, Glud1, Gstz1, Hibadh, Mccc1, Nqo1, Prodh, Sardh |
| HDL remodeling | 0.0005 | Alb, Apoa1, Apoe |
| Glyoxylate metabolism and glycine degradation | 0.0008 | Aldh4a1, Amt, Gcsh, Gldc |
| Branched-chain amino acid catabolism | 0.002 | Acad8, Hibadh, Mccc1 |
| The citric acid (TCA) cycle, respiratory electron and ATP synthesis by chemiosmotic coupling | 0.006 | Atp5h, Gstz1, Ndufb11, Ndufb6, Ndufb7, Ndufs5 |
| Protein localization | 4.83 × 10⁻⁸ | Acot4, Acox1, Agps, Atad1, Crot, Dhrs4, Ehhadh, Ldhd, Nudt19, Pecr, Pipox |
| Peroxisomal protein import | 7.25 × 10⁻⁸ | Acot4, Acox1, Agps, Crot, Dhrs4, Ehhadh, Nudt19, Pecr, Pipox |
| Peroxisomal lipid metabolism | 1.93 × 10⁻⁶ | Clasp2, Clip1, Dync1i2, Pafah1b1, Smc3 |
| Fatty acid metabolism | 0.0007 | Acot4, Acox1, Crot, Cyp4b1, Ehhadh, Nudt19, Pecr, Ptgs1 |
| Beta-oxidation of very long-chain fatty acids | 0.0007 | Acot4, Acox1, Ehhadh |
| Accession | Name | pval_INS2vs.WT2 | Ratio_INS2vs.WT2 | pval_INS4vs.WT4 | Ratio_INS4vs.WT4 | Related to Diabetes | Kidney Expression and/or Function |
|---|---|---|---|---|---|---|---|
| D3Z7P3 | Glutaminase kidney isoform, mitochondrial OS | 0.000311 | 2.94 | 0.000311 | 2.33 | YES | YES |
| Q91W43 | Glycine dehydrogenase (decarboxylating), mitochondrial | 0.000311 | 2.16 | 0.000155 | 2.88 | YES | YES |
| P02535 | Keratin, type I cytoskeletal 10 | 0.00124 | 4.12 | 0.000155 | 3.62 | NO | NO |
| O88986 | 2-amino-3-ketobutyrate coenzyme A ligase, mitochondrial | 0.00214 | 3.54 | 0.00295 | 2.57 | YES | YES |
| Q99K67 | Alpha-aminoadipic semialdehyde synthase, | 0.00218 | 1.76 | 0.00295 | 2.57 | YES | YES |
| P26645 | Myristoylated alanine-rich C-kinase substrate | 0.00314 | 2.21 | 0.00986 | 2.58 | NO | YES |
| P01029 | Complement C4-B | 0.00897 | 5.57 | 0.00295 | 4.42 | NO | NO |
| Q99L43 | Phosphatidate cytidylyltransferase 2 | 0.0125 | 2.12 | 0.00295 | 1.92 | NO | YES |
| P27546 | Microtubule-associated protein 4 | 0.0128 | 6.06 | 0.0148 | 1.73 | NO | YES |
| Q02013 | Aquaporin-1 | 0.0128 | 2.23 | 0.00187 | 2.24 | NO | YES |
| Q9JKV5 | Secretory carrier-associated membrane protein 4 | 0.0173 | 2.065 | 0.033 | 2.59 | NO | YES |
| P01872 | Ig mu chain C region | 0.0231 | 4.94 | 0.00147 | 14.0 | NO | NO |
| Q3U9G9 | Lamin-B receptor | 0.0231 | 3.59 | 0.00817 | 2.284 | NO | NO |
| O09111 | NADH dehydrogenase [ubiquinone] 1 beta | 0.0289 | 1.898 | 0.00699 | 1.94 | YES | |
| Q8BGA8 | Acyl-coenzyme A synthetase ACSM5, mitochondrial | 0.0289 | 1.52 | 0.000622 | 1.95 | NO | YES |
| P11276 | Fibronectin | 0.0292 | 3.05 | 0.000554 | 103 | YES | YES |
| O35682 | Myeloid-associated differentiation marker | 0.0321 | 2.85 | 0.00699 | 2.25 | NO | NO |
| O70251 | Elongation factor 1-beta | 0.0321 | 1.76 | 0.00135 | 2.30 | NO | YES |
| Q9ESD7 | Dysferlin | 0.0321 | 2.16 | 0.00377 | 4.55 | NO | YES |
| Q8CFA2 | Aminomethyltransferase, mitochondrial | 0.04 | 2.17 | 0.00295 | 2.95 | YES | YES |
| Q64669 | NAD(P)H dehydrogenase [quinone] 1 | 0.043 | 6.96 | 0.01 | 1.60 | NO | YES |
| Accession | Name | pval_INS2vs.WT2 | Ratio_INS2vs.WT2 | pval_INS4vs.WT4 | Ratio_INS4vs.WT4 | Related to Diabetes | Kidney Expression and/or Function |
|---|---|---|---|---|---|---|---|
| Q99MZ7 | Peroxisomal trans-2-enoyl-CoA reductase | 0.000311 | 0.485 | 0.00466 | 0.565 | NO | YES |
| Q9DBM2 | Peroxisomal bifunctional enzyme | 0.000311 | 0.453 | 0.01 | 0.664 | NO | YES |
| O09174 | Alpha-methylacyl-CoA racemase | 0.000622 | 0.52 | 0.00187 | 0.56 | YES | YES |
| P11930 | Nucleoside diphosphate-linked moiety X motif | 0.000622 | 0.2499 | 0.000311 | 0.23 | NO | YES |
| Q61847 | Meprin A subunit beta | 0.000622 | 0.408 | 0.00187 | 0.455 | YES | YES |
| Q9DC50 | Peroxisomal carnitine O-octanoyltransferase | 0.00124 | 0.413 | 0.0122 | 0.296 | YES | YES |
| Q5FW60 | Major urinary protein 20 | 0.00215 | only in wt | 0.0324 | only in wt | NO | NO |
| Q64462 | Cytochrome P450 4B1 | 0.00218 | 0.387 | 0.00109 | 0.473 | NO | NO |
| Q91WU0 | Carboxylesterase 1F | 0.00373 | 0.387 | 0.00466 | 0.579 | NO | YES |
| Q9D826 | Peroxisomal sarcosine oxidase | 0.005905 | 0.566932 | 0.0499 | 0.615 | YES | YES |
| Q9R0H0 | Peroxisomal acyl-coenzyme A oxidase 1 | 0.00591 | 0.599 | 0.00109 | 0.496 | YES | YES |
| P16015 | Carbonic anhydrase 3 | 0.00721 | only in wt | 0.0071 | 0.119 | NO | NO |
| Q3UBX0 | Transmembrane protein 109 | 0.014 | 0.590 | 0.0289 | 0.289 | NO | YES |
| Q8C0I1 | Alkyldihydroxyacetonephosphate synthase, peroxisomal | 0.0157 | 0.297 | 0.000682 | 0.08254 | YES | YES |
| P03930 | ATP synthase protein 8 | 0.0173 | 0.353 | 0.0287 | 0.0285 | NO | NO |
| P28825 | Meprin A subunit alpha | 0.0205 | 0.326 | 0.000155 | 0.424 | YES | YES |
| Q3UNX5 | Acyl-coenzyme A synthetase ACSM3, mitochondrial | 0.0289 | 0.431 | 0.00257 | 0.203 | NO | YES |
| Q9DCC4 | Pyrroline-5-carboxylate reductase 3 | 0.0356 | 0.537 | 0.0204 | 0.287 | NO | YES |
| GO Term | Group p Value Corrected with BH | Group Genes |
|---|---|---|
| Cellular amino acid catabolic process | 2.51 × 10⁻⁶ | Aass, Amt, Gcat, Gldc, Gls |
| Alpha-amino acid catabolic process | 2.83 × 10⁻⁶ | Aass, Amt, Gcat, Gldc, Gls |
| Response to mercury ion | 0.0004 | Aqp1, Cds2, Dysf, Fn1, Krt10 |
| Cellular response to osmotic stress | 0.00208 | Aqp1, Cds2, Dysf |
| Fatty acid catabolic process | 2.36 × 10⁻⁷ | Acox1, Ces1f, Crot, Ehhadh, Pipox, Pycrl |
| Isoprenoid catabolic process | 0.0218 | Amacr |
| Ether lipid biosynthetic process | 0.0275 | Agps |
| Trans-2-enoyl-CoA reductase (NADPH) activity | 0.029 | Pecr |
Publisher’s Note: MDPI stays neutral with regard to jurisdictional claims in published maps and institutional affiliations. |
© 2022 by the authors. Licensee MDPI, Basel, Switzerland. This article is an open access article distributed under the terms and conditions of the Creative Commons Attribution (CC BY) license (https://creativecommons.org/licenses/by/4.0/).
Share and Cite
Tserga, A.; Pouloudi, D.; Saulnier-Blache, J.S.; Stroggilos, R.; Theochari, I.; Gakiopoulou, H.; Mischak, H.; Zoidakis, J.; Schanstra, J.P.; Vlahou, A.; et al. Proteomic Analysis of Mouse Kidney Tissue Associates Peroxisomal Dysfunction with Early Diabetic Kidney Disease. Biomedicines 2022, 10, 216. https://doi.org/10.3390/biomedicines10020216
Tserga A, Pouloudi D, Saulnier-Blache JS, Stroggilos R, Theochari I, Gakiopoulou H, Mischak H, Zoidakis J, Schanstra JP, Vlahou A, et al. Proteomic Analysis of Mouse Kidney Tissue Associates Peroxisomal Dysfunction with Early Diabetic Kidney Disease. Biomedicines. 2022; 10(2):216. https://doi.org/10.3390/biomedicines10020216
Chicago/Turabian StyleTserga, Aggeliki, Despoina Pouloudi, Jean Sébastien Saulnier-Blache, Rafael Stroggilos, Irene Theochari, Harikleia Gakiopoulou, Harald Mischak, Jerome Zoidakis, Joost Peter Schanstra, Antonia Vlahou, and et al. 2022. "Proteomic Analysis of Mouse Kidney Tissue Associates Peroxisomal Dysfunction with Early Diabetic Kidney Disease" Biomedicines 10, no. 2: 216. https://doi.org/10.3390/biomedicines10020216
APA StyleTserga, A., Pouloudi, D., Saulnier-Blache, J. S., Stroggilos, R., Theochari, I., Gakiopoulou, H., Mischak, H., Zoidakis, J., Schanstra, J. P., Vlahou, A., & Makridakis, M. (2022). Proteomic Analysis of Mouse Kidney Tissue Associates Peroxisomal Dysfunction with Early Diabetic Kidney Disease. Biomedicines, 10(2), 216. https://doi.org/10.3390/biomedicines10020216