
The Value of SIRT1/FOXO1 Signaling Pathway in Early Detection of Cardiovascular Risk in Children with β-Thalassemia Major

 , and
, and
Abstract
1. Introduction
2. Materials and Methods
2.1. Inclusion and Exclusion Criteria
2.2. Echocardiography
2.2.1. Carotid Intima-Media Thickness (CIMT)
2.2.2. Arterial Carotid Beta Stiffness (β Index)
2.3. Blood Sample Collection
2.4. Biochemical Assessment
2.4.1. Assessment of SIRT1, FOXO1, Hepcidin, and HSP72
2.4.2. Assessment of Redox Status Parameters
2.4.3. Determination of FOXO1 Gene Expression
2.5. Statistical Analysis
3. Results
4. Discussion
5. Conclusions
Author Contributions
Funding
Institutional Review Board Statement
Informed Consent Statement
Data Availability Statement
Acknowledgments
Conflicts of Interest
References
- Rund, D.; Rachmilewitz, E. Beta-thalassemia. N. Engl. J. Med. 2005, 353, 1135–1146. [Google Scholar] [CrossRef] [PubMed]
- Voskou, S.; Aslan, M.; Fanis, P.; Phylactides, M.; Kleanthous, M. Oxidative stress in β-thalassaemia and sickle cell disease. Redox Biol. 2015, 6, 226–239. [Google Scholar] [CrossRef] [PubMed]
- Camaschella, C.; Pagani, A.; Nai, A.; Silvestri, L. The mutual control of iron and erythropoiesis. Int. J. Lab Hematol. 2016, 38 (Suppl. S1), 20–26. [Google Scholar] [CrossRef] [PubMed]
- Vinchi, F.; Vercellotti, G.M.; Belcher, J.D.; Sparla, R.; Fibach, E.; Zreid, H.; Rasras, R.; Ghoti, H.; Muckenthaler, M.U.; Rachmilewitz, E.A. Elevated systemic heme and iron levels as a risk factor for vascular dysfunction and atherosclerosis: Evidence from a beta-thalassemia cohort study. Atherosclerosis 2017, 263, 107–108. [Google Scholar] [CrossRef]
- Abaza, S.E.; Abdel-Salam, A.; Baz, A.A.; Mohamed, A.A. Carotid Doppler ultrasonography as a screening tool of early atherosclerotic changes in children and young adults with β-thalassemia major. J. Ultrasound. 2017, 20, 301–308. [Google Scholar] [CrossRef] [PubMed]
- Tantawy, A.A.; Adly, A.A.; El Maaty, M.G.; Amin, S.A. Subclinical atherosclerosis in young beta-thalassemia major patients. Hemoglobin 2009, 33, 463–474. [Google Scholar] [CrossRef] [PubMed]
- Sherief, L.M.; Dawood, O.; Ali, A.; Sherbiny, H.S.; Kamal, N.M.; Elshanshory, M.; Alazez, O.A.; Alhady, M.A.; Nour, M.; Mokhtar, W.A. Premature atherosclerosis in children with beta-thalassemia major: New diagnostic marker. BMC Pediatr. 2017, 17, 69. [Google Scholar] [CrossRef]
- Libby, P.; Ridker, P.M.; Hansson, G.K.; Leducq Transatlantic Network on Atherothrombosis. Inflammation in atherosclerosis: From pathophysiology to practice. J. Am. Coll Cardiol. 2009, 54, 2129–2138. [Google Scholar] [CrossRef]
- Palombo, C.; Kozakova, M. Arterial stiffness, atherosclerosis and cardiovascular risk: Pathophysiologic mechanisms and emerging clinical indications. Vascul Pharmacol. 2016, 77, 1–7. [Google Scholar] [CrossRef]
- Farmakis, D.; Triposkiadis, F.; Lekakis, J.; Parissis, J. Heart failure in hemoglobinopathies: Pathophysiology, clinical phenotypes, and management. Eur. J. Heart Fail. 2017, 19, 479–489. [Google Scholar] [CrossRef]
- Patel, A.K.; Suri, H.S.; Singh, J.; Kumar, D.; Shafique, S.; Nicolaides, A.; Jain, S.K.; Saba, L.; Gupta, A.; Laird, J.R.; et al. A Review on Atherosclerotic Biology, Wall Stiffness, Physics of Elasticity, and Its Ultrasound-Based Measurement. Curr. Atheroscler. Rep. 2016, 18, 83. [Google Scholar] [CrossRef]
- Kaestner, K.H.; Knochel, W.; Martinez, D.E. Unified nomenclature for the winged helix/forkhead transcription factors. Genes Dev. 2000, 14, 142–146. [Google Scholar] [CrossRef]
- Brunet, A.; Sweeney, L.B.; Sturgill, J.F.; Chua, K.F.; Greer, P.L.; Lin, Y.; Tran, H.; Ross, S.E.; Mostoslavsky, R.; Cohen, H.Y.; et al. Stress-dependent regulation of FOXO transcription factors by the SIRT1 deacetylase. Science 2004, 303, 2011–2015. [Google Scholar] [CrossRef]
- Zheng, X.; Xu, F.; Liang, H.; Cao, H.; Cai, M.; Xu, W.; Weng, J. SIRT1/HSF1/HSP pathway is essential for exenatide-alleviated, lipid-induced hepatic endoplasmic reticulum stress. Hepatology 2017, 66, 809–824. [Google Scholar] [CrossRef]
- Fernandes, M.; Xiao, H.; Lis, J.T. Binding of heat shock factor to and transcriptional activation of heat shock genes in Drosophila. Nucleic. Acids Res. 1995, 23, 4799–4804. [Google Scholar] [CrossRef]
- Kedenko, L.; Lamina, C.; Kedenko, I.; Kollerits, B.; Kiesslich, T.; Iglseder, B.; Kronenberg, F.; Paulweber, B. Genetic polymorphisms at SIRT1 and FOXO1 are associated with carotid atherosclerosis in the SAPHIR cohort. BMC Med. Genet. 2014, 15, 112. [Google Scholar] [CrossRef]
- Stein, S.; Matter, C.M. Protective roles of SIRT1 in atherosclerosis. Cell Cycle 2011, 10, 640–647. [Google Scholar] [CrossRef]
- Ota, H.; Eto, M.; Ogawa, S.; Iijima, K.; Akishita, M.; Ouchi, Y. SIRT1/eNOS axis as a potential target against vascular senescence, dysfunction and atherosclerosis. J. Atheroscler. Thromb. 2010, 17, 431–435. [Google Scholar] [CrossRef]
- Stein, J.H.; Korcarz, C.E.; Hurst, R.T.; Lonn, E.; Kendall, C.B.; Mohler, E.R.; Najjar, S.S.; Rembold, C.M.; Post, W.S.; American Society of Echocardiography Carotid Intima-Media Thickness Task Force. Use of carotid ultrasound to identify subclinical vascular disease and evaluate cardiovascular disease risk: A consensus statement from the American Society of Echocardiography Carotid Intima-Media Thickness Task Force. Endorsed by the Society for Vascular Medicine. J. Am. Soc. Echocardiogr. 2008, 21, 93–111, quiz 189-90. [Google Scholar] [CrossRef]
- Youn, Y.J.; Lee, N.S.; Kim, J.Y.; Lee, J.W.; Sung, J.K.; Ahn, S.G.; You, B.S.; Lee, S.H.; Yoon, J.; Choe, K.H.; et al. Normative values and correlates of mean common carotid intima-media thickness in the Korean rural middle-aged population: The Atherosclerosis Risk of Rural Areas iN Korea General Population (ARIRANG) study. J. Korean Med. Sci. 2011, 26, 365–371. [Google Scholar] [CrossRef]
- Salminen, A.; Kaarniranta, K.; Kauppinen, A. Crosstalk between Oxidative Stress and SIRT1: Impact on the Aging Process. Int. J. Mol. Sci. 2013, 14, 3834–3859. [Google Scholar] [CrossRef]
- Jia, Y.; Xu, H.; Li, Y.; Wei, C.; Guo, R.; Wang, F.; Wu, Y.; Liu, J.; Jia, J.; Yan, J.; et al. A Modified Ficoll-Paque Gradient Method for Isolating Mononuclear Cells from the Peripheral and Umbilical Cord Blood of Humans for Biobanks and Clinical Laboratories. Biopreserv. Biobank 2018, 16, 82–91. [Google Scholar] [CrossRef]
- van der Sijde, F.; Li, Y.; Schraauwen, R.; de Koning, W.; van Eijck, C.H.J.; Mustafa, D.A.M. RNA from stabilized whole blood enables more comprehensive immune gene expression profiling compared to RNA from peripheral blood mononuclear cells. PLoS ONE 2020, 15, e0235413. [Google Scholar] [CrossRef]
- Livak, K.J.; Schmittgen, T.D. Analysis of relative gene expression data using real-time quantitative PCR and the 2(-Delta Delta C(T)) Method. Methods 2001, 25, 402–408. [Google Scholar] [CrossRef]
- Nassef, S.; El Shenoufy, M.; Rawi, R.; El Demerdash, D.; Hassan, M.; Mustafa, H.; Mattar, M.; El Husseiny, N. Assessment of Atherosclerosis in Peripheral and Central Circulation in Adult β Thalassemia Intermedia Patients by Color Doppler Ultrasound: Egyptian Experience. J. Vasc. Res. 2020, 57, 206–212. [Google Scholar] [CrossRef] [PubMed]
- Nafady, A.; Ali, S.S.; El Masry, H.M.A.; Baseer, K.A.; Qubaisy, H.M.; Mahmoud, S.G.; Nafady-Hego, H.A. Oxidative stress in pediatric patients with β thalassemia major. Egypt. J. Haematol. 2007, 42, 123. [Google Scholar] [CrossRef]
- Dogan, M.; Citak, E.C. The evaluation of carotid intima-media thickness in children with beta-thalassaemia major. Cardiol Young 2012, 22, 79–83. [Google Scholar] [CrossRef]
- Hahalis, G.; Zacharioglou, E.; Xanthopoulou, I.; Koniari, I.; Kalogeropoulou, C.; Tsota, I.; Rigopoulou, A.; Diamantopoulos, A.; Gkizas, V.; Davlouros, P.; et al. Coronary atherosclerosis burden is not advanced in patients with β-thalassemia despite premature extracardiac atherosclerosis: A coronary artery calcium score and carotid intima-media thickness study. J. Geriatr. Cardiol. 2016, 13, 158–162. [Google Scholar] [CrossRef]
- Lechner, K.; von Schacky, C.; McKenzie, A.L.; Worm, N.; Nixdorff, U.; Lechner, B.; Kränkel, N.; Halle, M.; Krauss, R.M.; Scherr, J. Lifestyle factors and high-risk atherosclerosis: Pathways and mechanisms beyond traditional risk factors. Eur. J. Prev. Cardiol. 2020, 27, 394–406. [Google Scholar] [CrossRef]
- Kawashima, S.; Yokoyama, M. Dysfunction of endothelial nitric oxide synthase and atherosclerosis. Arterioscler. Thromb. Vasc. Biol. 2004, 24, 998–1005. [Google Scholar] [CrossRef]
- Boudrahem-Addour, N.; Izem-Meziane, M.; Bouguerra, K.; Nadjem, N.; Zidani, N.; Belhani, M.; Djerdjouri, B. Oxidative status and plasma lipid profile in β-thalassemia patients. Hemoglobin 2015, 39, 36–41. [Google Scholar] [CrossRef] [PubMed]
- Atmakusuma, T.D.; Kalwani, R.; Nasution, S.A.; Rumende, C.M. Correlation of Serum Ferritin and Cardiac Iron Toxicity with Cardiac Function in Transfusion Dependent Beta-Thalassemia Major Patients. Acta Med. Indones. 2021, 53, 291–298. [Google Scholar] [PubMed]
- Tripathy, I.; Panja, A.; Dolai, T.K.; Mallick, A.K. Comparative Efficacy and Safety Between Deferiprone and Deferasirox with Special Reference to Serum Ferritin Level and Cardiac Function in Bengali β-Thalassemia Major Children. Hemoglobin 2021, 45, 296–302. [Google Scholar] [CrossRef] [PubMed]
- Bresgen, N.; Eckl, P.M. Oxidative stress and the homeodynamics of iron metabolism. Biomolecules 2015, 5, 808–847. [Google Scholar] [CrossRef]
- Ibrahim, H.A.; Zakaria, S.S.; Elbatch, M.M.; Elshanshory, M.R.; Eldardiry, S.A.E. New insight on premature atherosclerosis in Egyptian children with Î2-thalassemia major. Afr. J. Biochem. Res. 2018, 12, 86–93. [Google Scholar] [CrossRef]
- Sukhbaatar, N.; Weichhart, T. Iron Regulation: Macrophages in Control. Pharmaceuticals 2018, 11, 137. [Google Scholar] [CrossRef]
- Porter, J.B.; de Witte, T.; Cappellini, M.D.; Gattermann, N. New insights into transfusion-related iron toxicity: Implications for the oncologist. Crit. Rev. Oncol. Hematol. 2016, 99, 261–271. [Google Scholar] [CrossRef]
- Nemeth, E. Hepcidin in beta-thalassemia. Ann NY Acad. Sci. 2010, 1202, 31–35. [Google Scholar] [CrossRef]
- Tantiworawit, A.; Khemakapasiddhi, S.; Rattanathammethee, T.; Hantrakool, S.; Chai-Adisaksopha, C.; Rattarittamrong, E.; Norasetthada, L.; Charoenkwan, P.; Srichairatanakool, S.; Fanhchaksai, K. Correlation of hepcidin and serum ferritin levels in thalassemia patients at Chiang Mai University Hospital. Biosci. Rep. 2021, 41, BSR20203352. [Google Scholar] [CrossRef]
- Kobayashi, Y.; Furukawa-Hibi, Y.; Chen, C.; Horio, Y.; Isobe, K.; Ikeda, K.; Motoyama, N. SIRT1 is critical regulator of FOXO-mediated transcription in response to oxidative stress. Int. J. Mol. Med. 2005, 16, 237–243. [Google Scholar] [CrossRef] [PubMed]
- Dobiásová, M. AIP–aterogenní index plazmy jako významný prediktor kardiovaskulárního rizika: Od výzkumu do praxe [AIP--atherogenic index of plasma as a significant predictor of cardiovascular risk: From research to practice]. Vnitr. Lek. 2006, 52, 64–71, Czech. [Google Scholar] [CrossRef]
- Kattamis, C.; Lazaropoulou, C.; Delaporta, P.; Apostolakou, F.; Kattamis, A.; Papassotiriou, I. Disturbances of biomarkers of iron and oxidant-antioxidant homeostasis in patients with beta-thalassemia intermedia. Pediatr. Endocrinol. Rev. 2011, 8 (Suppl. S2), 256–262. [Google Scholar]
- Franco, S.S.; De Falco, L.; Ghaffari, S.; Brugnara, C.; Sinclair, D.A.; Matte, A.; Iolascon, A.; Mohandas, N.; Bertoldi, M.; An, X.; et al. Resveratrol accelerates erythroid maturation by activation of FoxO3 and ameliorates anemia in beta-thalassemic mice. Haematologica 2014, 99, 267–275. [Google Scholar] [CrossRef]
- Wang, Y.; Zhou, Y.; Graves, D.T. FOXO transcription factors: Their clinical significance and regulation. Biomed Res. Int. 2014, 2014, 925350. [Google Scholar] [CrossRef]
- Liu, J.; Yi, X.; Tao, Y.; Wang, Y.; Xu, Z. Insulin-receptor substrate 1 protects against injury in endothelial cell models of ox-LDL-induced atherosclerosis by inhibiting ER stress/oxidative stress-mediated apoptosis and activating the Akt/FoxO1 signaling pathway. Int. J. Mol. Med. 2020, 46, 1671–1682. [Google Scholar] [CrossRef]
- Jian, D.; Wang, Y.; Jian, L.; Tang, H.; Rao, L.; Chen, K.; Jia, Z.; Zhang, W.; Liu, Y.; Chen, X.; et al. METTL14 aggravates endothelial inflammation and atherosclerosis by increasing FOXO1 N6-methyladeosine modifications. Theranostics 2020, 10, 8939–8956. [Google Scholar] [CrossRef]
- Babaee, M.; Chamani, E.; Ahmadi, R.; Bahreini, E.; Balouchnejadmojarad, T.; Nahrkhalaji, A.S.; Fallah, S. The expression levels of miRNAs- 27a and 23a in the peripheral blood mononuclear cells (PBMCs) and their correlation with FOXO1 and some inflammatory and anti-inflammatory cytokines in the patients with coronary artery disease (CAD). Life Sci. 2020, 256, 117898. [Google Scholar] [CrossRef]
- Puthanveetil, P.; Wan, A.; Rodrigues, B. FoxO1 is crucial for sustaining cardiomyocyte metabolism and cell survival. Cardiovasc. Res. 2013, 97, 393–403. [Google Scholar] [CrossRef]
- Qiang, L.; Tsuchiya, K.; Kim-Muller, J.Y.; Lin, H.V.; Welch, C.; Accili, D. Increased atherosclerosis and endothelial dysfunction in mice bearing constitutively deacetylated alleles of Foxo1 gene. J. Biol. Chem. 2012, 287, 13944–13951. [Google Scholar] [CrossRef]
- Kitada, M.; Ogura, Y.; Koya, D. The protective role of Sirt1 in vascular tissue: Its relationship to vascular aging and atherosclerosis. Aging (Albany NY) 2016, 8, 2290–2307. [Google Scholar] [CrossRef]
- Naqvi, T.Z.; Lee, M.S. Carotid intima-media thickness and plaque in cardiovascular risk assessment. JACC Cardiovasc. Imaging 2014, 7, 1025–1038. [Google Scholar] [CrossRef] [PubMed]
- Antonini-Canterin, F.; Carerj, S.; Di Bello, V.; Di Salvo, G.; La Carrubba, S.; Vriz, O.; Pavan, D.; Balbarini, A.; Nicolosi, G.L.; Research Group of the Italian Society of Cardiovascular Echography (SIEC). Arterial stiffness and ventricular stiffness: A couple of diseases or a coupling disease? A review from the cardiologist’s point of view. Eur. J. Echocardiogr. 2009, 10, 36–43. [Google Scholar] [CrossRef] [PubMed]
- Cheung, Y.F.; Chan, G.C.; Ha, S.Y. Arterial stiffness and endothelial function in patients with beta-thalassemia major. Circulation 2002, 106, 2561–2566. [Google Scholar] [CrossRef] [PubMed]
- Yang, X.; Wei, J.; He, Y.; Jing, T.; Li, Y.; Xiao, Y.; Wang, B.; Wang, W.; Zhang, J.; Lin, R. SIRT1 inhibition promotes atherosclerosis through impaired autophagy. Oncotarget 2017, 8, 51447–51461. [Google Scholar] [CrossRef] [PubMed]
- Akkafa, F.; Halil Altiparmak, I.; Erkus, M.E.; Aksoy, N.; Kaya, C.; Ozer, A.; Sezen, H.; Oztuzcu, S.; Koyuncu, I.; Umurhan, B. Reduced SIRT1 expression correlates with enhanced oxidative stress in compensated and decompensated heart failure. Redox Biol. 2015, 6, 169–173. [Google Scholar] [CrossRef] [PubMed][Green Version]
- Kleindienst, R.; Xu, Q.; Willeit, J.; Waldenberger, F.R.; Weimann, S.; Wick, G. Immunology of atherosclerosis. Demonstration of heat shock protein 60 expression and T lymphocytes bearing alpha/beta or gamma/delta receptor in human atherosclerotic lesions. Am. J. Pathol. 1993, 142, 1927–1937. [Google Scholar]
- Sauvage, F.; Messaoudi, S.; Fattal, E.; Barratt, G.; Vergnaud-Gauduchon, J. Heat shock proteins and cancer: How can nanomedicine be harnessed? J. Control Release 2017, 248, 133–143. [Google Scholar] [CrossRef]
- Bobryshev, Y.V.; Lord, R.S. Expression of heat shock protein-70 by dendritic cells in the arterial intima and its potential significance in atherogenesis. J. Vasc. Surg. 2002, 35, 368–375. [Google Scholar] [CrossRef]
- Suzuki, H.; Kosuge, Y.; Kobayashi, K.; Kurosaki, Y.; Ishii, N.; Aoyama, N.; Ishihara, K.; Ichikawa, T. Heat-shock protein 72 promotes platelet aggregation induced by various platelet activators in rats. Biomed Res. 2017, 38, 175–182. [Google Scholar] [CrossRef][Green Version]
- Pockley, A.G.; Georgiades, A.; Thulin, T.; de Faire, U.; Frostegård, J. Serum heat shock protein 70 levels predict the development of atherosclerosis in subjects with established hypertension. Hypertension 2003, 42, 235–238. [Google Scholar] [CrossRef]
- Kazemi Fard, T.; Ahmadi, R.; Akbari, T.; Moradi, N.; Fadaei, R.; Kazemi Fard, M.; Fallah, S. Klotho, FOXO1 and cytokines associations in patients with coronary artery disease. Cytokine 2021, 141, 155443. [Google Scholar] [CrossRef]


| Parameters | Groups | ANOVA | ||||
|---|---|---|---|---|---|---|
| Group I (n = 50) Control | Group II (n = 50) CIMT ≤ 0.5 mm | Group III (n = 50) CIMT > 0.5 mm | F | p-value | ||
| Age | Range | 6–13 | 6–12 | 6–14 | 0.384 | 0.682 (ns) |
| Mean ± SD | 8.700 ± 1.799 | 8.840 ± 1.777 | 8.850 ± 1.911 | |||
| BMI (kg/m2) | Range | 18.5–23.6 | 18.6–24 | 23–26.5 | 153.943 | <0.001 * |
| Mean ± SD | 20.908 ± 1.682 | 21.222 ± 1.646 * | 25.5 ± 0.712 *# | |||
| CIMT (mm) | Range | 0.20–0.39 | 0.24–0.48 | 0.51–1.10 | 296.486 | <0.001 * |
| Mean ± SD | 0.278 ± 0.057 | 0.380 ± 0.054 * | 0.774 ± 0.169 *# | |||
| Beta stiffness | Range | 2–2.6 | 3–3.7 | 4–4.6 | 668.952 | <0.001 * |
| Mean ± SD | 2.316 ± 0.162 | 3.418 ± 0.172 * | 4.278 ± 0.1345 *# | |||
| Ferritin (ng/dl) | Range | 28–165 | 1450–7655 | 1655–7800 | 209.315 | <0.001 * |
| Mean ± SD | 60.94 ± 29.860 | 4327.32 ±1397.42 * | 4570.88 ± 1629.94 *# | |||
| AIP | Range | 0.11–0.30 | 0.15–0.35 | 0.46–0.63 | 720.547 | <0.001 * |
| Mean ± SD | 0.219 ±0.050 | 0.277 ± 0.047 * | 0.552 ± 0.043 *# | |||
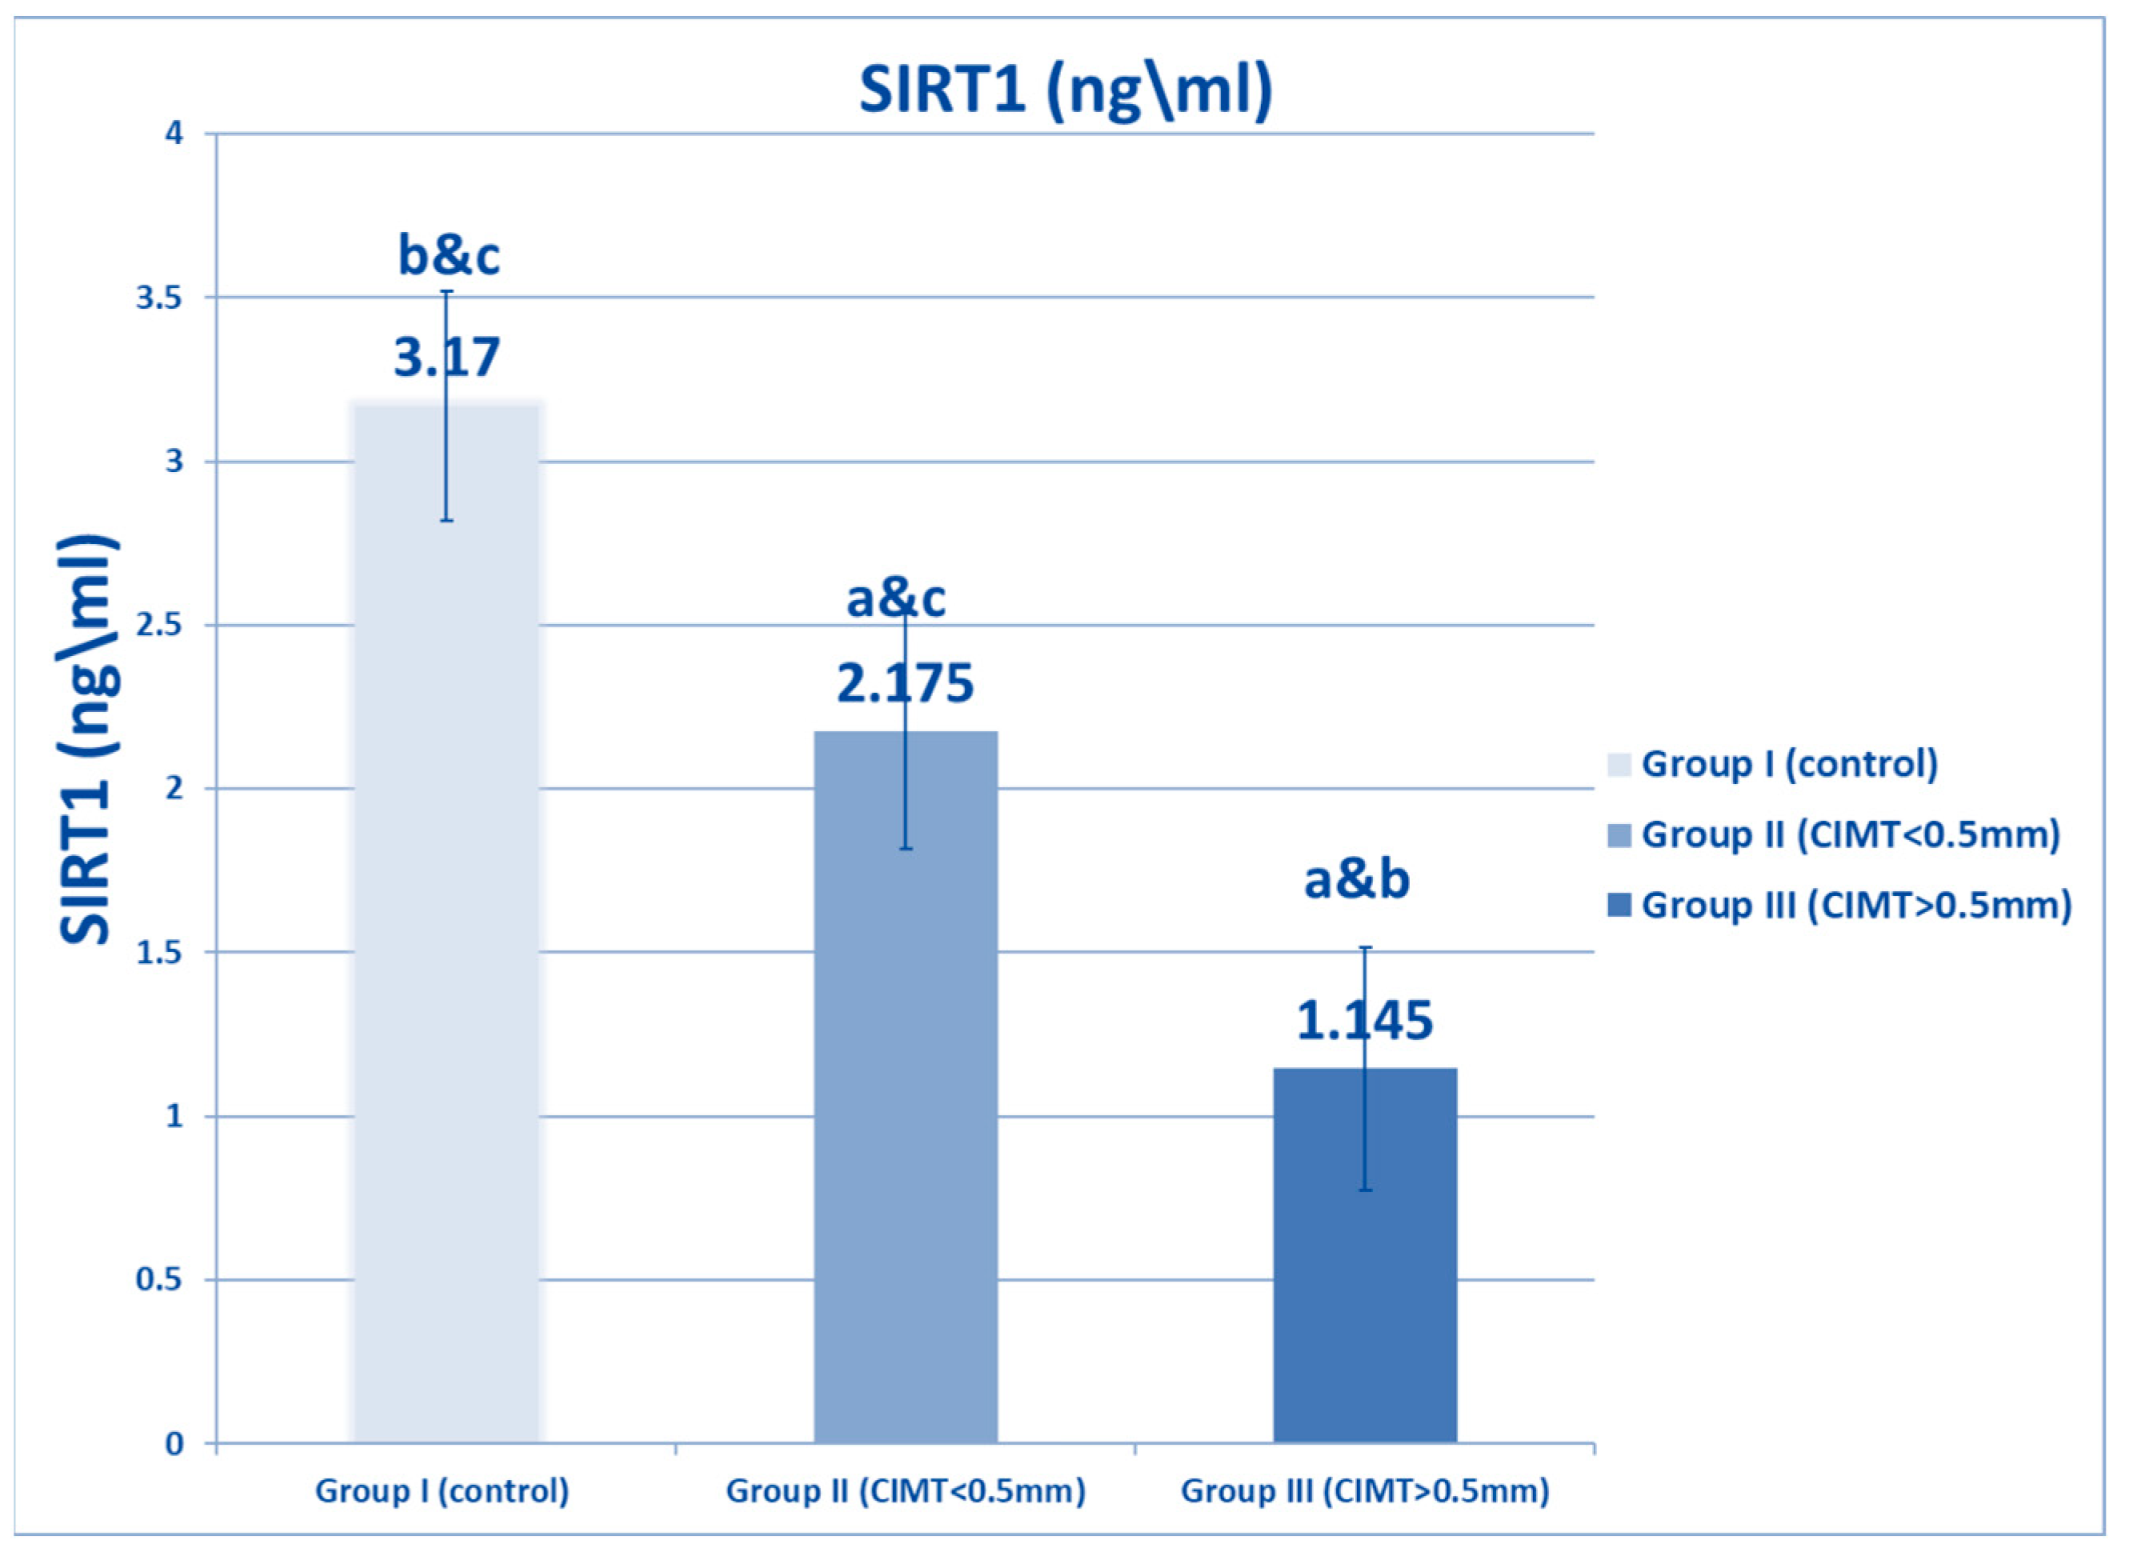
| SIRT1 (ng/mL) | Range | 2.5–4 | 1.5–3 | 0.5–1.9 | 278.359 | <0.001 * |
| Mean ± SD | 3.17 ± 0.53 | 2.175 ± 0.358 * | 1.145 ± 0.371 *# | |||
| ANP (pg/mL) | Range | 25–67 | 60–98 | 105–126 | 552.919 | <0.001 * |
| Mean ± SD | 44.12 ± 13.17 | 75.34 ± 11.19 * | 113.66 ± 5.42 *# | |||
| CPK MB (U/L) | Range | 25–126 | 28–132 | 29–140 | 0.040 | <0.961 |
| Mean ± SD | 59.24 ± 26.99 | 59.5 ± 26.99 | 60.78 ± 33.41 | |||
| LDH1 (U/L) | Range | 160–200 | 180- 240 | 210–280 | 434.376 | <0.001 * |
| Mean ± SD | 179.38 ±10.016 | 222.8 ± 12.378 * | 258.32 ± 16.918 *# | |||
| Hepcidin (ng/mL) | Range | 33–42 | 18–25 | 13–15 | 1735.039 | < 0.001 * |
| Mean ± SD | 37.40 ± 3.024 | 22.30 ± 1.555 * | 13.958 ± 0.803 *# | |||
| HSP72 (ng/L) | Range | 25.20–36.15 | 48.07–184.86 | 50.73–200.65 | 57.608 | <0.001 * |
| Mean ± SD | 30.128 ± 3.562 | 92.349 ± 42.561 * | 105.845 ± 49.223 *# | |||
| SOD (U/L) | Range | 6.5–8.5 | 5.6–7 | 3–4.25 | 1111.727 | <0.001 * |
| Mean ± SD | 7.48 ± 0.572 | 6.51 ± 0.428 * | 3.50 ± 0.263 *# | |||
| Catalase (U/L) | Range | 32–35 | 29–33.2 | 11.5–13.6 | 8836.11 | <0.001 * |
| Mean ± SD | 33.614 ± 0.989 | 30.046 ± 0.962 * | 12.398 ± 0.540 *# | |||
| MDA (Nmol/mL) | Range | 1.25–3.5 | 4–8.1 | 5.5–8.54 | 464.527 | <0.001 * |
| Mean ± SD | 2.236 ± 0.75 | 6.258 ± 1.047 * | 7.365 ± 0.832 *# | |||
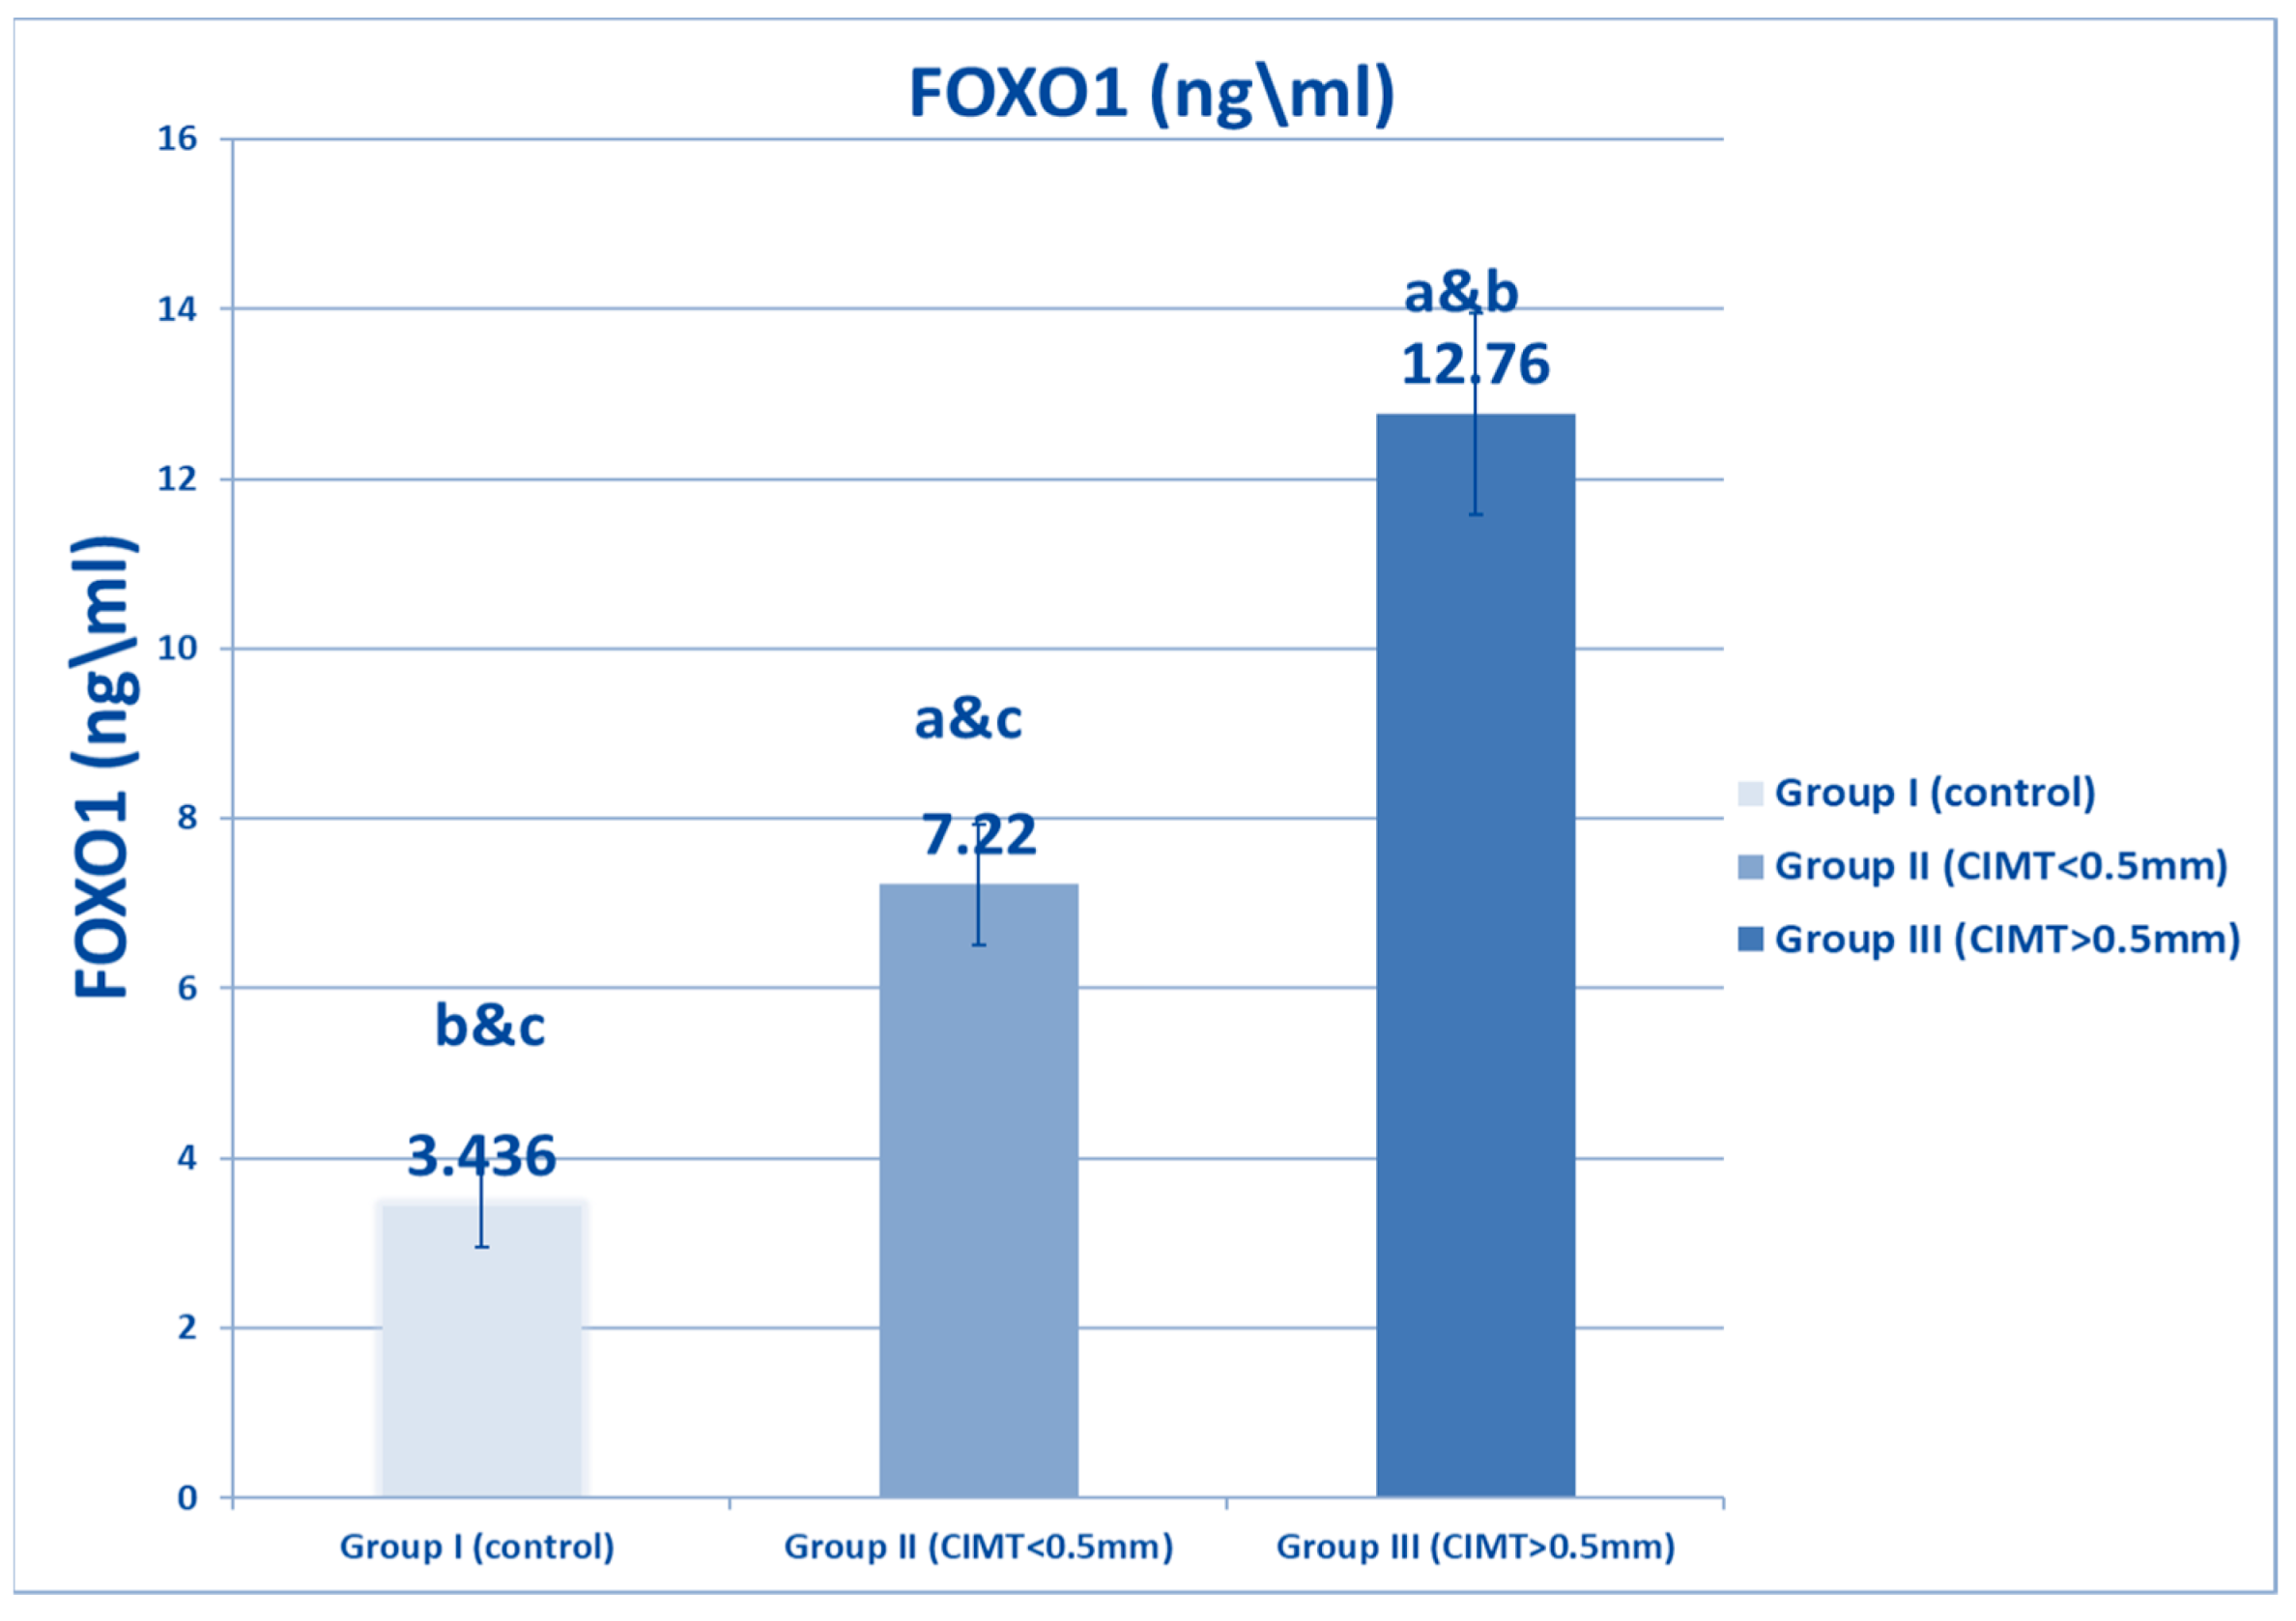
| FOXO1 (Ng/mL) | Range | 3–4.9 | 6–8.3 | 8.5–15.7 | 1541.81 | <0.001 * |
| Mean ± SD | 3.436 ± 0.489 | 7.22 ± 0.704 * | 12.76 ± 1.184 *# | |||
| FOXO1 relative gene expression | Range | 0.8–1.9 | 0.9–2.23 | 2.3–3.4 | 496.654 | <0.001 * |
| Mean ± SD | 1.155 ± 0.226 | 1.725 ± 0.277 * | 2.702 ± 0.239 *# | |||
| Pearson’s Correlations | Partial Correlation Coefficient | |||
|---|---|---|---|---|
| CIMT (mm) | ||||
| r | p-Value | r′ | p-Value | |
| BMI | 0.716 | <0.001 * | −0.019 | 0.829 |
| AIP | 0.851 | <0.001 * | 0.095 | 0.270 |
| Hepcidin (ng/mL) | −0.589 | <0.001 * | 0.062 | 0.470 |
| ANP (pg/mL) | 0.825 | <0.001 * | 0.079 | 0.355 |
| CPK MB (U/L) | −0.013 | 0.875 | −0.150 | 0.078 |
| LDH1 (U/L) | 0.765 | <0.001 * | −0.039 | 0.646 |
| Hsp72 (ng/mL) | 0.365 | <0.001 * | −0.306 | <0.001 * |
| SIRT1(ng/ml) | −0.760 | <0.001 * | 0.023 | 0.798 |
| SOD (U/L) | −0.863 | <0.001 * | −0.047 | 0.583 |
| Catalase (U/L) | −0.887 | <0.001 * | −0.106 | 0.216 |
| MDA (Nmol/mL) | 0.660 | <0.001 * | 0.014 | 0.869 |
| FOXO1 (ng/mL) | 0.876 | <0.001 * | 0.282 | 0.001 * |
| FOXO1 relative gene expression | 0.835 | <0.001 * | 0.097 | 0.256 |
| Variables | Unstandardized Estimate Parameter | β | Standardized Estimate Parameters | 95.0% C.I. for Odd | |||
|---|---|---|---|---|---|---|---|
| B | S.E. | t | p-Value | Lower | Upper | ||
| BMI | −0.004 | 0.006 | −0.036 | −0.585 | 0.560 | −0.015 | 0.008 |
| HSP72 | −0.001 | 0.000 | −0.179 | −30.711 | 0.000 | −0.001 | 0.000 |
| SIRT1 | 0.022 | 0.021 | 0.085 | 10.069 | 0.287 | −0.019 | 0.063 |
| SOD | −0.007 | 0.019 | −0.049 | −0.356 | 0.722 | −0.044 | 0.031 |
| Catalase | −0.007 | 0.004 | −0.260 | −10.520 | 0.131 | −0.015 | 0.002 |
| LDH1 | −0.001 | 0.000 | −0.071 | −10.965 | 0.051 | −0.001 | 0.000 |
| ANP | 00.000 | 0.001 | −0.003 | −0.035 | 0.972 | −0.001 | 0.001 |
| HEPCIDINE | 0.001 | 0.001 | 0.124 | 10.179 | 0.240 | −0.001 | 0.003 |
| FOXO1 | −0.002 | 0.001 | −0.180 | −20.131 | 0.035 | −0.003 | 0.000 |
| FOXO1 gene expression | 0.038 | 0.010 | 0.625 | 30.956 | 0.000 | 0.019 | 0.057 |
| Constant | 0.389 | 0.278 | 10.402 | 0.163 | −0.160 | 0.939 | |
Publisher’s Note: MDPI stays neutral with regard to jurisdictional claims in published maps and institutional affiliations. |
© 2022 by the authors. Licensee MDPI, Basel, Switzerland. This article is an open access article distributed under the terms and conditions of the Creative Commons Attribution (CC BY) license (https://creativecommons.org/licenses/by/4.0/).
Share and Cite
Ibrahim, H.A.; Zakaria, S.S.; El-Batch, M.M.; El-Shanshory, M.R.; Alrayes, Z.R.; Kabel, A.M.; Eldardiry, S.A. The Value of SIRT1/FOXO1 Signaling Pathway in Early Detection of Cardiovascular Risk in Children with β-Thalassemia Major. Biomedicines 2022, 10, 2601. https://doi.org/10.3390/biomedicines10102601
Ibrahim HA, Zakaria SS, El-Batch MM, El-Shanshory MR, Alrayes ZR, Kabel AM, Eldardiry SA. The Value of SIRT1/FOXO1 Signaling Pathway in Early Detection of Cardiovascular Risk in Children with β-Thalassemia Major. Biomedicines. 2022; 10(10):2601. https://doi.org/10.3390/biomedicines10102601
Chicago/Turabian StyleIbrahim, Hoda A., Soha S. Zakaria, Manal M. El-Batch, Mohamed R. El-Shanshory, Zahrah R. Alrayes, Ahmed M. Kabel, and Samia A. Eldardiry. 2022. "The Value of SIRT1/FOXO1 Signaling Pathway in Early Detection of Cardiovascular Risk in Children with β-Thalassemia Major" Biomedicines 10, no. 10: 2601. https://doi.org/10.3390/biomedicines10102601
APA StyleIbrahim, H. A., Zakaria, S. S., El-Batch, M. M., El-Shanshory, M. R., Alrayes, Z. R., Kabel, A. M., & Eldardiry, S. A. (2022). The Value of SIRT1/FOXO1 Signaling Pathway in Early Detection of Cardiovascular Risk in Children with β-Thalassemia Major. Biomedicines, 10(10), 2601. https://doi.org/10.3390/biomedicines10102601