
Metabolic Status of Lean and Obese Zucker Rats Based on Untargeted and Targeted Metabolomics Analysis of Serum


Abstract
:1. Introduction
2. Materials and Methods
2.1. Experimental Design
2.2. Sample Preparation for Measurement of Serum Metabolites
2.3. HPLC and LC-MS Methods
2.3.1. HPLC with Coulometric Electrochemical Detection (ECD)
2.3.2. HPLC with UV Detection
2.3.3. LC-MS Detection
2.4. Statistical Analysis
3. Results
3.1. Body Weight
3.2. Untargeted Metabolomics Data
3.3. Targeted Metabolomics Data
4. Discussion
Author Contributions
Funding
Institutional Review Board Statement
Acknowledgments
Conflicts of Interest
References
- Available online: https://www.who.int/news-room/fact-sheets/detail/obesity-and-overweight (accessed on 5 October 2021).
- Overweight & Obesity. Center for Disease Control and Prevention Website. Updated 18 June 2019. Available online: http://www.cdc.gov/obesity/index.html (accessed on 19 June 2019).
- Available online: https://www.cdc.gov/obesity/data/adult.html (accessed on 5 October 2021).
- Tremmel, M.; Gerdtham, U.G.; Nilsson, P.M.; Saha, S. Economic Burden of Obesity: A Systematic Literature Review. Int. J. Environ. Res. Public Health 2017, 14, 435. [Google Scholar]
- Apovian, C.M. Obesity: Definition, comorbidities, causes, and burden. Am. J. Manag. Care 2016, 22 (Suppl. 7), s176–s185. [Google Scholar] [PubMed]
- Finkelstein, E.A.; Trogdon, J.G.; Cohen, J.W.; Dietz, W. Annual medical spending attributable to obesity: Payer-and service-specific estimates. Health Aff. (Millwood) 2009, 28, w822–w831. [Google Scholar] [PubMed] [Green Version]
- Trogdon, J.G.; Finkelstein, E.A.; Hylands, T.; Dellea, P.S.; Kamal-Bahl, J. Indirect costs of obesity: A review of the current literature. Obes. Rev. 2008, 9, 489–500. [Google Scholar] [PubMed]
- Frood, S.; Johnston, L.M.; Matteson, C.L.; Finegood, D.T. Obesity, Complexity, and the Role of the Health System. Curr. Obes. Rep. 2013, 2, 320–326. [Google Scholar] [PubMed] [Green Version]
- Mayoral, L.P.; Andrade, G.M.; Mayoral, E.P.; Huerta, T.H.; Canseco, S.P.; Rodal Canales, F.J.; Cabrera-Fuentes, H.A.; Cruz, M.M.; Pérez Santiago, A.D.; Alpuche, J.J.; et al. Obesity subtypes, related biomarkers & heterogeneity. Indian J. Med. Res. 2020, 151, 11–21. [Google Scholar]
- Arimatsu, M.; Kitano, T.; Kitano, N.; Inomoto, T.; Shono, M.; Futatsuka, M. Correlation between forearm bone mineral density and body composition in Japanese females aged 18–40 years. Environ. Health Prev. Med. 2005, 10, 144–149. [Google Scholar]
- Yazdi, F.T.; Clee, S.M.; Meyre, D. Obesity genetics in mouse and human: Back and forth, and back again. PeerJ 2015, 3, e856. [Google Scholar]
- Rupérez, F.J.; Martos-Moreno, G.Á.; Chamoso-Sánchez, D.; Barbas, C. Insulin Resistance in Obese Children: What Can Metabolomics and Adipokine Modelling Contribute? Argente Nutr. 2020, 12, 3310. [Google Scholar]
- Xie, B.; Waters, M.J.; Schirra, H.J. Investigating Potential Mechanisms of Obesity by Metabolomics. J. Biomed. Biotechnol. 2012, 2012, 805683. [Google Scholar]
- González-Riano, C.; Dudzik, D.; Garcia, A.; Gil-De-La-Fuente, A.; Gradillas, A.; Godzien, J.; López-Gonzálvez, Á.; Rey-Stolle, F.; Rojo, D. Recent Developments along the Analytical Process for Metabolomics Workflows. Anal. Chem. 2019, 92, 203–226. [Google Scholar]
- Melnyk, S.; Korourian, S.; Levy, J.W.; Pavliv, O.; Evans, T.; Hakkak, R. Effects of Obesity on Pro-Oxidative Conditions and DNA Damage in Liver of DMBA-Induced Mammary Carcinogenesis Models. Metabolites 2017, 7, 26. [Google Scholar]
- Zucker, T.F.; Zucker, L.M. Fat accretion and growth in the rat. J. Nutr. 1963, 80, 6–19. [Google Scholar]
- Zucker, L.M.; Zucker, T.F. Fatty, a new mutation in the rat. J. Hered. 1961, 52, 275–278. [Google Scholar]
- Chua, S.C.; Chung, W.K.; Wu-Peng, X.S.; Zhang, Y.; Liu, S.M.; Tartaglia, L.; Leibel, R.L. Phenotypes of mouse ‘diabetes’ and rat ‘fatty’ due to mutations in the OB (leptin) receptor. Science 1996, 271, 994–996. [Google Scholar]
- Tartaglia, L.A.; Dembski, M.; Weng, X.; Deng, N.; Culpepper, J.; Devos, R.; Richards, G.J.; Campfield, L.A.; Clark, F.T.; Deeds, J.; et al. Identification and expression cloning of a leptin receptor, OB-R. Cell 1995, 83, 1263–1271. [Google Scholar] [PubMed] [Green Version]
- Zucker, L.M.; Antoniades, H.N. Insulin and obesity in the Zucker genetically obese rat “fatty”. Endocrinology 1971, 90, 1320–1330. [Google Scholar]
- Krief, S.; Bazin, R. Genetic obesity: Is the defect in the sympathetic nervous system? A review through developmental studies in the preobese Zucker rat. Proc. Soc. Exp. Biol. Med. 1991, 198, 528–538. [Google Scholar]
- Aleixandre de Artinano, A.; Miguel Castro, M. Experimental rat models to study the metabolic syndrome. Br. J. Nutr. 2009, 102, 1246–1253. [Google Scholar]
- Argilés, J.M. The obese Zucker rat: A choice for fat metabolism 1968-1988: Twenty years of research on the insights of the Zucker mutation. Prog. Lipid Res. 1989, 28, 53–66. [Google Scholar]
- Hakkak, R.; Gauss, C.H.; Bell, A.; Korourian, S. Short-Term Soy Protein Isolate Feeding Prevents Liver Steatosis and Reduces Serum ALT and AST Levels in Obese Female. Zucker Rats. Biomedicines 2018, 6, 55. [Google Scholar] [CrossRef] [Green Version]
- Hakkak, R.; Zeng, H.; Ishwori, D.; Korourian, S. Short and long-term soy diet vs. casein protects liver steatosis independent of the arginine content. J. Med. Food 2015, 18, 1274–1280. [Google Scholar] [CrossRef]
- Hakkak, R.; MacLeod, S.; Shaaf, S.; Holley, A.W.; Simpson, P.; Fuchs, G.; Jo, C.H.; Kieber-Emmons, T.; Korourian, S. Obesity Increases the Incidence of 7,12-dimethylbenz(a)anthracene-Induced Mammary Tumors in Ovariectomized Zucker Rat. Int. J. Oncol. 2007, 30, 557–563. [Google Scholar]
- Hakkak, R.; Holley, A.W.; MacLeod, S.; Simpson, P.; Fuchs, G.; Jo, C.H.; Kieber-Emmons, T.; Korourian, S. Obesity Promotes 7,12-dimethylbenz(a)anthracene-Induced Mammary Tumor Development in Female Zucker Rats. Breast Cancer Res. 2005, 7, R627–R633. [Google Scholar] [PubMed] [Green Version]
- Melnyk, S.; Pogribna, M.; Pogribny, I.; Hine, R.J.; James, S.J. A new HPLC method for the simultaneous determination of oxidized and reduced plasma aminothiols using coulometric electrochemical detection. J. Nutr. Biochem. 1999, 10, 490–497. [Google Scholar]
- Melnyk, S.; Pogribna, M.; Pogribny, I.P.; Yi, P.; James, S.J. Measurement of plasma and intracellular S-adenosylmethionine and S-adenosylhomocysteine utilizing coulometric electrochemical detection: Alterations with plasma homocysteine and pyridoxal 5’-phosphate concentrations. Clin. Chem. 2000, 46, 265–272. [Google Scholar] [PubMed]
- Hollowood-Jones, K.; Adams, J.B.; Coleman, D.M.; Ramamoorthy, S.; Melnyk, S.; James, S.J.; Woodruff, B.K.; Pollard, E.L.; Snozek, C.L.; Kruger, U.; et al. Altered metabolism of mothers of young children with Autism Spectrum Disorder: A case control study. BMC Pediatr. 2020, 20, 557. [Google Scholar]
- DeHaven, C.D.; Evans, A.M.; Dai, H.; Lawton, K.A. Organization of GC/MS and LC/MS metabolomics data into chemical libraries. Aust. J. Chem. 2010, 2, 9. [Google Scholar]
- Suleiman, J.B.; Mohamed, M.; Bakar, A. A systematic review on different models of inducing obesity in animals: Advantages and limitations. J. Adv. Vet. Anim. Res. 2019, 7, 103–114. [Google Scholar]
- Drotningsvik, A.; Midttun, Ø.; Vikøren, L.A.; McCann, A.; Ueland, P.M.; Mellgren, G.; Gudbrandsen, O.A. Urine and plasma concentrations of amino acids and plasma vitamin status differ, and are differently affected by salmon intake, in obese Zucker fa/fa rats with impaired kidney function and in Long-Evans rats with healthy kidneys. Br. J. Nutr. 2019, 122, 262–273. [Google Scholar]
- Oxenkrug, G.; Cornicelli, J.; van der Hart, M.; Roeser, J.; Summergrad, P. Kynurenic acid, an aryl hydrocarbon receptor ligand, is elevated in serum of Zucker fatty rats. Integr. Mol. Med. 2016, 3, 761–763. [Google Scholar]
- Gertsman, I.; Barshop, B.A. Promises and Pitfalls of Untargeted Metabolomics. J. Inherit. Metab. Dis. 2018, 41, 355–366. [Google Scholar]
- Kwak, H.C.; Kim, Y.; Oh, S.J.; Kim, S.K. Sulfur amino acid metabolism in Zucker diabetic fatty rats. Biochem. Pharmacol. 2015, 96, 256–266. [Google Scholar] [PubMed]
- Reinehr, T.; Wolters, B.; Knop, C.; Lass, N.; Hellmuth, C.; Harder, U.; Peissner, W.; Wahl, S.; Grallert, H.; Adamski, J.; et al. Changes in the serum metabolite profile in obese children with weight loss. Eur. J. Nutr. 2015, 54, 173–181. [Google Scholar] [PubMed]
- Finkelstein, J.D. Methionine metabolism in mammals. J. Nutr. Biochem. 1990, 1, 228–237. [Google Scholar] [PubMed]
- Barbosa, P.; Melnyk, S.; Bennuri, S.C.; Delhey, L.; Reis, A.; Moura, G.R.; Børsheim, E.; Rose, S.; Carvalho, E.; Barbosa, P. Redox Imbalance and Methylation Disturbances in Early Childhood Obesity. Oxidative Med. Cell. Longev. 2021, 2021, 2207125. [Google Scholar]
- Jones, D.P.; Go, Y.-M.; Anderson, C.L.; Ziegler, T.R.; Kinkade, J.M., Jr.; Kirlin, W.G. Cysteine/cystine couple is a newly recognized node in the circuitry for biologic redox signaling and control. FASEB J. 2004, 18, 1246–1248. [Google Scholar]
- Libert, D.M.; Nowacki, A.S.; Natowicz, M.R. Metabolomic analysis of obesity, metabolic syndrome, and type 2 diabetes: Amino acid and acylcarnitine levels change along a spectrum of metabolic wellness. PeerJ 2018, 6, e5410. [Google Scholar]
- Shipelin, V.A.; Trusov, N.V.; Apryatin, S.A.; Shumakova, A.A.; Balakina, A.S.; Riger, N.A.; Gmoshinski, I.V.; Nikityuk, D.B. Effects of Tyrosine and Tryptophan in Rats with Diet-Induced Obesity. Int. J. Mol. Sci. 2021, 22, 2429. [Google Scholar]
- Breum, L.; Rasmussen, M.H.; Hilsted, J.; Fernstrom, J.D. Twenty-four–hour plasma tryptophan concentrations and ratios are below normal in obese subjects and are not normalized by substantial weight reduction. Am. J. Clin. Nutr. 2003, 77, 1112–1118. [Google Scholar]
- Comlan, T.; Medehouenou, M.; Roy, C.; Tremblay, P.; Jean, A.S.; Meziou, S.; Muckle, G.; Ayotte, P.; Lucas, M. Metabolic features of adiposity and glucose homoeostasis among school-aged inuit children from Nunavik (Northern Quebec, Canada). Int. J. Circumpolar Health Actions 2021, 80, 1858605. [Google Scholar]
 Significantly (p > 0.05) higher average peak intensity in the group.
  Significantly (p > 0.05) lower average peak intensity in the group.
  No difference between groups.
  Marginal (0.1 < p > 0.05) difference between groups. (Panel B): Pairs of 50 peaks intensity ratio between L and O groups.
  Peak ratio at least 50% higher in the L group.
  Peak ratio at least 50% higher in the O group.
  No difference between groups.
Significantly (p > 0.05) higher average peak intensity in the group. Significantly (p > 0.05) lower average peak intensity in the group. No difference between groups. Marginal (0.1 < p > 0.05) difference between groups. (Panel B): Pairs of 50 peaks intensity ratio between L and O groups. Peak ratio at least 50% higher in the L group. Peak ratio at least 50% higher in the O group. No difference between groups.
No difference between groups.
Significantly (p > 0.05) higher average peak intensity in the group. Significantly (p > 0.05) lower average peak intensity in the group. No difference between groups. Marginal (0.1 < p > 0.05) difference between groups. (Panel B): Pairs of 50 peaks intensity ratio between L and O groups. Peak ratio at least 50% higher in the L group. Peak ratio at least 50% higher in the O group. No difference between groups.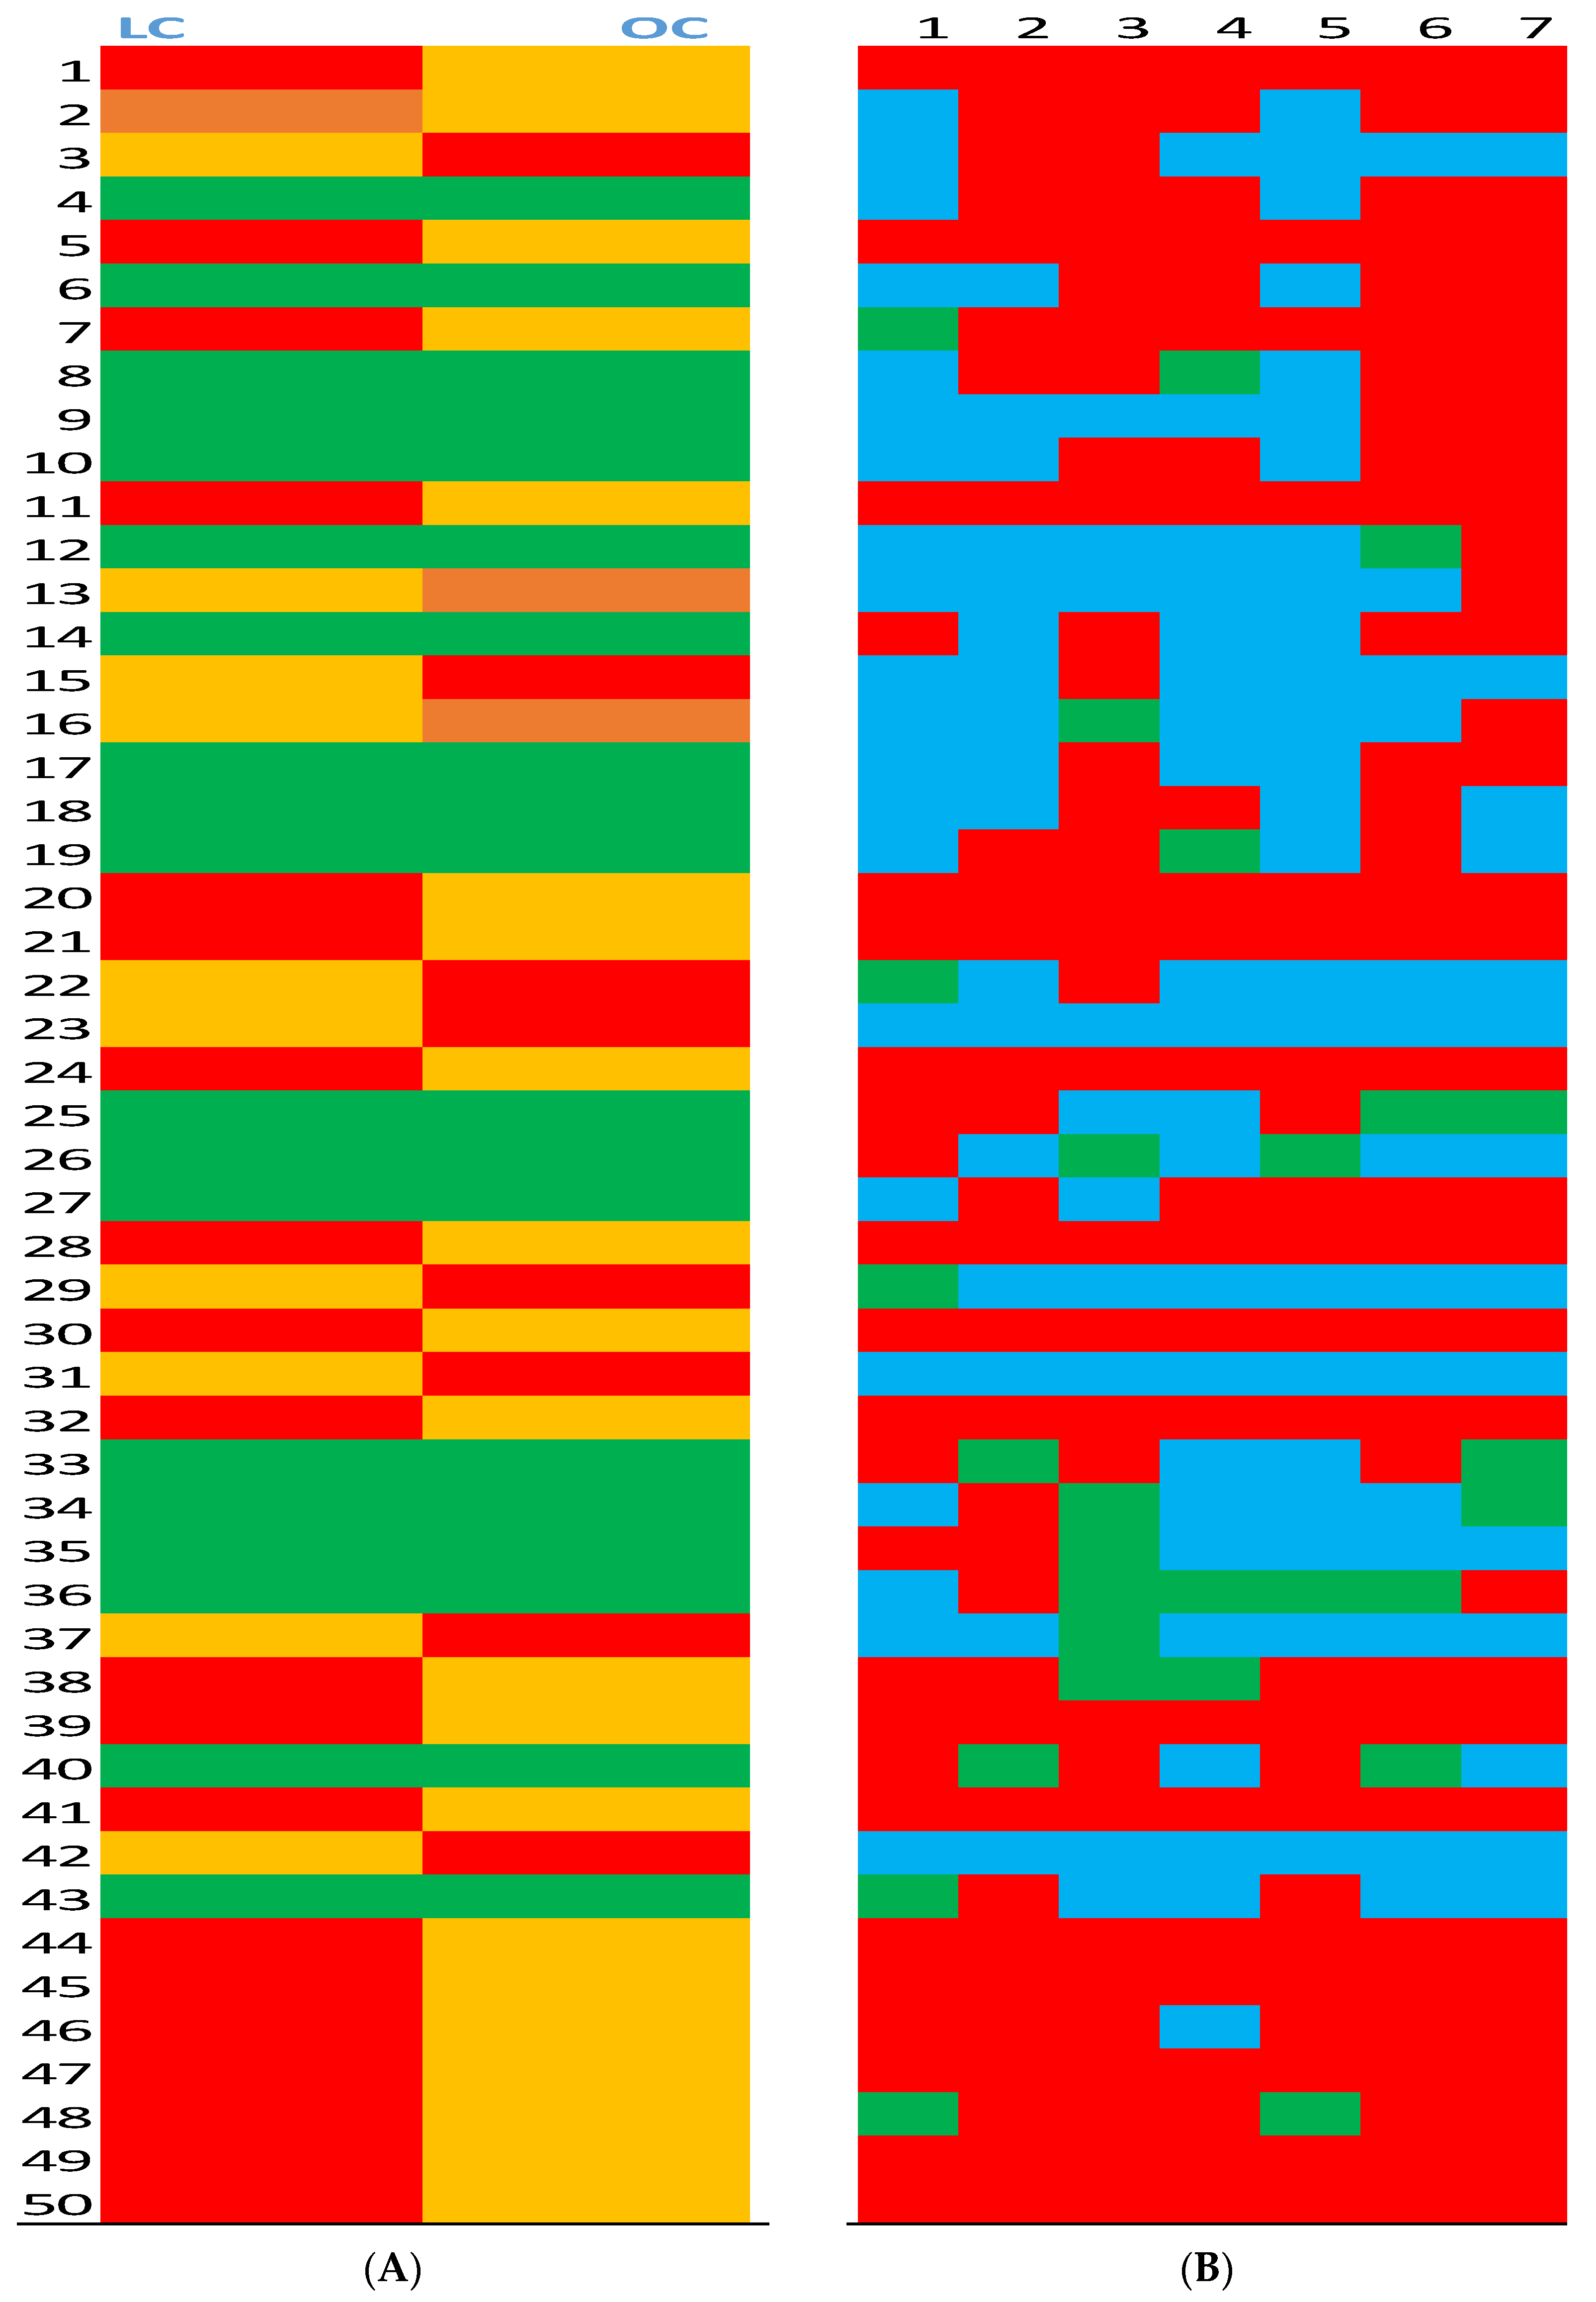

| L | O | p-Value | |
|---|---|---|---|
| Methionine, nmol/mL | 46.5 ± 4.36 | 36.4 ± 5.72 | 0.002 |
| Free Cysteine, nmol/mL | 19.4 ± 4.45 | 10.1 ± 1.34 | 0.0001 |
| Cystine, nmol/mL | 8.6 ± 1.05 | 14.7 ± 2.71 | 0.0001 |
| Free Cysteine/Cystine | 2.25 ± 0.434 | 0.71 ± 0.168 | 0.0001 |
| Tryptophan,nmol/mL | 63.1 ± 12.18 | 39.1 ± 9.14 | 0.001 |
| Kynurenic acid, nmol/mL | 2.26 ± 0.165 | 1.66 ± 0.332 | 0.001 |
| Tryptophan/Kynurenic acid | 27.8 ± 5.61 | 24.6 ± 8.02 | 0.2 |
| Tyrosine, nmol/mL | 45.8 ± 8.85 | 62.2 ± 10.83 | 0.005 |
Publisher’s Note: MDPI stays neutral with regard to jurisdictional claims in published maps and institutional affiliations. |
© 2022 by the authors. Licensee MDPI, Basel, Switzerland. This article is an open access article distributed under the terms and conditions of the Creative Commons Attribution (CC BY) license (https://creativecommons.org/licenses/by/4.0/).
Share and Cite
Melnyk, S.; Hakkak, R. Metabolic Status of Lean and Obese Zucker Rats Based on Untargeted and Targeted Metabolomics Analysis of Serum. Biomedicines 2022, 10, 153. https://doi.org/10.3390/biomedicines10010153
Melnyk S, Hakkak R. Metabolic Status of Lean and Obese Zucker Rats Based on Untargeted and Targeted Metabolomics Analysis of Serum. Biomedicines. 2022; 10(1):153. https://doi.org/10.3390/biomedicines10010153
Chicago/Turabian StyleMelnyk, Stepan, and Reza Hakkak. 2022. "Metabolic Status of Lean and Obese Zucker Rats Based on Untargeted and Targeted Metabolomics Analysis of Serum" Biomedicines 10, no. 1: 153. https://doi.org/10.3390/biomedicines10010153
APA StyleMelnyk, S., & Hakkak, R. (2022). Metabolic Status of Lean and Obese Zucker Rats Based on Untargeted and Targeted Metabolomics Analysis of Serum. Biomedicines, 10(1), 153. https://doi.org/10.3390/biomedicines10010153