
Extracorporeal Shock Wave Therapy Salvages Critical Limb Ischemia in B6 Mice through Upregulating Cell Proliferation Signaling and Angiogenesis

 , ,
, ,  and
and 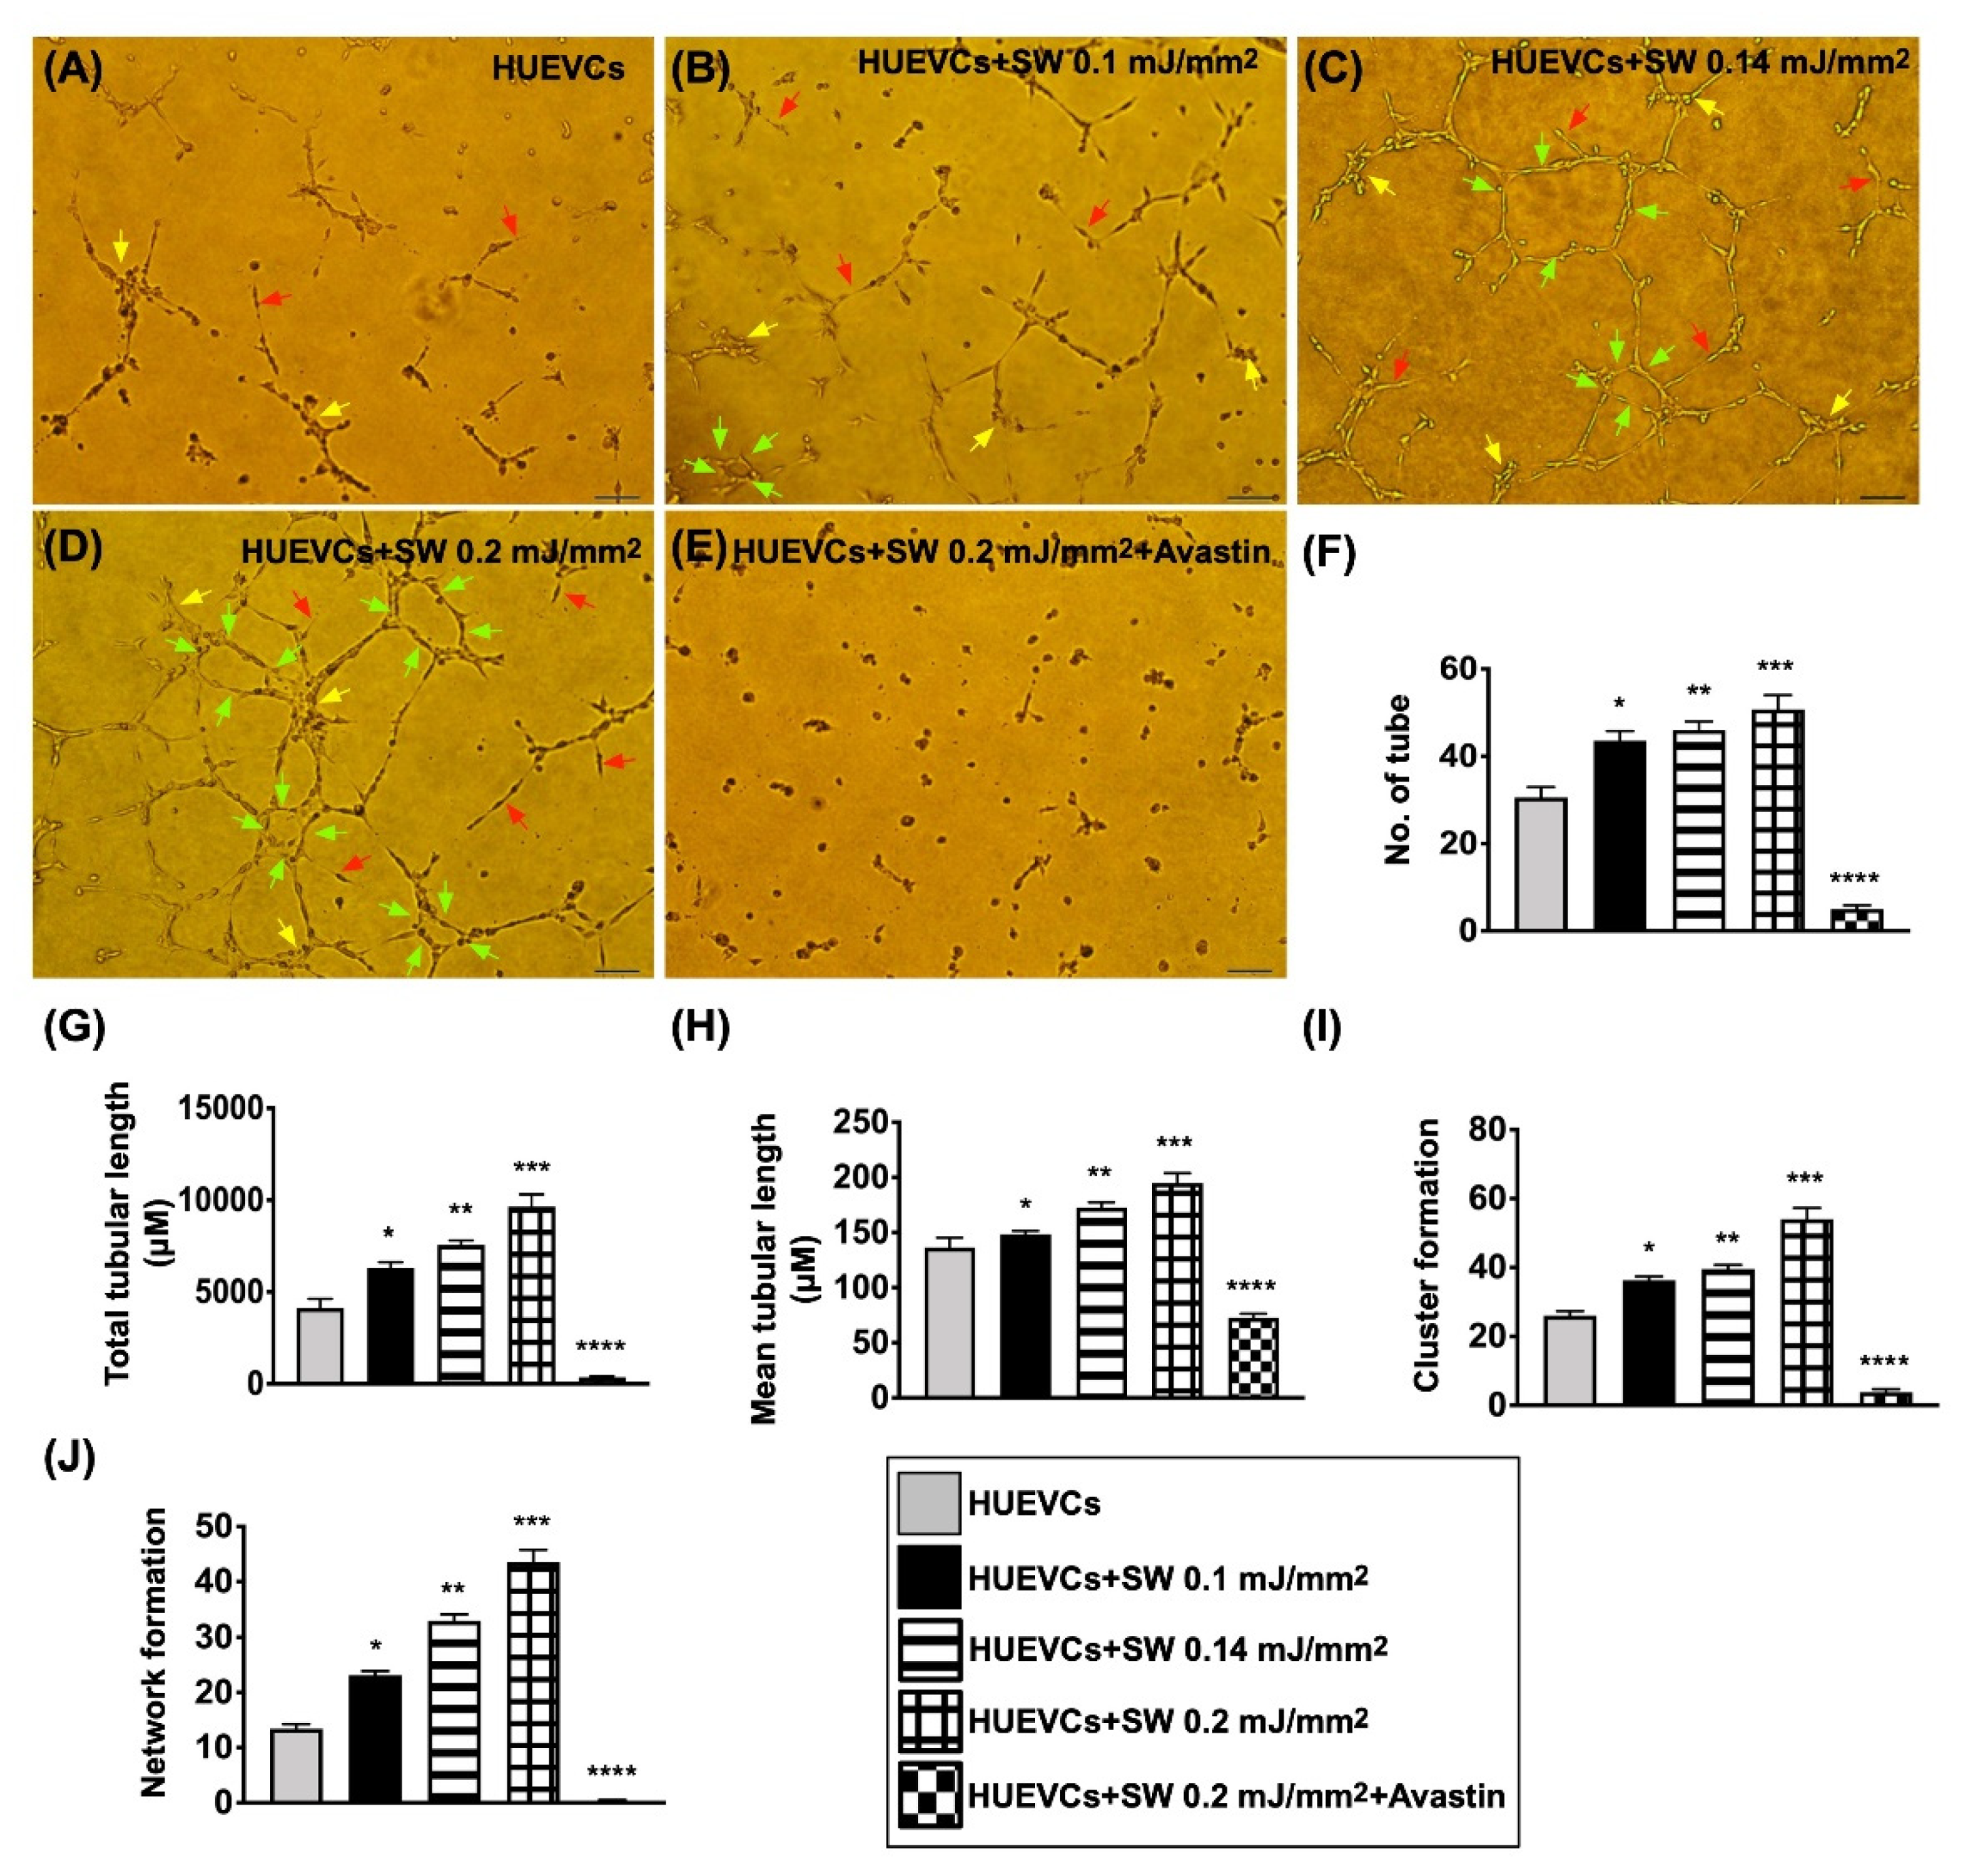
Abstract
1. Introduction
2. Materials and Methods
2.1. Ethics Statement
2.2. In Vitro Study for Assessment of ECSW Therapy on Upregulating the Protein Expression of (1) Cell-Proliferation/Growth/Survival and (2) Cell-Motility Signaling Pathways
2.3. Animal Model of CLI, Animal Grouping, and Treatment Strategy
2.4. Measurement of Blood Flow in CLI by Laser Doppler
2.5. Western Blot Analysis
2.6. Immunohistochemical (IHC) and Immunofluorescent (IF) Stains
2.7. Statistical Analysis
3. Results
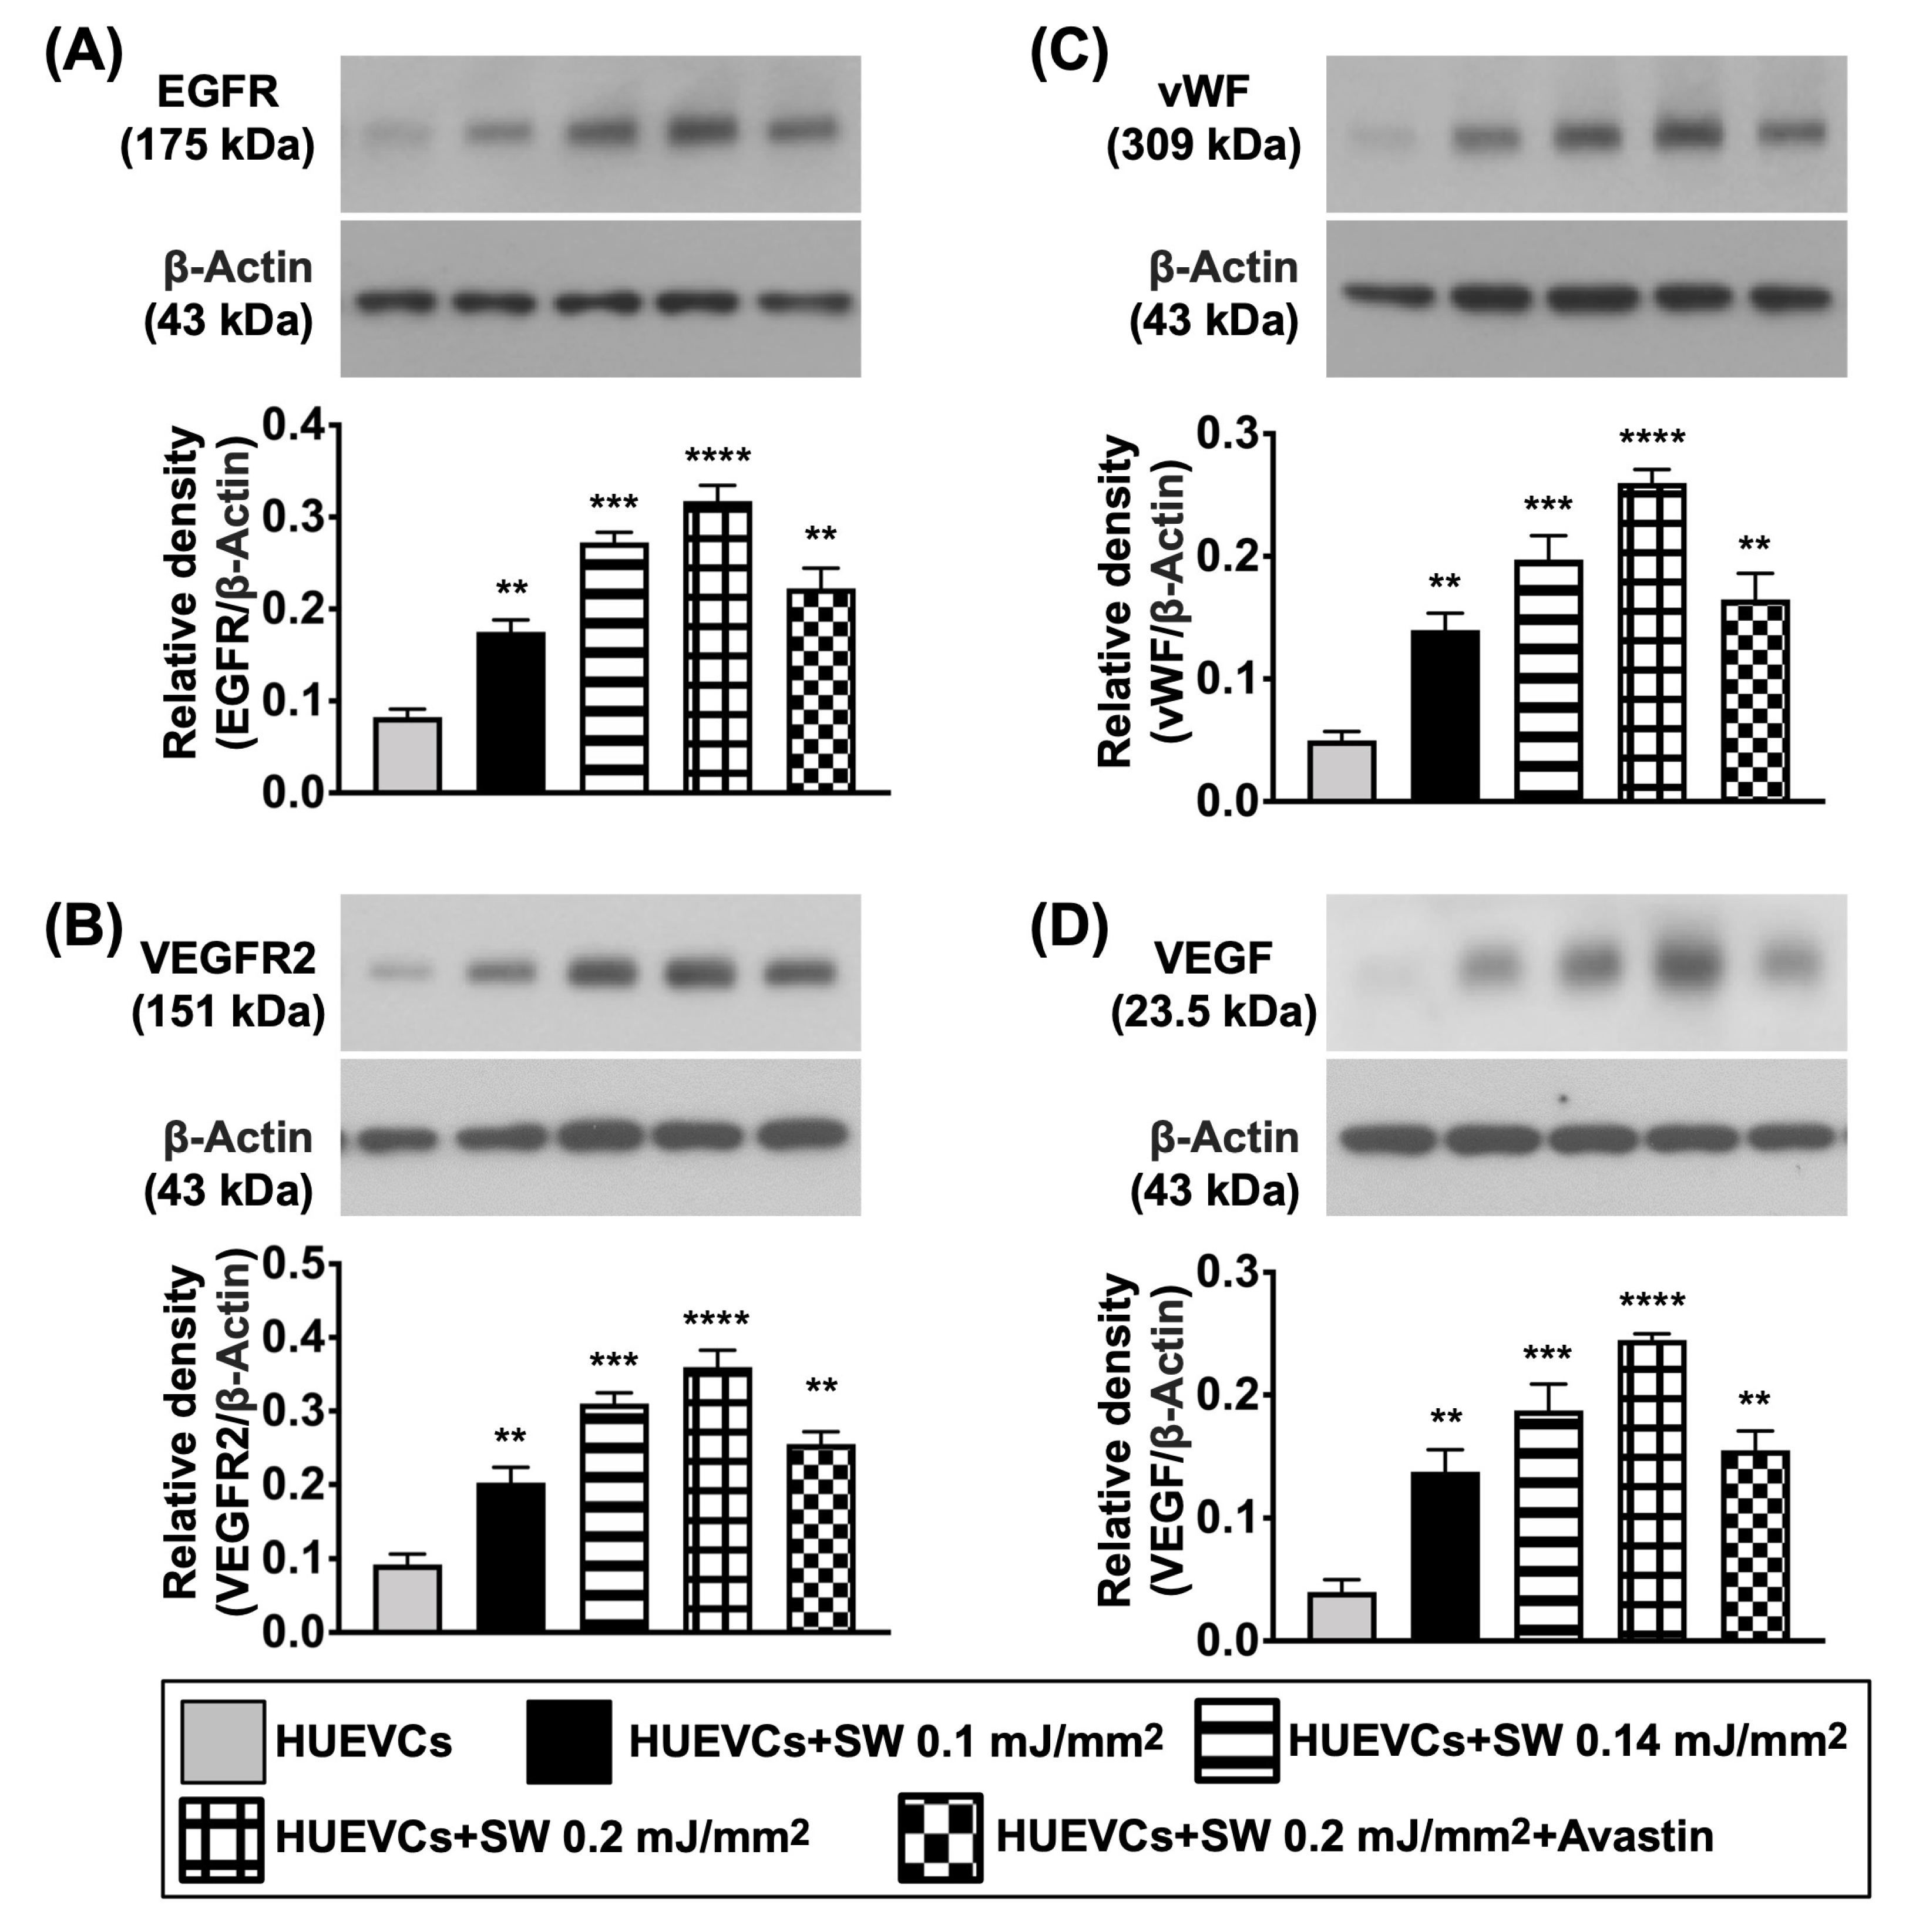
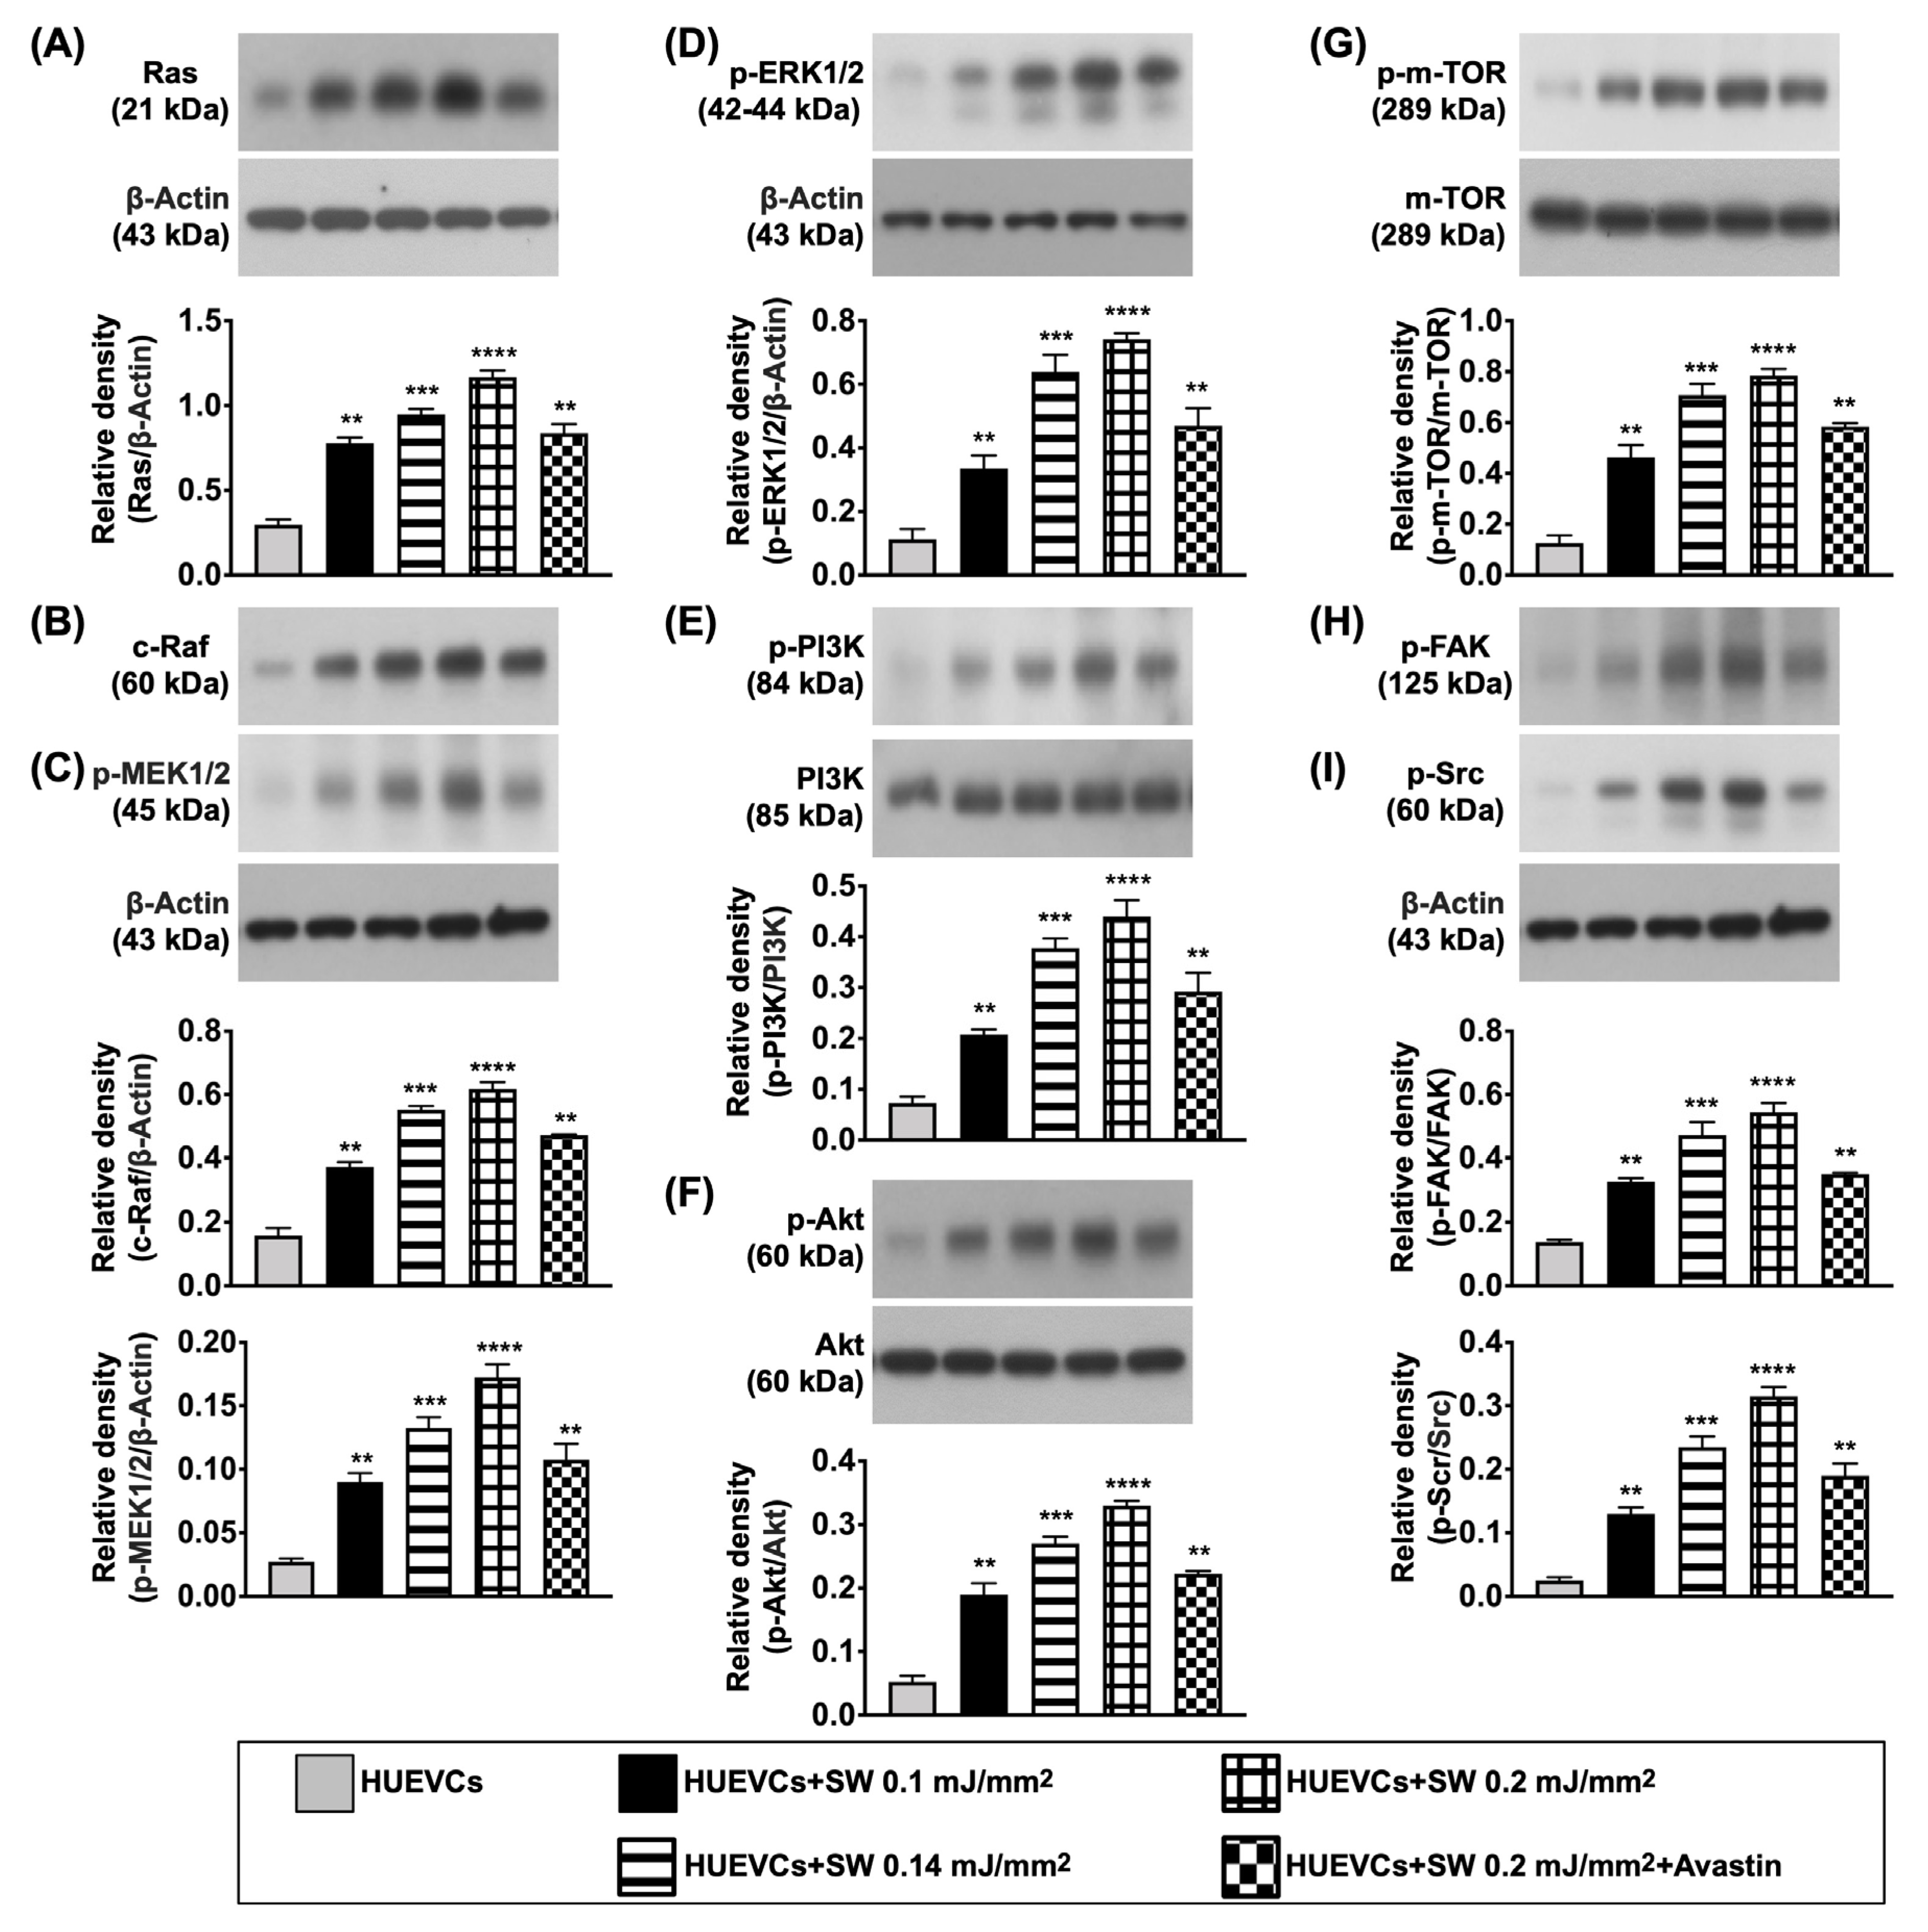
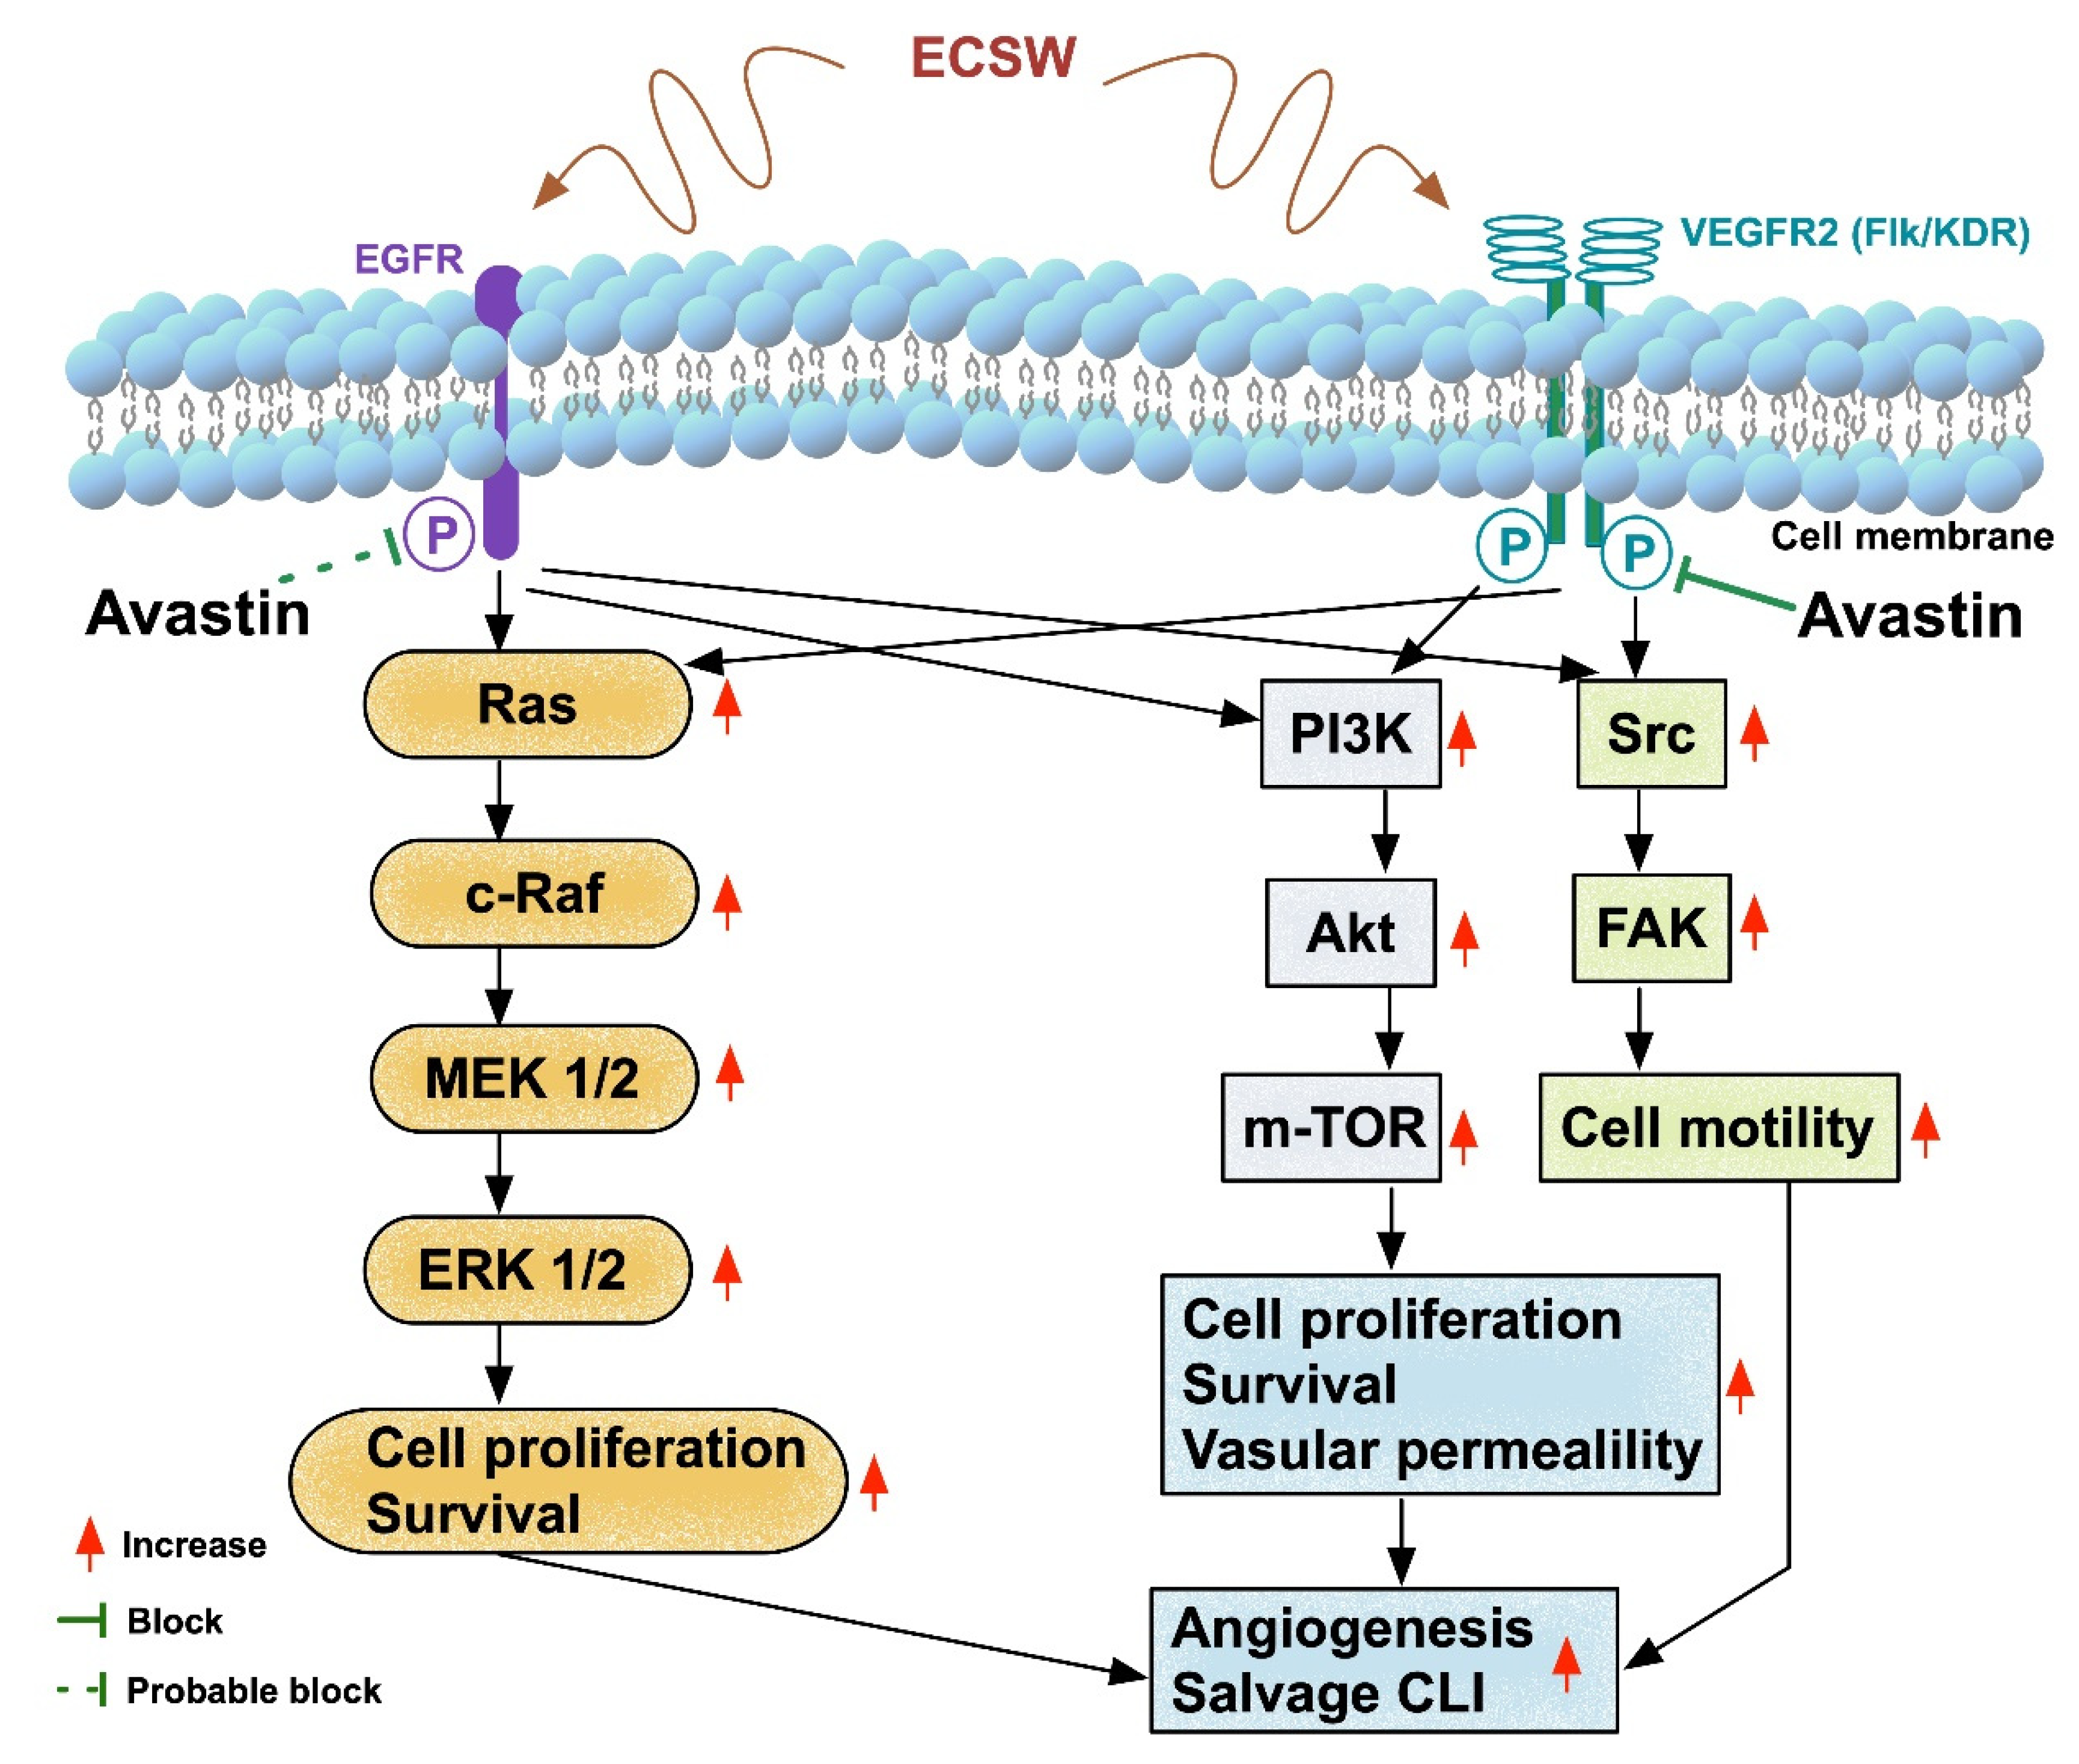
3.1. The Angiogenesis and Protein Expressions of EGFR/VEGFR2, and Cell Proliferation/Growth/Survival and Cell Motility Signaling Pathways
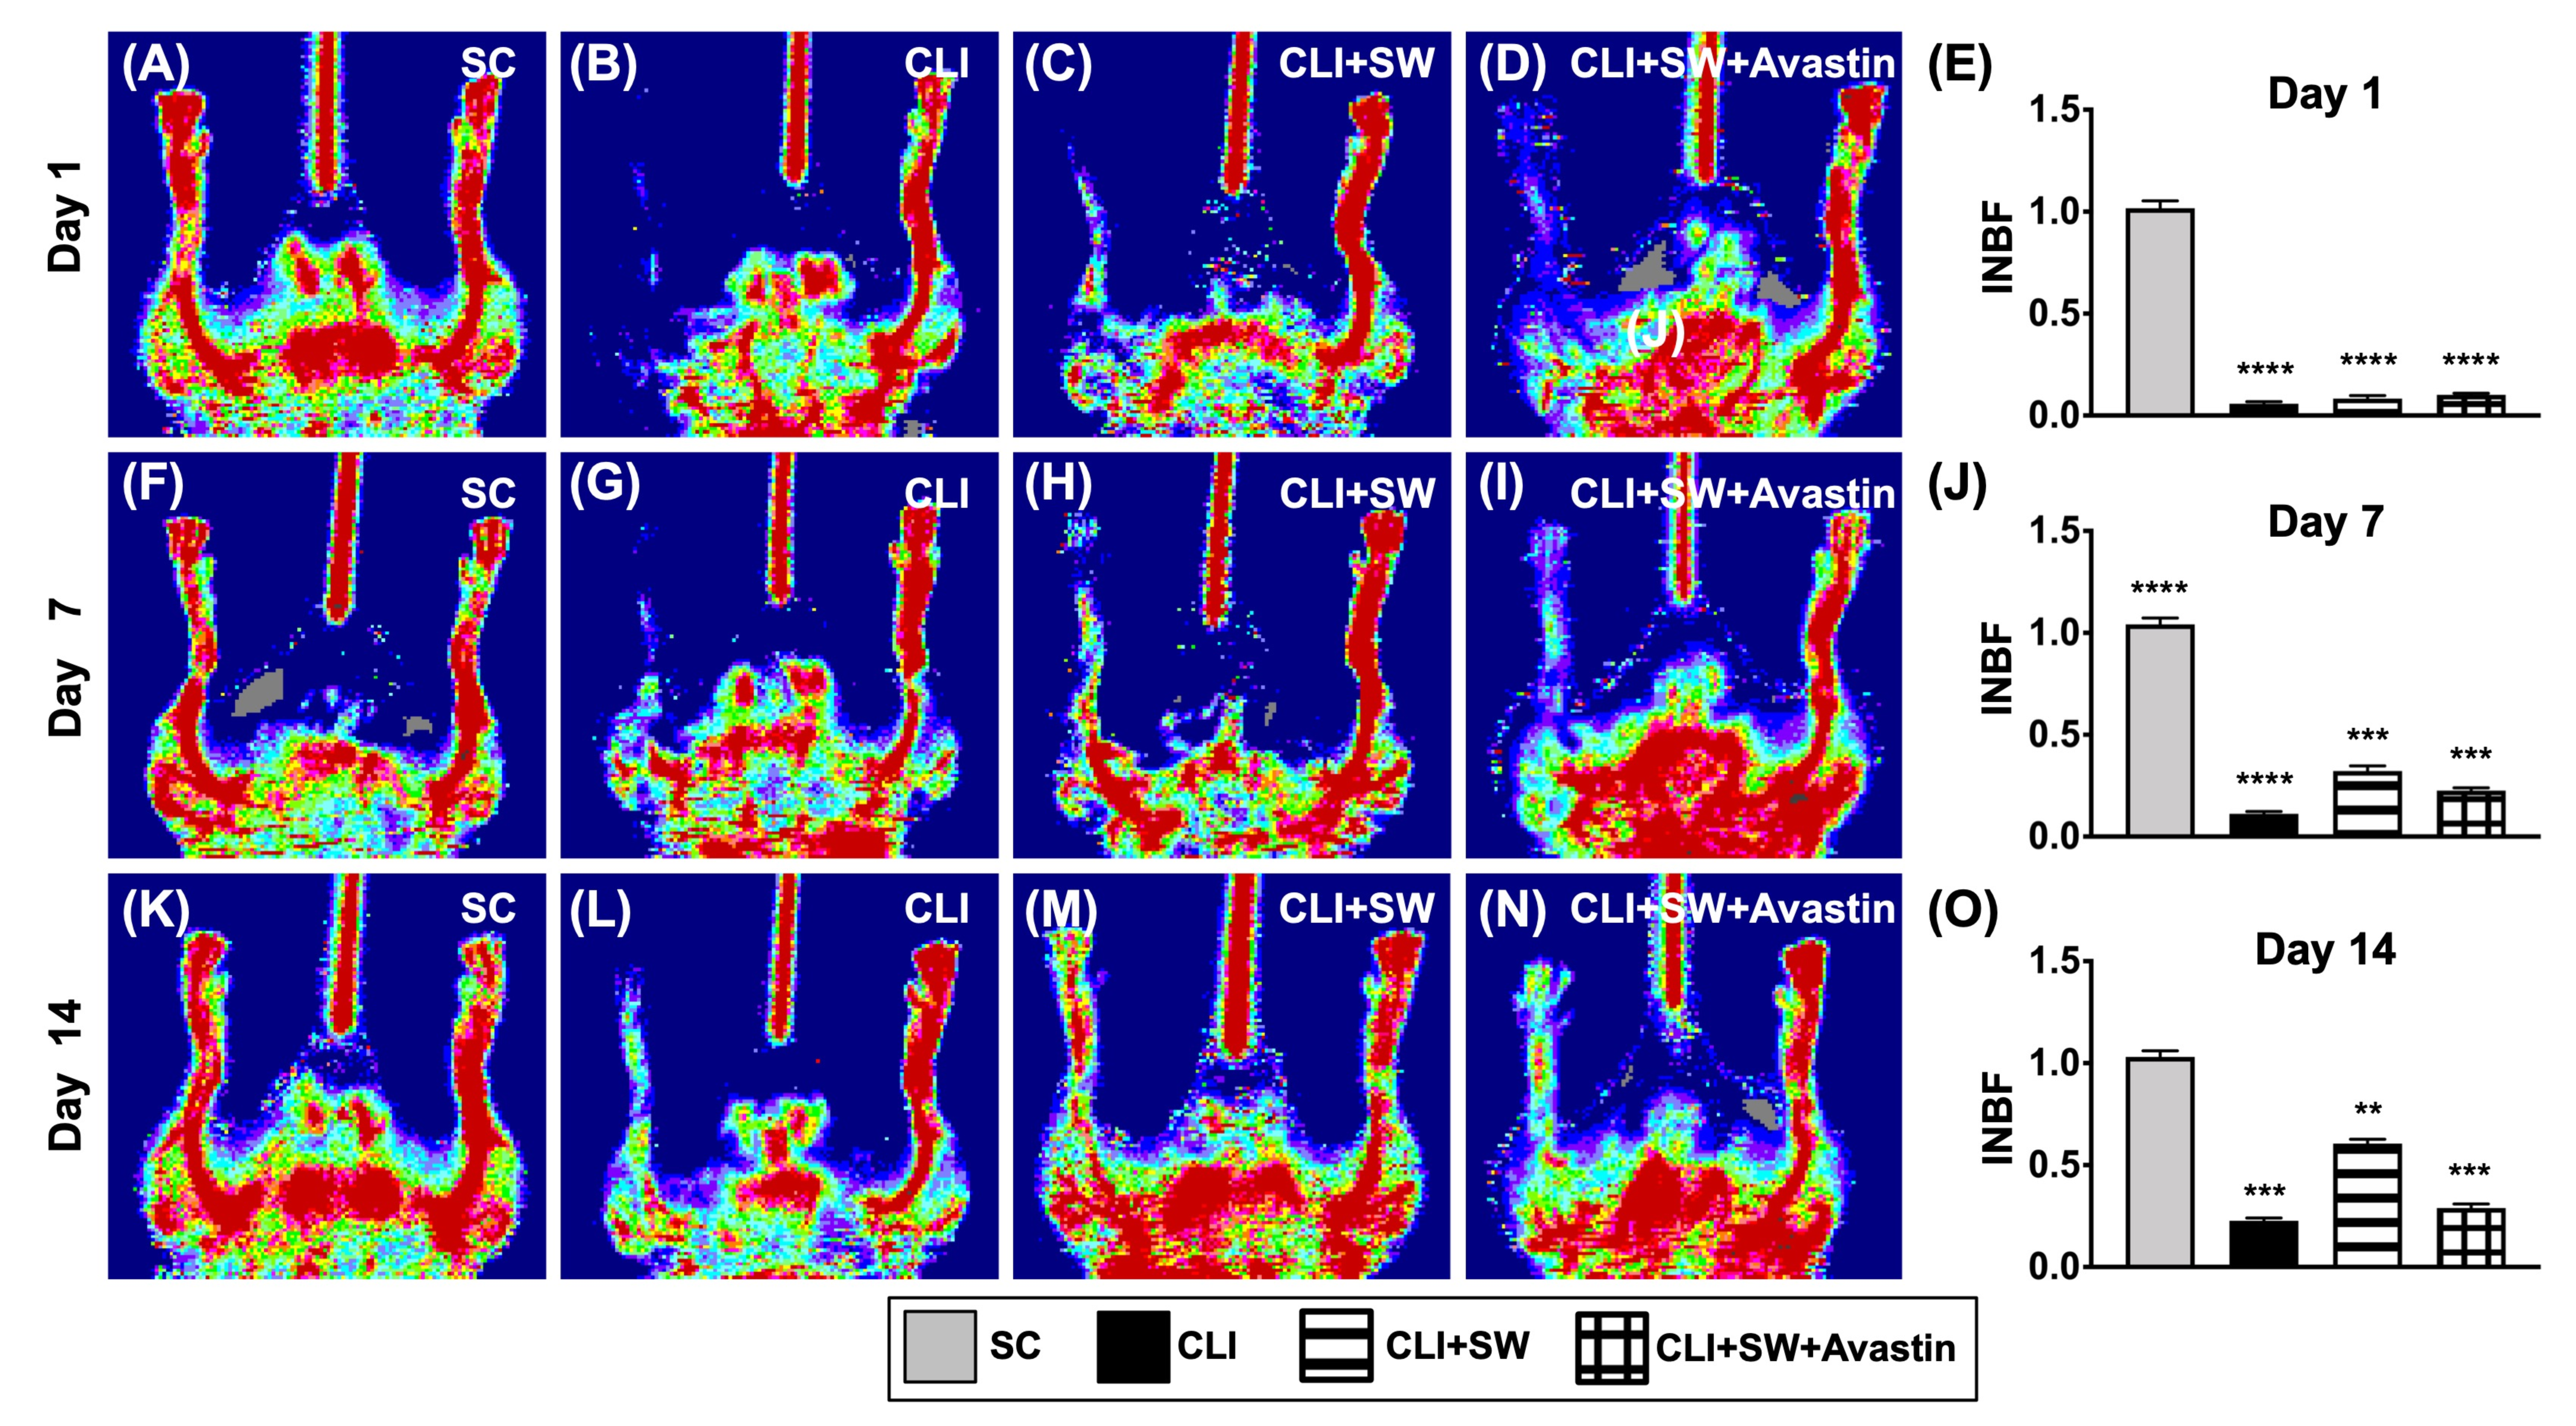
3.2. Ischemic to Normal Blood Flow (INBF) Ratio Measured by Laser Doppler Scan at Days 1, 7 and 14 after Left CLI Induction
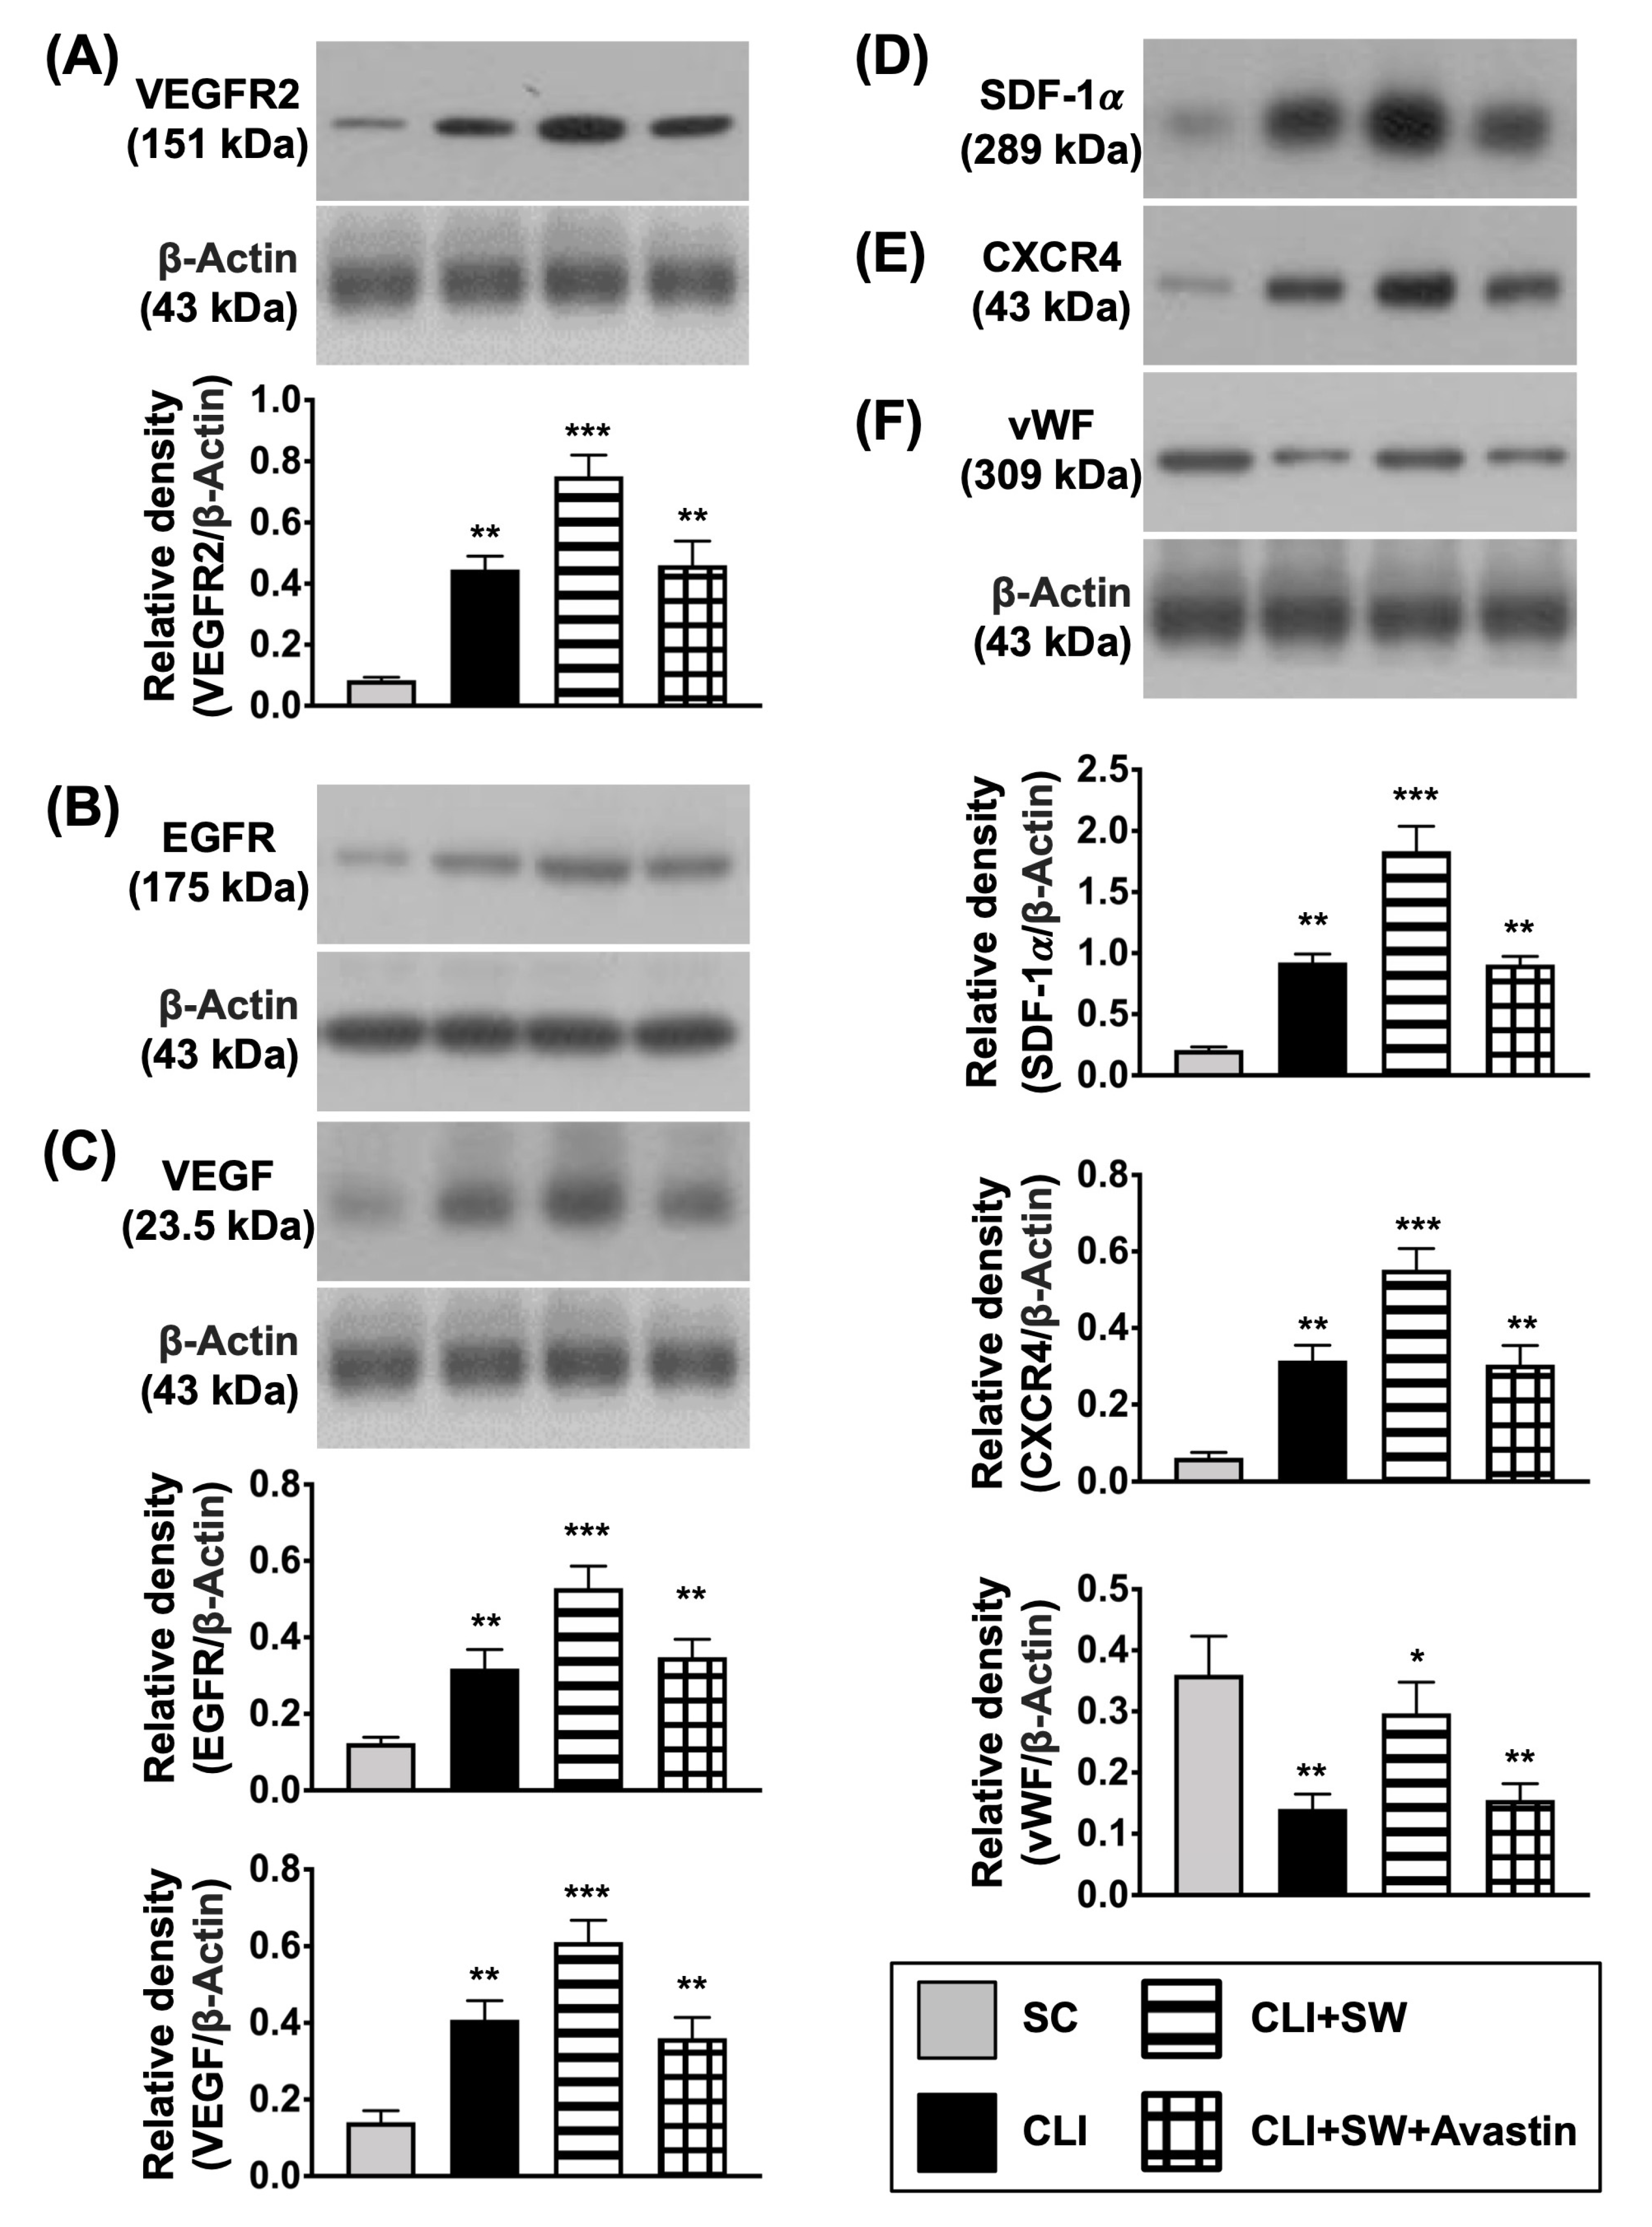
3.3. The Protein Expressions of Cell Growth/Angiogenesis Receptors and Angiogenic Factors in CLI Quadriceps Muscle by Day 14 after CLI Induction
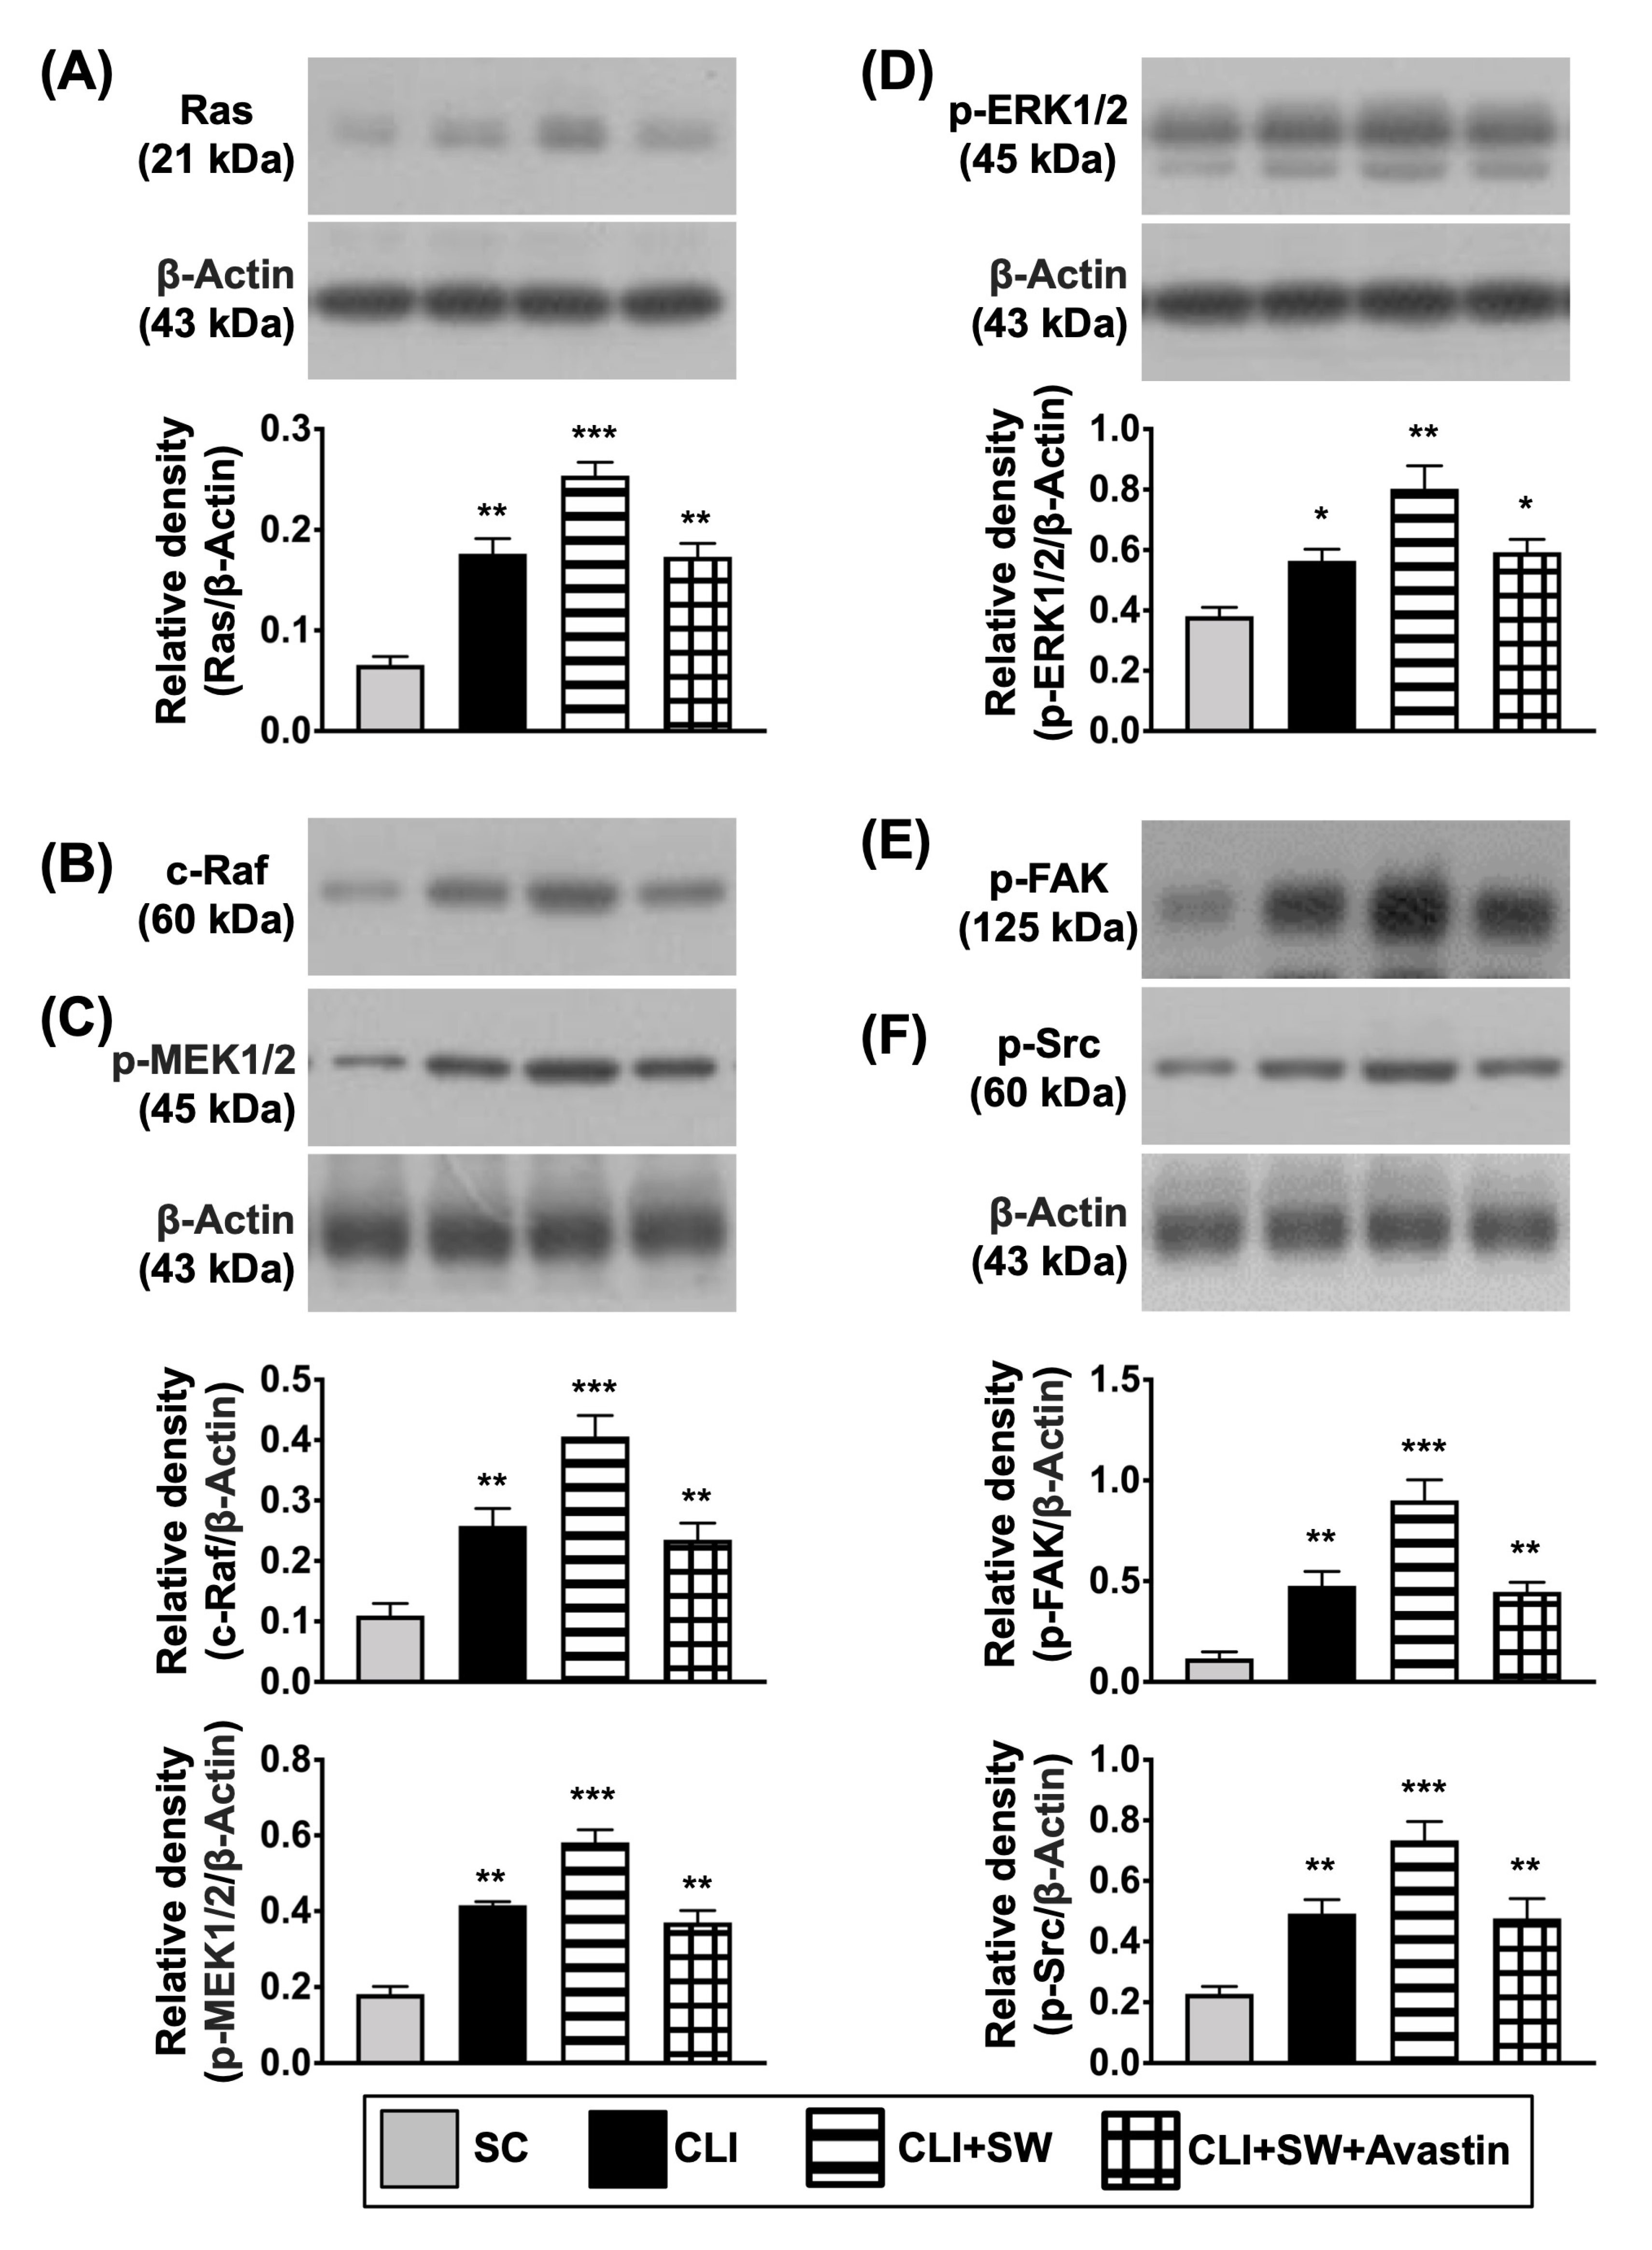
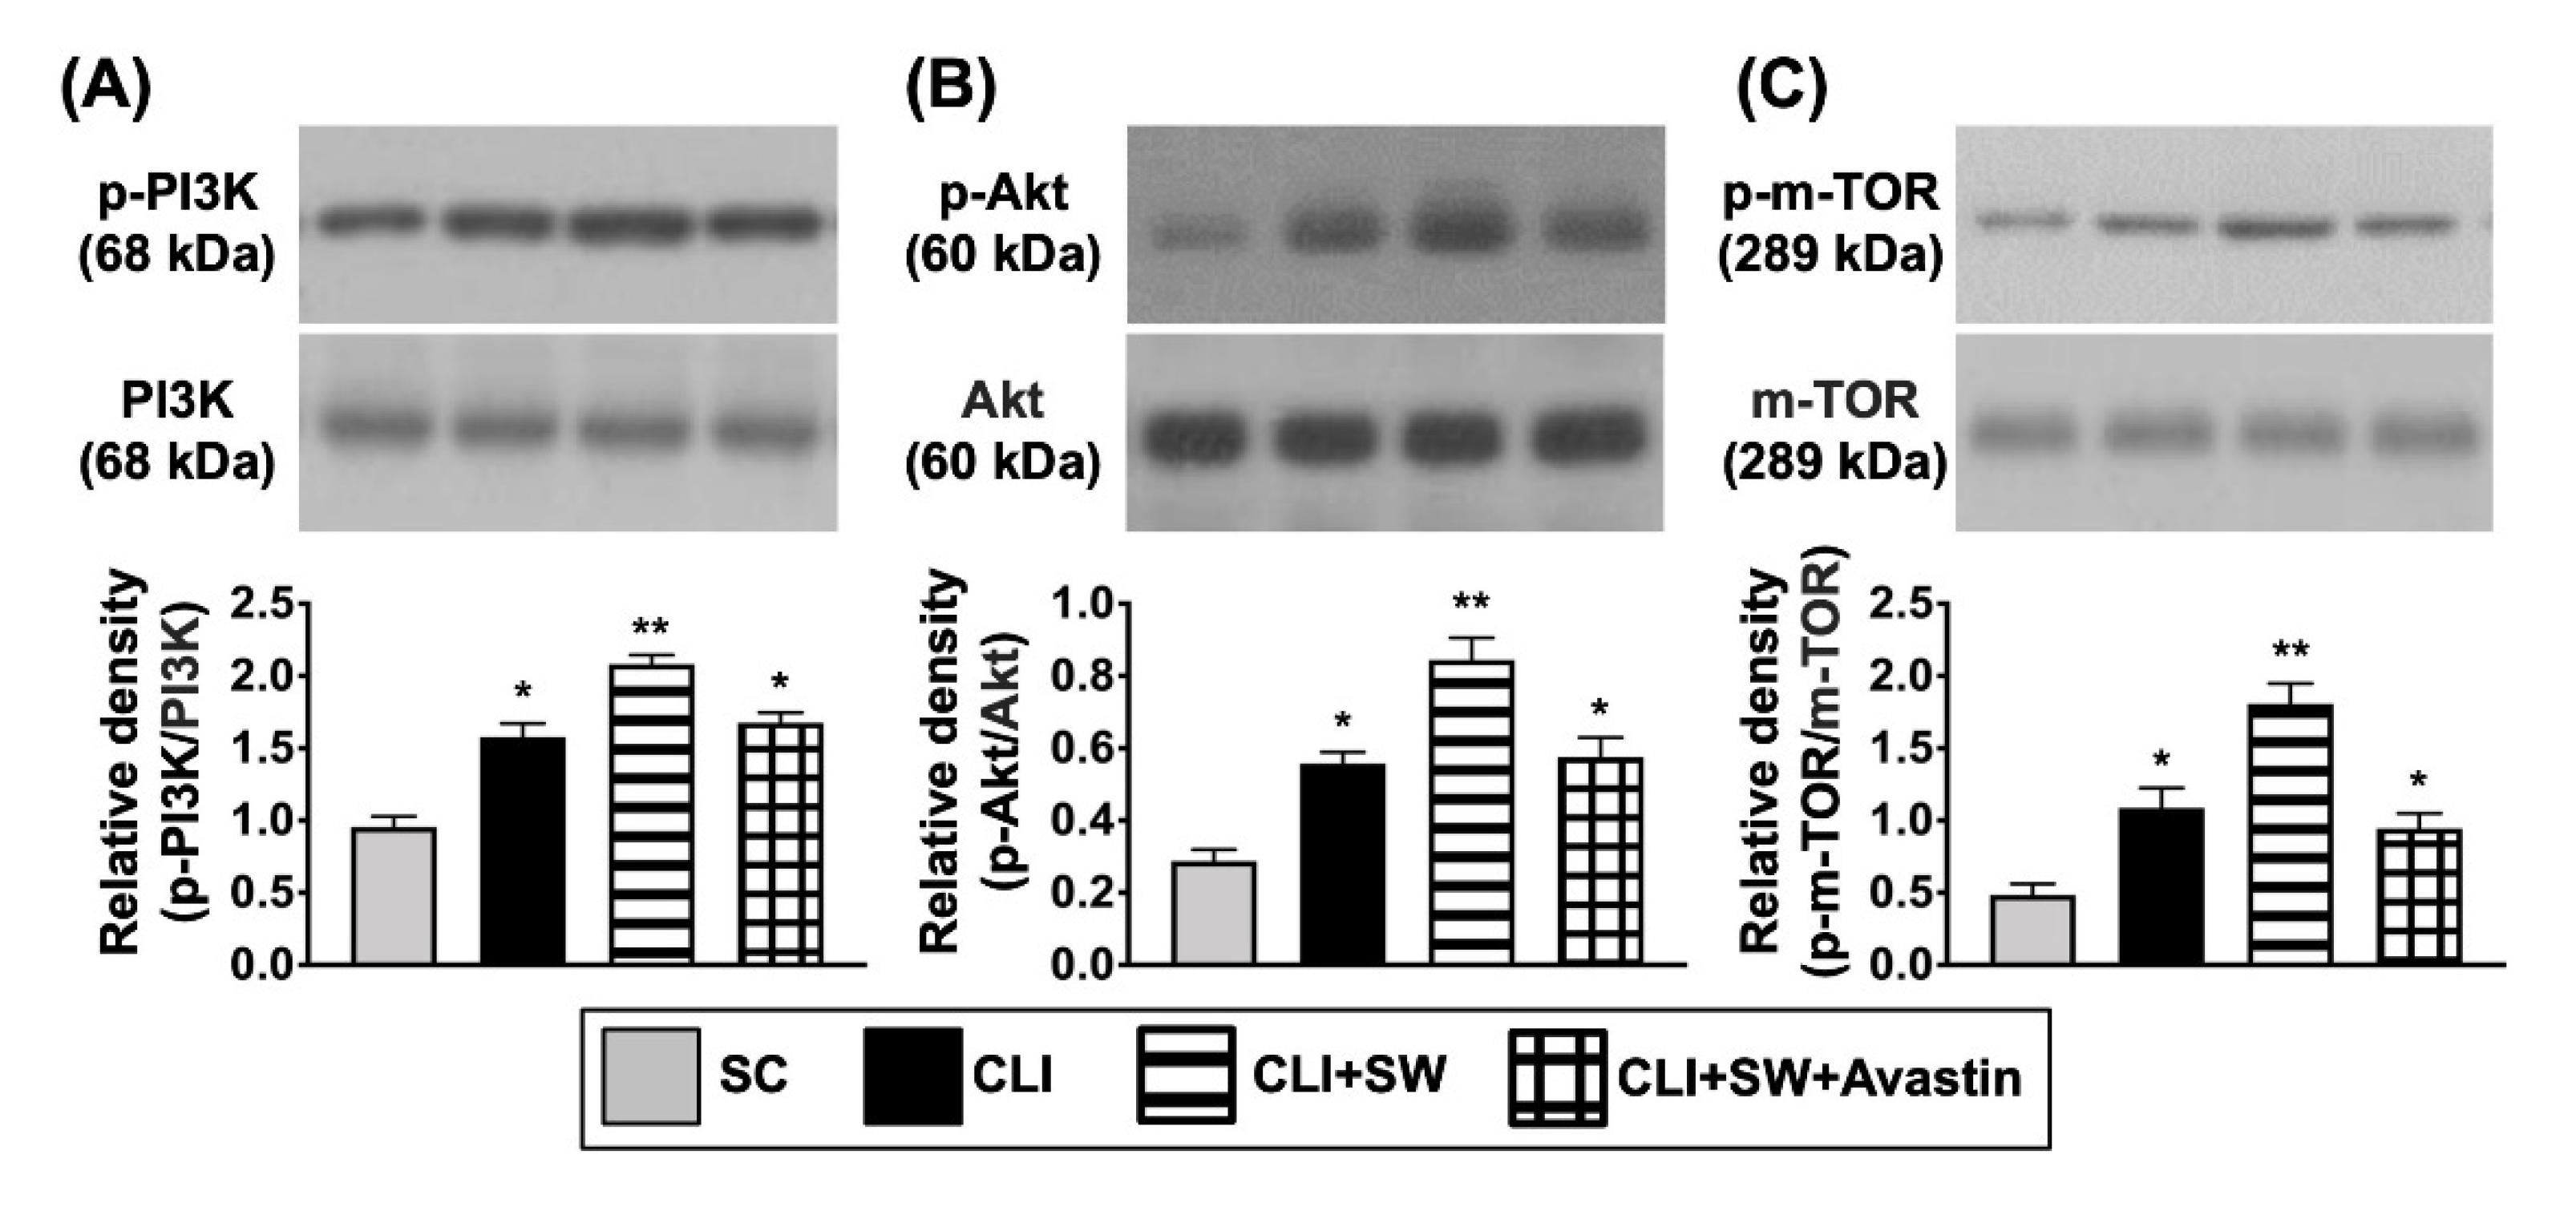
3.4. The Protein Expressions of Cell Proliferation/Growth/Survival and Cell Motility Signalings in CLI Quadriceps Muscle by Day 14 after CLI Induction
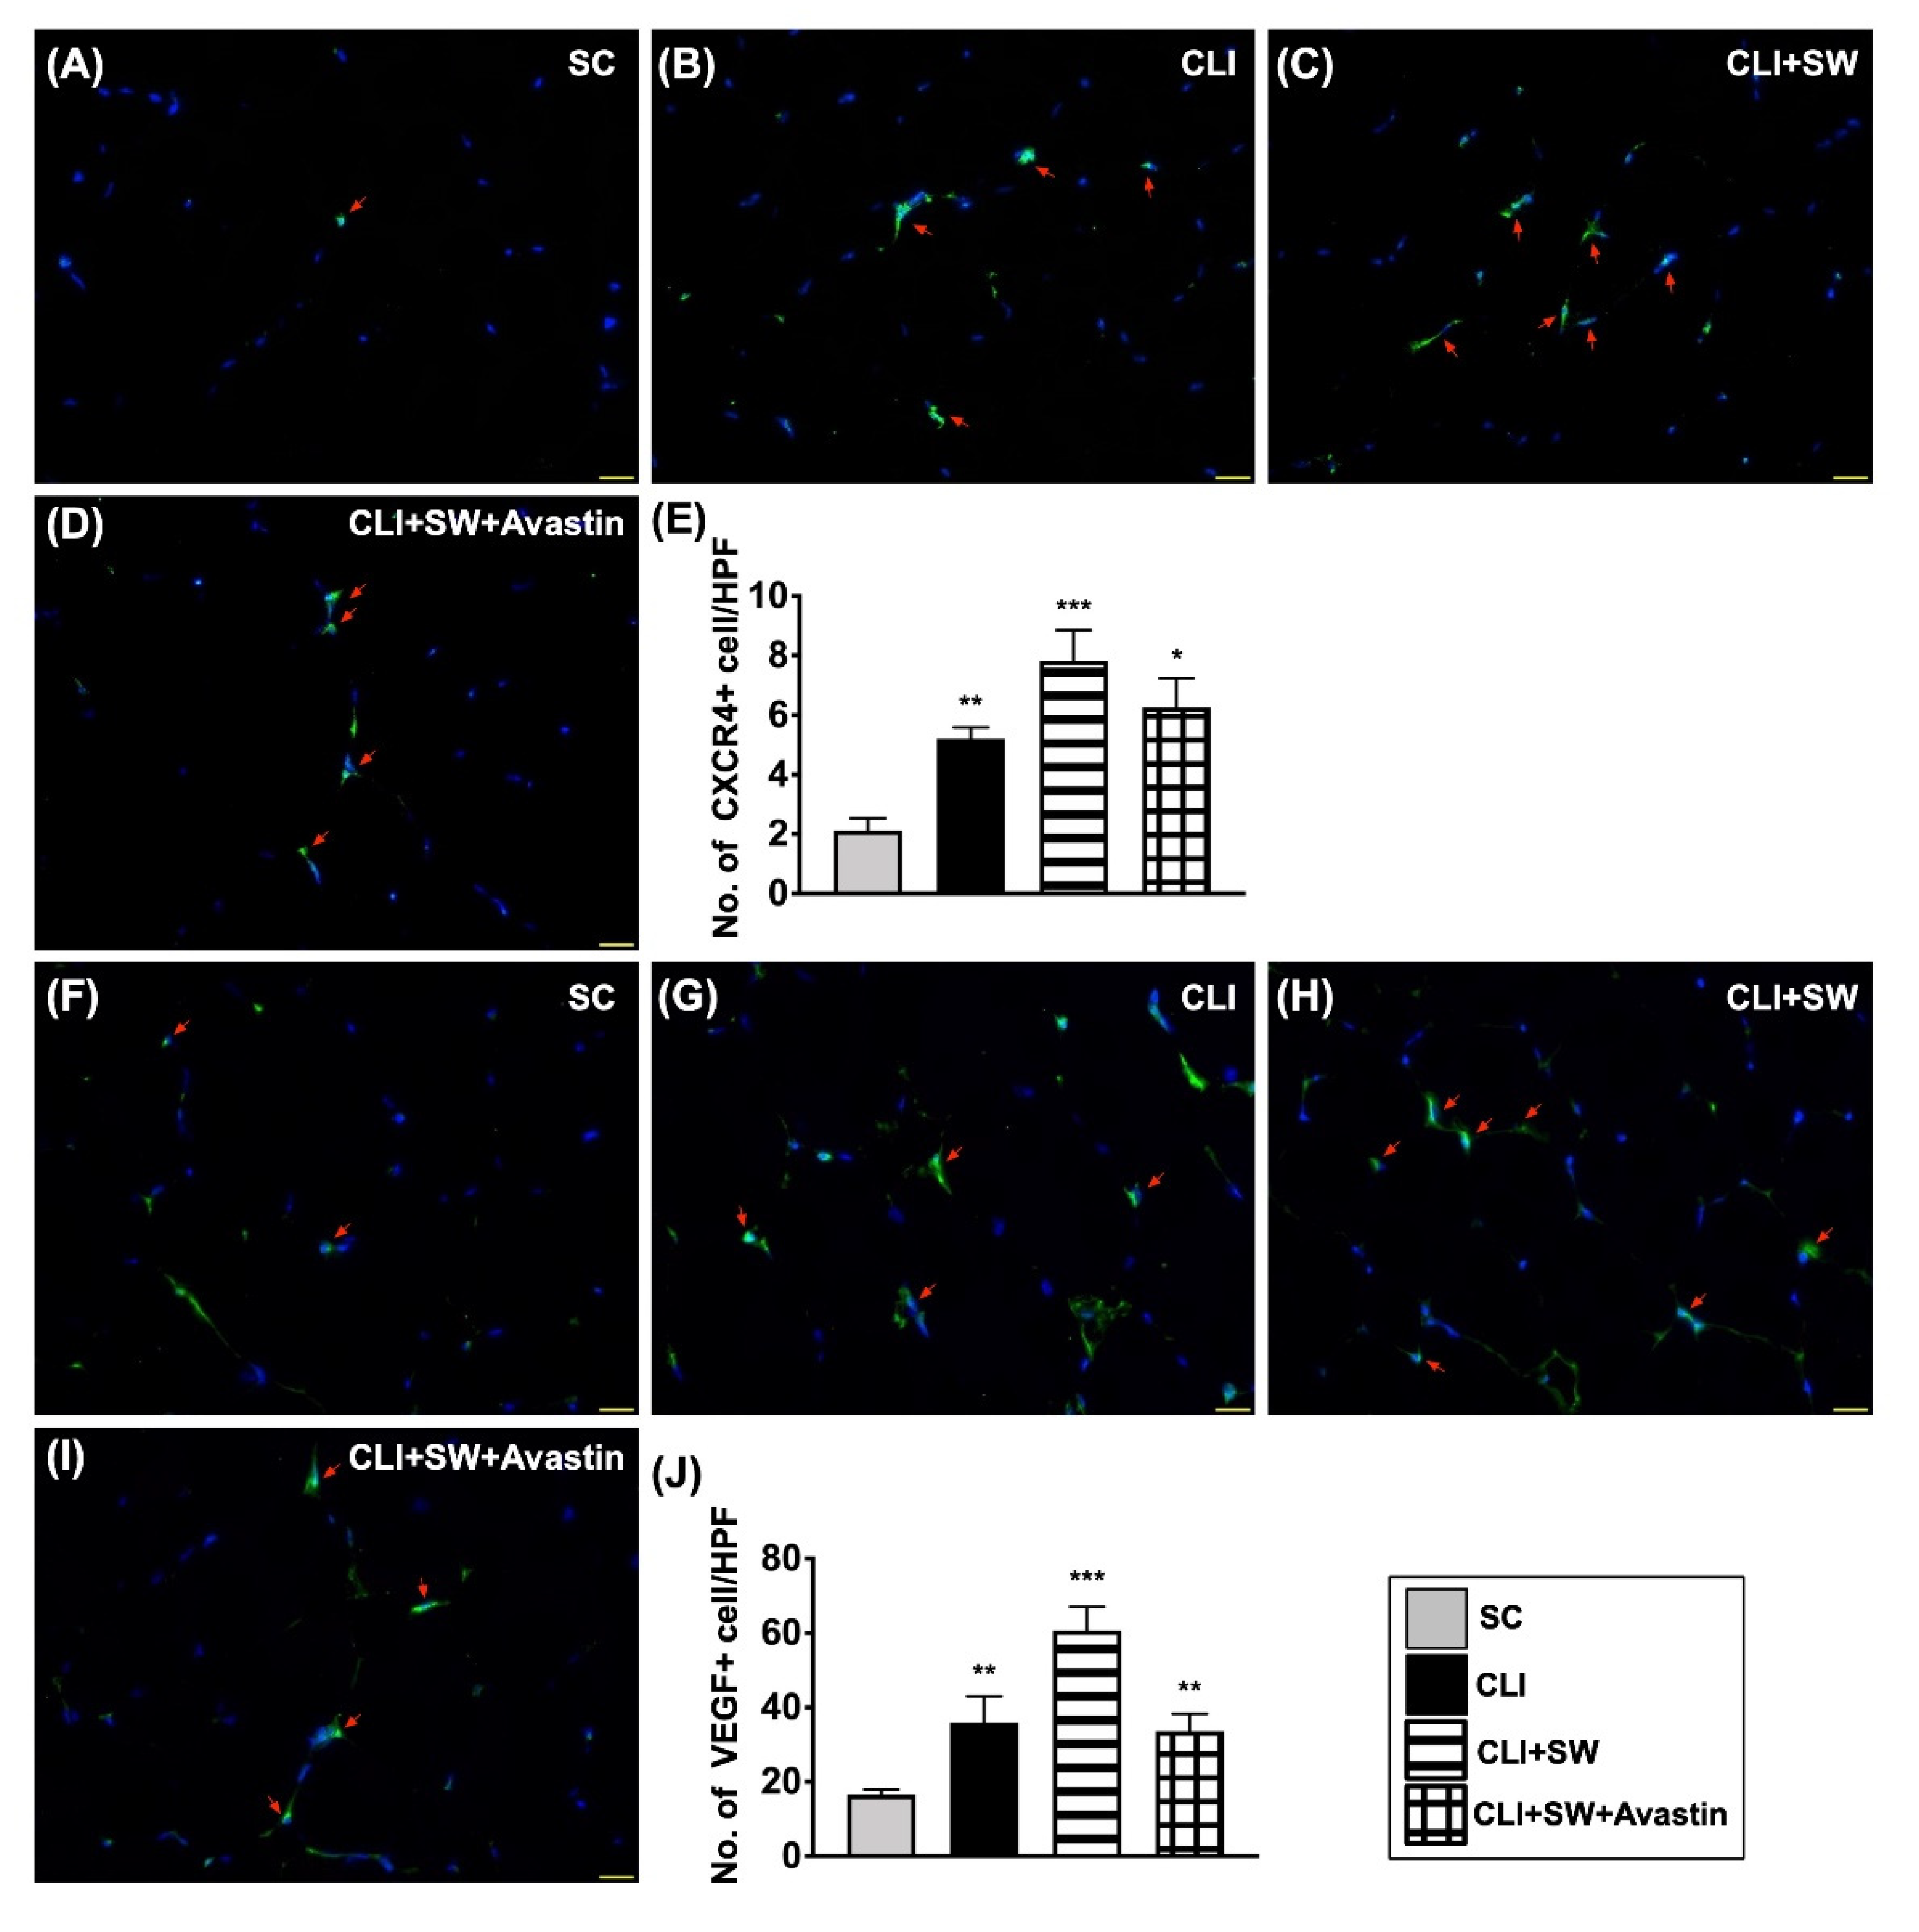
3.5. Cellular Expressions of Angiogenesis in CLI Quadriceps Muscle by Day 14 after CLI Induction
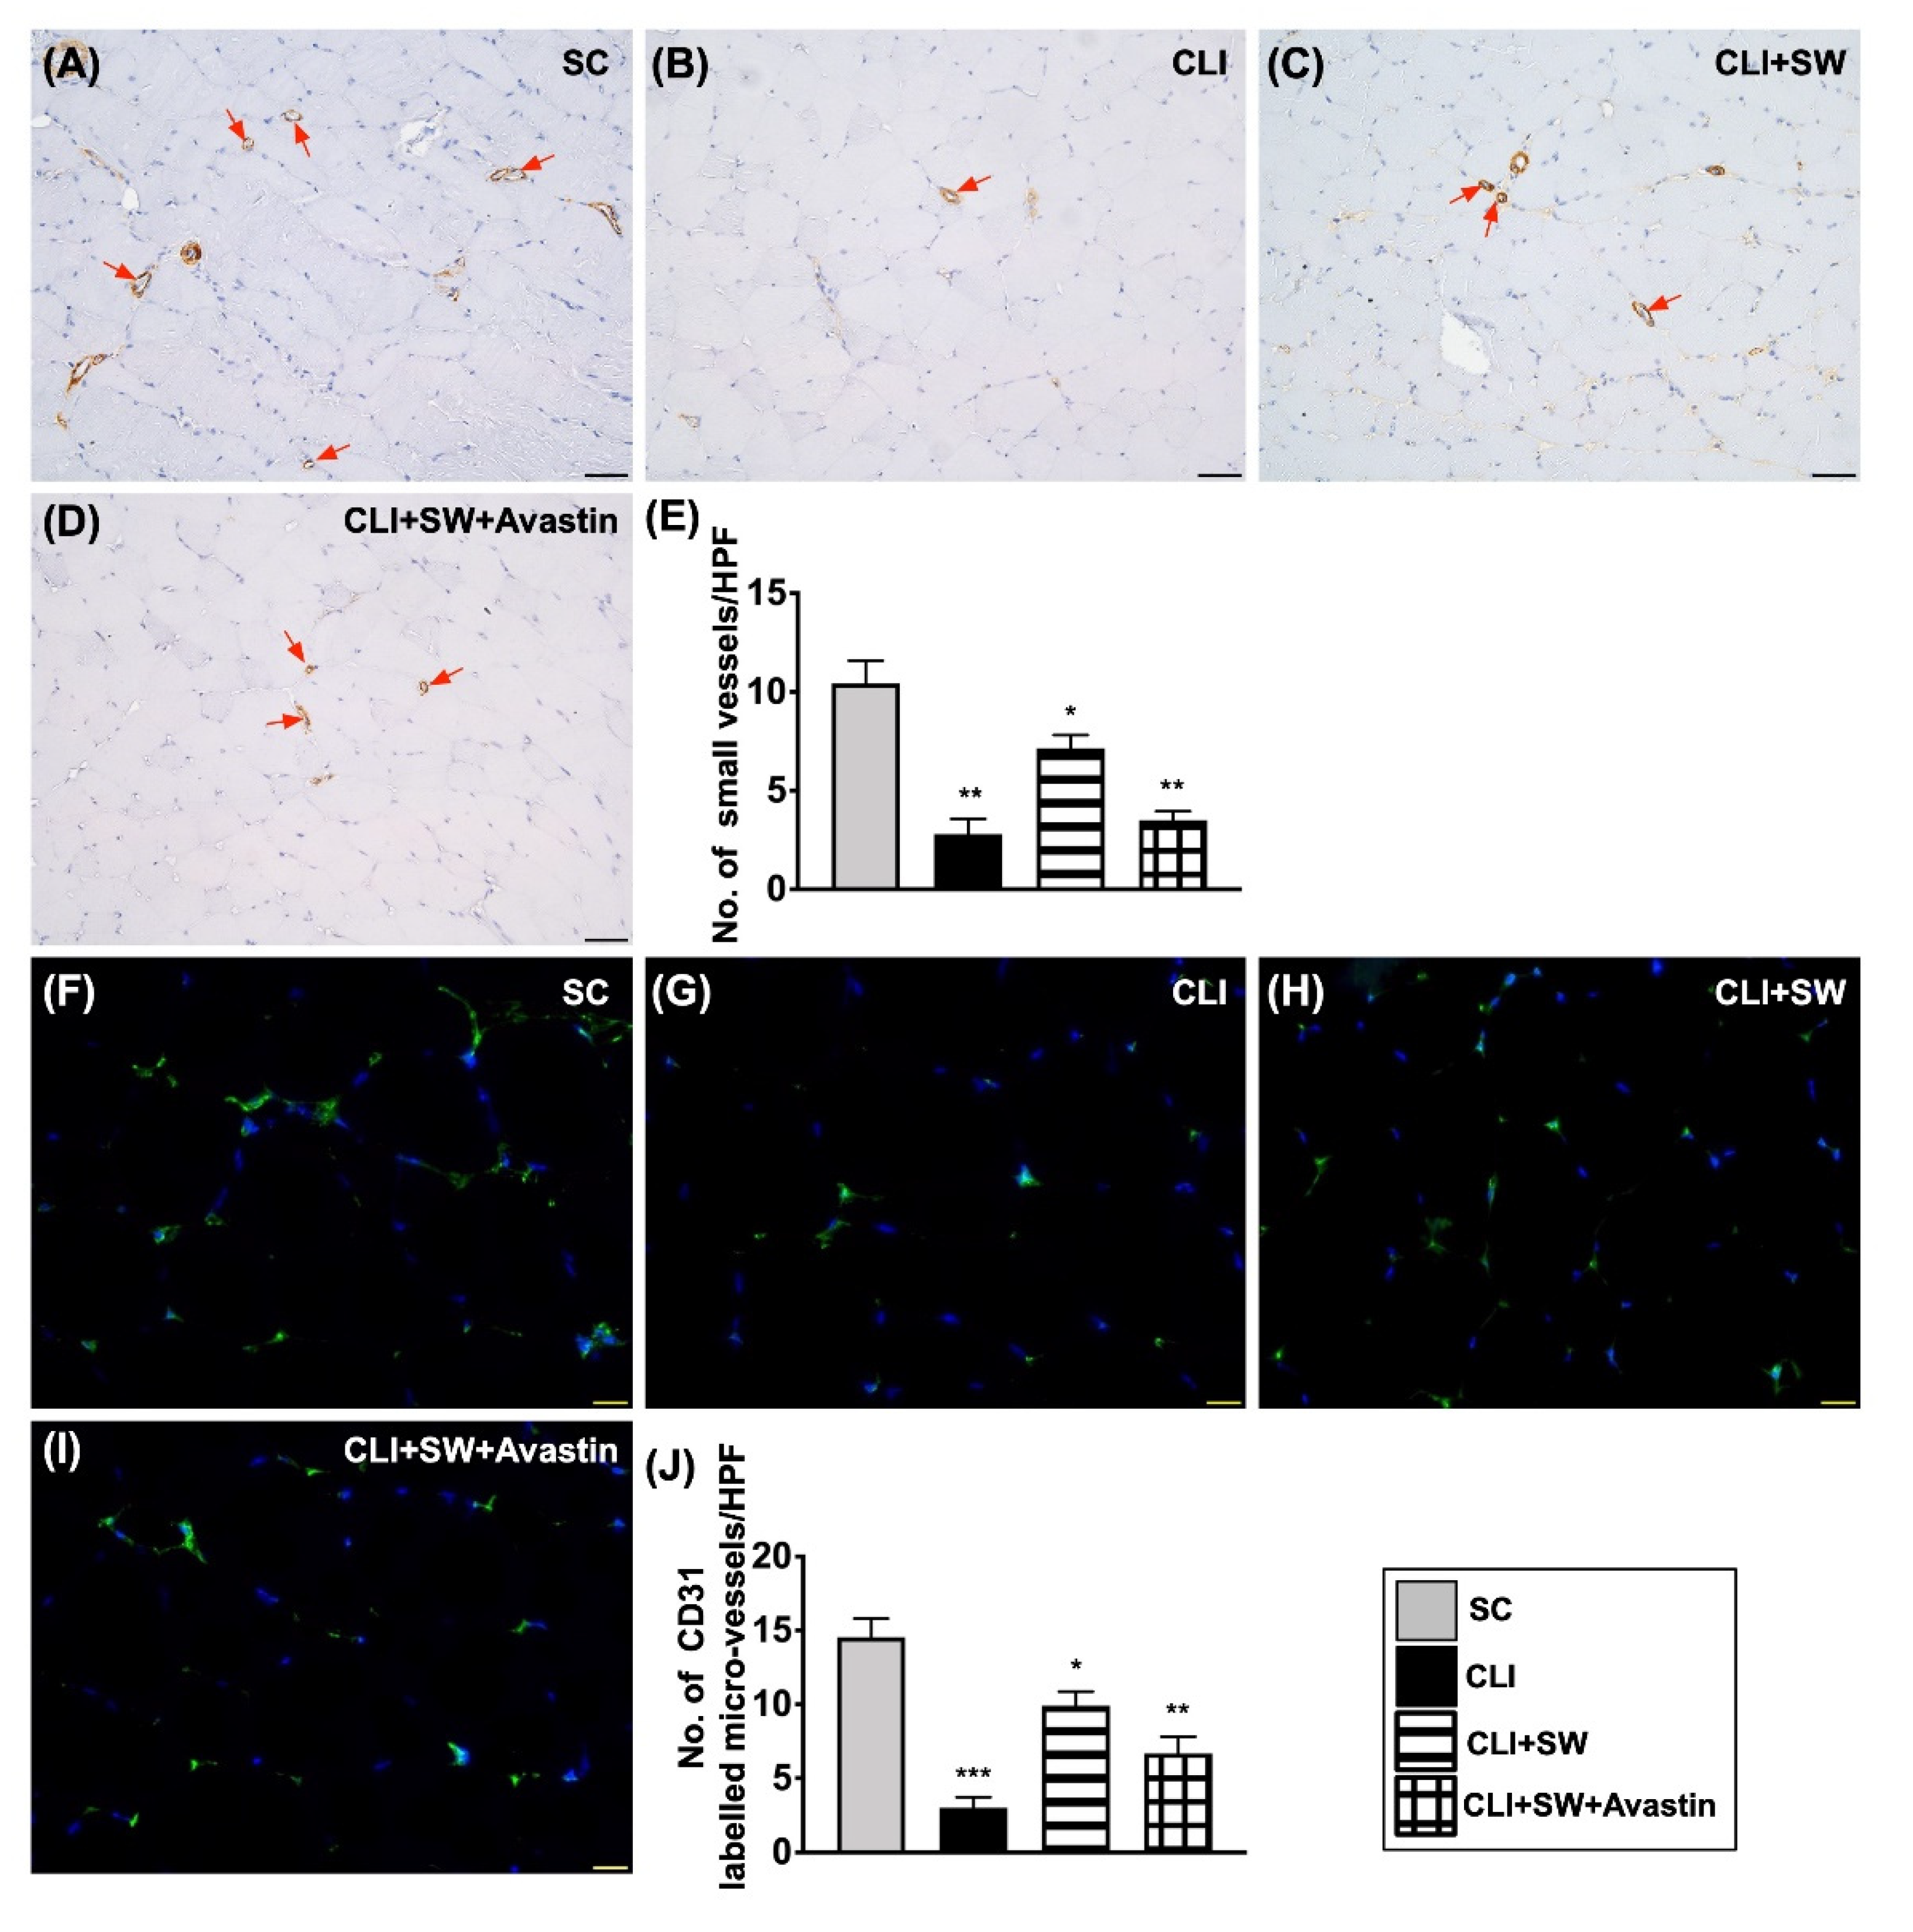
3.6. The Microscopic Findings for Identification of Small Vessel Density and the Endothelial Cell Surface Marker in CLI Quadriceps Muscle by Day 14 after CLI Induction
4. Discussion
Study Limitations
Supplementary Materials
Author Contributions
Funding
Institutional Review Board Statement
Informed Consent Statement
Data Availability Statement
Conflicts of Interest
References
- Criqui, M.H.; Aboyans, V. Epidemiology of peripheral artery disease. Circ. Res. 2015, 116, 1509–1526. [Google Scholar] [CrossRef]
- Fowkes, F.G.; Aboyans, V.; Fowkes, F.J.; McDermott, M.M.; Sampson, U.K.; Criqui, M.H. Peripheral artery disease: Epidemiology and global perspectives. Nat. Rev. Cardiol. 2017, 14, 156–170. [Google Scholar] [CrossRef]
- Aboyans, V.; Desormais, I.; Lacroix, P.; Salazar, J.; Criqui, M.H.; Laskar, M. The general prognosis of patients with peripheral arterial disease differs according to the disease localization. J. Am. Coll. Cardiol. 2010, 55, 898–903. [Google Scholar] [CrossRef]
- Amrock, S.M.; Abraham, C.Z.; Jung, E.; Morris, P.B.; Shapiro, M.D. Risk Factors for Mortality Among Individuals With Peripheral Arterial Disease. Am. J. Cardiol. 2017, 120, 862–867. [Google Scholar] [CrossRef]
- Andras, A.; Ferket, B. Screening for peripheral arterial disease. Cochrane Database Syst. Rev. 2014, CD010835. [Google Scholar] [CrossRef]
- Desormais, I.; Aboyans, V.; Guerchet, M.; Ndamba-Bandzouzi, B.; Mbelesso, P.; Dantoine, T.; Mohty, D.; Marin, B.; Preux, P.M.; Lacroix, P.; et al. Prevalence of peripheral artery disease in the elderly population in urban and rural areas of Central Africa: The EPIDEMCA study. Eur. J. Prev. Cardiol. 2015, 22, 1462–1472. [Google Scholar] [CrossRef] [PubMed]
- Sigvant, B.; Wiberg-Hedman, K.; Bergqvist, D.; Rolandsson, O.; Andersson, B.; Persson, E.; Wahlberg, E. A population-based study of peripheral arterial disease prevalence with special focus on critical limb ischemia and sex differences. J. Vasc. Surg. 2007, 45, 1185–1191. [Google Scholar] [CrossRef] [PubMed]
- Huysman, E.; Mathieu, C. Diabetes and peripheral vascular disease. Acta Chir. Belg. 2009, 109, 587–594. [Google Scholar] [CrossRef] [PubMed]
- Garimella, P.S.; Hirsch, A.T. Peripheral artery disease and chronic kidney disease: Clinical synergy to improve outcomes. Adv. Chronic Kidney Dis. 2014, 21, 460–471. [Google Scholar] [CrossRef]
- Singh, N.; Armstrong, D.G.; Lipsky, B.A. Preventing foot ulcers in patients with diabetes. JAMA 2005, 293, 217–228. [Google Scholar] [CrossRef] [PubMed]
- Sheu, J.J.; Lin, P.Y.; Sung, P.H.; Chen, Y.C.; Leu, S.; Chen, Y.L.; Tsai, T.H.; Chai, H.T.; Chua, S.; Chang, H.W.; et al. Levels and values of lipoprotein-associated phospholipase A2, galectin-3, RhoA/ROCK, and endothelial progenitor cells in critical limb ischemia: Pharmaco-therapeutic role of cilostazol and clopidogrel combination therapy. J. Transl. Med. 2014, 12, 101. [Google Scholar] [CrossRef]
- Momsen, A.H.; Jensen, M.B.; Norager, C.B.; Madsen, M.R.; Vestersgaard-Andersen, T.; Lindholt, J.S. Drug therapy for improving walking distance in intermittent claudication: A systematic review and meta-analysis of robust randomised controlled studies. Eur. J. Vasc. Endovasc. Surg. 2009, 38, 463–474. [Google Scholar] [CrossRef] [PubMed]
- Singh, P.; Harper, Y.; Oliphant, C.S.; Morsy, M.; Skelton, M.; Askari, R.; Khouzam, R.N. Peripheral interventions and antiplatelet therapy: Role in current practice. World J. Cardiol. 2017, 9, 583–593. [Google Scholar] [CrossRef]
- Sachs, T.; Pomposelli, F.; Hamdan, A.; Wyers, M.; Schermerhorn, M. Trends in the national outcomes and costs for claudication and limb threatening ischemia: Angioplasty vs. bypass graft. J. Vasc. Surg. 2011, 54, 1021–1031.e1021. [Google Scholar] [CrossRef] [PubMed]
- Reinecke, H.; Unrath, M.; Freisinger, E.; Bunzemeier, H.; Meyborg, M.; Luders, F.; Gebauer, K.; Roeder, N.; Berger, K.; Malyar, N.M. Peripheral arterial disease and critical limb ischaemia: Still poor outcomes and lack of guideline adherence. Eur. Heart J. 2015, 36, 932–938. [Google Scholar] [CrossRef]
- Aboyans, V.; Ricco, J.B.; Bartelink, M.E.L.; Bjorck, M.; Brodmann, M.; Cohnert, T.; Collet, J.P.; Czerny, M.; De Carlo, M.; Debus, S.; et al. 2017 ESC Guidelines on the Diagnosis and Treatment of Peripheral Arterial Diseases, in collaboration with the European Society for Vascular Surgery (ESVS): Document covering atherosclerotic disease of extracranial carotid and vertebral, mesenteric, renal, upper and lower extremity arteriesEndorsed by: The European Stroke Organization (ESO)The Task Force for the Diagnosis and Treatment of Peripheral Arterial Diseases of the European Society of Cardiology (ESC) and of the European Society for Vascular Surgery (ESVS). Eur. Heart J. 2018, 39, 763–816. [Google Scholar] [CrossRef] [PubMed]
- Diehm, C.; Allenberg, J.R.; Pittrow, D.; Mahn, M.; Tepohl, G.; Haberl, R.L.; Darius, H.; Burghaus, I.; Trampisch, H.J.; German Epidemiological Trial on Ankle Brachial Index Study Group. Mortality and vascular morbidity in older adults with asymptomatic versus symptomatic peripheral artery disease. Circulation 2009, 120, 2053–2061. [Google Scholar] [CrossRef]
- Arain, F.A.; Ye, Z.; Bailey, K.R.; Chen, Q.; Liu, G.; Leibson, C.L.; Kullo, I.J. Survival in patients with poorly compressible leg arteries. J. Am. Coll. Cardiol. 2012, 59, 400–407. [Google Scholar] [CrossRef]
- Notarnicola, A.; Moretti, B. The biological effects of extracorporeal shock wave therapy (eswt) on tendon tissue. Muscles Ligaments Tendons J. 2012, 2, 33–37. [Google Scholar]
- Burneikaite, G.; Shkolnik, E.; Celutkiene, J.; Zuoziene, G.; Butkuviene, I.; Petrauskiene, B.; Serpytis, P.; Laucevicius, A.; Lerman, A. Cardiac shock-wave therapy in the treatment of coronary artery disease: Systematic review and meta-analysis. Cardiovasc. Ultrasound 2017, 15, 11. [Google Scholar] [CrossRef]
- Fode, M.; Lowenstein, L.; Reisman, Y. Low-Intensity Extracorporeal Shockwave Therapy in Sexual Medicine: A Questionnaire-Based Assessment of Knowledge, Clinical Practice Patterns, and Attitudes in Sexual Medicine Practitioners. Sex Med. 2017, 5, e94–e98. [Google Scholar] [CrossRef]
- Fu, M.; Sun, C.K.; Lin, Y.C.; Wang, C.J.; Wu, C.J.; Ko, S.F.; Chua, S.; Sheu, J.J.; Chiang, C.H.; Shao, P.L.; et al. Extracorporeal shock wave therapy reverses ischemia-related left ventricular dysfunction and remodeling: Molecular-cellular and functional assessment. PLoS ONE 2011, 6, e24342. [Google Scholar] [CrossRef] [PubMed]
- Yeh, K.H.; Sheu, J.J.; Lin, Y.C.; Sun, C.K.; Chang, L.T.; Kao, Y.H.; Yen, C.H.; Shao, P.L.; Tsai, T.H.; Chen, Y.L.; et al. Benefit of combined extracorporeal shock wave and bone marrow-derived endothelial progenitor cells in protection against critical limb ischemia in rats. Crit. Care Med. 2012, 40, 169–177. [Google Scholar] [CrossRef] [PubMed]
- Sheu, J.J.; Lee, F.Y.; Yuen, C.M.; Chen, Y.L.; Huang, T.H.; Chua, S.; Chen, Y.L.; Chen, C.H.; Chai, H.T.; Sung, P.H.; et al. Combined therapy with shock wave and autologous bone marrow-derived mesenchymal stem cells alleviates left ventricular dysfunction and remodeling through inhibiting inflammatory stimuli, oxidative stress & enhancing angiogenesis in a swine myocardial infarction model. Int. J. Cardiol. 2015, 193, 69–83. [Google Scholar] [CrossRef]
- Chai, H.T.; Chen, K.H.; Wallace, C.G.; Chen, C.H.; Sung, P.H.; Chen, Y.L.; Yuen, C.M.; Shao, P.L.; Sun, C.K.; Chang, H.W.; et al. Extracorporeal shock wave therapy effectively protects brain against chronic cerebral hypo-perfusion-induced neuropathological changes. Am. J. Transl. Res. 2017, 9, 5074–5093. [Google Scholar]
- Sheu, J.J.; Ali, H.E.E.; Cheng, B.C.; Chiang, H.J.; Sung, P.H.; Chen, K.H.; Yang, C.C.; Chen, Y.T.; Chiang, J.Y.; Lin, P.Y.; et al. Extracorporeal shock wave treatment attenuated left ventricular dysfunction and remodeling in mini-pig with cardiorenal syndrome. Oncotarget 2017, 8, 54747–54763. [Google Scholar] [CrossRef]
- Sung, P.H.; Yin, T.C.; Wallace, C.G.; Chen, K.H.; Shao, P.L.; Lee, F.Y.; Sun, C.K.; Sheu, J.J.; Chen, Y.L.; Omran, M.M.; et al. Extracorporeal Shock Wave-Supported Adipose-Derived Fresh Stromal Vascular Fraction Preserved Left Ventricular (LV) Function and Inhibited LV Remodeling in Acute Myocardial Infarction in Rat. Oxid. Med. Cell Longev. 2018, 2018, 7518920. [Google Scholar] [CrossRef]
- Roberts, P.J.; Der, C.J. Targeting the Raf-MEK-ERK mitogen-activated protein kinase cascade for the treatment of cancer. Oncogene 2007, 26, 3291–3310. [Google Scholar] [CrossRef]
- Wee, P.; Wang, Z. Epidermal Growth Factor Receptor Cell Proliferation Signaling Pathways. Cancers 2017, 9, 52. [Google Scholar] [CrossRef] [PubMed]
- Sheu, J.J.; Sung, P.H.; Wallace, C.G.; Yang, C.C.; Chen, K.H.; Shao, P.L.; Chu, Y.C.; Huang, C.R.; Chen, Y.L.; Ko, S.F.; et al. Intravenous administration of iPS-MSC(SPIONs) mobilized into CKD parenchyma and effectively preserved residual renal function in CKD rat. J. Cell Mol. Med. 2020, 24, 3593–3610. [Google Scholar] [CrossRef]
- Lee, F.Y.; Zhen, Y.Y.; Yuen, C.M.; Fan, R.; Chen, Y.T.; Sheu, J.J.; Chen, Y.L.; Wang, C.J.; Sun, C.K.; Yip, H.K. The mTOR-FAK mechanotransduction signaling axis for focal adhesion maturation and cell proliferation. Am. J. Transl. Res. 2017, 9, 1603–1617. [Google Scholar]
- Huang, T.H.; Sun, C.K.; Chen, Y.L.; Wang, C.J.; Yin, T.C.; Lee, M.S.; Yip, H.K. Shock Wave Enhances Angiogenesis through VEGFR2 Activation and Recycling. Mol. Med. 2017, 22, 850–862. [Google Scholar] [CrossRef]
- Kamili, C.; Kakaraparthy, R.S.; Vattikuti, U.M. Anti-Angiogenic Activity of Flunarizine by In Ovo, In Vitro, and In Vivo Assays. Turk. J. Pharm. Sci. 2019, 16, 303–309. [Google Scholar] [CrossRef]
- Sheu, J.J.; Chang, M.W.; Wallace, C.G.; Chiang, H.J.; Sung, P.H.; Tsai, T.H.; Chung, S.Y.; Chen, Y.L.; Chua, S.; Chang, H.W.; et al. Exendin-4 protected against critical limb ischemia in obese mice. Am. J. Transl. Res. 2015, 7, 445–459. [Google Scholar] [PubMed]
- Lee, F.Y.; Sun, C.K.; Sung, P.H.; Chen, K.H.; Chua, S.; Sheu, J.J.; Chung, S.Y.; Chai, H.T.; Chen, Y.L.; Huang, T.H.; et al. Daily melatonin protects the endothelial lineage and functional integrity against the aging process, oxidative stress, and toxic environment and restores blood flow in critical limb ischemia area in mice. J. Pineal. Res. 2018, 65, e12489. [Google Scholar] [CrossRef] [PubMed]
- Zhang, Q.; Cheng, Y.; Huang, L.; Bai, Y.; Liang, J.; Li, X. Inhibitory effect of carboplatin in combination with bevacizumab on human retinoblastoma in an in vitro and in vivo model. Oncol. Lett. 2017, 14, 5326–5332. [Google Scholar] [CrossRef] [PubMed][Green Version]


Publisher’s Note: MDPI stays neutral with regard to jurisdictional claims in published maps and institutional affiliations. |
© 2022 by the authors. Licensee MDPI, Basel, Switzerland. This article is an open access article distributed under the terms and conditions of the Creative Commons Attribution (CC BY) license (https://creativecommons.org/licenses/by/4.0/).
Share and Cite
Sung, P.-H.; Yin, T.-C.; Chai, H.-T.; Chiang, J.Y.; Chen, C.-H.; Huang, C.-R.; Yip, H.-K. Extracorporeal Shock Wave Therapy Salvages Critical Limb Ischemia in B6 Mice through Upregulating Cell Proliferation Signaling and Angiogenesis. Biomedicines 2022, 10, 117. https://doi.org/10.3390/biomedicines10010117
Sung P-H, Yin T-C, Chai H-T, Chiang JY, Chen C-H, Huang C-R, Yip H-K. Extracorporeal Shock Wave Therapy Salvages Critical Limb Ischemia in B6 Mice through Upregulating Cell Proliferation Signaling and Angiogenesis. Biomedicines. 2022; 10(1):117. https://doi.org/10.3390/biomedicines10010117
Chicago/Turabian StyleSung, Pei-Hsun, Tsung-Cheng Yin, Han-Tan Chai, John Y. Chiang, Chih-Hung Chen, Chi-Ruei Huang, and Hon-Kan Yip. 2022. "Extracorporeal Shock Wave Therapy Salvages Critical Limb Ischemia in B6 Mice through Upregulating Cell Proliferation Signaling and Angiogenesis" Biomedicines 10, no. 1: 117. https://doi.org/10.3390/biomedicines10010117
APA StyleSung, P.-H., Yin, T.-C., Chai, H.-T., Chiang, J. Y., Chen, C.-H., Huang, C.-R., & Yip, H.-K. (2022). Extracorporeal Shock Wave Therapy Salvages Critical Limb Ischemia in B6 Mice through Upregulating Cell Proliferation Signaling and Angiogenesis. Biomedicines, 10(1), 117. https://doi.org/10.3390/biomedicines10010117