Article

The Effect of Au Nanoparticle Addition on Humidity Sensing with Ultra-Small TiO2 Nanoparticles

1
Department of Information Engineering and Mathematical Sciences, University of Siena, Via Roma 56, 53100 Siena, Italy
2
Department of Physical Science, Earth and Environment, University of Siena, Via Laterina 8, 53100 Siena, Italy
*
Author to whom correspondence should be addressed.
Chemosensors 2021, 9(7), 170; https://doi.org/10.3390/chemosensors9070170
Submission received: 31 May 2021 / Revised: 25 June 2021 / Accepted: 30 June 2021 / Published: 5 July 2021
(This article belongs to the Section Materials for Chemical Sensing)

Abstract

:
In this paper, we investigate humidity sensing through impedance measurements with TiO2 nanoparticles (about 6 nm in diameter). The transient behavior and the impedance spectra are measured and interpreted from the theoretical point of view. Large responses are shown especially in the relative humidity range from 30% to 80%, which are essentially explained by condensation in the nanopores. The effect of the addition of Au nanoparticles is investigated and as expected, the Au/TiO2 interfaces allow for dramatically reducing the sensing film response time and above all, its recovery time; moreover, it seems to favor condensation when the relative humidity overcomes 70%.

1. Introduction

The idea of exploiting metal oxide (MOX) nanoparticles and nanostructures for moisture/gas detection is quite popular. The existence of extremely easy and inexpensive preparation techniques of nanostructured MOX materials is strongly pushing toward this solution [1,2,3,4,5,6,7,8]. Obviously, the very high surface/volume ratio of these materials is an optimal feature for all the sensing applications related to the adsorption of gaseous species. The large surface areas that characterize the nano-structured sensor layers or those obtained from nano-powders are certainly a positive element from the sensing point of view because the adsorption phenomena influence in a more important way the electrical behavior of the material. However, the increase of the useful sensing surface is accompanied by the appearance of intergranular spaces or pores with nanometric dimensions. This feature is not relevant when the sensor is used for measurements where the target gas species are in concentrations very far from the vapor saturation one. On the other hand, when using these kind of sensing materials to detect humidity, the operating interval in terms of target gas concentration encompasses the entire range up to the vapor saturation concentration. In this case, when the partial pressure of the target gas exceeds 40% of the vapor saturation pressure, the size and geometry of nanopores or voids among the nanoparticles forming the sensing film become very important, and greatly affect the response of the sensing layer, due to the capillary condensation [9].
The very good performance in terms of humidity sensing of TiO2 films composed of subtle nanoparticles or fine-grained porous films is presented in many works in the literature. TiO2 is known for adsorbing large quantities of water and for promoting water dissociation on its surface, which thus forms the first chemosorbed layer. The chemisorbed molecules interact with the electronic conductivity of the layer. Over this mono-layer, further physiosorbed layers form, where the electrical conduction is possible due to proton hopping. Finally, when the humidity is very large but below the vapor saturation pressure, the water can condensate in the nanopores due to the capillary effect, and the liquid formation is accompanied by a very large change in the conductivity of the film due to the added conductive path formed by the liquid water where the protonic conduction mechanism, known as the Grotthuss effect, takes place. A very large response to high relative humidity was observed many times in nanostructured film [10,11], which can also be accompanied by hysteresis, non-reproducible phenomena, and even in some cases by the irreversible transformation of the sensing layer due to the modification of the pore structure.
In this paper we explore the possibility of using very subtle layer of TiO2 nanoparticles (NPs) for humidity sensing based on the impedance measurements at room temperature (RT), in the whole RH range, taking into account the effects of all the above-mentioned phenomena, and trying to highlight their pros and cons in the perspective of sensor development. The paper presents a study aiming at showing the influence of the nanostructure in the development of conductive sensors based on materials known for their activity toward water adsorption. This study can have a general validity for all the nanostructured metal oxides used for RH sensors, for which chemosorption is followed by multilayer physisorption and, finally, by water condensation in the micropores or mesopores. As already said, TiO2 was selected as a subject of the study due to its well-known capability of adsorbing water vapor but also because TiO2 nanoparticles have the advantage of a low cost and large availability since they are used for many other applications [2,12,13,14,15]. Moreover, the effect of the addition of Au nanoparticles (5 nm) is investigated, which are selected to improve the water adsorption and to obtain improved transient response in terms of response and recovery times. The addition of Au nanoparticle allows the formation of Au/TiO2 interfaces, which were proven to enhance water adsorption activity [16,17,18] and to act as favorable binding sites for different gases, providing faster response and recovery times [19,20,21,22]. It should be noted that the activation barrier for the dissociation of H2O at the Au-TiO2 interface is substantially smaller than on the supported gold nanoparticle (0.6 eV vs. 1.3 eV) [17]. Moreover, the addition of gold to the TiO2 leads to a stable material, as reported in [19], due to electron transfer from TiO2 (Ti3+, oxygen vacancies) to metallic NPs.

2. Materials and Methods

2.1. Materials

The TiO2 nanoparticles have been obtained from L&G Holding srl (PhotoActive, Macchia d’Isernia, Italy) in liquid form in an off-white ethanol-based solution having a density of approximately 0.98 mg/cm3 and an expected nanoparticle diameter of approximately 6 nm.
The gold nanoparticles were purchased from Sigma Aldrich (Darmstadt, Germany) in a phosphate-buffered saline (PBS) suspended solution (0.1 mM) with a concentration of 5.5 × 10¹³ particles/mL, a nanoparticle diameter of 5 nm, a molar mass of 196.97 g/mol, and a declared variability in size and shape less than 12%.

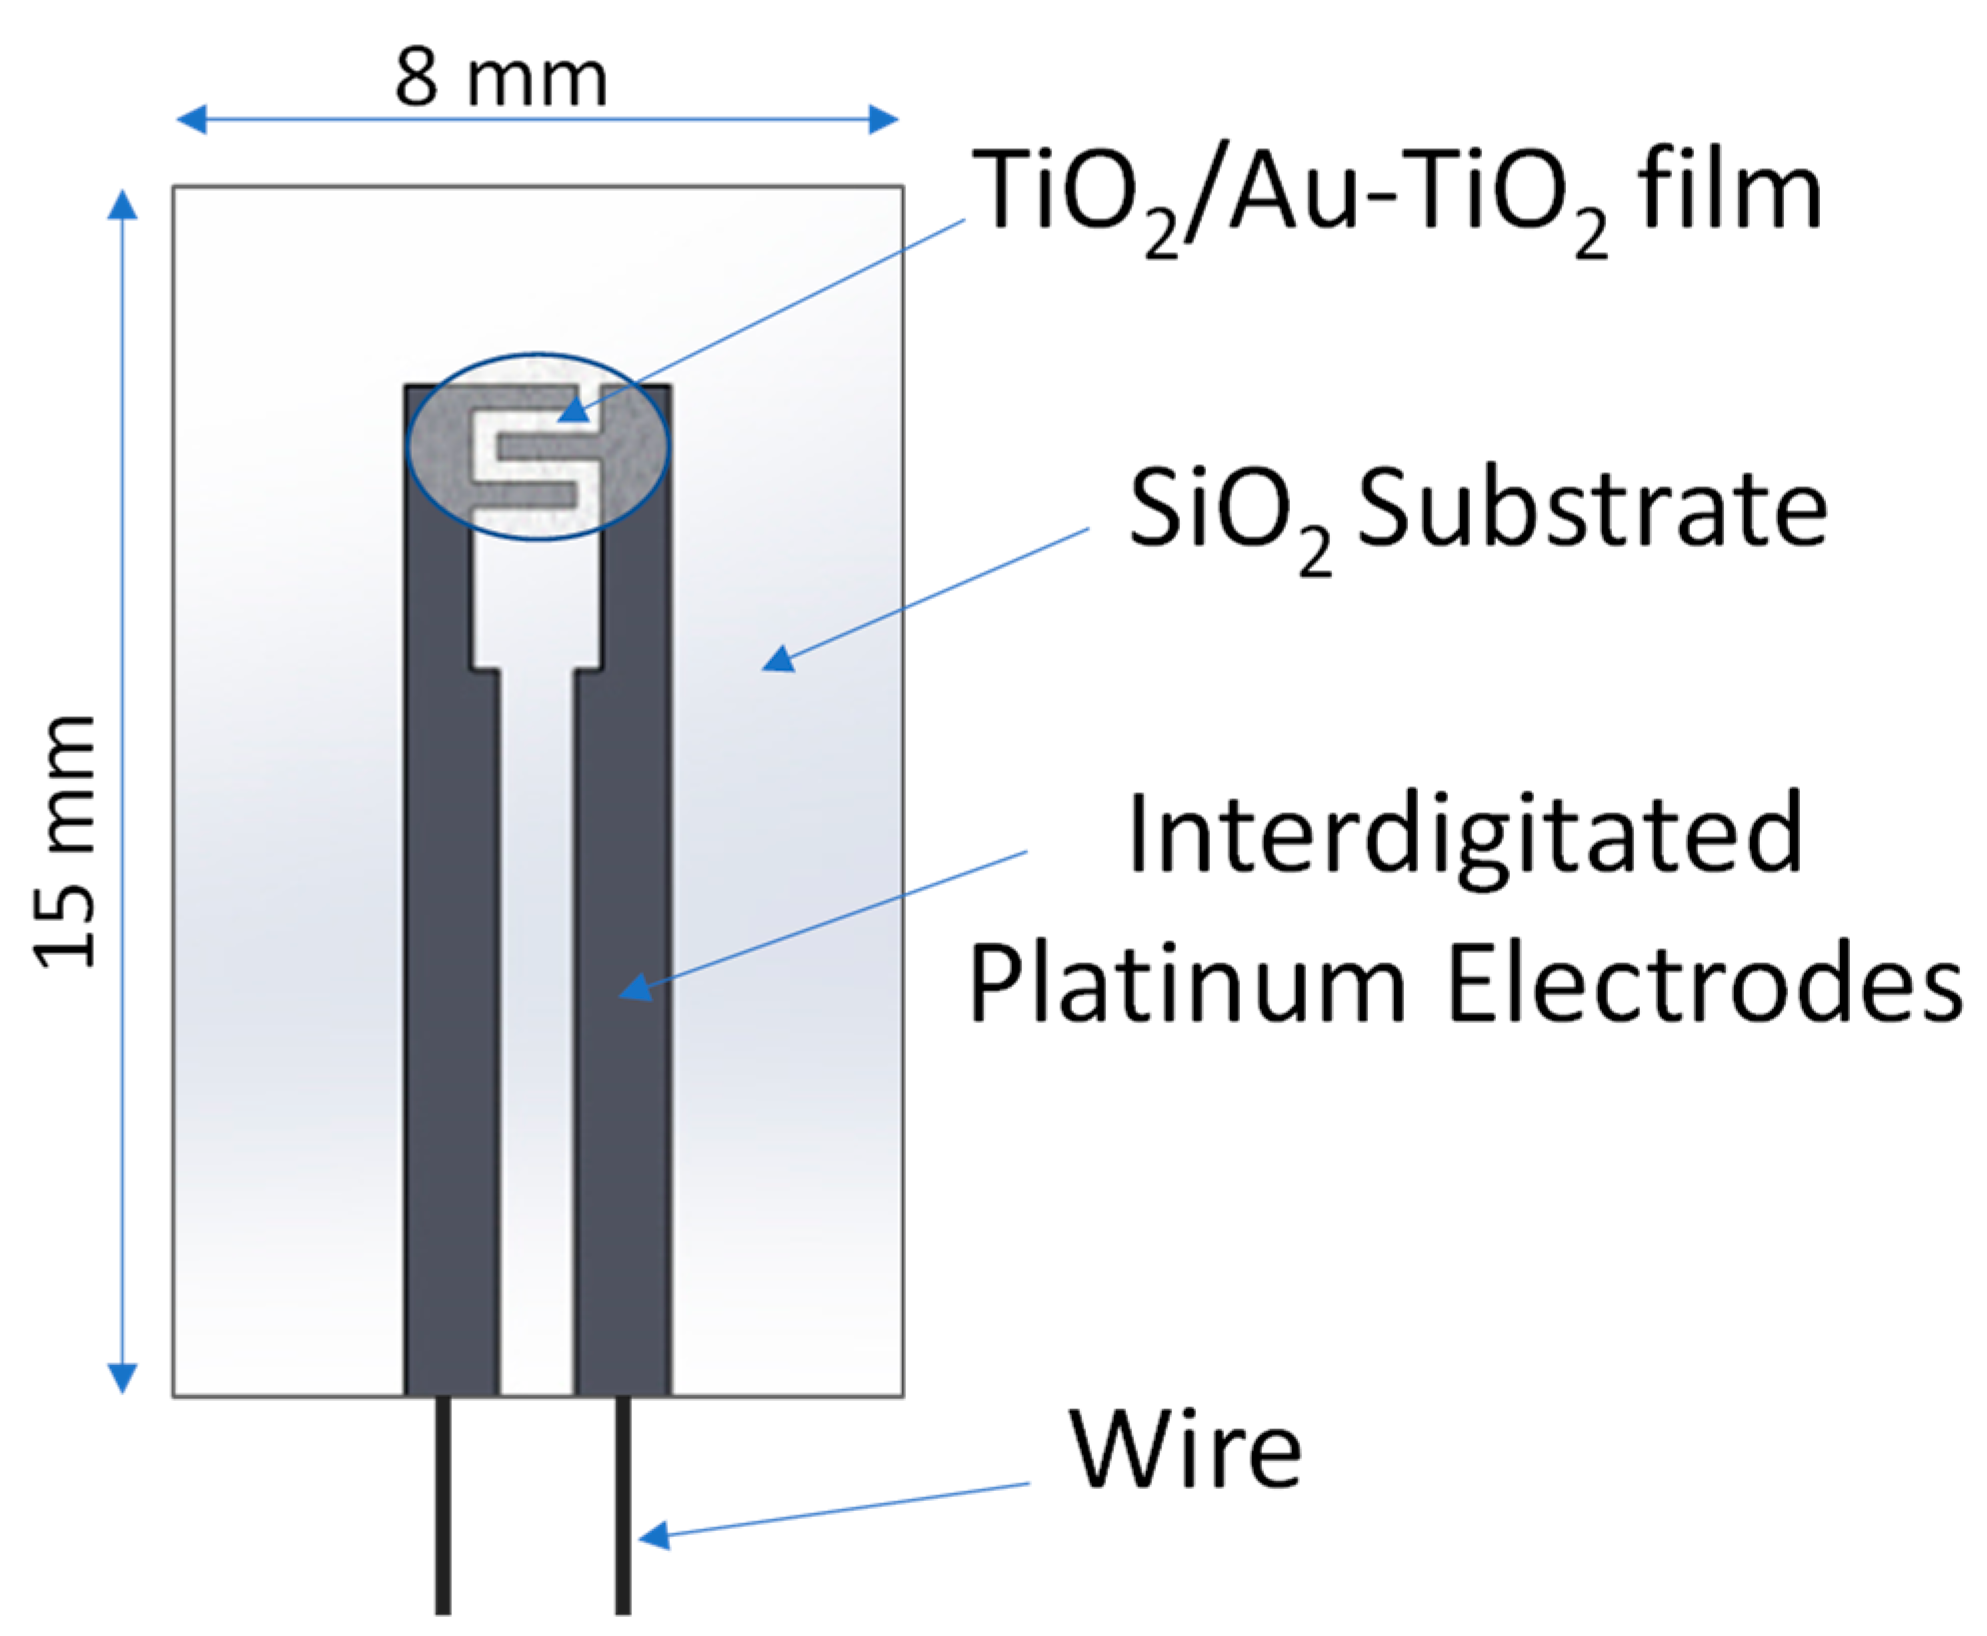
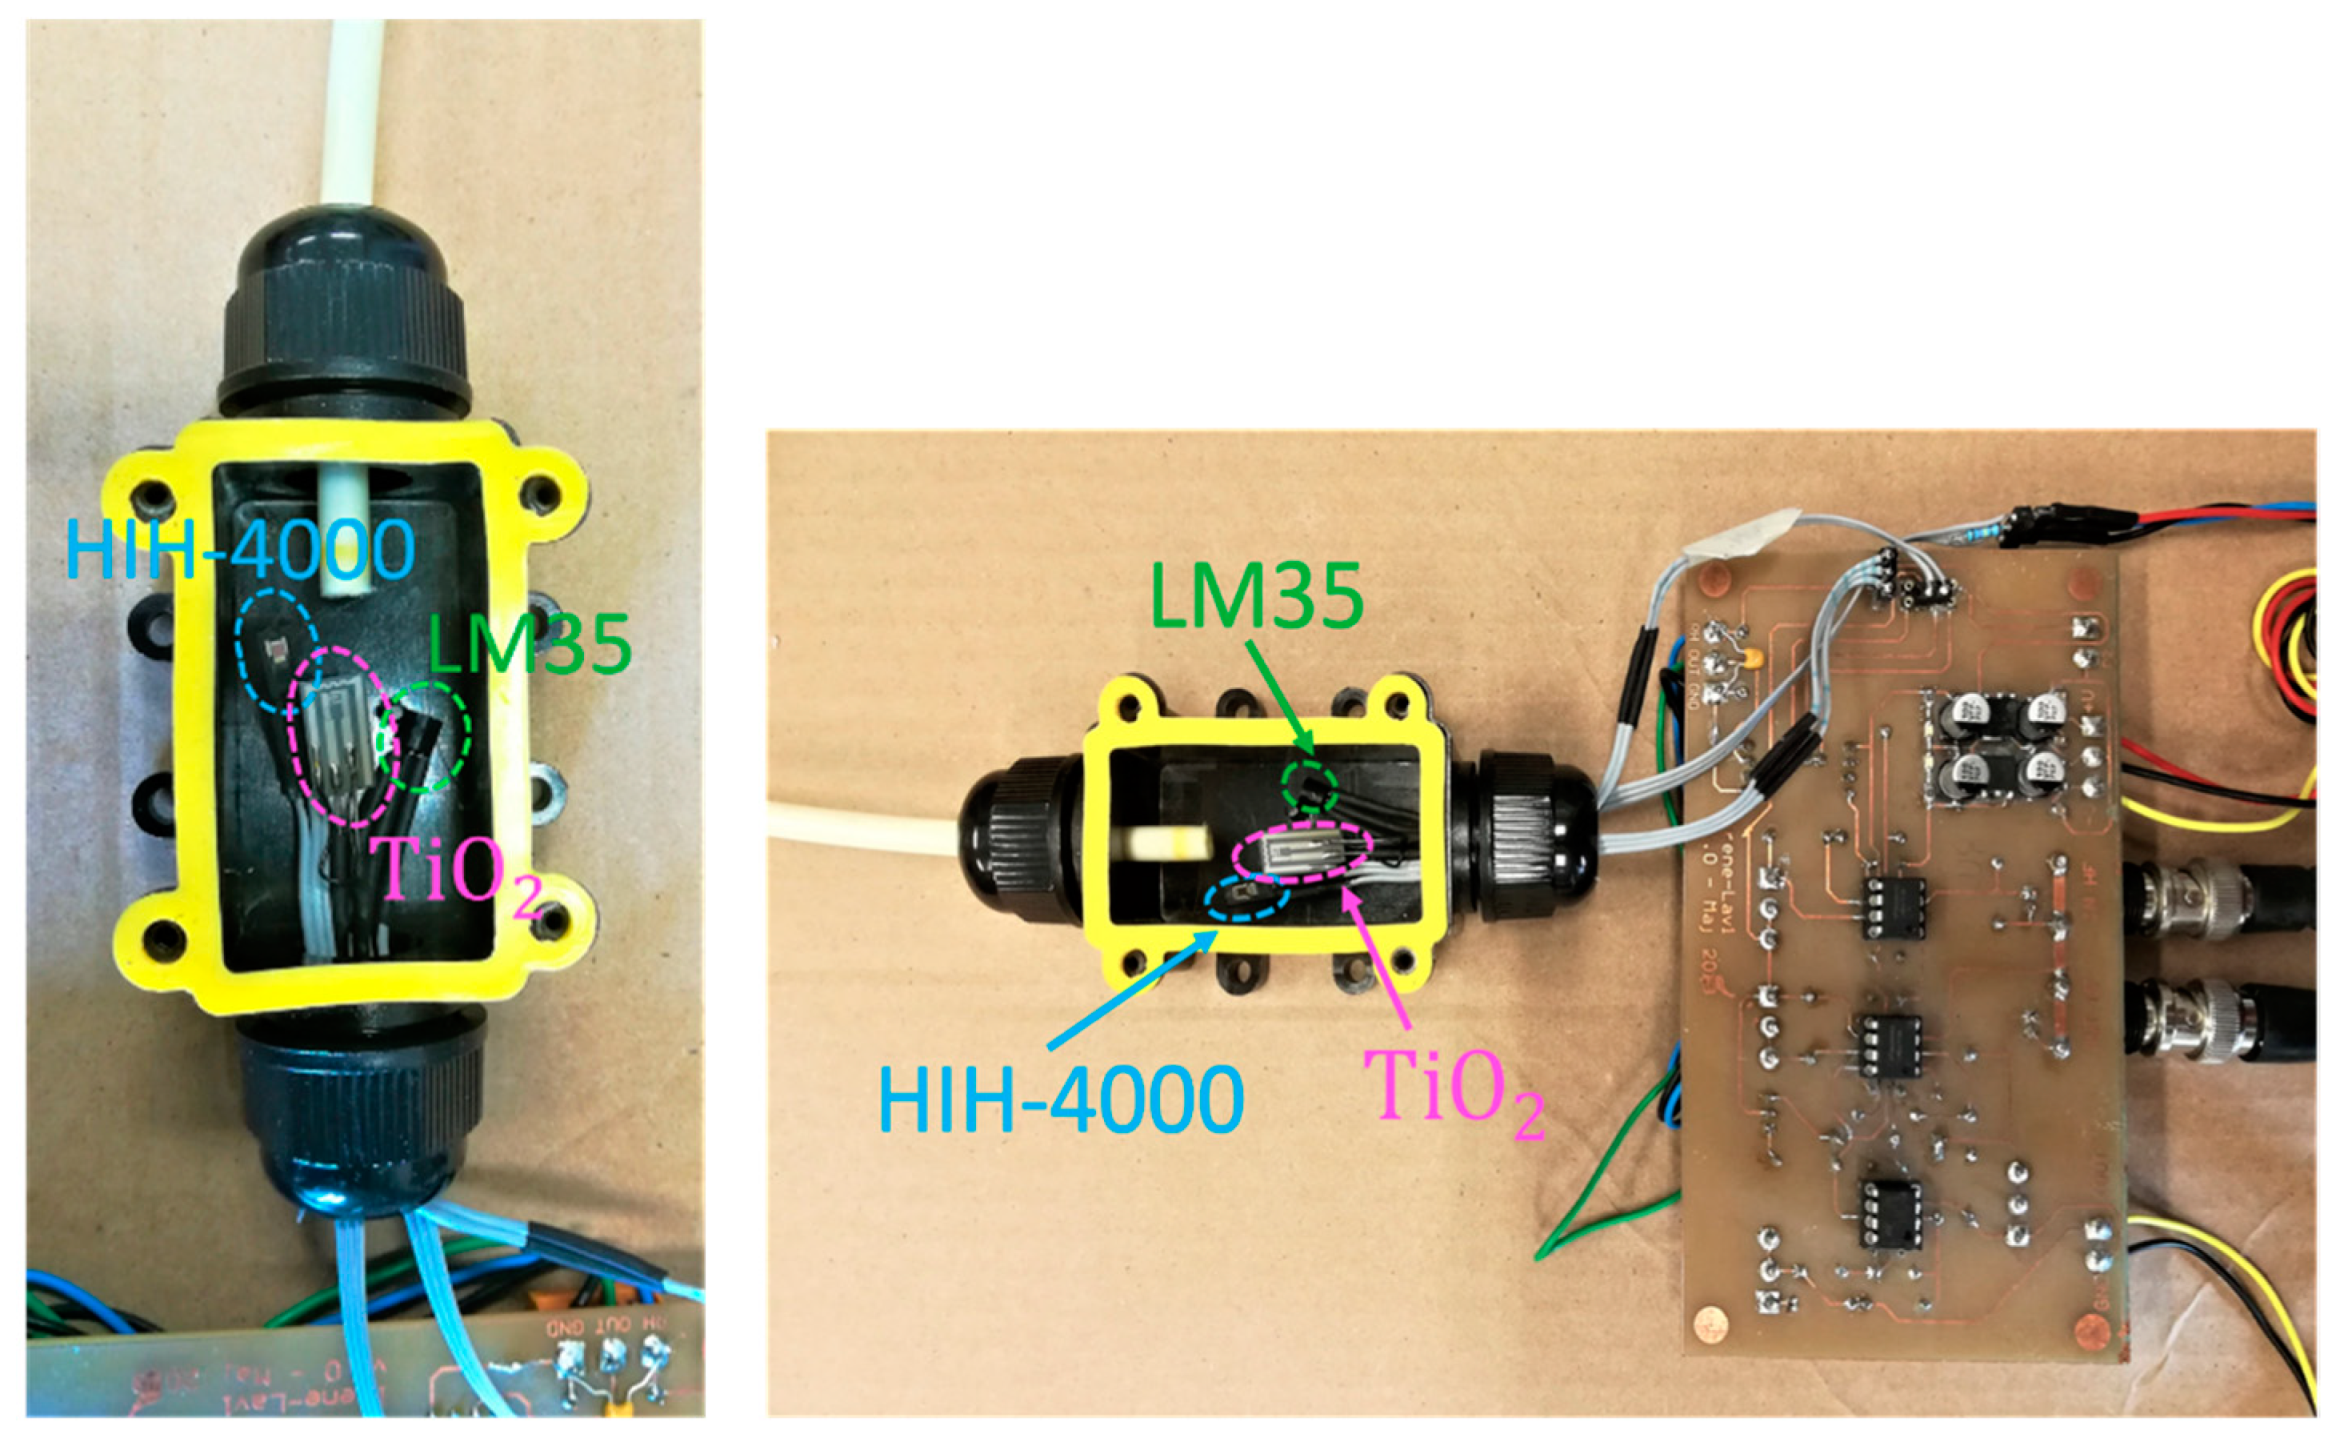
2.2. Sensing Device Preparation

The devices used to study the humidity-sensing properties of the nano-structured materials were realized starting from oxidized silicon substrates. On each substrate, 100-nm thick platinum interdigitated electrodes were realized exploiting thin-film sputtering in order to obtain the electrical contacts for the sensing films enabling their electrical characterization. The structure of these test devices and its equivalent circuit were described in detail by the authors in [23], and a schematic representation is reported in Figure 1. The sensing films were deposited across the platinum electrodes, in a way to create conductive paths, by drop-casting the TiO2 nanoparticles solution. In particular, fine-grained nanoparticle films were obtained by deposing a 2 μL drop of solution, corresponding to 20 μg of TiO2, using a micropipette and drying it at room temperature. Afterwards, the film surfaces were functionalized with subsequent depositions of 1 μL drops of Au nanoparticle colloid (corresponding to approximately 20 ng of Au), and the realized samples were dried in free air at room temperature for 24 h. Once dried, all the realized samples were heated at 200 °C for two hours in an oven.
In this paper we show the tests performed with three materials: pure TiO2 (named TiO2), TiO2 and 1% Au (TiO2Au1) and finally, TiO2 and 2% Au (TiO2Au2).

2.3. Instrumentation for Material Characterization

X-ray diffraction (XRD) on the bulk powder was performed using a Philips X’Pert PRO PW 3040/60 with X’Celerator PW 3015 detector, in the 2–80° 2θ range, CuKα radiation (λ = 1.54 Å), generator settings of 30 mA and 40 kV.
TEM analyses were performed by a JEOL 2010 microscope, working at 200 kV, with ultra-high resolution (UHR) pole piece and point-to-point resolution of 0.19 nm. The microscope is equipped with a semi-STEM control and an ultra-thin window energy dispersive spectrometer (EDS ISIS Oxford). Data were recorded by an Olympus Tengra CCD camera. The sample was prepared by deposition on mesh Cu grids equipped with a supporting lacey carbon film.

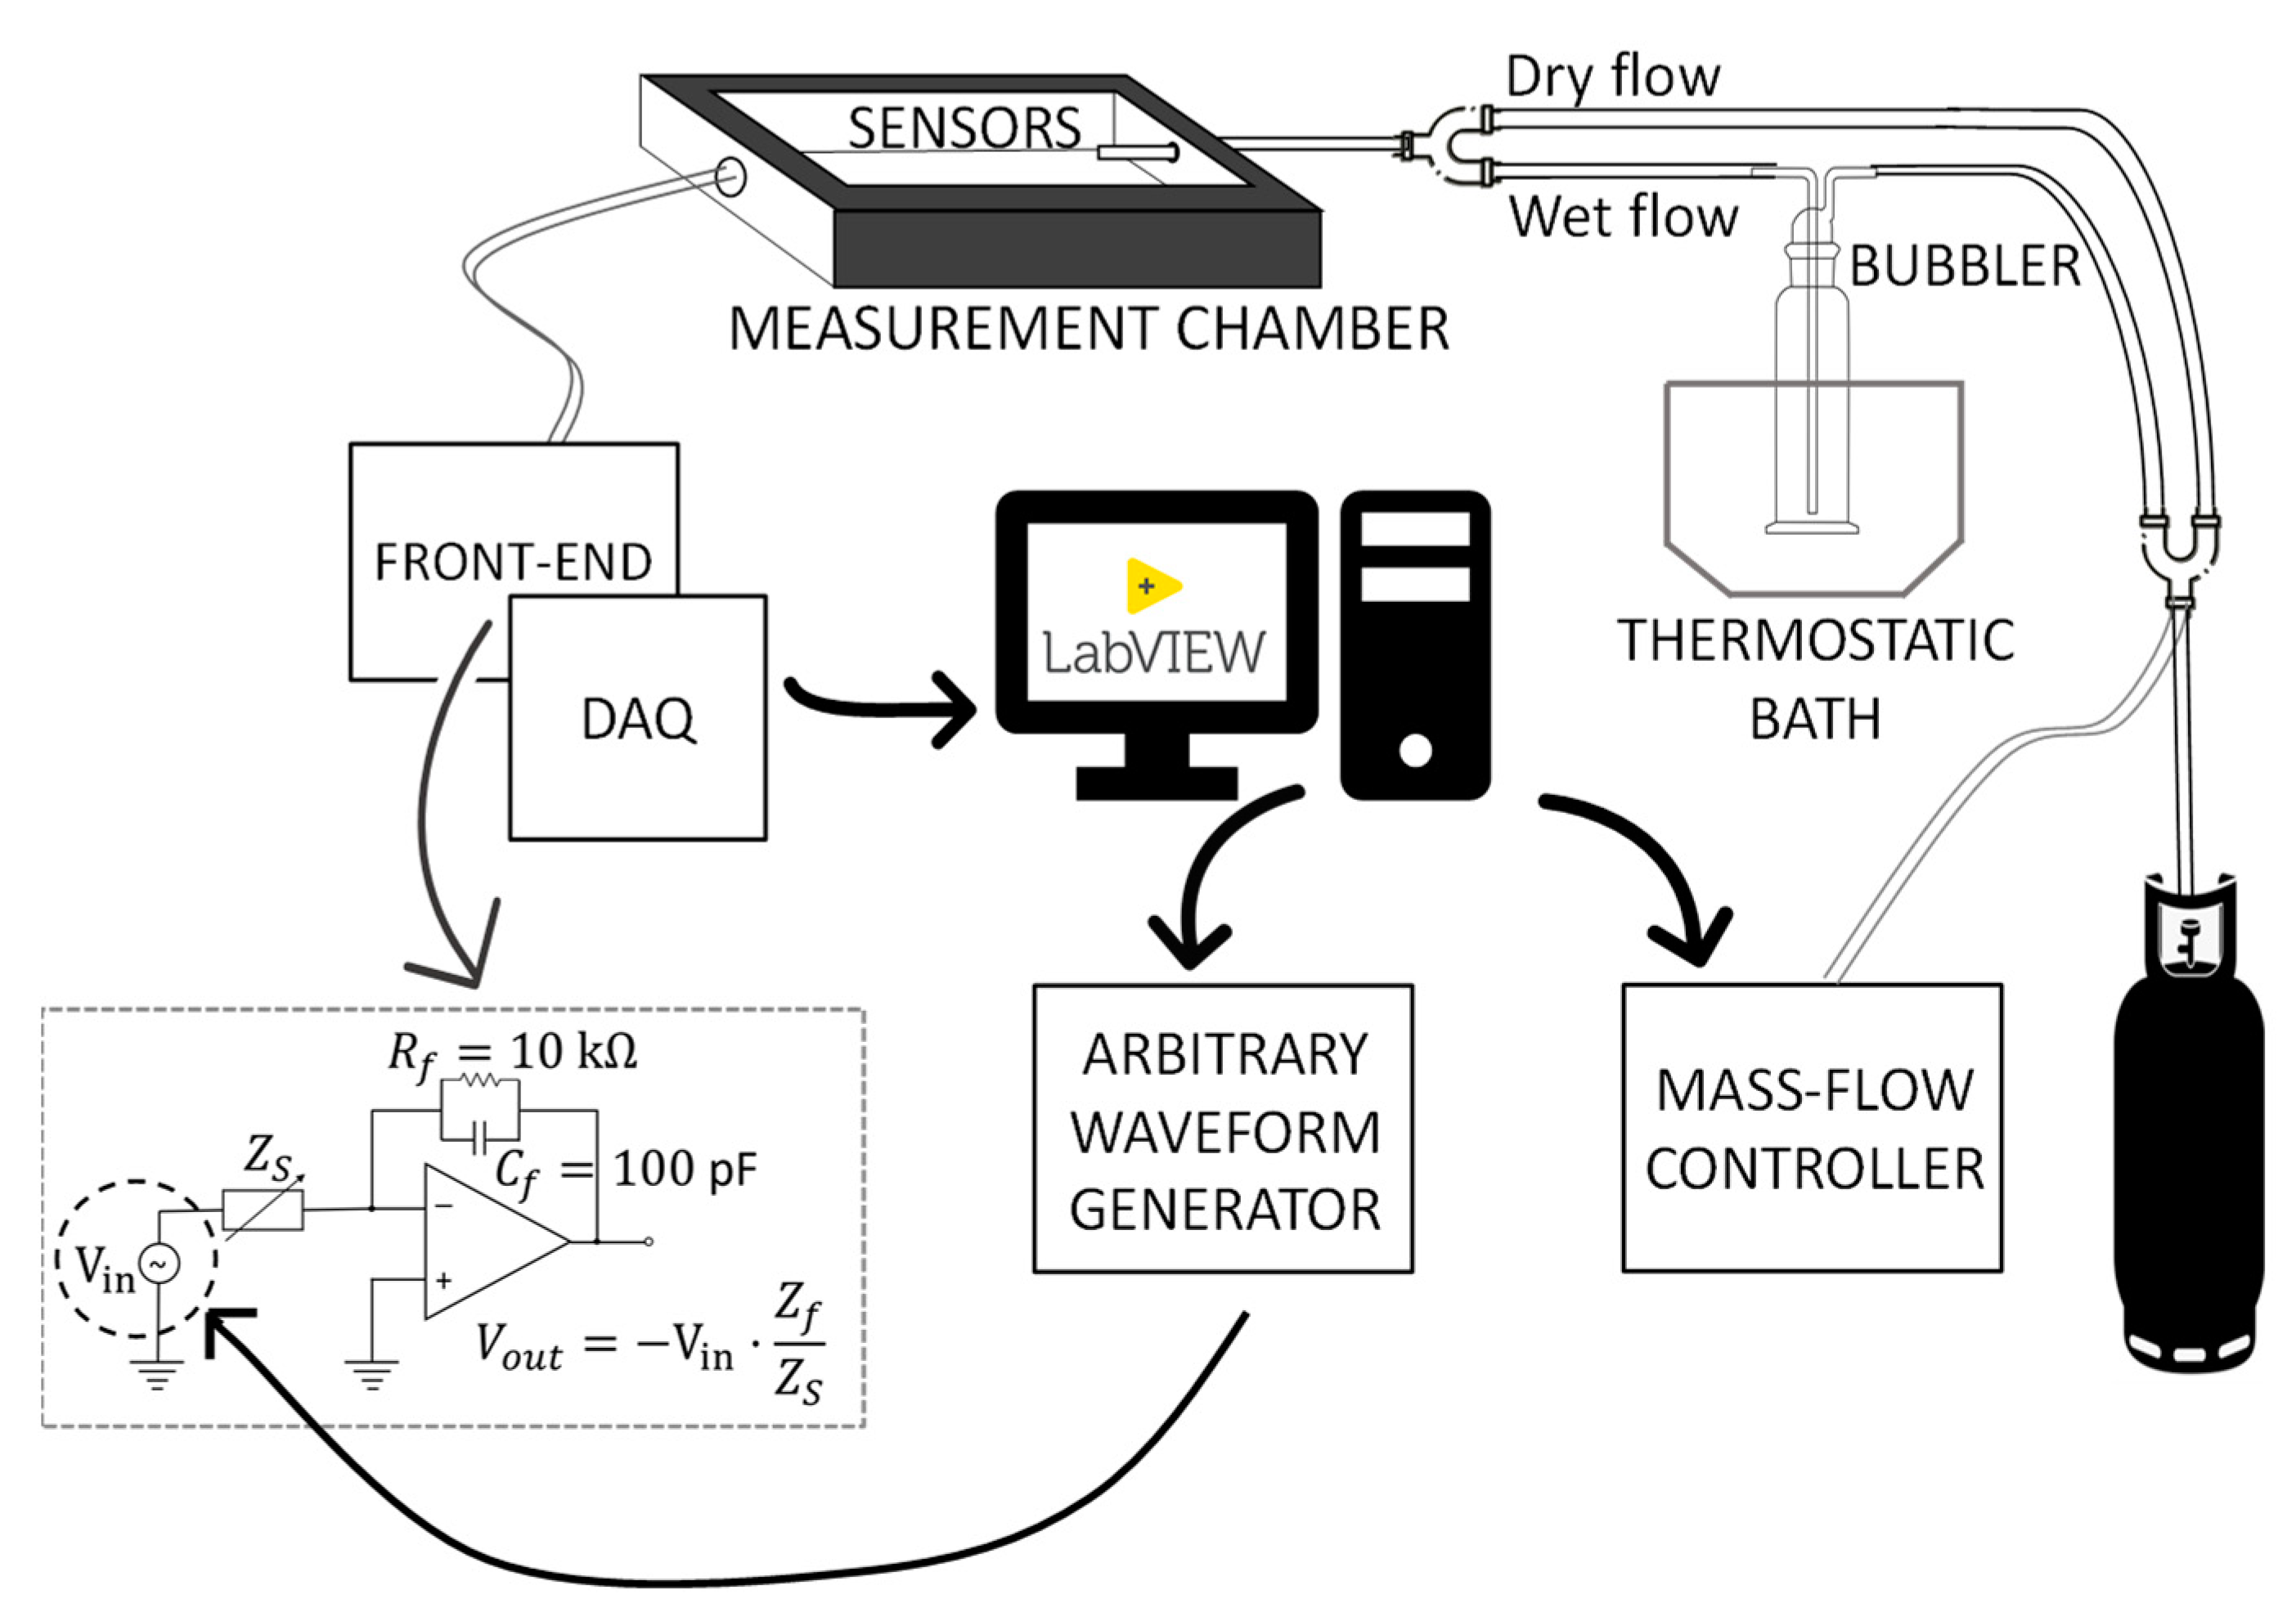
2.4. Setup for the Humidity-Sensing Characterization

The humidity-sensing characterization of the TiO2 and TiO2Au films was performed by using the electrochemical impedance spectroscopy (EIS) in steady state conditions and measuring the magnitude of the impedance, under AC excitation at a fixed frequency, in dynamic conditions. In both cases it was possible to exploit the characterization system described in other works of the authors [11,23,24], which allows to set a steady state relative humidity level in the measurement chamber or to vary it in a controlled way while measuring the film impedance. Two different kinds of measurements are presented and discussed in detail:
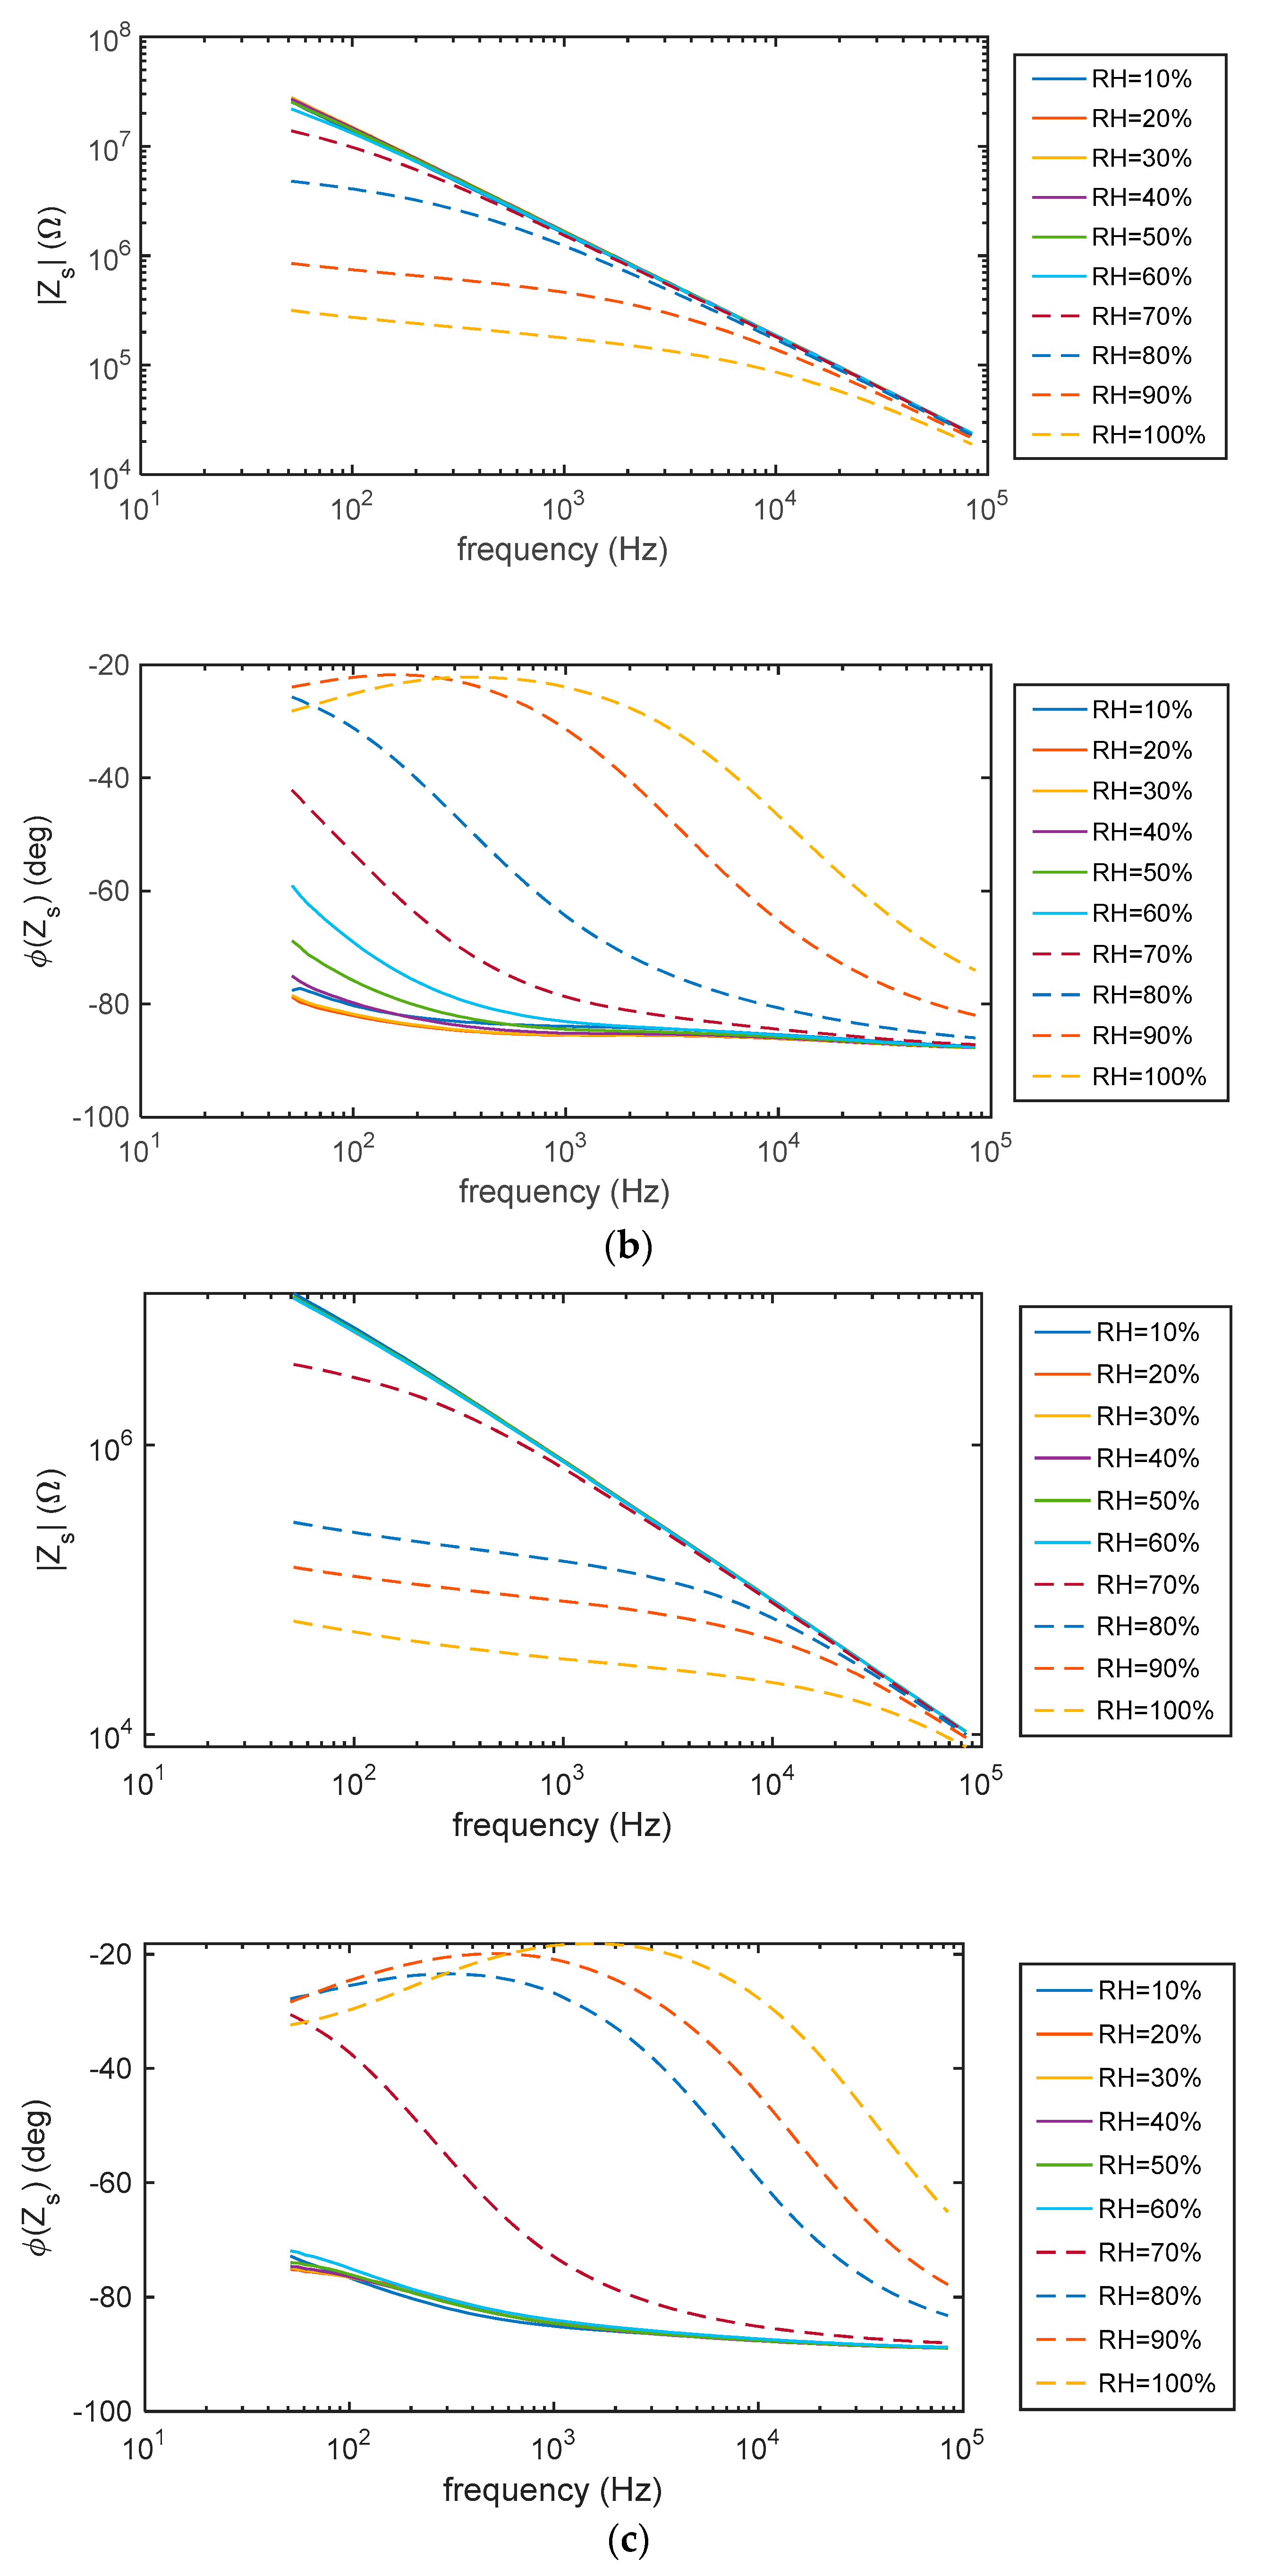
  • The impedance spectra of the tested sensing devices in the frequency range 50 Hz–80 kHz, measured at constant RH in the range 0–100%.
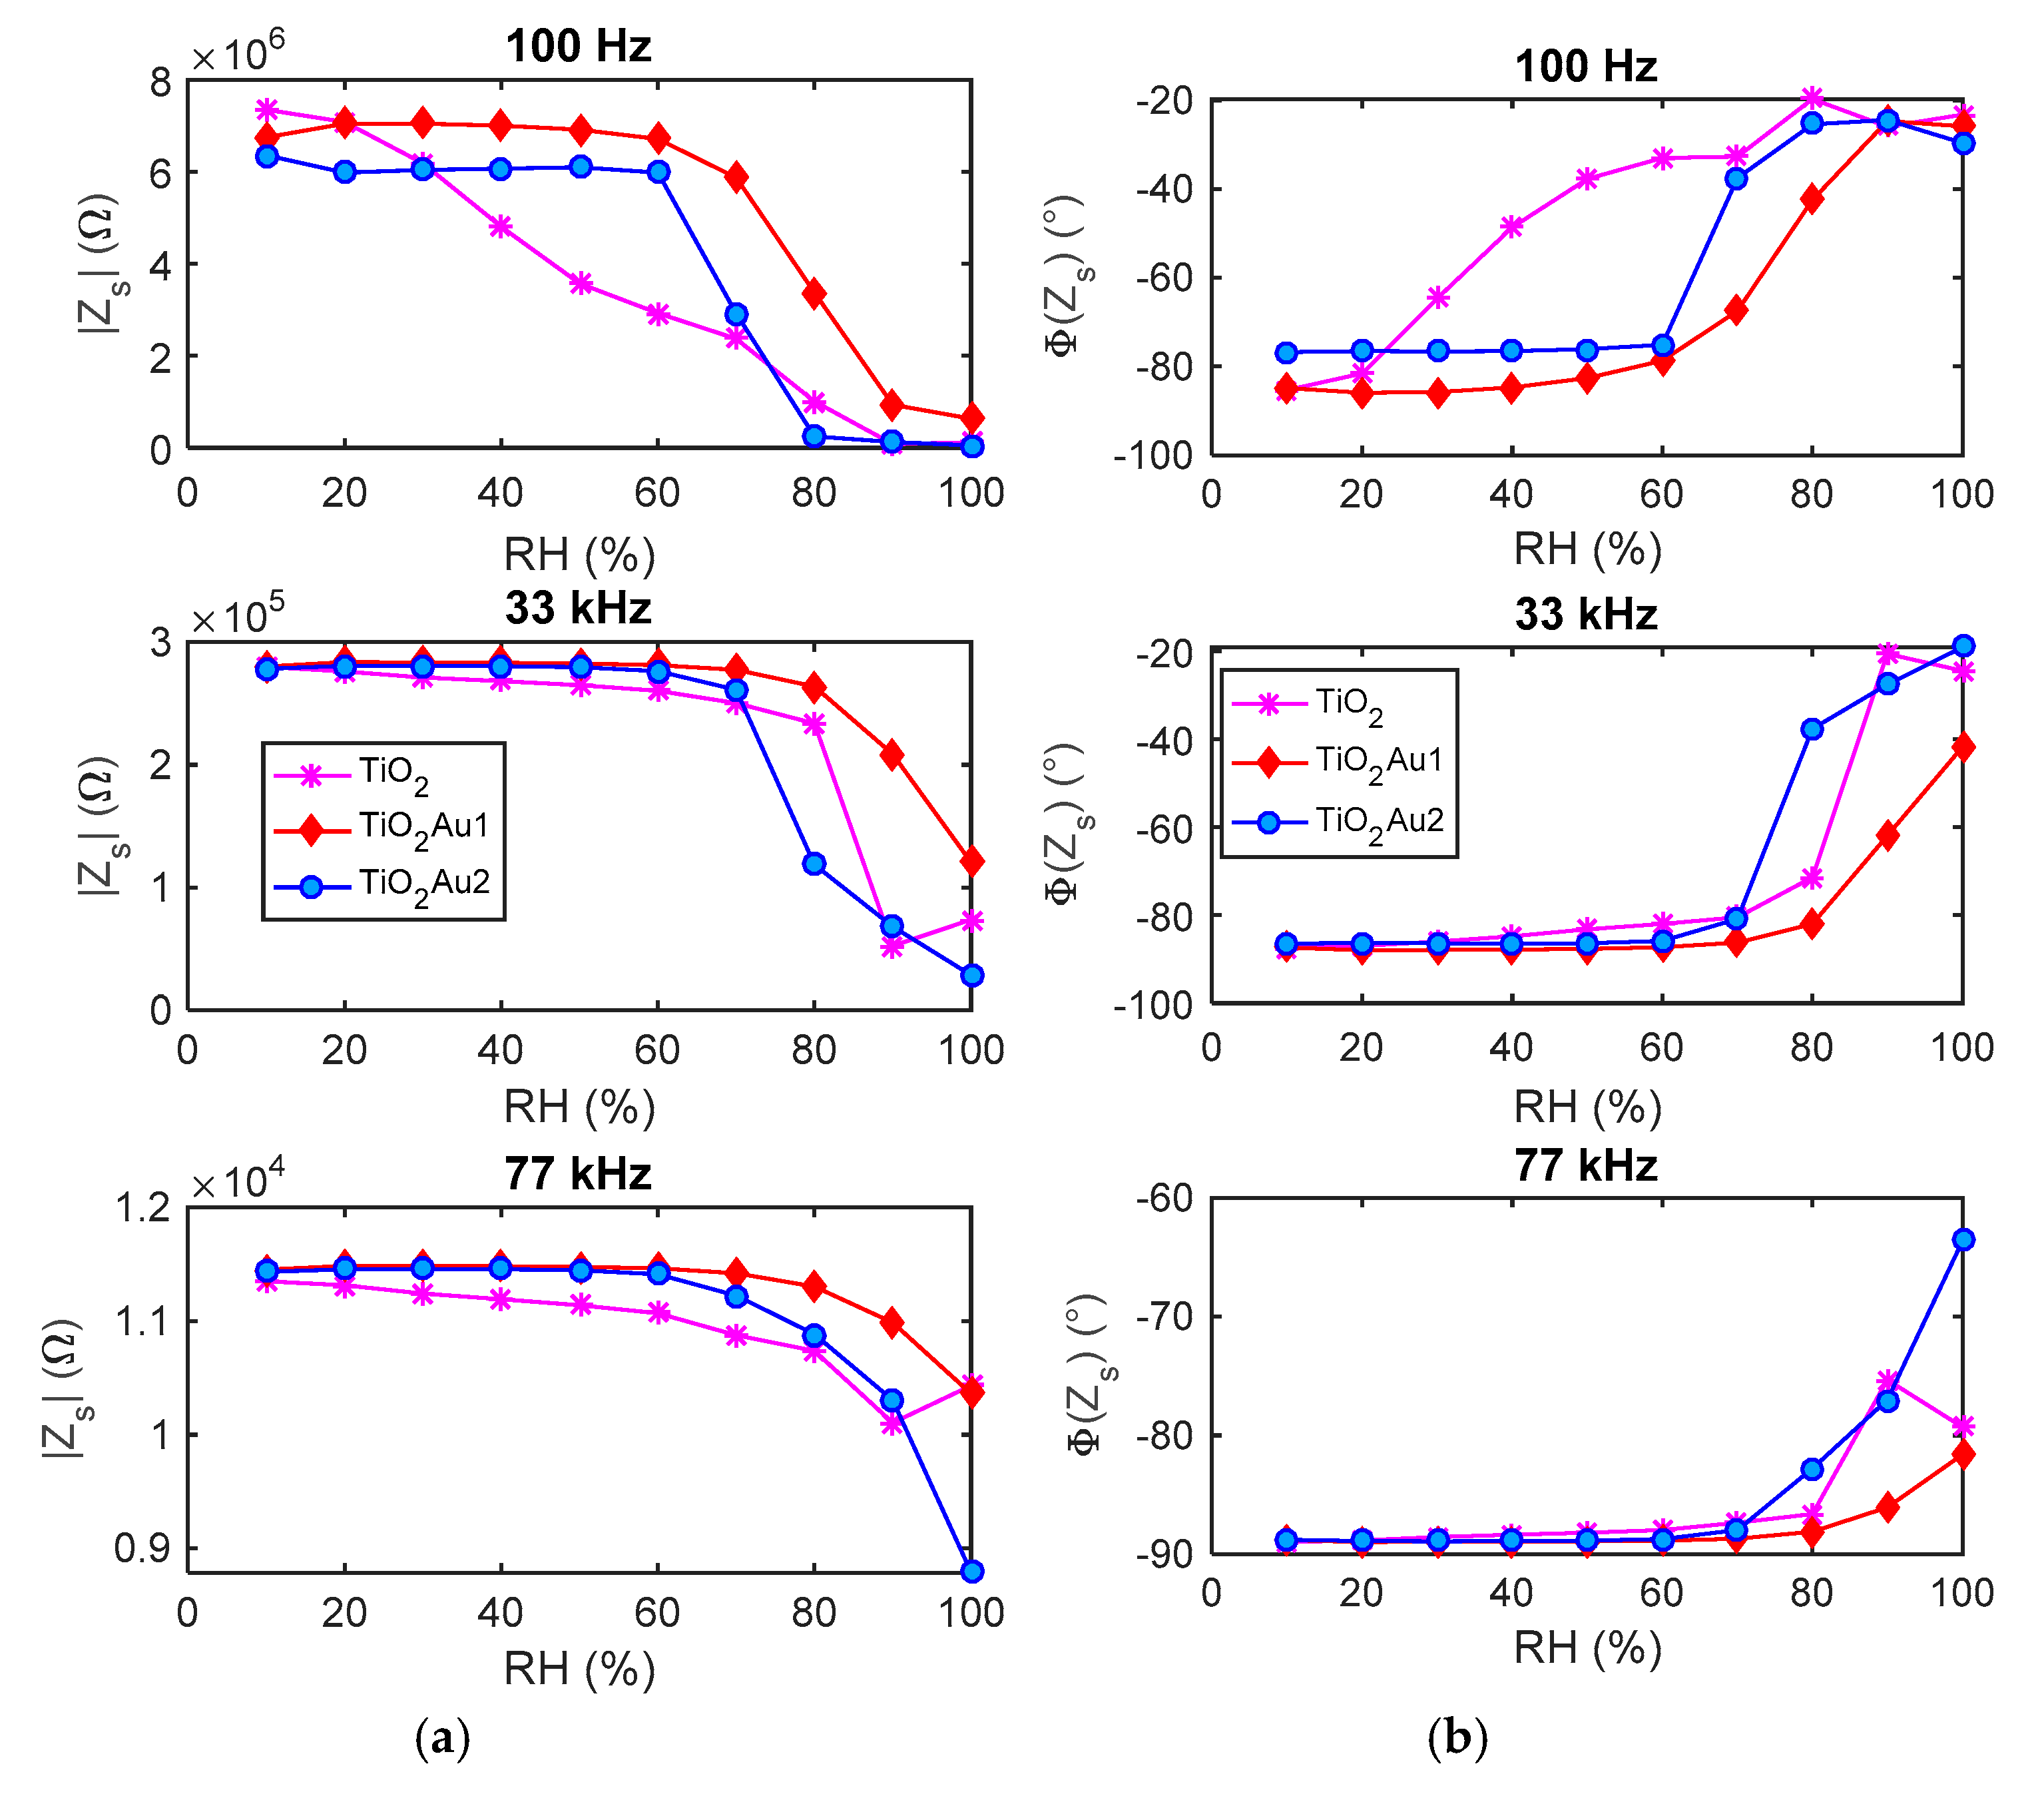
  • The admittance/impedance magnitude evaluated at fixed frequencies (most of these measurements are performed at fin = 100 Hz, i.e., at low frequency, to highlight the conduction mechanisms contribution) in the presence of smooth or abrupt RH variations.
The characterization system used for the measurements is schematically shown in Figure 2. The system is capable to convey a constant air flow at controlled relative humidity in a sealed IP68 plastic measurement chamber with internal dimensions 5 × 3 × 3 cm3, and with two apertures ensuring the correct flow inlet and outlet, as shown in Figure 3. During the measurements, two PC-controlled mass flowmeters (BronkHorst F-201C) set the flow to the constant value of 200 mL/min. The desired RH level is adjusted by mixing in known percentages a dry air flow and a saturated (100% RH) air flow, obtained by passing the dry flow through a bubbler containing ultrapure water. The measurement chamber, the wet and the dry flows, and the bubbler are maintained in isothermal condition at environmental temperature, and all the measurements are performed at a temperature T between 24 °C and 25 °C. The impedance measurements were performed using an “ad hoc” designed front-end circuit. The circuit topology is shown in the inset of Figure 2: the sensing film impedance, Z s , is recovered from the resulting output voltage V o u t as a function of the sine wave input signal, V i n , which is issued by a remotely controlled arbitrary waveform generator, and the feedback impedance Z f = R f ( 1 + j ω R f C f )   according to the relationship Z s = Z f V o u t   V i n .
An ad hoc developed Lab-VIEW virtual instrument (VI) manages the overall measurement chain, including the mass flowmeter bench for the humidity setting, the arbitrary waveform generator (AG33220A), which drives the sensing layers during the impedance measurements, and the data acquisition real-time process, performed exploiting the National Instrument acquisition board NI PCI-6014 (maximum sampling rate of 200 kS/s). In order to check the actual RH and temperature in the measurement chamber, a commercial humidity sensor HIH-4000 by Honeywell (±3.5% RH of accuracy) and a temperature sensor LM35 by Texas Instrument (±0.5 °C of accuracy) were housed in the chamber together with the functionalized substrate and automatically acquired in real-time.

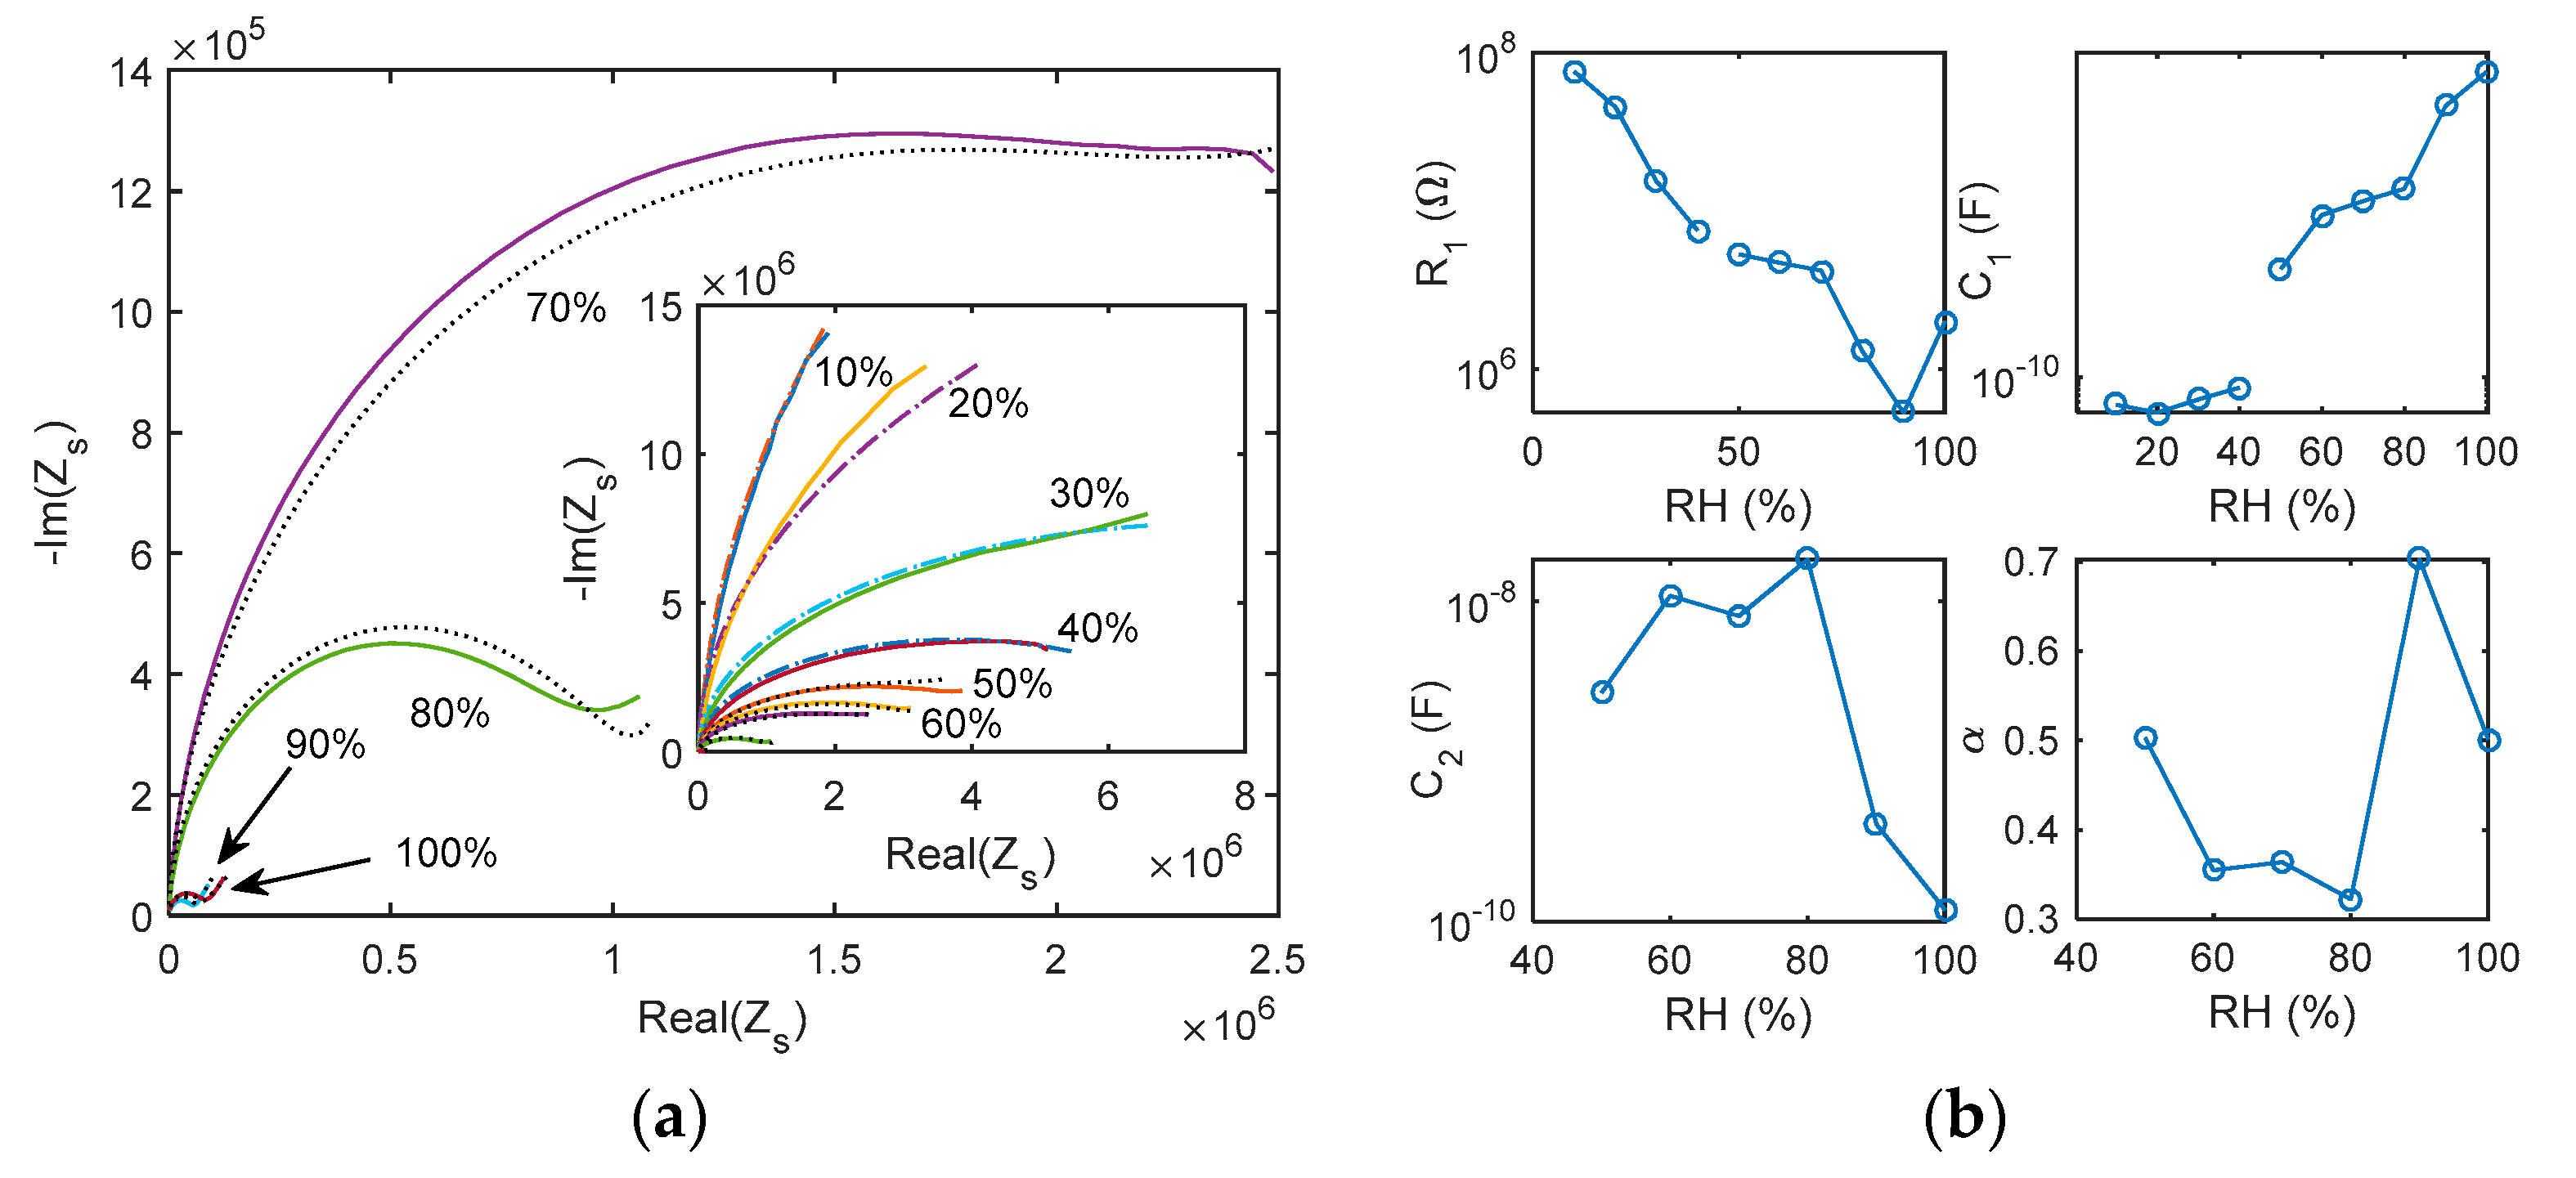
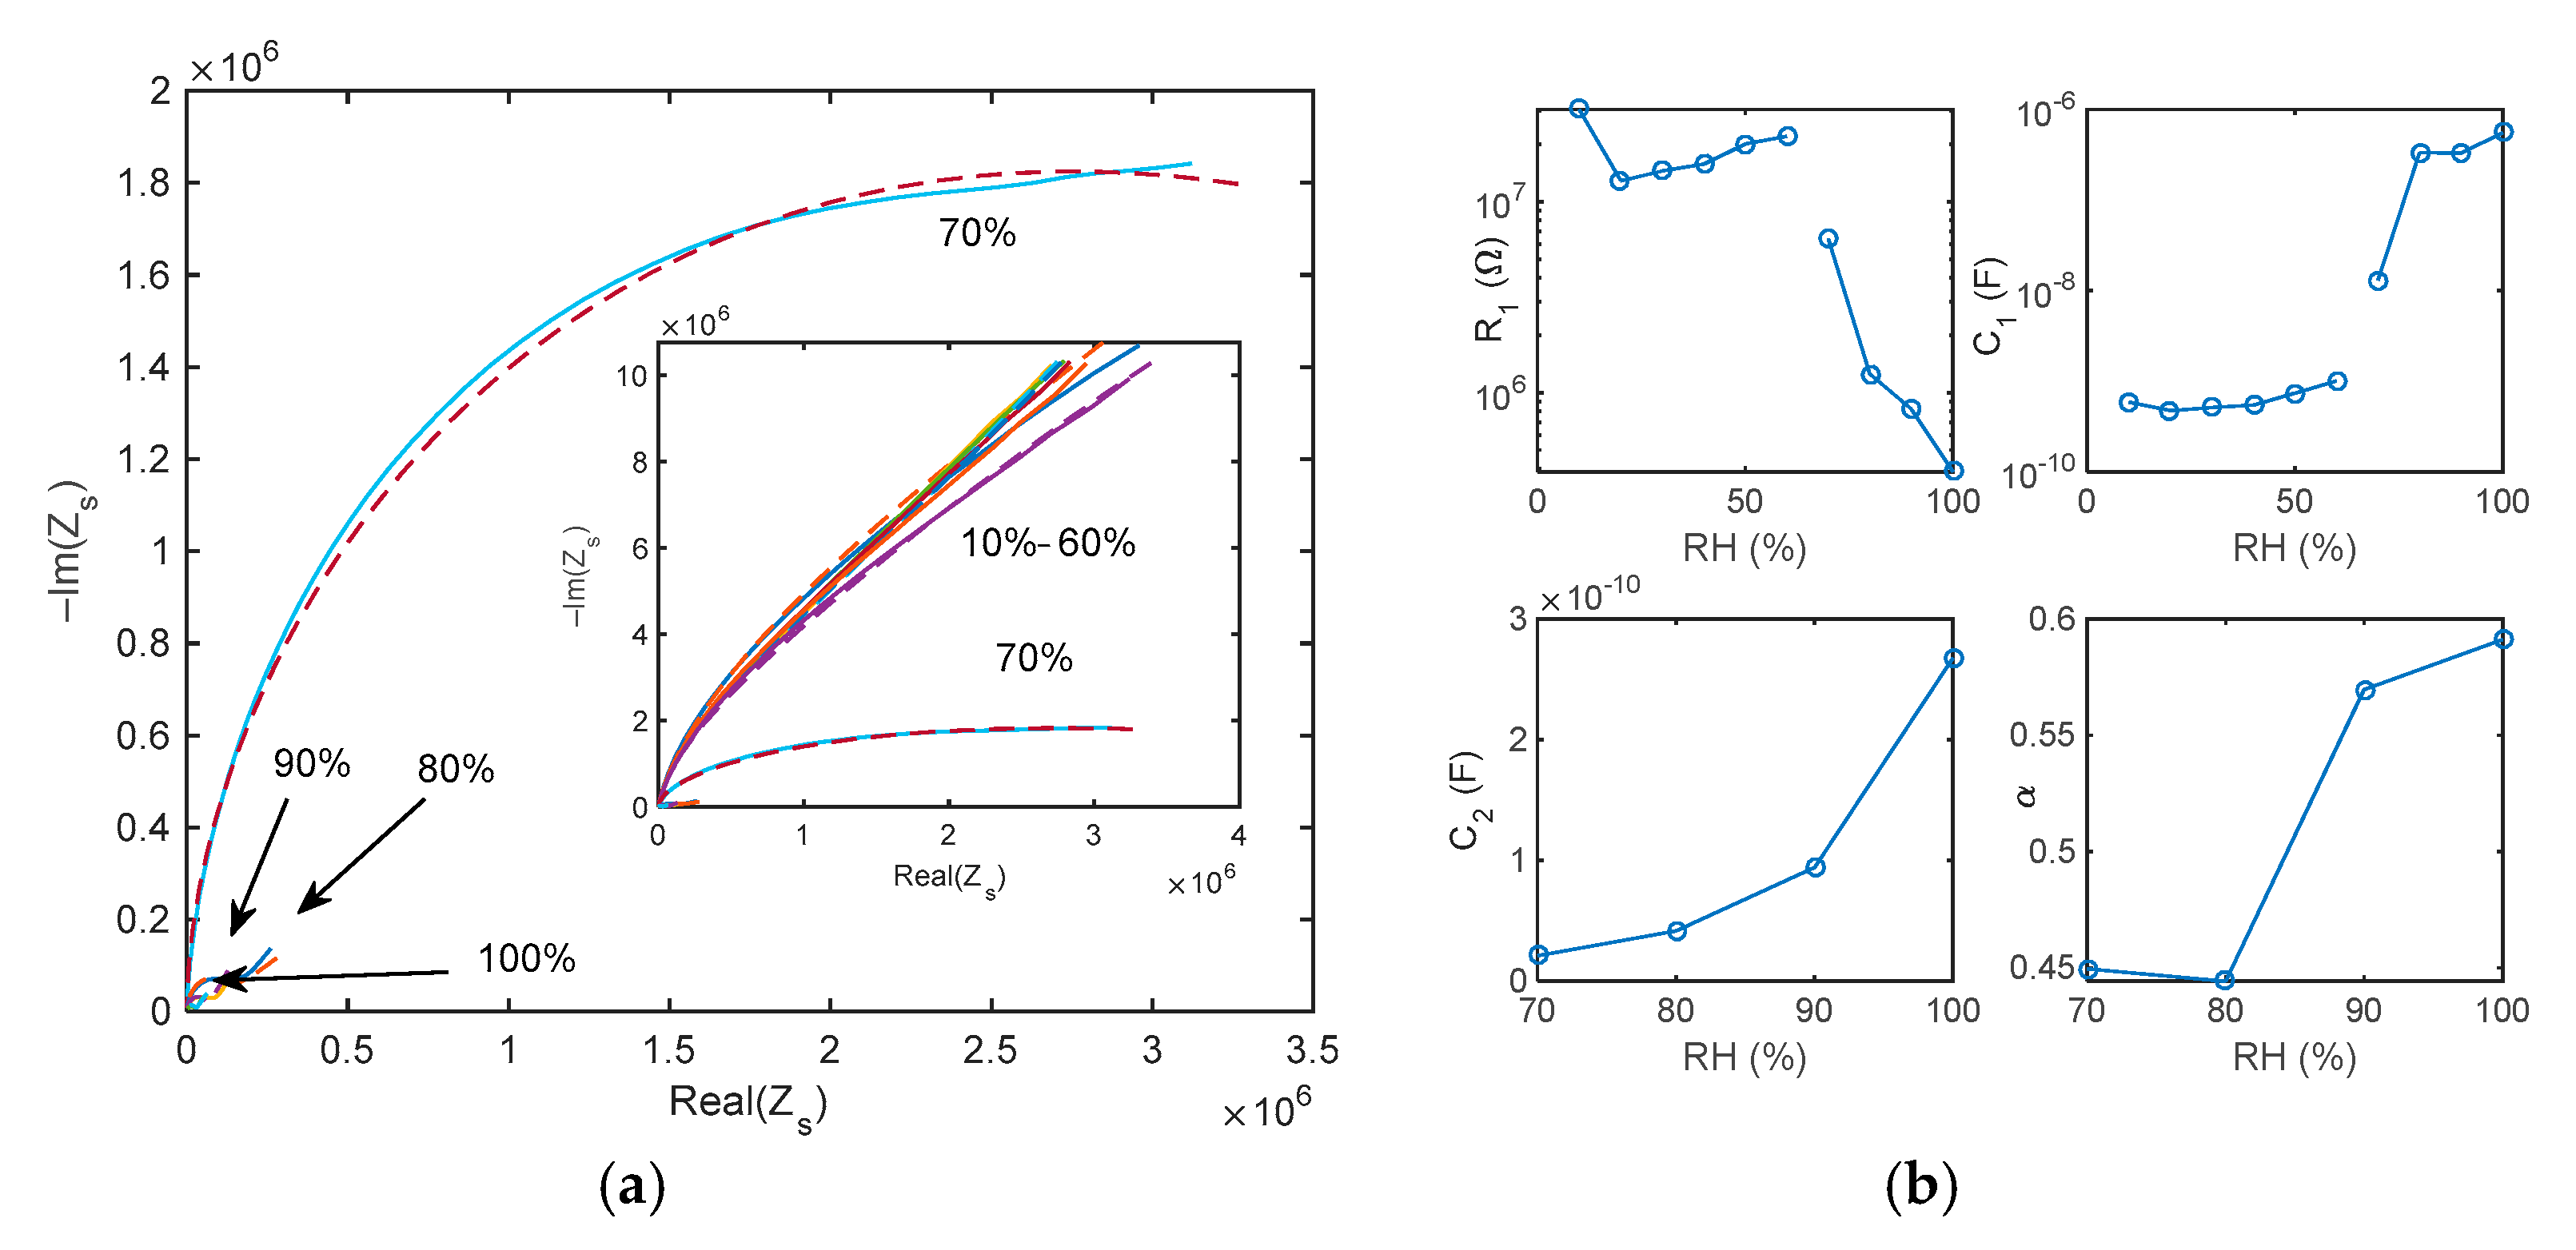
2.4.1. Impedance Spectra at Constant RH

The impedance of the TiO2-based active substrate was analyzed using electrochemical impedance spectroscopy (EIS) at constant RH. To this aim, the complex impedance of the circuit Z s was measured spanning the input signal from 50 Hz to 80 kHz and maintaining the flow in the chamber at constant and controlled RH percentage, gradually varying the humidity. This type of analysis allowed to study the sensor impedance in terms of module, phase, or real and imaginary part, and to correlate its electrical behavior to the different processes of chemisorption and physisorption occurring as the humidity varies. Furthermore, the implementation of a fitting algorithm on the impedance spectra was aimed at linking the electrical behavior of the sensor at the different humidity levels with the variation of its theorized equivalent electrical model.

2.4.2. Admittance/Impedance Magnitude at fin = 100 Hz in Presence of RH Variations

The transient response of the sensing film to variable humidity was studied by measuring the admittance magnitude | Y s | = | 1 Z s | with the input signal frequency set to f i n = 100 Hz. The humidity of the injected flow, independently measured by the commercial humidity sensor, was:
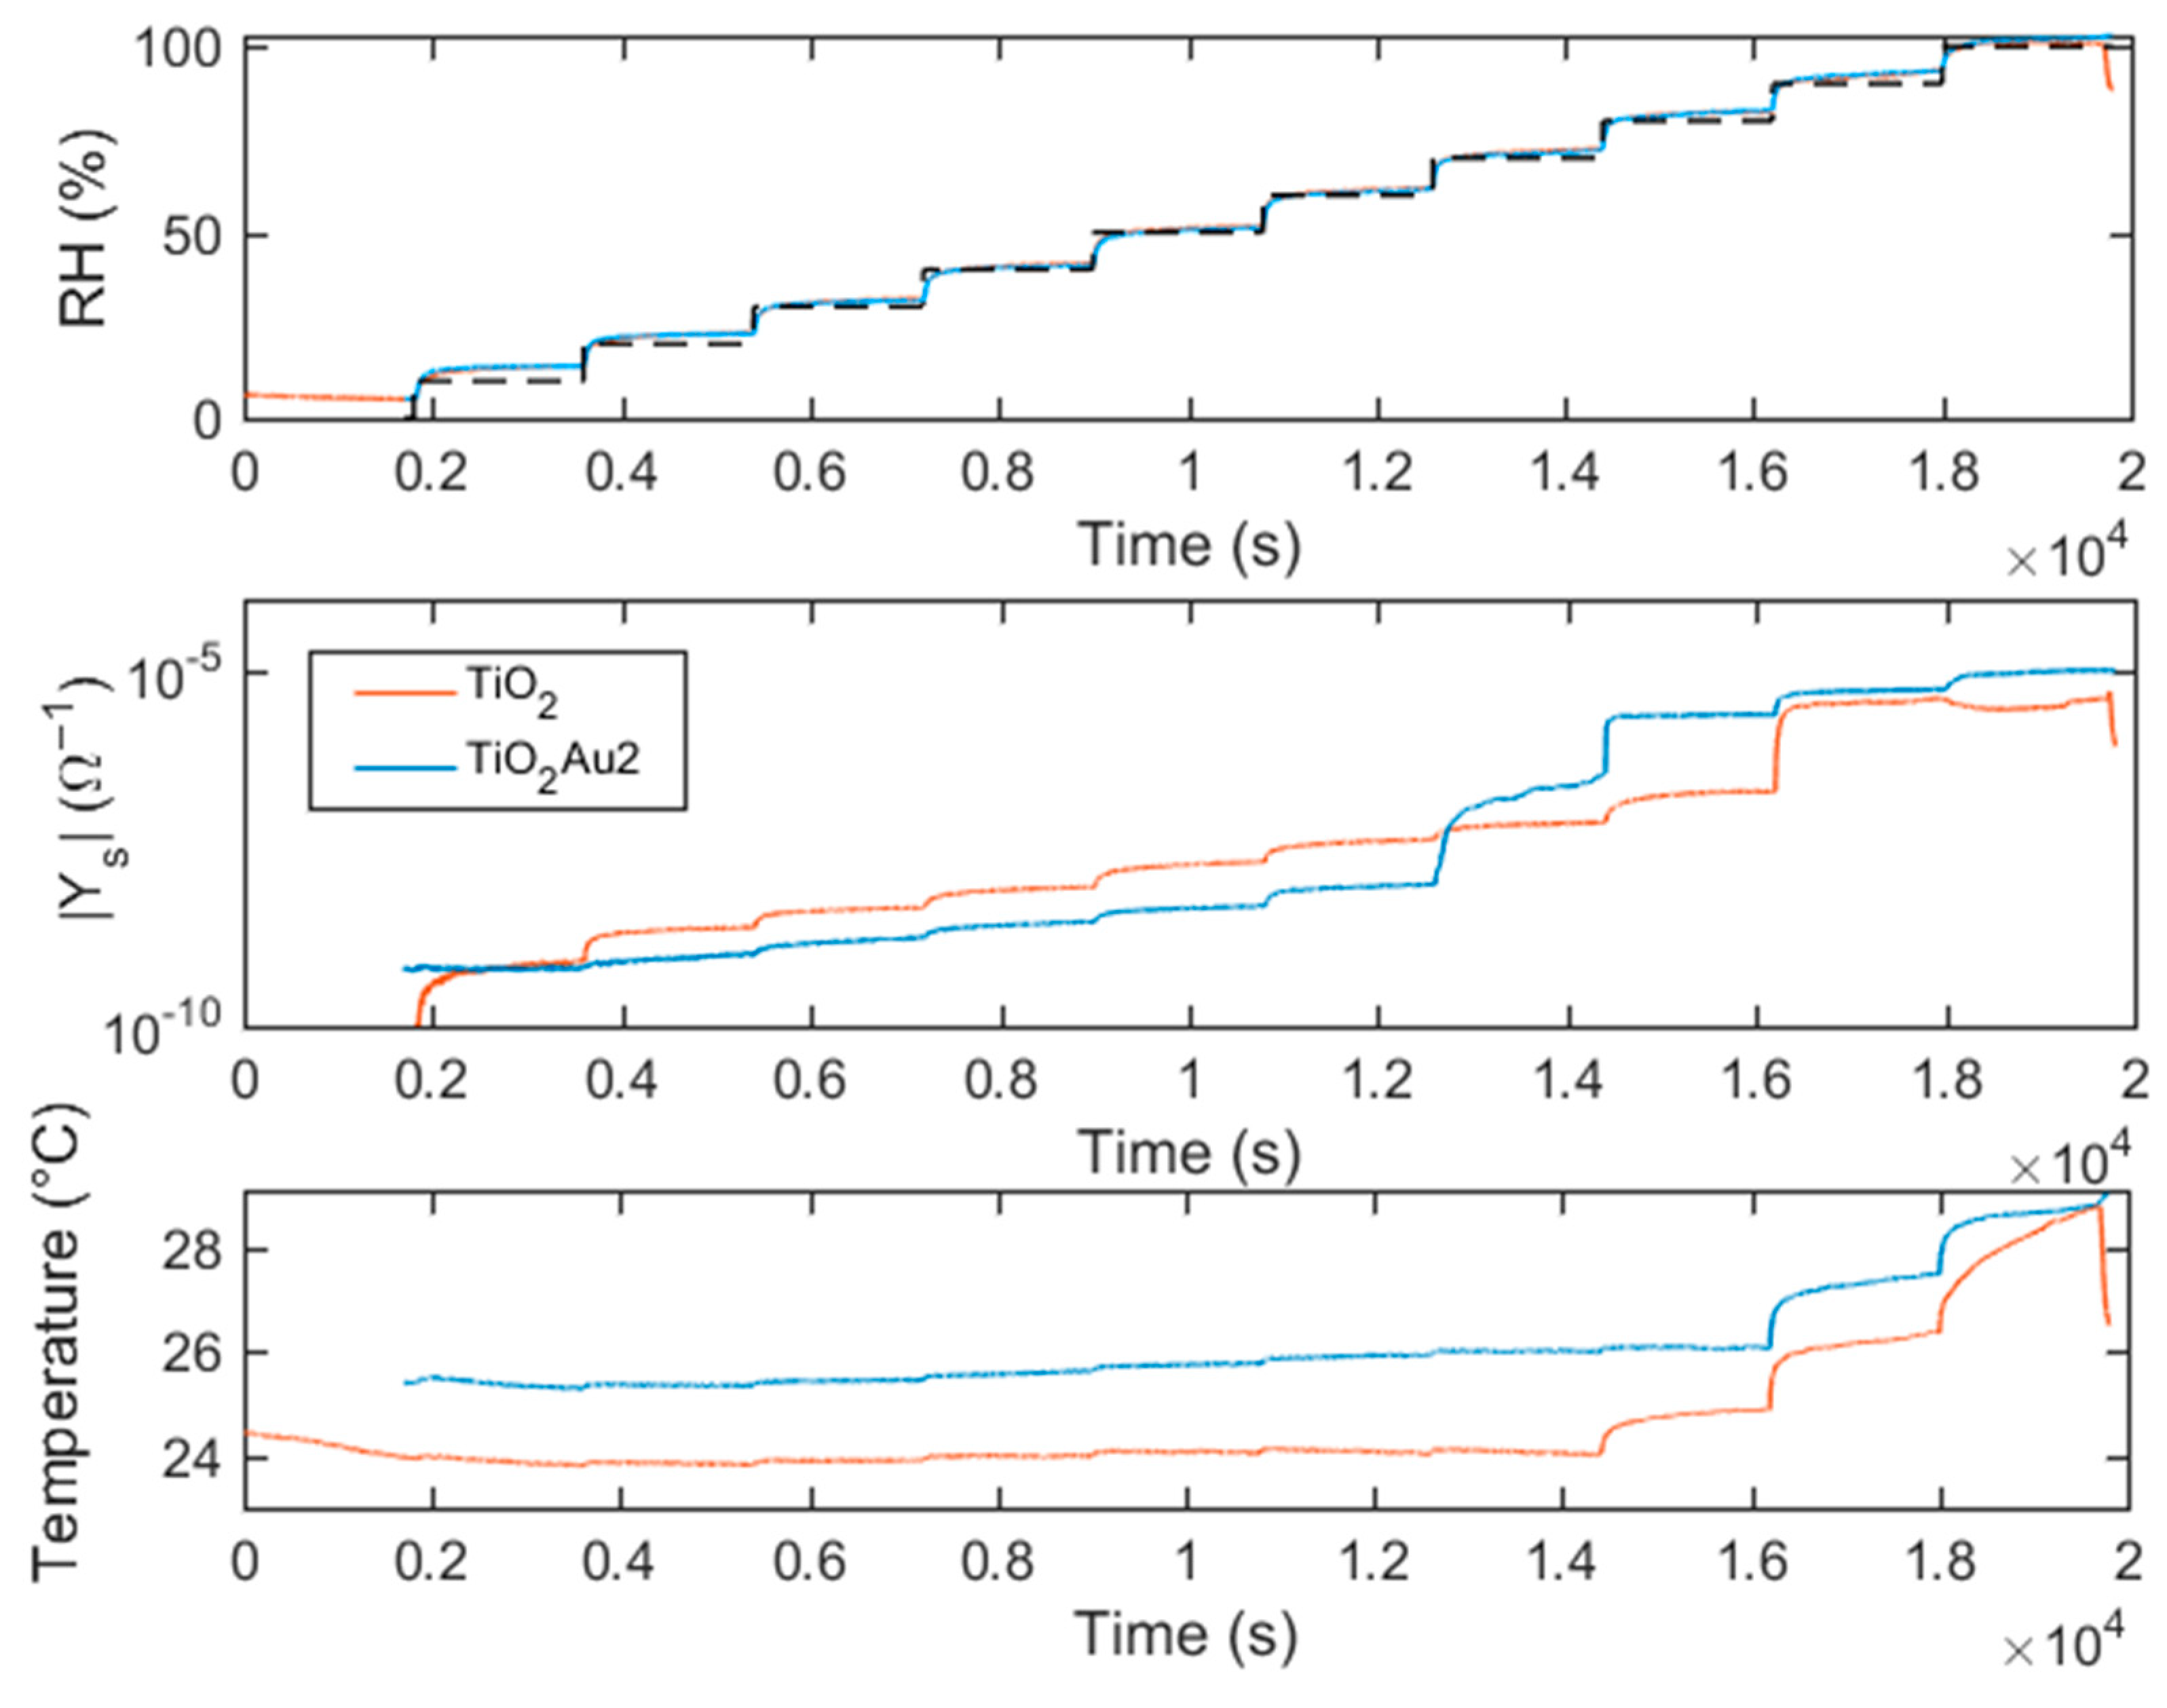
  • Slowly increased from RH = 10% to RH = 100% and decreased from RH = 100% to RH = 10%. The monitoring of the sensing material real-time response gives information about the different water adsorption and desorption phenomena and about their effect on the electronic conduction mechanisms of the sensing film as a function of the RH.
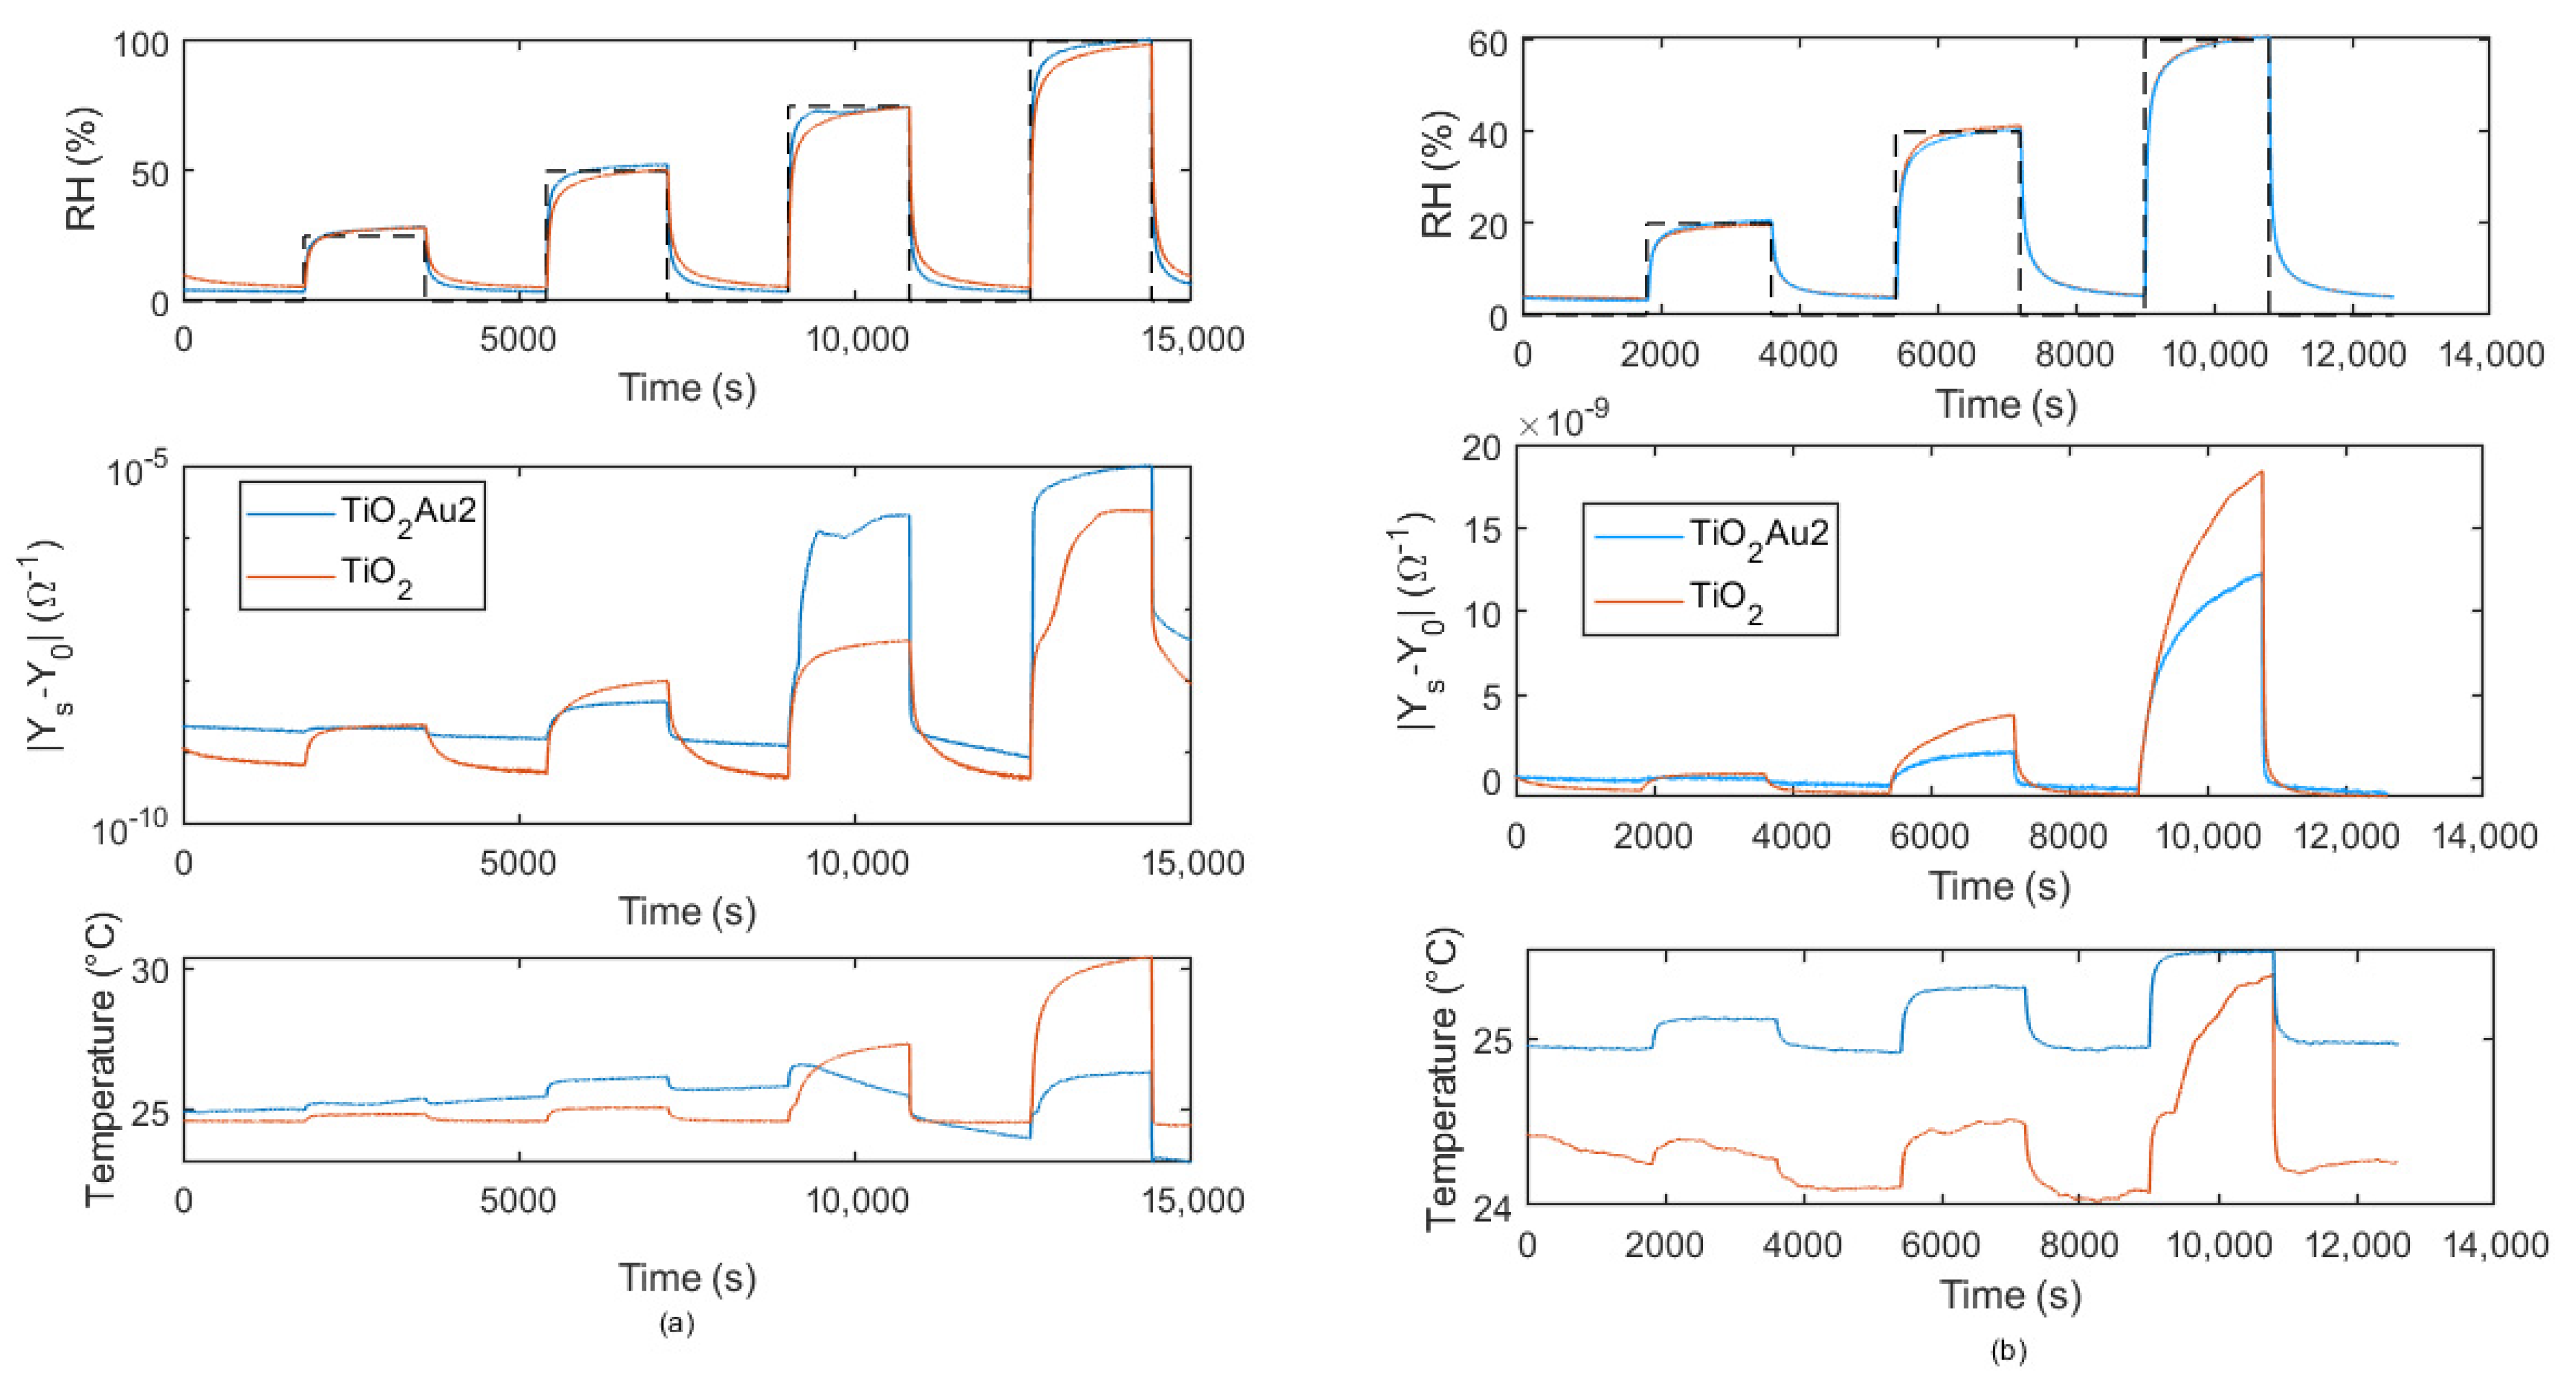
  • Changed in a pulsed way. Increasing/decreasing RH pulses, whether or not followed by recovery phases, were applied. Despite the sudden steps in humidity, the small chamber volume and the fast flow velocity ensured that the transient response of the chamber ran out quickly and did not affect the sensor transient response.
Owing to these experiments, it was possible to analyze the effect of the condensation mechanism in the micropores and voids and its link with the more or less wide variations in the humidity levels.

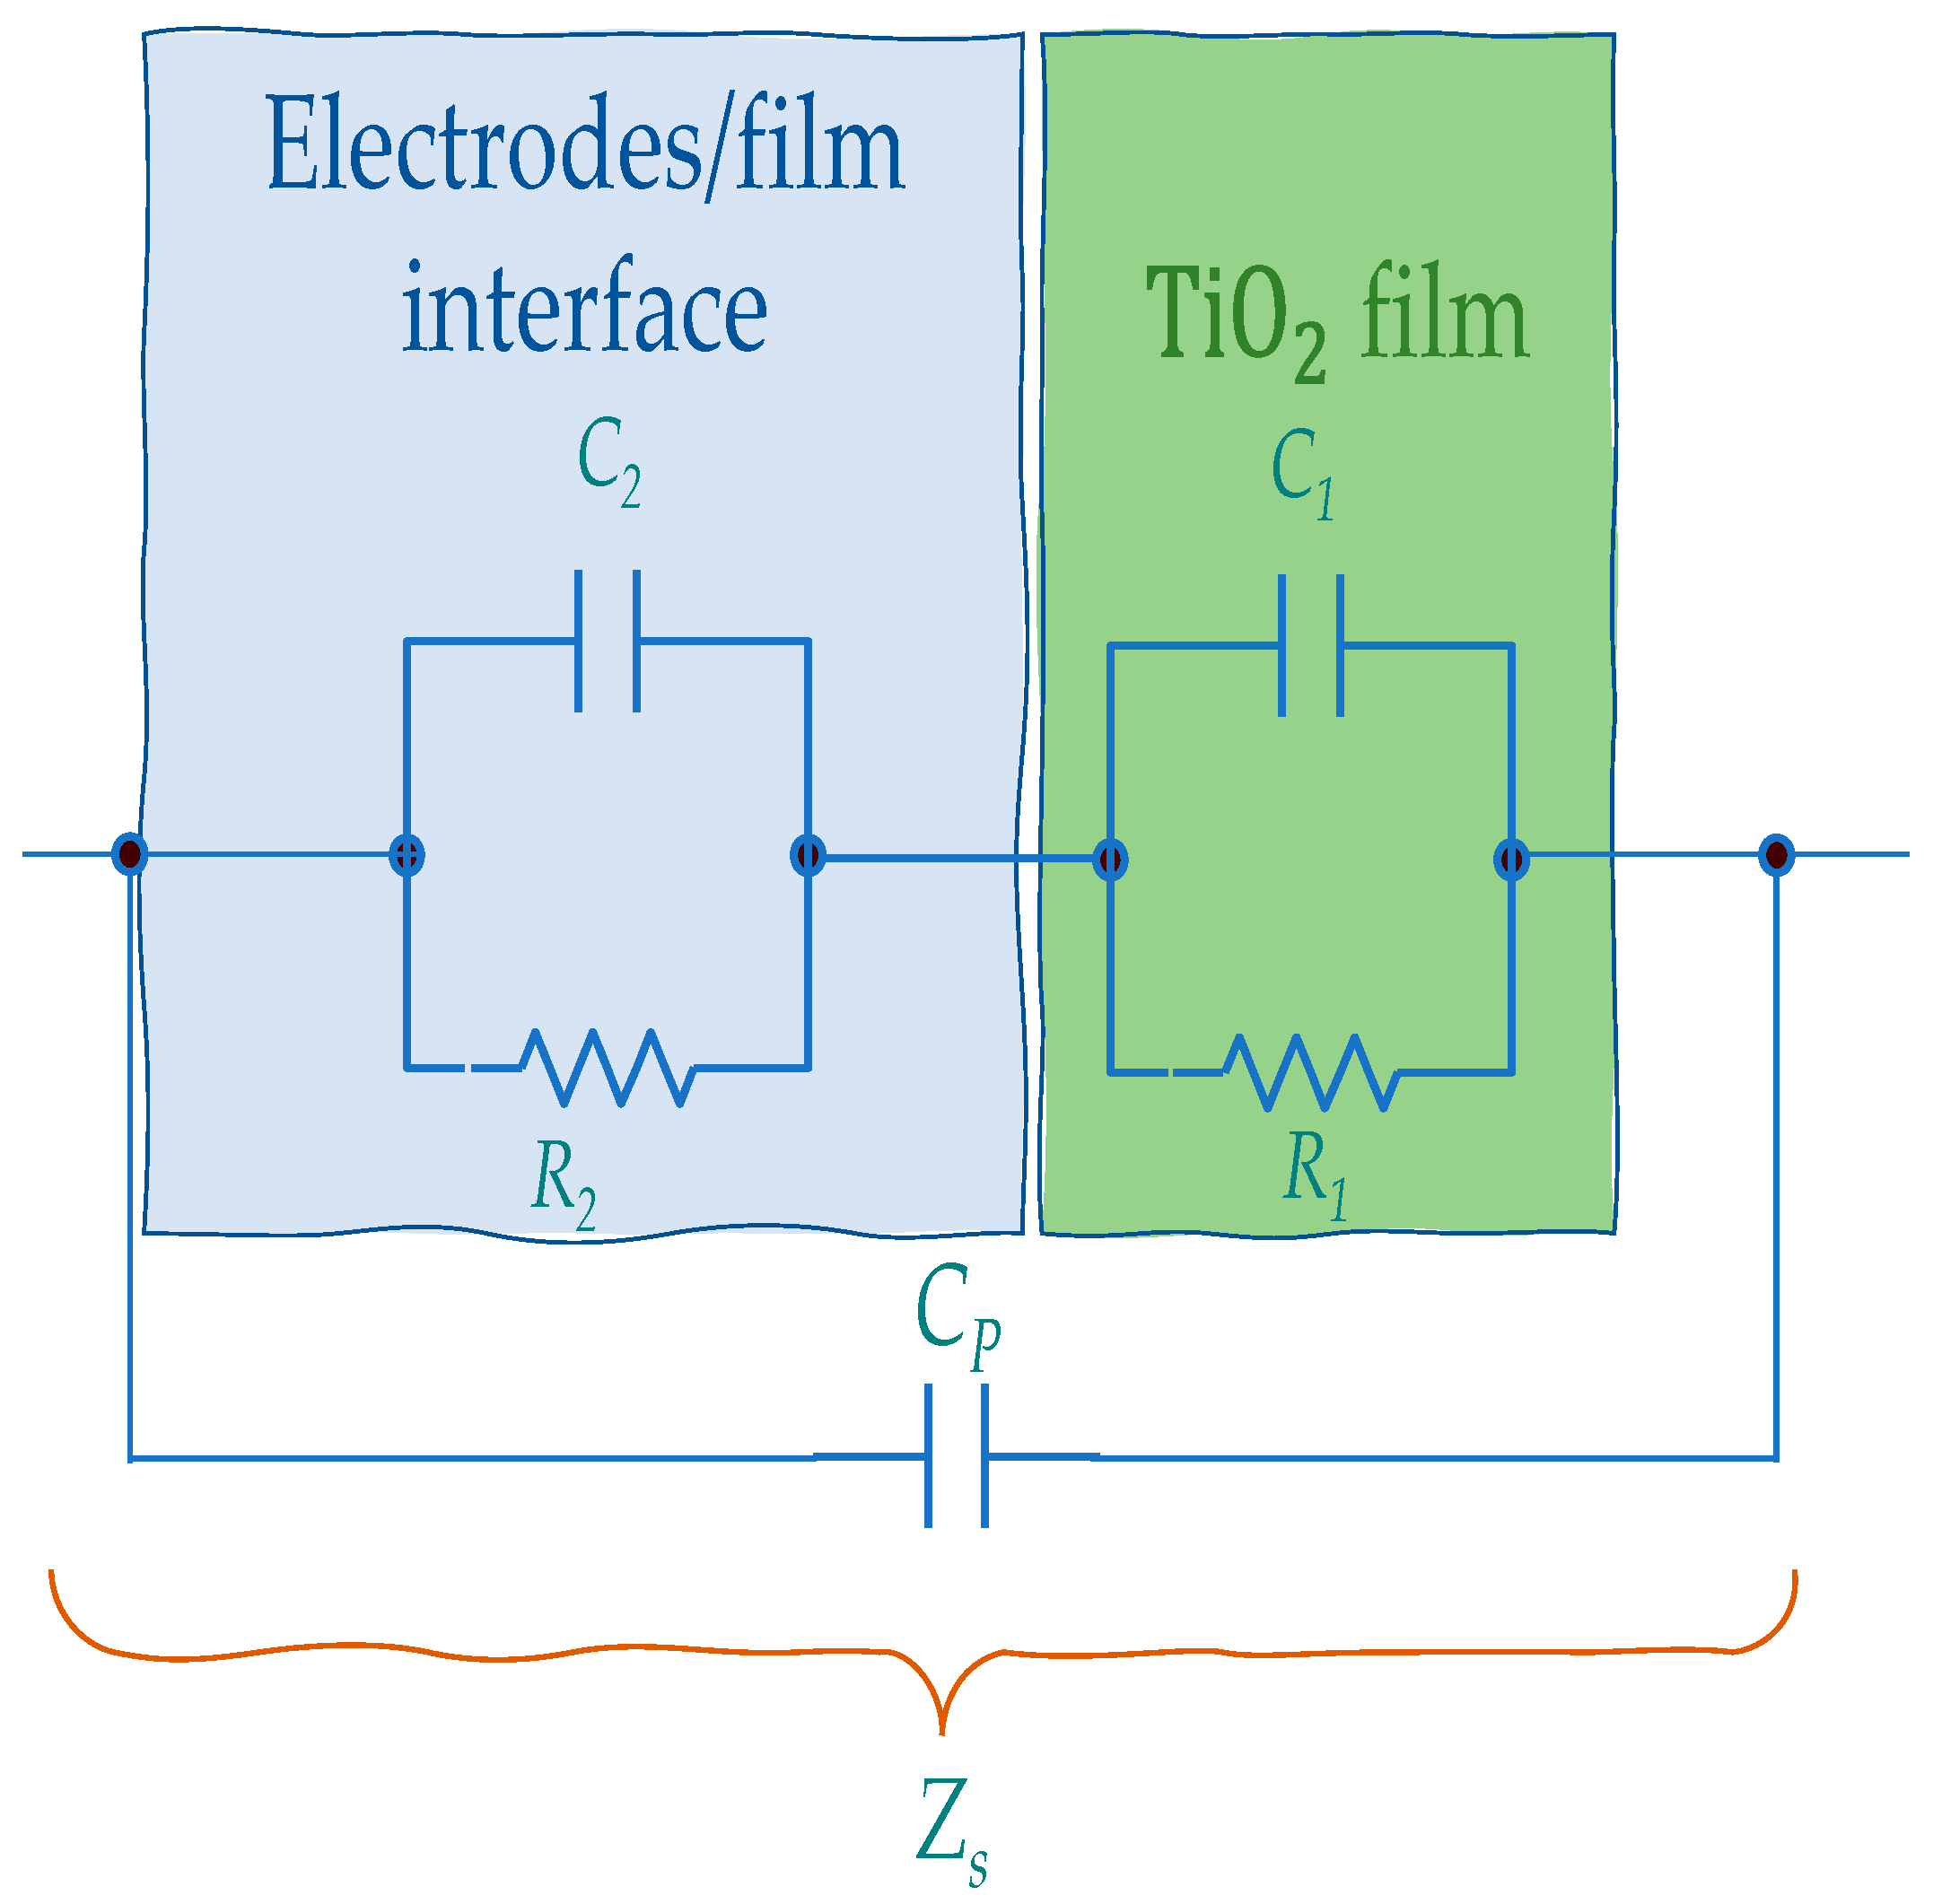
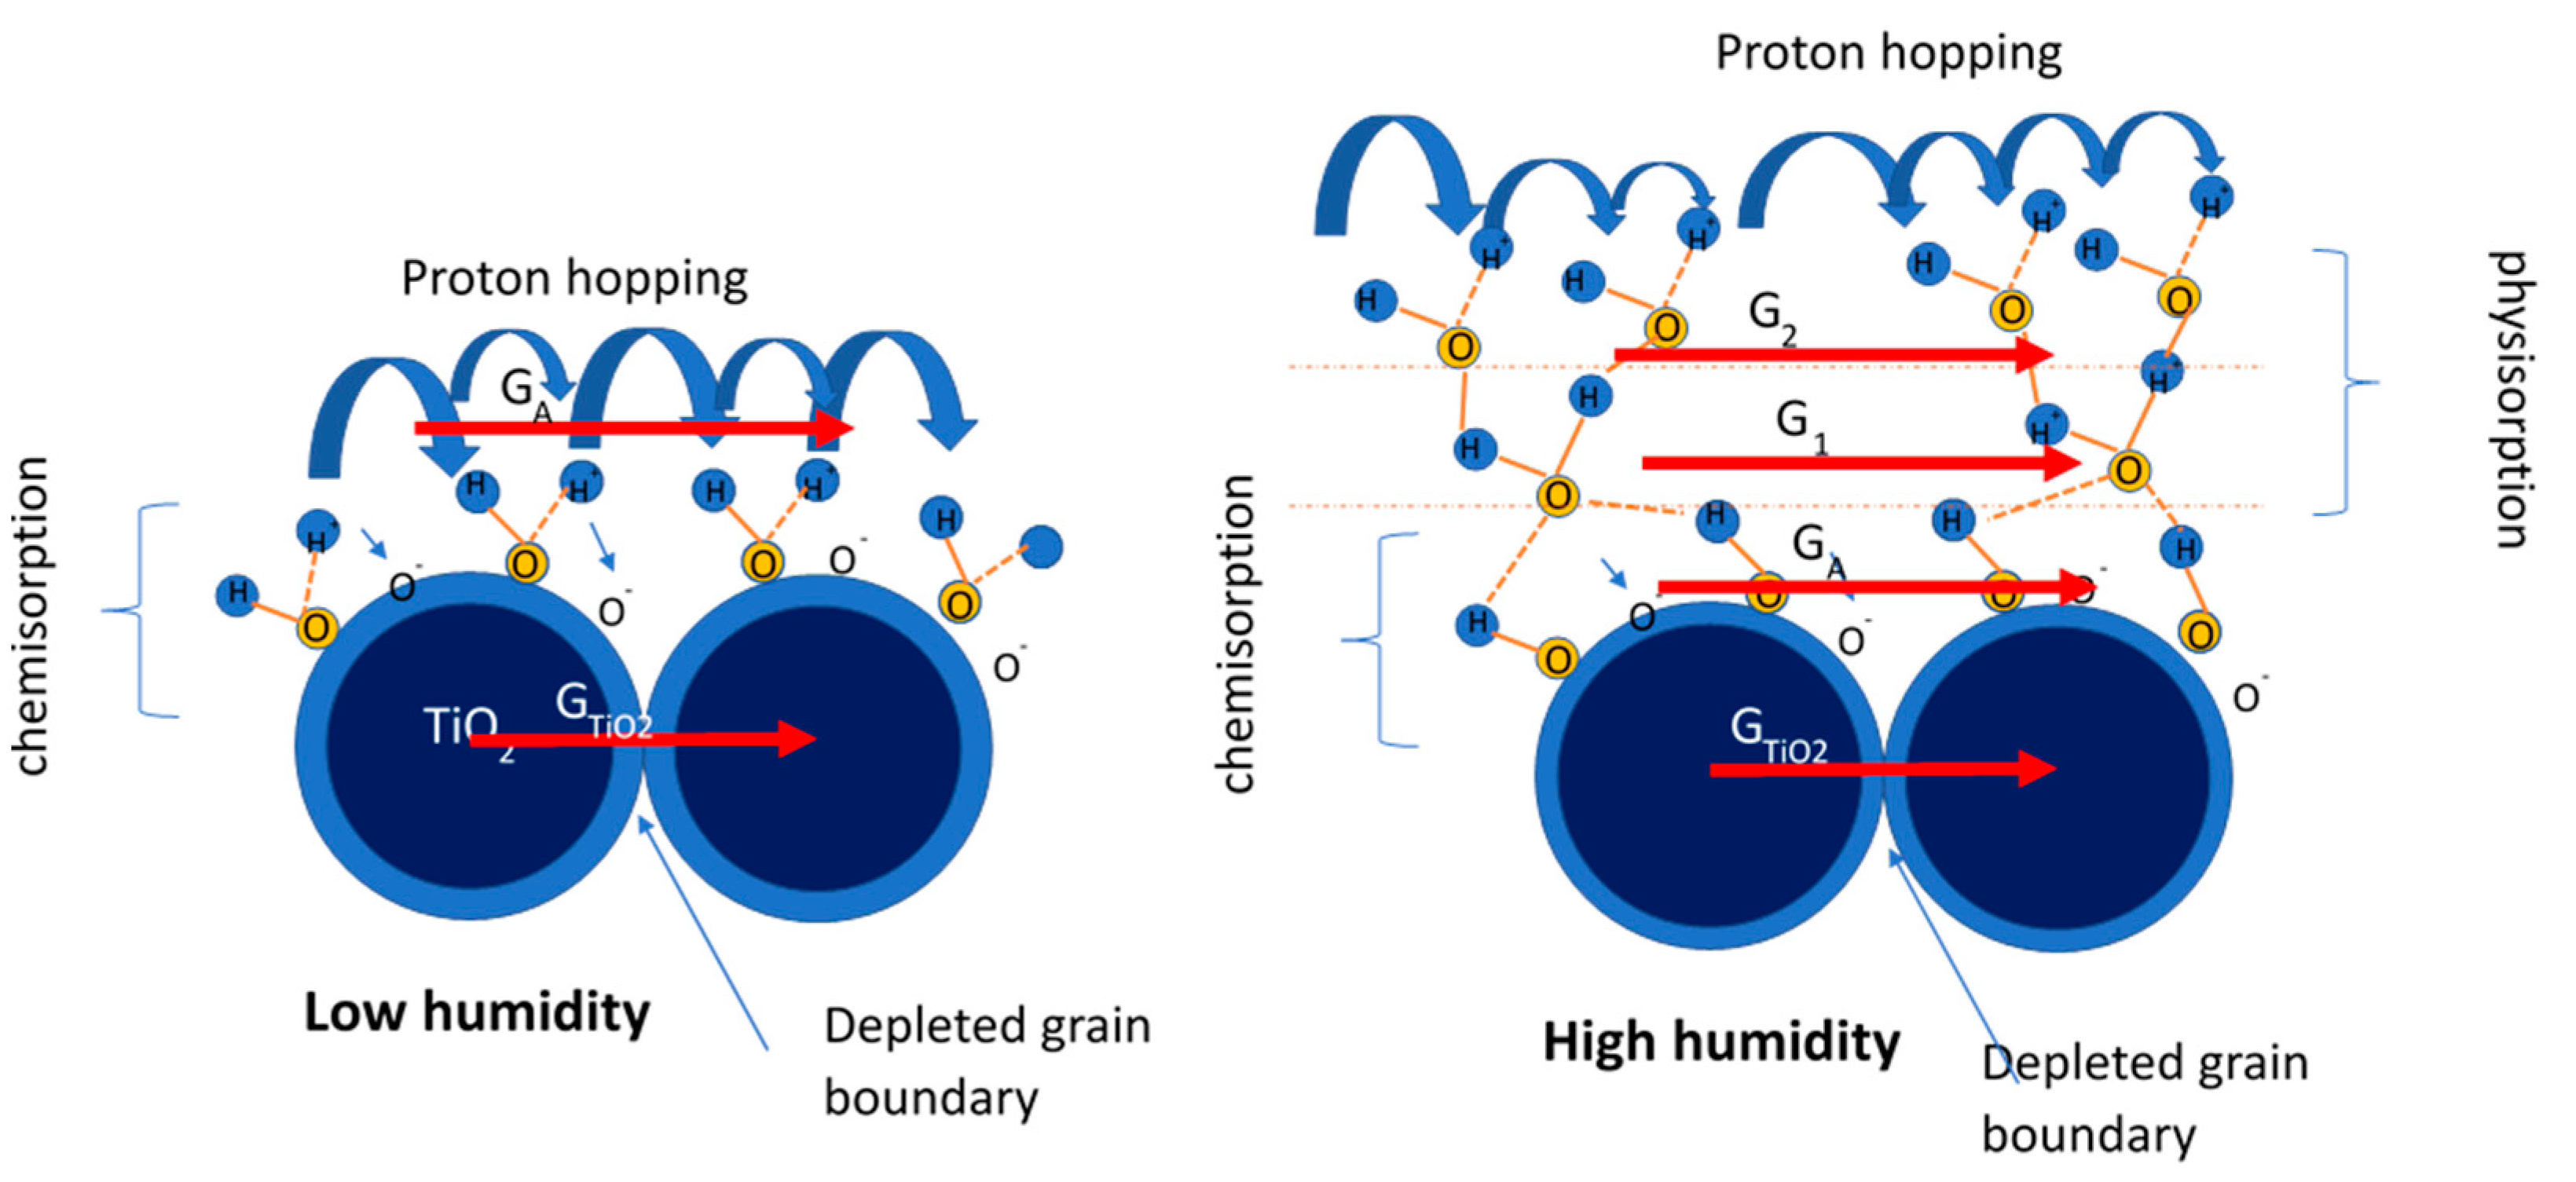
3. Sensing Mechanism

In this paper sensing is intended as impedance variation due to water vapor–film interaction. In this section, the sensing mechanism is briefly described, based on literature studies and on previous works of the authors [11,23,24]. At first, it must be underlined that the response of the sensor is primarily due to water adsorption from the gaseous phase, but it is mediated by the electrical behavior of the sensing film/adsorbates.
In general, the as-realized sensing device can be modeled by an equivalent circuit consisting of a series of parallel R-C groups and in particular, as already discussed in [23] and shown in Figure 4, the tested sensing films can be represented by two R-C groups, one describing the deposited film, and the other modeling the electrode/film interfaces, with the addition of a parallel parasitic capacitance (Cp) due to the measurement system and the Si substrate structure. Note that the capacitances C1 and C2 can be replaced by phase constant elements needed to model charge double layers imperfect capacitive behavior related to ionic conduction.
According to the model, the impedance of the sensors Z s can be written as follows:
Z s = ( Z 1 + Z 2 ) 1 + j ω C p ( Z 1 + Z 2 )
where the circuit components names are defined in Figure 4 and the related impedances can be written according to
Z i = R i 1 + ( j ω ) α C i R i
α = 1 being for ideal capacitance and 0 < α < 1 for phase constant elements.
The water adsorption affects both the resistive components and the capacitive ones. In particular, the variation of the resistance is caused by the variation of the film conductivity due, at very low humidity, to electron exchange between the adsorbate and the sensing film (chemisorption of the first monolayer of adsorbates), then, at intermediate humidity levels, due to proton hopping in the multi-layered ice-like structure over the nanoparticles and water physisorption, and finally, at very high humidity levels, due to the Grotthuss effect in the water condensed in the nano-pores and in the voids among the nanoparticles. This last phenomenon causes large conductivity variations since the mobility of protons in liquid water is large.
In more detail, as far as the resistive behavior of the film related to carrier transport is concerned, a model for the water/adsorbed and the water/TiO2 film can be described by Figure 5.
Namely, in the absence of condensed water in the pores, the DC conductance of the overall film will be a conductance of the type described with the following Equation (3) [11], which uses the symbols described in Figure 5:
G = G T i O 2 + G A + i = 1 N G i = G T i O 2 + ( q n H + A μ H + A )   S A l + ( q μ H + C n H + C ) l i = 1 N S i
where q is the electron charge, n H + A and n H + C are the proton densities in the first adsorption layer or in the upper layers, respectively, μ H + A and μ H + C are their mobilities. Finally, S i is the cross-sections of the layer i, while l is the current path length. G T i O 2 represents the electronic conduction in the TiO2 layer essentially due to barriers in the depleted regions at the particle boundaries, whose thicknesses are dependent on the amount of chemisorbed water. This contribution is a thermally activated conductance with an activation energy depending on the water vapor concentration. It appears that this term must be taken into account at RT only for very low RH values, i.e., in case of monolayer adsorption, otherwise, when multilayer adsorption occurs, the terms related to protonic hopping, GA in the chemisorbed layer, and Gi in the upper physiosorbed layers, tend to dominate. It can be noticed that the conductance term, relative to the upper layers, is proportional to the upper layer cross-section area, which in turn is proportional to the mass of water adsorbed in the upper layers.
At high RH values, the condensed water in the pores forms conductive bridges in parallel with the inter-grain conductances G T i O 2 ; these bridges can eventually merge and form a film of condensed water over the surface. When this happens, the conduction in condensed water is expected to become the dominant contribution described by a high conductance value.
The variation of the capacitive components is related to the variation of the electrical permittivity and/or to the variation of the charge stored at the interfaces characterized by potential barriers (due for instance to chemisorption) such as TiO2 grain-to-grain boundaries, TiO2-Au and Pt/TiO2 interfaces, and also liquid water/grain interfaces.
Note that the topology shown in Figure 4 can be used to represent the film operating in all the humidity conditions, even when at high humidity level multi-layers form new current paths, because the latter are in parallel with the pre-existing ones. In particular, the formation of new layers for the ionic transport can be represented by other resistive components in parallel to R1 and R2. In the same way the formation of new interfaces can be represented by the formation of capacitances in parallel with the pre-existing ones. Therefore, the more complex network needed to describe the film behavior in the presence of different layers at high humidity level, can be represented with the same electrical equivalent circuit topology used at low humidity, but with different components values, in which the higher is the humidity the lower are the resistive components and the larger are the capacitive components.
We assume that the conduction mechanism remains the same also in the presence of Au nanoparticles, because their densities are too low to substantially modify the current path. Instead, we consider that the main contribution of the Au functionalization can be its influence on water adsorption/desorption.
In fact, noble metals are well-known for their catalytic activities and ability of modifying the adsorption/desorption on metal oxides of different gases as well as of water vapor [25]. Noble metal surface doping can produce active sites on the surface offering reaction pathways with small activation energies enhancing the reaction rates. In addition, because the Fermi level of noble metals is generally lower than that of semiconductors used for gas sensing, charge carriers are redistributed, electrons are transferred from the semi-conductor into the noble metal until the Fermi level of the two materials are equal. During this process, noble metals get negatively charged whereas the n-type TiO2 positively charged. At the interfaces, Schottky barriers form, and the depleted regions at the surfaces of neighbor TiO2 grains thickens, modifying the adsorption reactions due to a change of the free electrons available at the surface [26,27]. In particular, this will favor those adsorption reactions releasing electrons (as water chemisorption).
Moreover, the spillover effect can play an important role. Spillover is a process related to adsorption on a film consisting of two different phases, in which a gas dissociative adsorption occurs on a phase (the metal) and then a migration of dissociated species to the second phase (here, the supporting TiO2) follows. In the general case of gas-sensing processes, it means that molecules of target gas at first react with noble metals in the sensing layer generating active species which are then adsorbed to the surface of the metal oxide. Therefore, if the adsorption on the added noble metal, in a certain working condition, is much more favored than the one on the supporting metal oxide, then even a small quantity of the metal used to functionalize the film can dramatically change the sensing properties in terms of both reduced response/recovery times, optimum operating temperature and sensitivity.
As a concluding remark, it is important to underline that all the phenomena involved in the RH sensing mechanism depend on temperature. In particular, the conduction on nanocrystalline oxides at room temperature (T < 50 °C) depends on the prevailing transport mechanisms of carriers which is essentially proton hopping for the tested materials [11] either in the chemosorbed layer, at low humidity, or in the physical absorbed layer, at higher humidity, finally in the condensed water, at very high humidity levels. The conductivity generally increases with increasing temperature when conduction occurs in the chemisorbed water layer or in the TiO2 layer, at very low humidity, due to the dependence of carrier density on temperature related e.g., to the strongest bonds of protons to the adsorbates. Whereas the film conductivity increases with decreasing temperature when the proton transport is mainly in the hydrogen-bonded and physically absorbed water layers, therefore at high humidity, where protons can be considered all free, because of the loose bonds, while the mobility reduction with increasing temperature starts to play an important role.
Moreover, temperature also affects the adsorption reaction rate constants, and in [28] an Arrhenius-type dependence of the rate constant was suggested.
For this reason, to study the behavior of the sensors in terms of different adsorption mechanisms, it is important to operate at fixed and known temperature during the characterization tests.

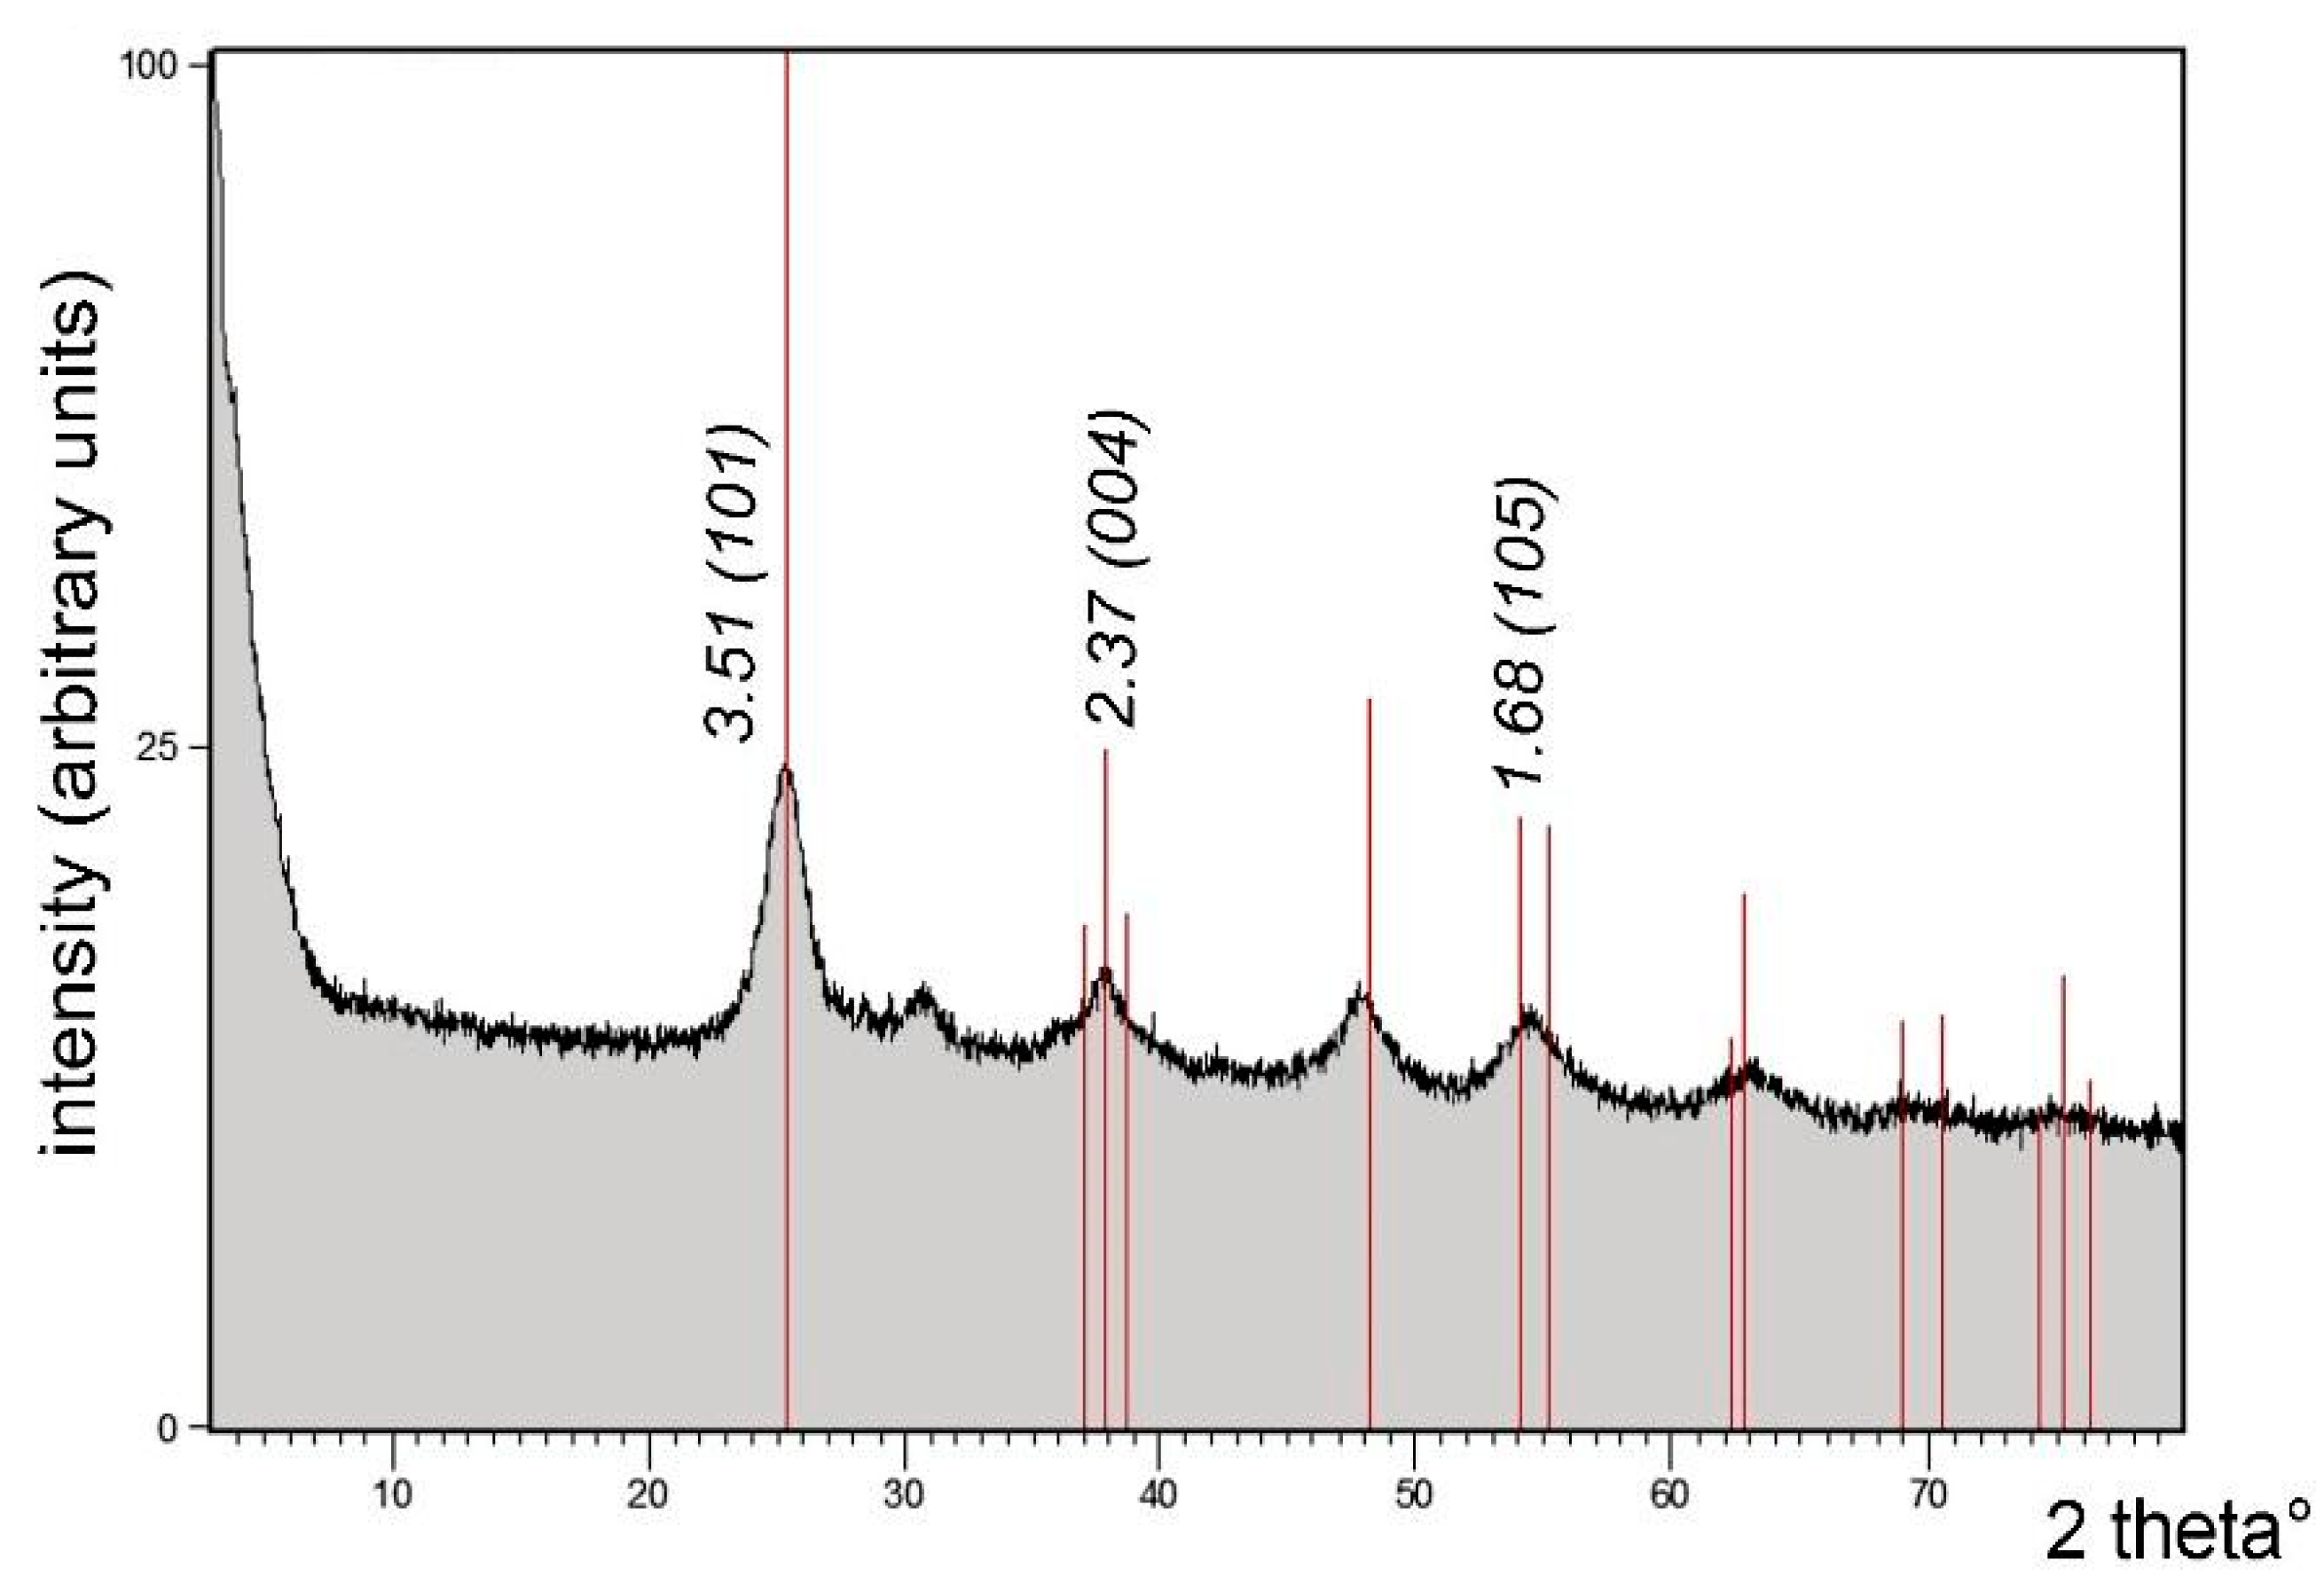
4. Material Characterization: Experimental Results and Discussion

XRD and TEM allowed the accurate mineralogical characterization of the TiO2 sample in terms of polymorphic crystal structure and nanotextural details. XRD pattern revealed the occurrence of relatively wide and weak diffraction peaks, all corresponding to anatase (Figure 6 and Table 1), i.e., the tetragonal polymorph of TiO2.
TEM images (e.g., Figure 7) revealed nanosized rounded grains of anatase (5–10 nm in diameter). Anatase nanocrystals are randomly oriented, giving rise to ring-shaped selected area electron diffraction (SAED) patterns (inset in Figure 7a). Lattice fringes in high magnification images usually correspond to (101) planes, characterized by a d-spacing of ~3.5 Å. Lattice fringes are regularly spaced and defect-free, suggesting ordered crystal structures. Due to the extremely fine size of anatase nanocrystals, TEM images are often affected by overlapping problems of different crystals, producing Moiré effects.
Figure 8 is a TEM image of the Au nanoparticles, that were added to the TiO2 nanostructured film. Au nanoparticles display spherical shape, 5–8 nm in diameter, in agreement with the declared average size.

5. Humidity Sensing: Experimental Results and Discussion

5.1. Impedance Spectra

Figure 9 shows the impedance of the tested sensing devices in the frequency range 50 Hz–80 kHz; each impedance is measured after about 1 h of exposure to constant and controlled RH levels. It can be seen that all the tested films present a large impedance at low frequency even at relatively high RH levels, indicating that the overall conductivity is small. This suggests that, due to the small size of the nanoparticles, grain boundaries potential barriers play an important role, and that the native defect density in the single crystalline nano-grains is low. The behavior at low RH is prevalently capacitive, therefore it is expected that the conductivity variations related to chemisorption and subsequent physisorption give a limited contribution to the impedance variations. In fact, since in this case the film conductivity in the absence of adsorbed water is very small, the prevailing effect at low RH values is the variation of the film electric permittivity or of the grain boundaries and electrode/film double layers, and therefore of the capacitances. Only for large RH values, when the physiosorbed water layer forms an almost continuous film, the transport current becomes important, and the films show a significant reduction of the impedance magnitude and a larger phase. This change in the electrical behavior of the device, accompanied by the resistive components due to proton hopping which become relevant, is gradual for the pure TiO2 and starts already at RH larger than 10%, as it can be seen in Figure 9. For this material, a further large decrease of the resistance, that causes the large phase increase at high frequency, is observed for RH levels above 80%, as evidenced in Figure 10. It can be seen that the addition of Au enhances the response to high humidity levels, but, unfortunately, reduces the response in the low humidity range. Moreover, the addition of gold nanoparticles affects the transition from capacitive to resistive behavior, which becomes less gradual and starts at RH values larger than 60–70%.
The impedance spectra were further analyzed by means of model fitting. For the pure TiO2 (see Figure 11) it was found that for low humidity a simple R-C group is sufficient to fit the sensing film behavior whereas, for relative humidity values above 40%, the more complex circuit topology shown in Figure 4 must be used, where, moreover, the capacitance C2 is a non-ideal capacitance (a phase-linear element) with impedance   Z C = 1 ( j ω ) α C 2 . Figure 11 shows the most relevant parameters estimated for the pure TiO2 device with reference to the symbol defined in Figure 4 and Equations (1) and (2). In particular, the plots show the values of the components needed to describe the behavior up to 40% RH (R1 and C1) together with the estimated value of C2 and its exponent α, used to describe the film at higher humidity values. Since R2 was found to have a large value and to give a negligible contribution in the parallel configuration, its estimated values are not plotted.
For the Au functionalized films, it was found that the simpler circuit can describe the device behavior up to 60% RH. An example of fitting results and of the most relevant estimated parameters related to the high humidity range is reported for the TiO2Au2 film in Figure 12.

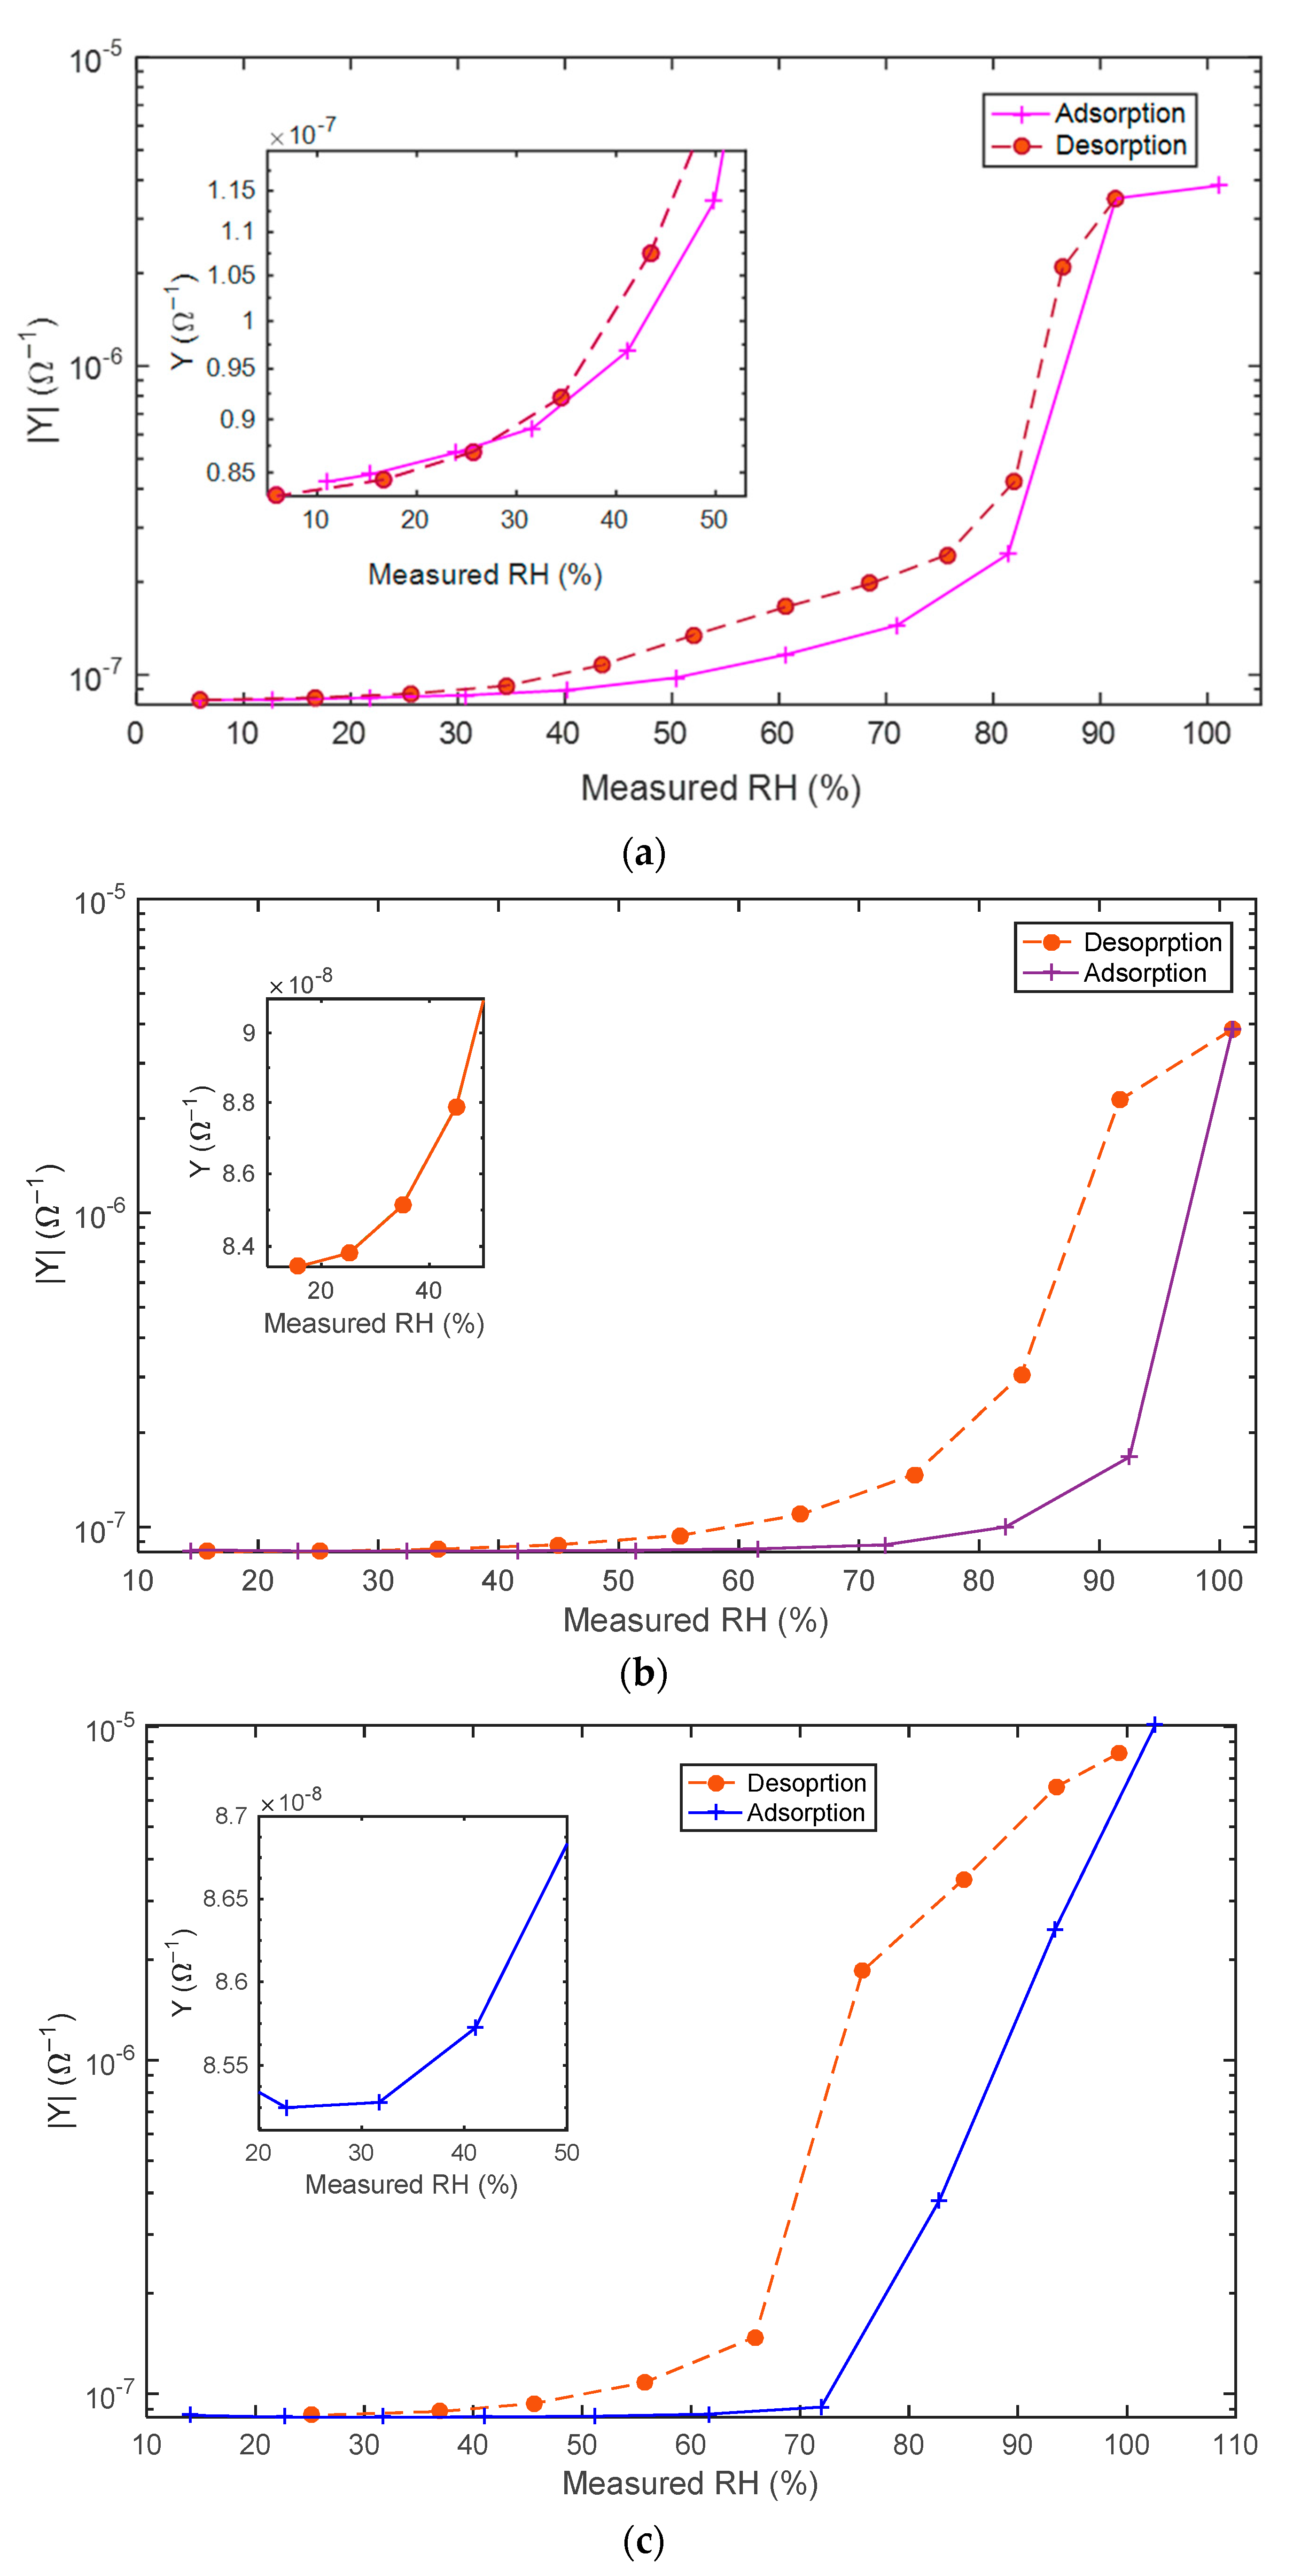
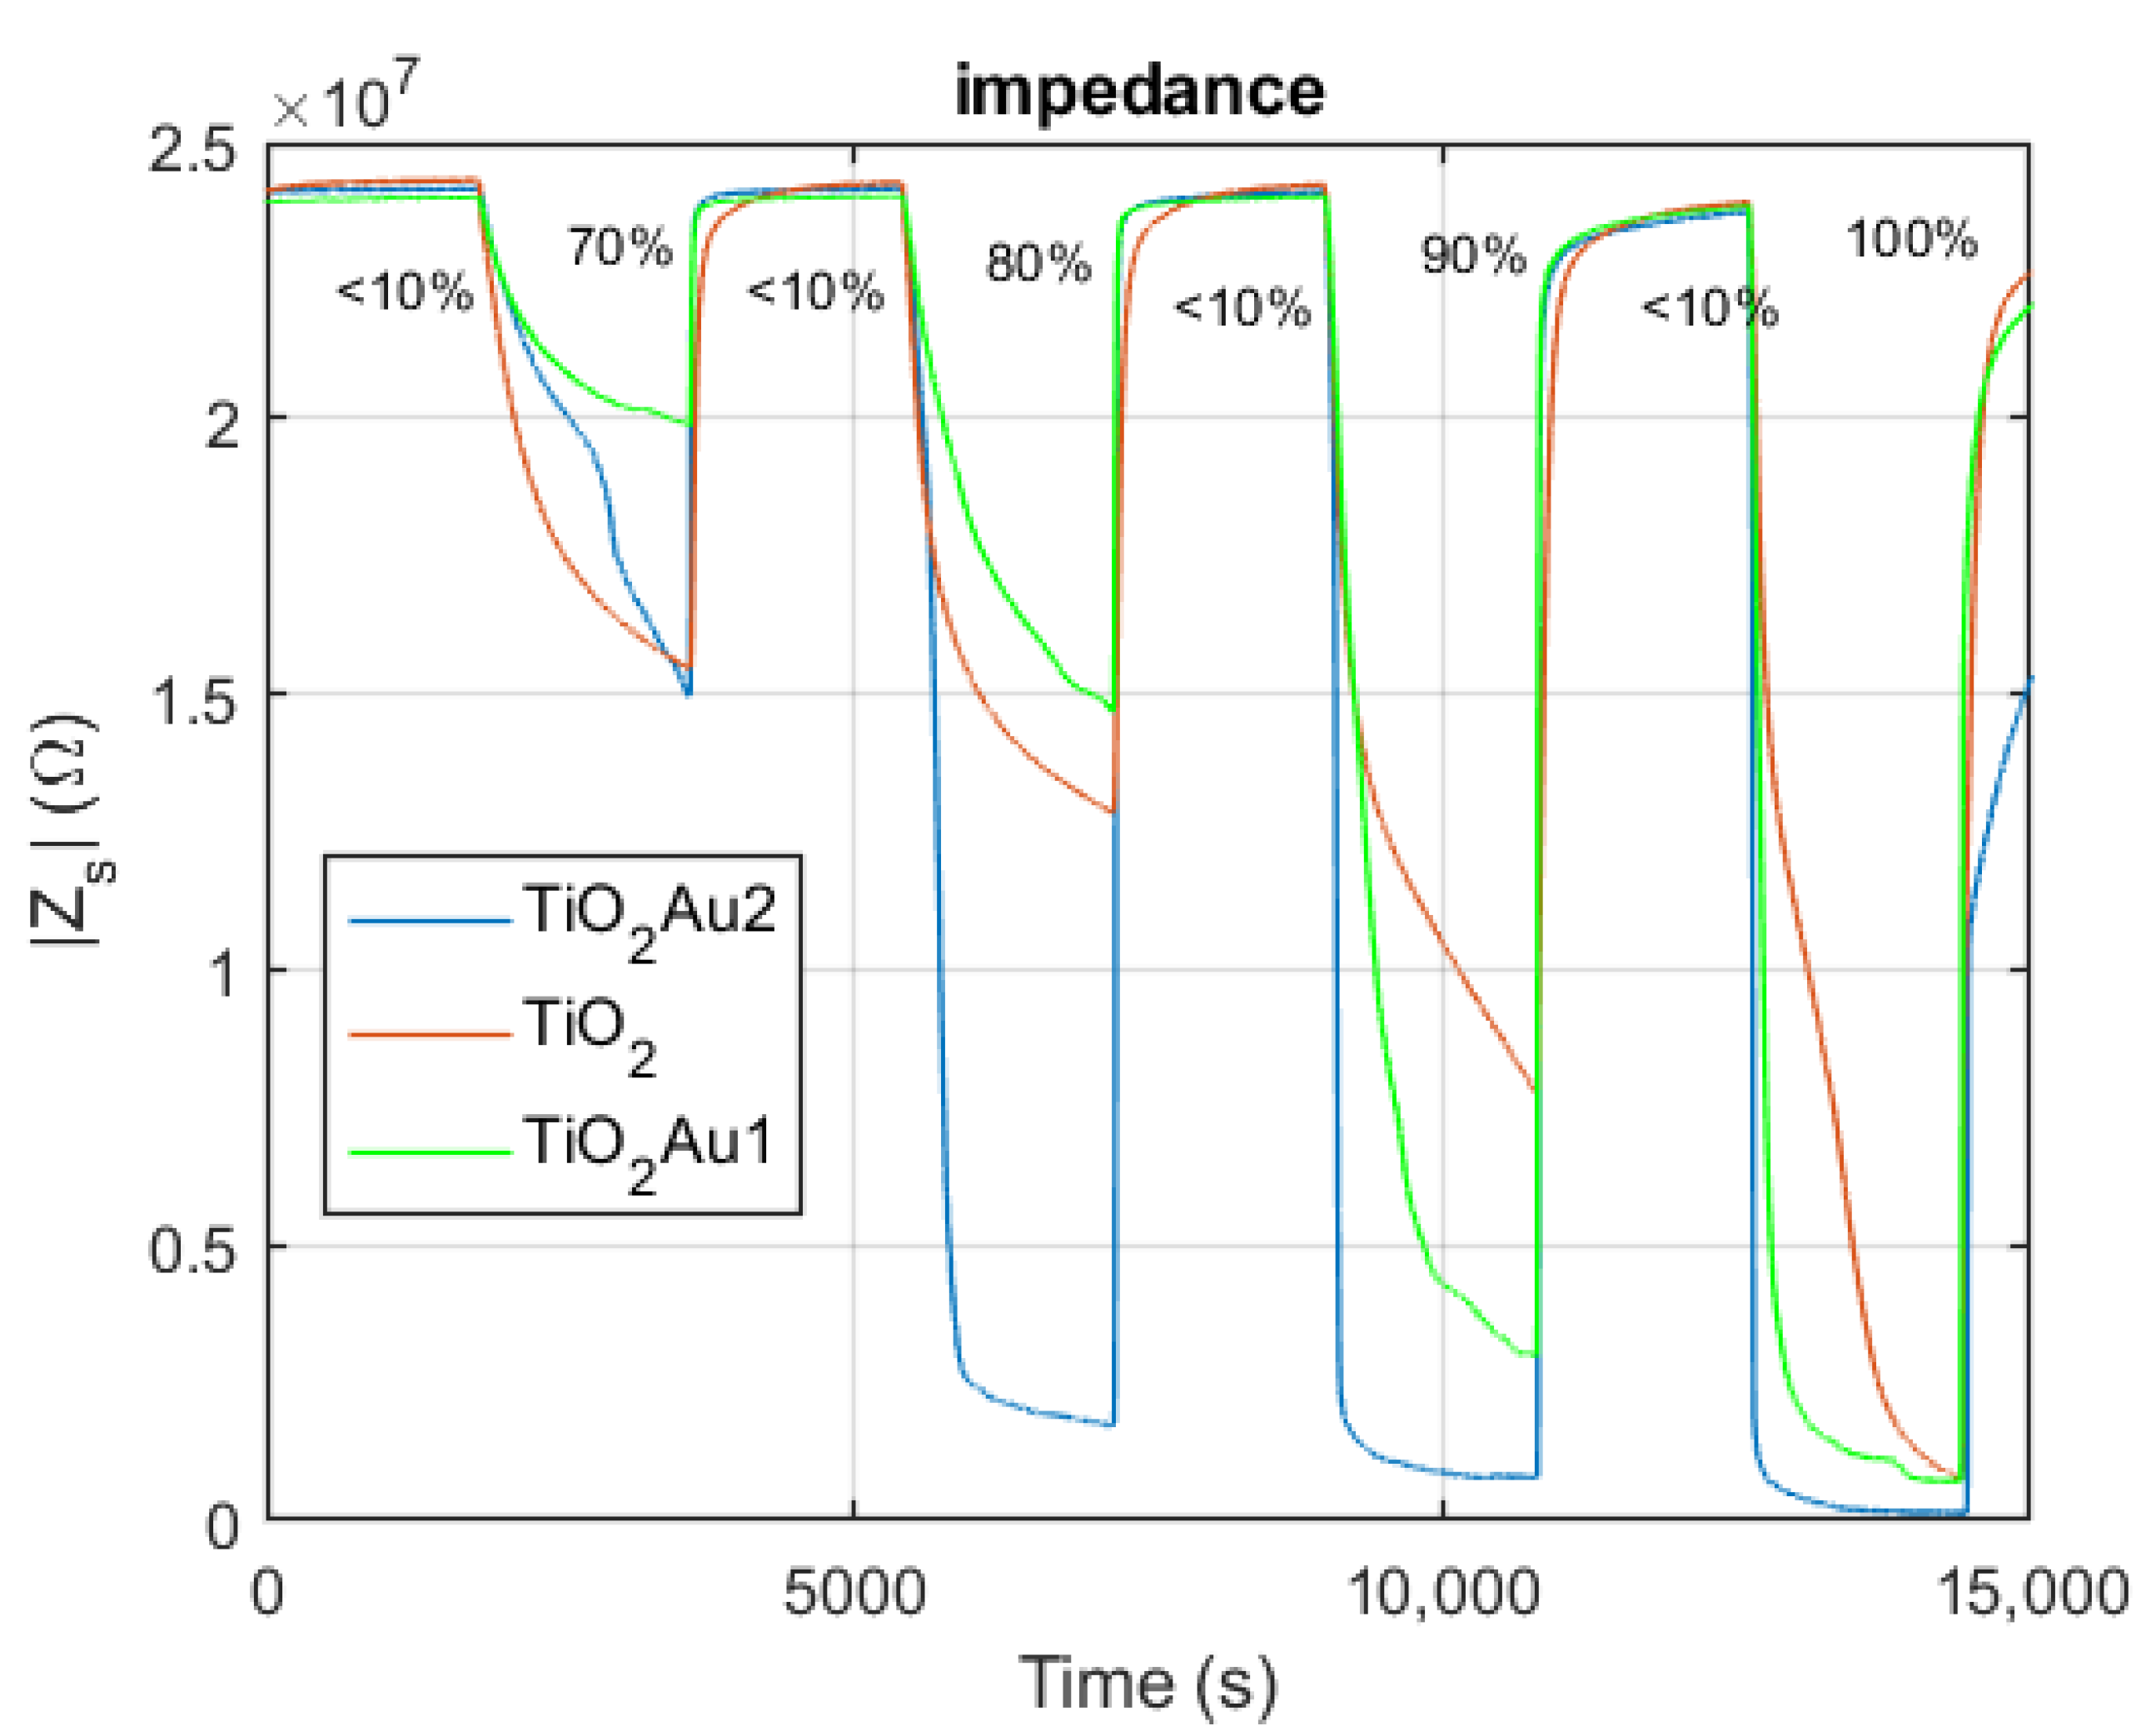
5.2. Adsorption/Desorption Response: Experimental Results and Discusssion

In this subsection, the sensing film behavior was analyzed by means of adsorption/desorption experiments. To this end, the film response was recorded during experiments in which the RH value was slowly increased (10% RH/30 min) from 10% to 100% and then decreased from 100% to 10%. The response of the sensor was measured in terms of admittance magnitude | Y s |   at 100 Hz.
Figure 13 shows the sensing film responses (admittance magnitude at 100 Hz) as a function of the RH value measured with the commercial sensor placed in the measurement chamber.
The results found through the impedance spectra analysis are confirmed: the response to humidity is very large for all the tested materials. The magnitude of the sensor admittance changes more than two orders of magnitude passing from 10% to 100% RH. The small size of the TiO2 nanoparticles leads to a very large water uptake [11]. The adsorption/desorption curves are highly non-linear and present steep variations for humidity values above 80% in case of TiO2 and TiO2 with 1% Au, and above 70% with 2% Au. This remarkable increase of the admittance can be related to the formation of liquid water in the majority of pores or inter-particles voids [29]. Nevertheless, as already discussed, the contribution of condensed water for pure TiO2 seems not negligible also for lower humidity values (above 30–40% as shown in the inset of Figure 13a), bringing to a gradual change of the response slope. These measurements confirm that the presence of Au favors the sensitivity in the high humidity range, whereas it hinders the adsorption of water by the grain surface responsible for the response at lower humidity levels. This is partially in contrast with other findings in the literature, which show that the Au-TiO2 interface is highly reactive, and that its presence can enhance the adsorption of many gaseous species among which also water vapor [16,19]. This inconsistency can be explained by the fact that the measured quantity in our research is the impedance/admittance of the sensor, therefore chemisorption forming the first adsorbates layer and physisorption, which forms the subsequent layers, play a limited role. The most part of the response is due to the formation of liquid water in the pores, which occurs at different humidity levels according to the sample used. In the TiO2 sample the water condensation already starts at low RH levels and increases quite gradually with an abrupt rise around RH = 80%, whereas for the TiO2Au2 samples the sudden humidity increase is moved up at RH levels between 60% and 70%, but the liquid water formation on the grain surface is hindered at low RH and it does not have a gradual increase. This can be explained by the occupation of some of the TiO2 adsorption sites for water by Au metal nanoparticles [18].
Finally, it can be seen that the addition of Au leads to the appearance of a marked hysteresis, which is well-known to be related to capillary condensation and can be a problem for sensing applications.

5.3. Transient Response

In this subsection the sensing properties of the tested materials will be analyzed in terms of dynamical response. In particular, the adsorption and desorption kinetics are observed at different RH levels through transient experiments in order to evaluate the response and recovery times in different conditions.
In Figure 14 the response of the materials TiO2 and TiO2Au2 to increasing RH steps are compared. Two things can be observed, the first one is that the response time is not independent from RH for both materials, especially at high RH levels, the second is that in general the addition of Au nanoparticles speeds up the adsorption process.
Moreover, the results shown in Figure 14 confirm those obtained by the previous studies, especially the ones based on spectrum impedance, showing that there is a sudden change in the behavior of the pure TiO2 sensing film at humidity larger than 80%, which can be explained by the condensation of a large quantity of water. This can also explain the rising of the temperature in the chamber observable at RH higher than 80%. Massive water condensation could indicate the presence of a dominant pore or void size and is accompanied by those phenomena observed and studied in the literature in materials with an ordered structure of pores, as hysteresis and low sensitivity to RH variation above the massive condensation threshold. The occurrence of this phenomenon does not make the materials suitable for sensing applications, hence the studied ultra-small spherical nanoparticles of crystalline TiO2 are suitable for measurement only in the range 0–80% RH. The Au-TiO2 composite shows the same sudden change for RH values between 60% and 70%, as if the presence of Au inhibits the adsorption of water on the grain surface but anticipates the massive condensation in the pores or voids, in fact the different paths of adsorption and desorption in hysteretic isotherms are dependent also on pore chemistry, geometry and temperature [9,30,31].
To better evaluate the dynamic behavior of the materials under study, and the response and recovery time (defined as the required time to 90% of the total impedance [32]) tests with RH pulses were performed and some results are reported in Figure 15.
The dynamic response can be explained by the superimposition of the adsorption/desorption kinetics, which is quite fast (response/recovery times in the order of few minutes) and responsible for the behavior of the sensing films at low RH levels, and of capillary condensation, which is quite slow and becomes relevant especially at high RH. This last phenomenon causes the slow increase of the sensor admittance magnitude which is not vanished at the end of the RH pulse (30 min) and becomes particularly relevant at RH around 80% for the pure TiO2 and 60%/70% for the Au-TiO2 composite.
Moreover, comparing the results shown in Figure 14 and Figure 15, it can be seen that small steps in the RH value are accompanied by a reduced contribution of the slow increase of the admittance, probably due to the fact that the pores and the voids are already partially filled by condensed water. On the other hand, for large variations of RH, as in the case of the RH pulses shown in Figure 15, it can be noticed that the effect is larger.
It is remarkable that the recovery time appears constant and independent from the working conditions, therefore fast evaporation/desorption occurs especially for Au composites, with typical values of less than 3 min for pure TiO2 and less than 90 s for TiO2Au2, respectively.
Finally, Figure 16 compares the transients obtained with the tested materials with large RH pulses from 70% to 100%, showing that addition of Au nanoparticles speeds up the response and the recovery times, and enhances the response magnitude at high RH values.

6. Conclusions

The goal of this paper was to electrically characterize the behavior of very subtle layers of TiO2 nanoparticles also functionalized with Au nanoparticles at relative humidity varying in the range 0–100%. This characterization, performed exploiting impedance spectroscopy measurements in steady state RH conditions, and measuring the material admittance/impedance magnitude at a fixed frequency in the presence of smooth or abrupt RH variations, allowed to highlight those phenomena (i.e., water condensation, slow drifts, hysteresis, non-linear response) that make the use of these materials for humidity-sensing applications quite complex and challenging.
In particular, massive condensation phenomena in the nano pores or voids occur when these nanomaterials are employed at high RH levels, which implies large responses but, at the same time, probable slow drifts and hysteretic behaviors. As a consequence, in the short term these materials have limited repeatability.
Hence, the studied TiO2 crystalline nanoparticles are suitable for sensing applications only in the range 0–80% RH, whereas the addition of Au nanoparticles has the effect of reducing the sensing film response at low RH, anticipating the liquid water condensation and improving the recovery times of the transient response.
There could be many factors that modify the behavior of the film after gold functionalization, among which the size and the morphology of the added gold particles. For instance, it is reported that the activity of gold nanoparticles increases with the square of the inverse of the diameter in the range 1–10 nm [33], but, in any case, it seems that concerning dissociative water adsorption, the most active regions are the interfaces between gold and TiO2. In the case presented in this paper, the size of the gold nanoparticles is almost equal to the one of the TiO2 nanoparticles and this actually could have reduced the area of the total contact surface between the two species, and therefore the ability of gold to enhance the response to humidity. On the other side, it can be seen that at high humidity levels the effect of gold is not negligible, and this means that the presence of gold in the used form is able to effectively favor the water adsorption and/or condensation in the nanopores or voids.
To explain why at low humidity levels the response of the sensor is actually lower with respect to the one registered for the pristine material, whereas it is larger in the presence of high humidity levels, is not an easy task. A possible explanation can be found noting that the reduced response of the sensor does not correspond uniquely to a reduction of the amount of adsorbed water, but it could be explained also by a change in the mechanism of charge exchange between the solid phase and the adsorbates, or by different routes for water chemisorption that can be mediated by chemisorbed oxygen [34] (as happens on other metal oxides [8]). In fact, noble metal functionalization seems to favor oxygen chemisorption [35], which is usually negligible on TiO2 at room temperature. Under these hypotheses, the effect of the first chemisorbed layer of water on the conductivity of the film would be different due to the injection of a different amount of free electrons from the adsorbate, and to the formation of a grain boundary barrier with a different height. Only when a sufficient quantity of physiosorbed water is present, allowing for proton hopping becoming the dominant transport mechanism, the presence of gold becomes beneficial. Water condensation in the pores and voids could be favored by the variation of surface charge density induced by the presence of gold.
The results found in this paper, relate to the sensing performance of TiO2 nano-structured films to the different phenomena occurring during water adsorption, to the influence of these phenomena on the electron and ion transports but, also, to the film nano-structure characteristics. In particular, it seems that water condensation in nano-pores and inter-grain voids can highly influence the overall impedance of the film, produce very large response, but also create hysteretic behaviors and long transients. These conclusions can be corroborated by comparing the results used in this study with those related to other nanostructured metal oxides, those from adsorption/desorption studies with mesoporous materials, or those presenting TiO2 RH sensors obtained starting from different nano-powder sizes [14,36]. For instance, in [2], a sensing film obtained by screen printing a paste based on 100 nm diameter TiO2 nano-powder was characterized by a linear behavior and an impedance variation of about 90% passing from 0% RH to 70% RH, which is a response much smaller than the one obtained with the films tested in this paper, which varies of 2 (pristine TiO2) or 3 (TiO2Au2) orders of magnitude in the range 0% RH–100% RH. On the other hand, the material used in [2], showed a negligible hysteresis and a moderate increase of the response times at high humidity levels, indicating a reduced contribution from water condensation due to the different size of the pores. To support the conclusions drawn in this paper, which correlate a very large impedance variation in response to RH variations above all to the condensation of water favored by the presence of very fine structures and possibly mesopores, it can be stressed that the response magnitude of the very fine grained tested materials is particularly large, and of about one order of magnitude larger than the one attained by the authors with a sensing film obtained by drop coating but starting from larger TiO2 nanoparticles (about 20 nm mean diameter) [11], and larger or comparable with the one found by other authors with different metal oxides nanoparticles [14,37].
As a final comment, it can be underlined that the interpretation of the results reported in this paper has a general validity for nanostructured metal oxides used for RH sensors, for which chemisorption is followed by multilayer physisorption and, finally, by water condensation in the micropores or mesopores, and can help in the interpretation of data obtained from different nanostructured active materials [38].

Author Contributions

Conceptualization, A.F., M.M. and V.V.; methodology, E.P. and I.C.; software, I.C.; validation, E.P., A.F. and T.A.; formal analysis, V.V.; investigation, I.C., E.P., C.V.; data curation, I.C.; A.F., C.V., writing—original draft preparation, I.C., A.F., E.P., C.V., V.V.; writing—review and editing, V.V., M.M., T.A. All authors have read and agreed to the published version of the manuscript.

Funding

This research received no external funding.

Institutional Review Board Statement

Not applicable.

Informed Consent Statement

Not applicable.

Data Availability Statement

Not applicable.

Conflicts of Interest

The authors declare no conflict of interest.

References

  1. Arafat, M.M.; Dinan, B.; Akbar, S.A.; Haseeb, A.S.M.A. Gas Sensors Based on One Dimensional Nanostructured Metal-Oxides: A Review. Sensors 2012, 12, 7207–7258. [Google Scholar] [CrossRef]
  2. Dubourg, G.; Segkos, A.; Katona, J.; Radović, M.; Savić, S.; Niarchos, G.; Tsamis, C.; Crnojević-Bengin, V. Fabrication and Characterization of Flexible and Miniaturized Humidity Sensors Using Screen-Printed TiO2 Nanoparticles as Sensitive Layer. Sensors 2017, 17, 1854. [Google Scholar] [CrossRef] [Green Version]
  3. Fort, A.; Panzardi, E.; Al-Hamry, A.; Vignoli, V.; Mugnaini, M.; Addabbo, T.; Kanoun, O. Highly Sensitive Detection of NO2 by Au and TiO2 Nanoparticles Decorated SWCNTs Sensors. Sensors 2020, 20, 12. [Google Scholar] [CrossRef] [Green Version]
  4. Rzaij, J.; Abass, A. Review on: TiO2 Thin Film as a Metal Oxide Gas Sensor. J. Chem. Rev. 2020, 2, 114–121. [Google Scholar] [CrossRef] [Green Version]
  5. Li, P.; Yu, S.; Zhang, H. Preparation and Performance Analysis of Ag/ZnO Humidity Sensor. Sensors 2021, 21, 857. [Google Scholar] [CrossRef]
  6. Arunachalam, S.; Izquierdo, R.; Nabki, F. Low-hysteresis and fast response time humidity sensors using suspended functionalized carbon nanotubes. Sensors 2019, 19, 680. [Google Scholar] [CrossRef] [Green Version]
  7. Li, W.; Liu, J.; Ding, C.; Bai, G.; Xu, J.; Ren, Q.; Li, J. Fabrication of ordered SnO2 nanostructures with enhanced humidity sensing performance. Sensors 2017, 17, 2392. [Google Scholar] [CrossRef] [Green Version]
  8. Platonov, V.; Rumyantseva, M.; Khmelevsky, N.; Gaskov, A. Electrospun ZnO/Pd Nanofibers: CO Sensing and Humidity Effect. Sensors 2020, 20, 7333. [Google Scholar] [CrossRef] [PubMed]
  9. Barsotti, E.; Tan, S.P.; Saraji, S.; Piri, M.; Chen, J.H. A review on capillary condensation in nanoporous media: Implications for hydrocarbon recovery from tight reservoirs. Fuel 2016, 184, 344–361. [Google Scholar] [CrossRef]
  10. Fort, A.; Panzardi, E.; Vignoli, V.; Landi, E.; Mugnaini, M.; Carlo, T. Performance Analysis of an AlN Humidity Sensor based on TiO2 nanoparticles. In Proceedings of the 2019 IEEE International Symposium on Measurements & Networking (M&N), Catania, Italy, 8–10 July 2019; pp. 1–5. [Google Scholar]
  11. Cappelli, I.; Fort, A.; Lo Grasso, A.; Panzardi, E.; Mugnaini, M.; Vignoli, V. RH Sensing by Means of TiO2 Nanoparticles: A Comparison among Different Sensing Techniques Based on Modeling and Chemical/Physical Interpretation. Chemosensors 2020, 8, 89. [Google Scholar] [CrossRef]
  12. Farzaneh, A.; Mohammadzadeh, A.; Esrafili, M.D.; Mermer, O. Experimental and theoretical study of TiO2 based nanostructured semiconducting humidity sensor. Ceram. Int. 2019, 45, 8362–8369. [Google Scholar] [CrossRef]
  13. Mele, G.; Del Sole, R.; Lü, X. Applications of TiO2 in sensor devices. Titanium Dioxide (TiO2) and Its Applications. In Metal Oxides; Elsevier: Amsterdam, The Netherlands, 2021; pp. 527–581. [Google Scholar]
  14. Feng, H.; Li, C.; Li, T.; Diao, F.; Xin, T.; Liu, B.; Wang, Y. Three-dimensional hierarchical SnO2 dodecahedral nanocrystals with enhanced humidity sensing properties. Sens. Actuators B Chem. 2017, 243, 704–714. [Google Scholar] [CrossRef]
  15. Sikarwar, S.; Yadav, B.C.; Dzhardimalieva, G.I.; Golubeva, N.D.; Srivastava, P. Synthesis and characterization of nanostructured MnO 2–CoO and its relevance as an opto-electronic humidity sensing device. RSC Adv. 2018, 8, 20534–20542. [Google Scholar] [CrossRef] [Green Version]
  16. Paramasivam, I.; Macak, J.M.; Schmuki, P. Photocatalytic activity of TiO2 nanotube layers loaded with Ag and Au nanoparticles. Electrochem. Commun. 2018, 10, 71–75. [Google Scholar] [CrossRef]
  17. Rodriíguez, J.; Evans, J.; Graciani, J.; Park, J.B.; Liu, P.; Hrbek, J.; Sanz, J.F. High Water−Gas Shift Activity in TiO2(110) Supported Cu and Au Nanoparticles: Role of the Oxide and Metal Particle Size. J. Phys. Chem. C 2009, 113, 7364–7370. [Google Scholar] [CrossRef]
  18. Liang, Y.C.; Liu, S.L. Synthesis and enhanced humidity detection response of nanoscale Au-particle-decorated ZnS spheres. Nanoscale Res. Lett. 2014, 9, 1–7. [Google Scholar] [CrossRef] [Green Version]
  19. Mintcheva, N.; Srinivasan, P.; Rayappan, J.B.B.; Kuchmizhak, A.A.; Gurbatov, S.; Kulinich, S.A. Room-temperature gas sensing of laser-modified anatase TiO2 decorated with Au nanoparticles. Appl. Surf. Sci. 2020, 507, 145169. [Google Scholar] [CrossRef]
  20. Buso, D.; Post, M.; Cantalini, C.; Mulvaney, P.; Martucci, A. Gold nanoparticle-doped TiO2 semiconductor thin films: Gas sensing properties. Adv. Funct. Mater. 2008, 18, 3843–3849. [Google Scholar] [CrossRef] [Green Version]
  21. Abbasi, A.; Sardroodi, J.J. A novel nitrogen dioxide gas sensor based on TiO2-supported Au nanoparticles: A van der Waals corrected DFT study. J. Nanostructure Chem. 2017, 7, 121–132. [Google Scholar] [CrossRef]
  22. Chomkitichai, W.; Tamaekong, N.; Liewhiran, C.; Wisitsoraat, A.; Sriwichai, S.; Phanichphant, S. H2 Sensor Based on Au/TiO2 Nanoparticles by Flame-Made. Eng. J. 2012, 16, 135–142. [Google Scholar] [CrossRef] [Green Version]
  23. Cappelli, I.; Fort, A.; Mugnaini, M.; Panzardi, E.; Pozzebon, A.; Tani, M.; Vignoli, V. Battery-Less HF RFID Sensor Tag for Soil Moisture Measurements. IEEE Trans. Instrum. Meas. 2020, 70, 1–13. [Google Scholar] [CrossRef]
  24. Fort, A.; Panzardi, E.; Vignoli, V.; Landi, E.; Trigona, C.; Mugnaini, M. Performance Analysis of a Humidity Sensor Based on a Microresonator Functionalized with TiO2 Nanoparticles. IEEE Trans. Instrum. Meas. 2020, 69, 7999–8008. [Google Scholar]
  25. Chu, Y.L.; Young, S.J.; Ding, R.J.; Chu, T.T.; Lu, T.S.; Ji, L.W. Improving ZnO nanorod humidity sensors with Pt nanoparticle adsorption. ECS J. Solid State Sci. Technol. 2021, 10, 037003. [Google Scholar] [CrossRef]
  26. Fort, A.; Panzardi, E.; Vignoli, V.; Hjiri, M.; Aida, M.S.; Mugnaini, M.; Addabbo, T. Co3O4/Al-ZnO nano-composites: Gas sensing properties. Sensors 2019, 19, 760. [Google Scholar] [CrossRef] [PubMed] [Green Version]
  27. Addabbo, T.; Fort, A.; Mugnaini, M.; Vignoli, V.; Baldi, A.; Bruzzi, M. Quartz-crystal microbalance gas sensors based on TiO2 nanoparticles. IEEE Trans. Instrum. Meas. 2018, 67, 722–730. [Google Scholar] [CrossRef]
  28. Gao, J.; Meng, Y.; Benton, A.; He, J.; Jacobsohn, L.G.; Tong, J.; Brinkman, K.S. Insights into the Proton Transport Mechanism in TiO2 Simple Oxides by In Situ Raman Spectroscopy. ACS Appl. Mater. Interfaces 2020, 12, 38012–38018. [Google Scholar] [CrossRef] [PubMed]
  29. Horikawa, T.; Do, D.D.; Nicholson, D. Capillary condensation of adsorbates in porous materials. Adv. Colloid Interface Sci. 2011, 169, 40–58. [Google Scholar] [CrossRef]
  30. Rouquerol, J.; Sing, K.S.W.; Maurin, G.; Llewellyn, P. Introduction. In Adsorption by Powders and Porous Solids: Principles, Methodology and Applications; Academic Press: Oxford, UK, 2014; pp. 1–24. [Google Scholar]
  31. Morishige, K.; Nakamura, Y. Nature of adsorption and desorption branches in cylindrical pores. Langmuir 2004, 20, 4503–4506. [Google Scholar] [CrossRef]
  32. Kano, S.; Mekaru, H. Nonporous Inorganic Nanoparticle-Based Humidity Sensor: Evaluation of Humidity Hysteresis and Response Time. Sensors 2020, 20, 3858. [Google Scholar] [CrossRef]
  33. Fujitani, T.; Nakamura, I.; Takahashi, A. H2O Dissociation at the Perimeter Interface between Gold Nanoparticles and TiO2 Is Crucial for Oxidation of CO. ACS Catal. 2020, 10, 2517–2521. [Google Scholar] [CrossRef]
  34. Koga, H.; Tada, K.; Okumura, M. Density Functional Theory Study of Active Oxygen at the Perimeter of Au/TiO2 Catalysts. J. Phys. Chem. C 2015, 119, 25907–25916. [Google Scholar] [CrossRef]
  35. Uner, D.; Tapan, N.A.; Özen, I.; Üner, M. Oxygen adsorption on Pt/TiO2 catalysts. Appl. Catal. A Gen. 2003, 251, 225–234. [Google Scholar] [CrossRef]
  36. Li, Z.; Haidry, A.A.; Gao, B.; Wang, T.; Yao, Z. The effect of Co-doping on the humidity sensing properties of ordered mesoporous TiO2. Appl. Surf. Sci. 2017, 412, 638–647. [Google Scholar] [CrossRef]
  37. Zhang, H.; Yu, S.; Chen, C.; Zhang, J.; Liu, J.; Li, P. Effects on structure, surface oxygen defects and humidity performance of Au modified ZnO via hydrothermal method. Appl. Surf. Sci. 2019, 486, 482–489. [Google Scholar] [CrossRef]
  38. Maurya, D.K.; Sikarwar, S.; Chaudhary, P.; Angaiah, S.; Yadav, B.C. Synthesis and Characterization of Nanostructured Copper Zinc Tin Sulphide (CZTS) for Humidity Sensing Applications. IEEE Sens. J. 2019, 19, 2837–2846. [Google Scholar] [CrossRef]
Figure 1. Test device structure.
Chemosensors 09 00170 g001
Figure 2. Measurement system block diagram.
Chemosensors 09 00170 g002
Figure 3. Front-end circuit used during the acquisition with the IP68 measurement chamber; inside the chamber are housed the temperature sensor LM35 (highlighted in green), the humidity sensor HIH-4000 (highlighted in blue) and the functionalized substrate (highlighted in magenta).
Chemosensors 09 00170 g003
Figure 4. Equivalent electrical circuit of the sensing device.
Chemosensors 09 00170 g004
Figure 5. Simplified description of the contributions to charge transport phenomena for TiO2 in a humid environment. The red arrows represent the current paths in the different layers and in the TiO2 film.
Chemosensors 09 00170 g005
Figure 6. XRD pattern of the anatase sample (intensity in arbitrary units vs. diffraction angle 2θ), with representative d-spacings (Å) and corresponding lattice planes (Miller indexes in brackets).
Chemosensors 09 00170 g006
Figure 7. Bright-field TEM images of nanometric anatase with scale bar 20 nm (a) and 10 nm (b). The inset in Figure 7a shows a representative SAED pattern with ring shaped diffraction effects, due to randomly oriented nanocrystals. The orange arrows point the 3.5 Å (101) reflection. Orange dashed lines in both images highlight single-crystal anatase, in variable orientation.
Chemosensors 09 00170 g007
Figure 8. Bright-field TEM image of the Au nanoparticles (scale bar = 100 nm).
Chemosensors 09 00170 g008
Figure 9. Impedance of the tested sensing devices in the range 50 Hz−80 kHz: (a) TiO2 sample; (b) TiO2Au1 sample; (c) TiO2Au2 sample. The reported measurements were obtained after 1 h of exposure to constant and controlled RH levels as per legend.
Chemosensors 09 00170 g009aChemosensors 09 00170 g009b
Figure 10. Impedance magnitude (a) and phase (b) of the tested sensing devices as a function of the RH value measured with the commercial sensor in the measurement chamber, evaluated at 100 Hz (upper plots), 33 kHz (middle plots), and 77 kHz (lower plots), respectively.
Chemosensors 09 00170 g010
Figure 11. (a) Impedance Nyquist plots in the frequency range 50 Hz–80 kHz at different and constant RH levels for the pure TiO2 sample; solid-colored lines: experimental data (as per legend); dotted lines: equivalent model fitting results. (b) Estimated parameters of the equivalent circuits: R1 (upper left plot), C1 (upper right plot), C2 (lower left plot) and α (lower right plot).
Chemosensors 09 00170 g011
Figure 12. (a) Impedance Nyquist plot in the frequency range 50 Hz–80 kHz at different and constant RH levels for the TiO2Au2 sample; solid-colored lines: experimental data at different RH levels (as per legend); dashed red lines: equivalent model fitting results. (b) Estimated parameters of the fitted equivalent circuits: R1 (upper left plot), C1 (upper right plot), C2 (lower left plot) and α (lower right plot).
Chemosensors 09 00170 g012
Figure 13. Measured sensing film admittance magnitude at 100 Hz as a function of the RH value measured with the commercial sensor in the measurement chamber for increasing (10–100%) and decreasing (100–10%) RH levels: (a) TiO2 sample; (b) TiO2Au1 sample; (c) TiO2Au2 sample.
Chemosensors 09 00170 g013
Figure 14. Dynamical response of the TiO2 (blue line) and TiO2Au2 (red line) sensing films to increasing RH steps. The middle plot shows the measured sensing-film admittance magnitude |Ys| versus time. During the measurements, increasing 10% RH steps of 30 min were applied (upper plot, where the dashed black line refers to the theoretical RH level set in the measurement chamber). The RH (upper plot) and the temperature (lower plot) were measured with the commercial sensors in the measurement chamber.
Chemosensors 09 00170 g014
Figure 15. Dynamical response of the TiO2 (blue line) and TiO2Au2 (red line) sensing films to increasing RH pulses. The middle plots show the measured sensing-film admittance magnitude variations |Ys–Y0| versus time, where |Y0| is the film admittance at a reference RH level. During the measurements, increasing RH pulses steps of 30 min were applied followed by 30 min of recovery at 0% RH (upper plot, where the dashed black lines refer to the theoretical RH level set in the measurement chamber): (a) 25%, 50%, 75%, and 100% RH pulses; (b) 20%, 40%, and 60% RH pulses. The RH (upper plots) and the temperature (lower plots) were measured with the commercial sensors in the measurement chamber.
Chemosensors 09 00170 g015
Figure 16. Dynamical response of the TiO2 (red line), TiO2Au1 (green line), and TiO2Au2 (blue line) sensing films to increasing RH pulses. The plot shows the measured sensing-film impedance magnitude |Zs| versus time in presence of RH pulses (30 min phases at different RH in the range 70–100% followed by 30 min 0% RH phases).
Chemosensors 09 00170 g016
Table 1. Complete XRD experimental data.
Pos. [2Th.]Height [cts]FWHM [2Th.]D-Spacing [Å]Rel. Int. [%]
25.3725843.940.60223.51045100.00
25.6883716.440.26763.4680084.89
28.357159.380.20073.147397.04
29.350964.420.10043.043067.63
32.451235.440.10042.759064.20
35.823026.970.53532.506723.20
38.0000169.830.40152.3679820.12
39.8060101.830.05022.2646112.07
42.277316.160.80292.137771.91
54.4178117.460.93681.6860813.92
62.975128.880.53531.476003.42
67.989518.530.33461.378852.20
68.918951.980.24481.361386.16
Publisher’s Note: MDPI stays neutral with regard to jurisdictional claims in published maps and institutional affiliations.

