Article

A High-Response Electrochemical As(III) Sensor Using Fe3O4–rGO Nanocomposite Materials

1
Academy of Opto-Electric Technology, Special Display and Imaging Technology Innovation Center of Anhui Province, National Engineering Laboratory of Special Display Technology, State Key Laboratory of Advanced Display Technology, Collaborative Innovation Center of Advanced Display Technology, Anhui Key Laboratory of Advanced Imaging and Display Technology, Opto-Electric Display Industry Innovation Center, Anhui Province Key Laboratory of Measuring Theory and Precision Instrument, School of Instrument Science and Optoelectronics Engineering, Hefei University of Technology, Hefei 230009, China
2
School of Mechanical Engineering, Southeast University, Nanjing 211189, China
*
Author to whom correspondence should be addressed.
Chemosensors 2021, 9(6), 150; https://doi.org/10.3390/chemosensors9060150
Submission received: 15 May 2021 / Revised: 15 June 2021 / Accepted: 16 June 2021 / Published: 18 June 2021
(This article belongs to the Special Issue Chemical Sensors Based on Organic-Inorganic Nanocomposites)

Abstract

:
Nowadays, heavy metal ion pollution in water is becoming more and more common, especially arsenic, which seriously threatens human health. In this work, we used Fe3O4–rGO nanocomposites to modify a glassy carbon electrode and selected square wave voltametric electrochemical detection methods to detect trace amounts of arsenic in water. Field emission scanning electron microscopy (FESEM) and transmission electron microscopy (TEM) showed that Fe3O4 nanoparticles were uniformly distributed on the rGO sheet, with a particle size of about 20 nm. Raman spectroscopy and electrochemical impedance spectroscopy (EIS) showed that rGO provides higher sensitivity and conductive substrates. Under optimized experimental conditions, Fe3O4–rGO-modified glassy carbon electrodes showed a higher sensitivity (2.15 µA/ppb) and lower limit of detection (1.19 ppb) for arsenic. They also showed good selectivity, stability, and repeatability.

1. Introduction

With the increasing frequency of human activities and the development of society, heavy metal ion pollution in water has become a thorny issue affecting human health. To detect heavy metal ions in water, the main detection methods are chromatography, mass spectrometry, atomic absorption spectroscopy, fluorescence spectroscopy, etc. Nowadays, electronic tongues are also being developed for heavy metal detection [1]. These detection methods often rely on complex instruments, complex sample preparation processes, expensive maintenance costs, and high-quality operators, and they are not well applicable to daily on-site inspections. In contrast, the advantages of electrochemical detection are its high sensitivity, high field applicability, low cost, and accurate measurements in a short time [2]. On the basis of electrochemical detection, microfluidic detection has also been developed [3].
Among the types of heavy metal pollution in water, the pollution caused by arsenic ions is very serious, and it has spread to many countries around the world. Arsenic is a naturally occurring toxic chemical element and one of the substances recognized in the world as causing serious harm to the environment. Arsenic exists in four valence forms, namely, −3, 0, +3, and +5. Among these, arsenic exists in two valence states of +3 and +5 in water. Moreover, As(III) is about 60 times more toxic than As(V), and the solubility of As(III) in water is about 50 times higher than that of As(V) [4,5]. Arsenic poisoning can cause serious damage to the skin, respiratory system, digestive system, nervous system, etc., and even cause death. Therefore, the World Health Organization (WHO) has strict standards for the content of arsenic in drinking water, and the maximum threshold is 10 ppb. Therefore, real-time detection of the arsenic concentration in water is very important.
Nowadays, there are many methods for detecting the As(III) concentration, such as atomic emission spectrometry, atomic absorption spectrometry, and surface enhanced Raman scattering methods. These methods often require expensive instruments and experienced operators, and samples also require cumbersome processing procedures. In contrast, electrochemical detection methods are not only portable but also easy to operate. Therefore, the electrochemical method was finally selected for the experiment herein. Nowadays, the most commonly used electrode materials for arsenic determination are precious metals such as gold [6,7]. Gold can form an As–Au bimetallic alloy with arsenic. Although these noble metals are used to modify the electrodes, there are certain disadvantages that make them unsuitable for a large number of detections, for example, the high price of precious metals and the need to conduct experimental operations under strong acid conditions can generate toxic arsine gas. Therefore, it is necessary to select new cost-effective materials to make up for this deficiency [8].
In recent years, for the detection of arsenic, carbon and related compounds have become the second most common choice after metals. Among them, nanoparticles are widely used due to their high surface area and charge density [9]. By using graphene and its compounds to modify the electrode, considerable sensitivity and detection limits have been obtained. When graphene and its derivatives are matched with other different materials, different substances can be detected, such as copper, lead, chromium, nickel, and other pollutants [10,11], chlorophenols that are toxic to aquatic organisms [12], melatonin and pyridoxine in plants [13], ascorbic acid, dopamine, and uric acid [14].
Glassy carbon electrodes (GCEs) modified with exfoliated graphene oxide have been reported as one detection material for arsenic [15]. Kempegowda et al. developed a graphene–Pt nanocomposite material. The detection limit of arsenic in water by cyclic voltammetry (CV) and square wave anodic stripping voltammetry (SWASV) is 1.1 nM [16]. They also developed a rGO–lead dioxide composite material to detect arsenic, and attained a detection limit of 10 nM. As iron oxide has the characteristics of being environmentally friendly, easy to prepare, cheap, and fast in electron transmission, its application prospects are very broad. Further, the composite material of graphene, iron oxide, and copper oxide has been proved to have good adsorption and removal capabilities for arsenic in water [17,18,19]. Graphene is a flat material. Due to its super large surface area, super high electron transfer rate, and excellent electrocatalytic performance, it has been widely used in various fields [20,21].
Therefore, in consideration of the reliability, repeatability, and low cost of detection, we chose a nanocomposite of ferroferric oxide–rGO to measure the concentration of arsenic in water by modifying the electrode. By optimizing the experimental parameters, we obtained test results and conducted anti-interference and stability experiments. Among them, Fe3O4 nanomaterials were prepared with an Fe2+/Fe3+ ratio of 1:2, and rGO was reduced by hydrazine hydrate, which is slightly different from the preparation process in other papers. In addition, the sensitivity we obtained is higher than that in other papers, and the detection limit is also consistent with the 10 ppb standard stipulated by the WHO.

2. Experimental

2.1. Materials/Chemicals

Graphene oxide (GO, 96%) was purchased from Shenzhen Guohengqihang Technology Company (Guangdong, China). Anhydrous iron trichloride (FeCI3), ferrous chloride tetrahydrate (FeCI2·4H2O), ammonia, hydrazine hydrate (N2H4), potassium chloride (KCI), potassium ferricyanide (K3[Fe(CN)6]), arsenic standard solution (As(III)), and phosphate buffer solution (pH = 2, 3, 4, 5, 6). The reagents for interference ion detection were all purchased from Hefei Baierdi Chemical Technology Co., Ltd (Anhui, China). The deionized (DI) water used in the experiment was prepared by an ultrapure water machine. All experiments were performed at room temperature.

2.2. Instrumentation

All electrochemical tests were carried out using the CHI760e electrochemical workstation equipped with a three-electrode system. The bare or modified glassy carbon electrode was the working electrode, the platinum wire electrode was the counter electrode, and the calomel electrode containing saturated KCI was the reference electrode. The morphology and structure were characterized by Fourier transform infrared spectroscopy (FTIR, Nicolet, Thermo Fisher Scientific, Waltham, Commonwealth of Massachusetts, USA), field emission scanning electron microscopy (Gemini 500 SEM microscope, Carl Zeiss, Oberkochen, Baden Wurttemberg, Germany), and transmission electron microscopy (JEM 2100F, JEOL, Akishima-shi, Tokyo, Japan). Raman spectroscopy was performed using a Raman spectrometer (LabRam HR Evolution, HORIBA Jobin Yvon, Paris, France) with an excitation wavelength of 532 nm. Before each measurement, we used a pH meter (Shanghai Lei Magnetic, pHS-3C, Lei Magnetic, Shanghai, China) to adjust the pH value.

2.3. Synthesis of Fe3O4–rGO Nanocomposites

In order to obtain ideal Fe3O4 nanoparticles, the molar ratio of Fe3+ to Fe2+ is 2:1. First, with sonication, we dispersed 0.1 g of GO in 50 mL of deionized water. Then, 0.002 mol of FeCI3 and 0.001 mol of FeCI2·4H2O were dissolved in 10 mL of deionized water, then added dropwise to the GO solution at room temperature while stirring vigorously. After the ion exchange, ammonia was added dropwise to bring the pH value of the solution to 10, which was used to synthesize Fe3O4 nanocomposites. Then, the solution was heated to 80 degrees Celsius by a water bath; 1.1 mL of hydrazine hydrate was added under constant stirring to reduce the GO to obtain a black solution and then quickly stirred at 80 degrees Celsius for 5 h and cooled to room temperature.
The Fe3O4–rGO nanocomposites were obtained, then washed thoroughly with absolute ethanol and collected magnetically, and they were finally dried overnight at room temperature in a fume hood.

2.4. Preparation of the Fe3O4–rGO-Nanocomposite-Modified Electrode

Before modifying the electrode, the working electrode was polished with 1.0 micron, 0.3 micron, and 0.05 micron alumina slurry in sequence, then tested by cyclic voltammetry (CV) in a mixture of 5 mmol/L K3[Fe(CN)6] and 0.1 mol/L KCI from −0.2 V to 0.8 V. If the peak potential difference was within 80 mV, the working electrode was considered polished clean; otherwise, we repeated the polishing process (Figure S1). Then, we washed the working electrode with deionized water and dried it in a dust-free box.
To prepare the modified electrode, the synthesized Fe3O4–rGO nanocomposites were dispersed in a concentration of 1 mg/mL, and then 8 μL of Fe3O4–rGO nanocomposite solution was dropped onto the surface of the working electrode and dried in a dust-free box.

2.5. Electrochemical Measurements

The electrochemical measurement was performed using a three-electrode configuration system. For the electrochemical sensing experiment, CV and electrochemical impedance spectroscopy (EIS) were used to measure under the conditions of 0.1 M KCl and 5 mM K3[Fe(CN)6]. For the detection of As(III), it was measured in a phosphate buffer solution. Firstly, it was deposited at −0.4 V for 150 s, then we used square wave voltammetry (SWV) to measure, and it was finally desorbed at 0.4 V for 150 s. The parameters of SWV were: potential range: −0.2 V to 0.6 V, potential increment: 0.004 V, amplitude: 0.025 V, and frequency: 40 Hz.

3. Results and Discussion

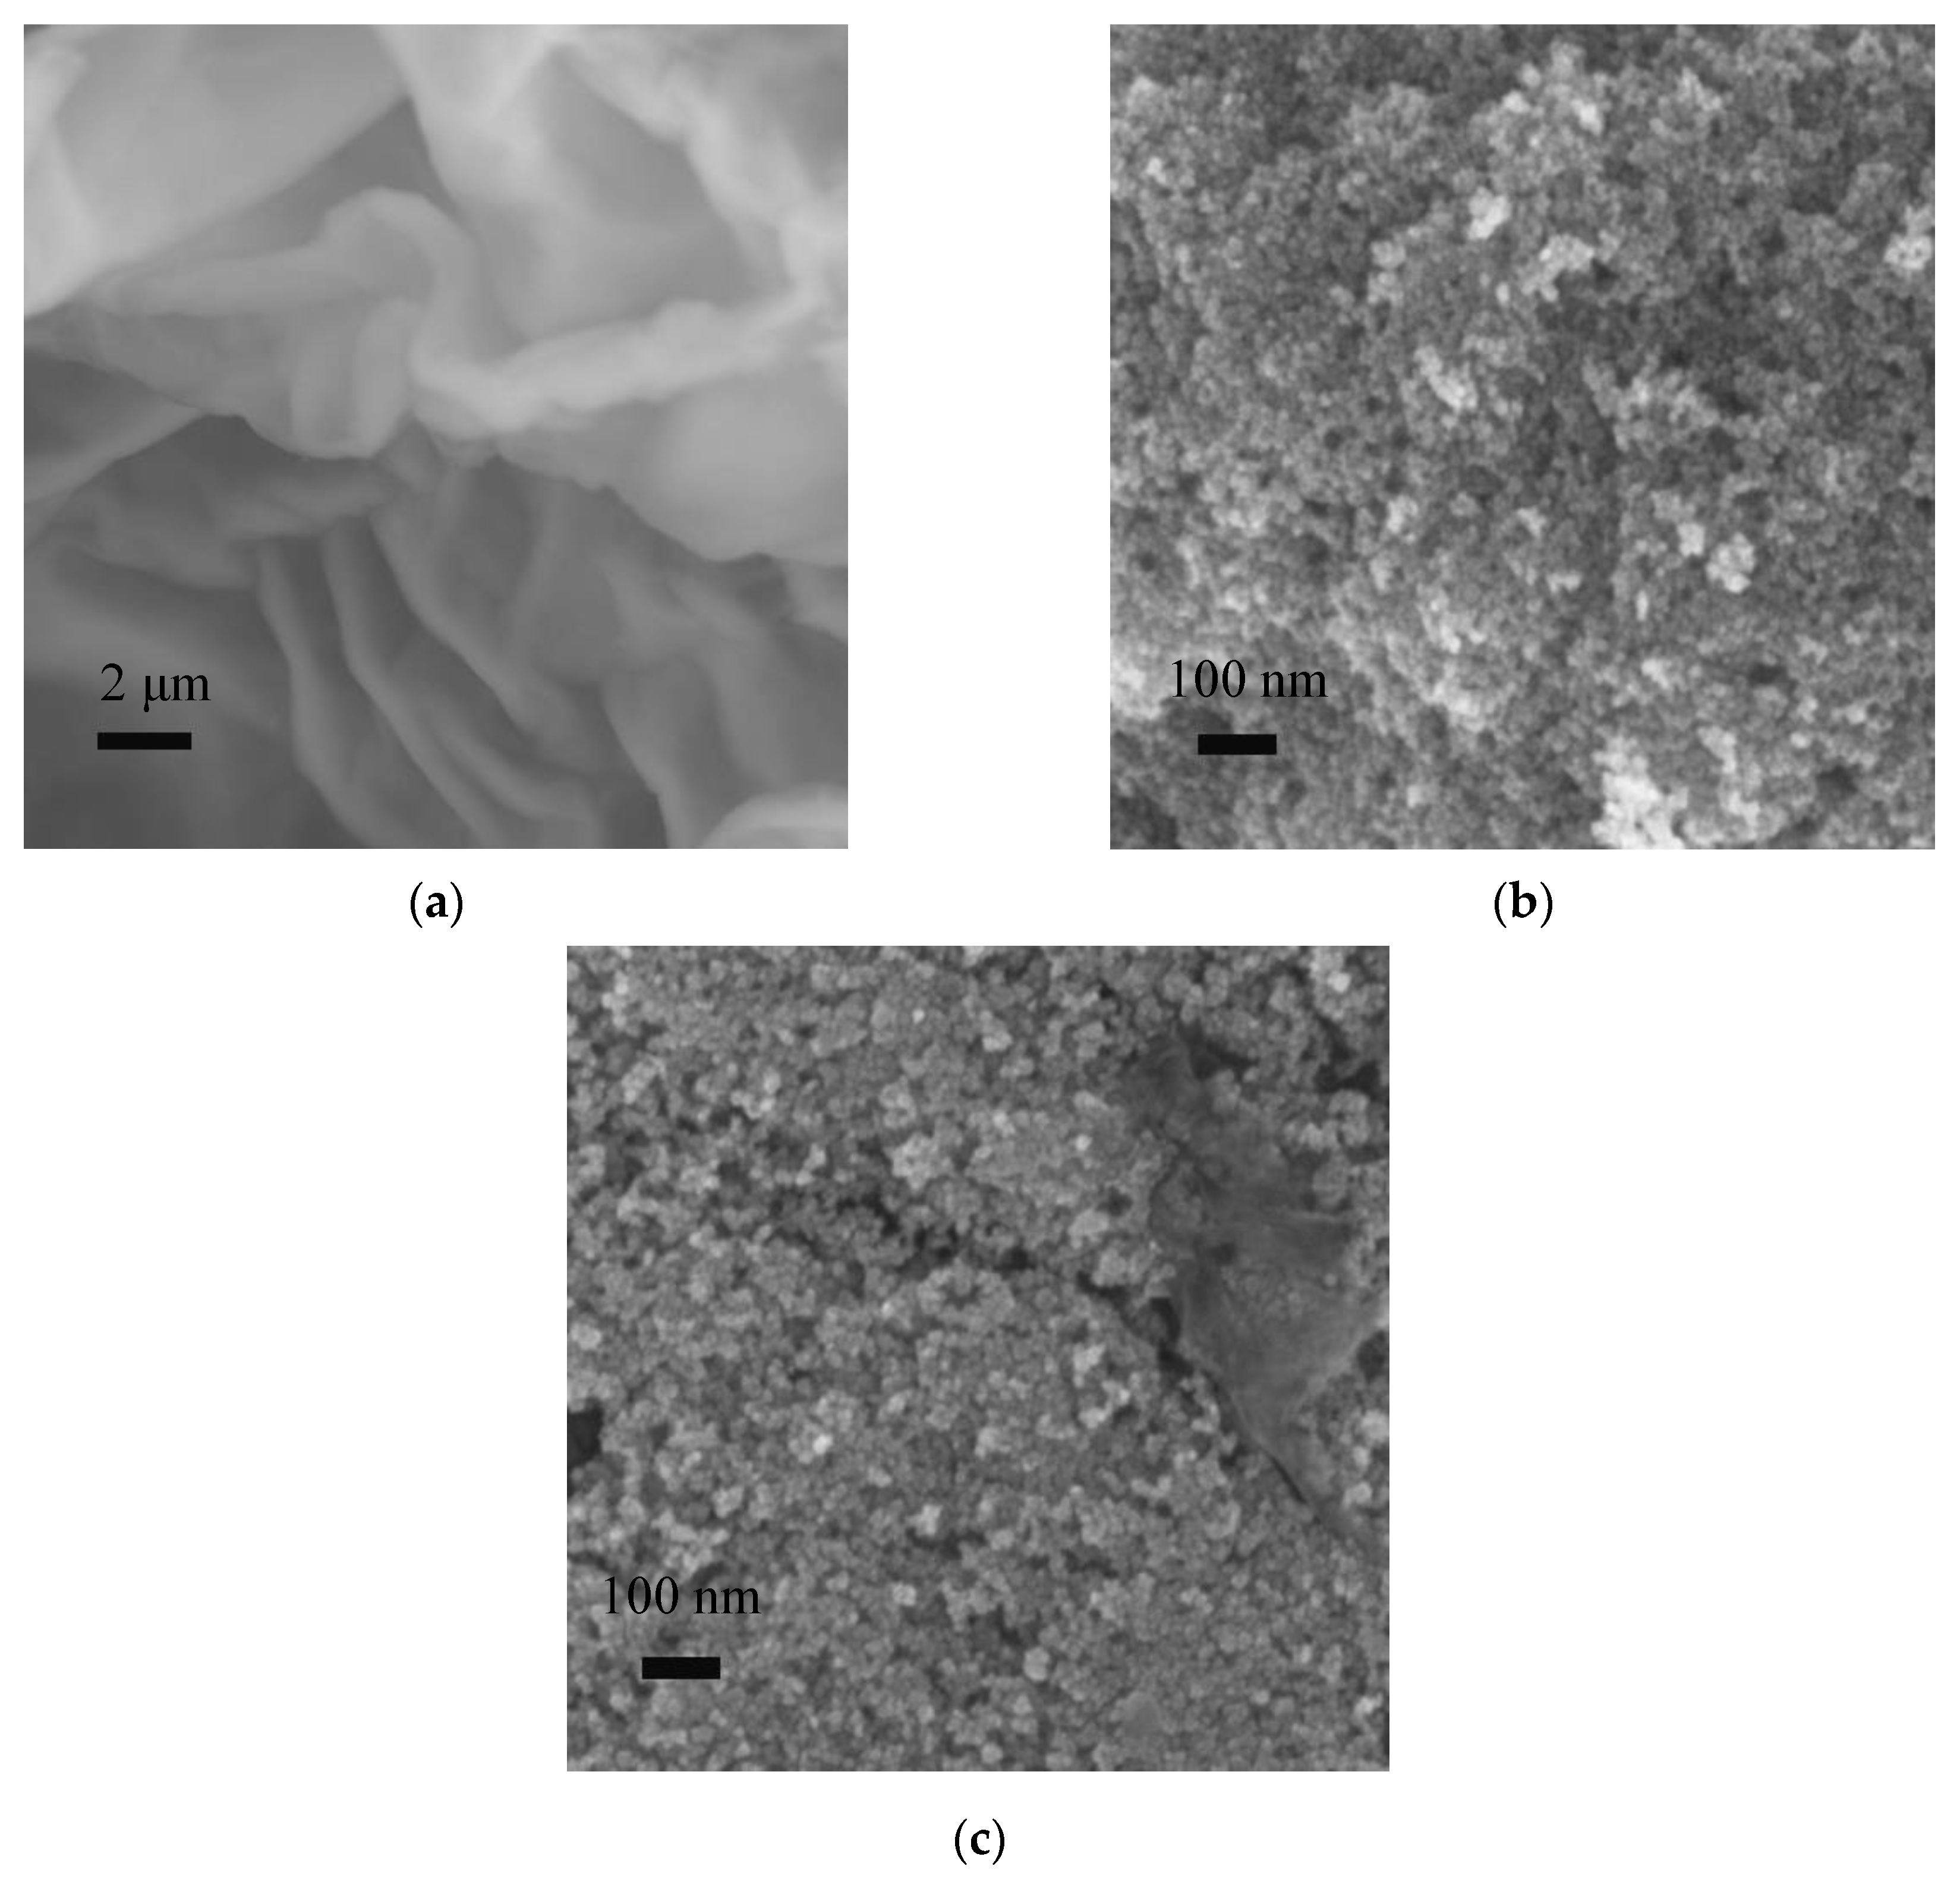
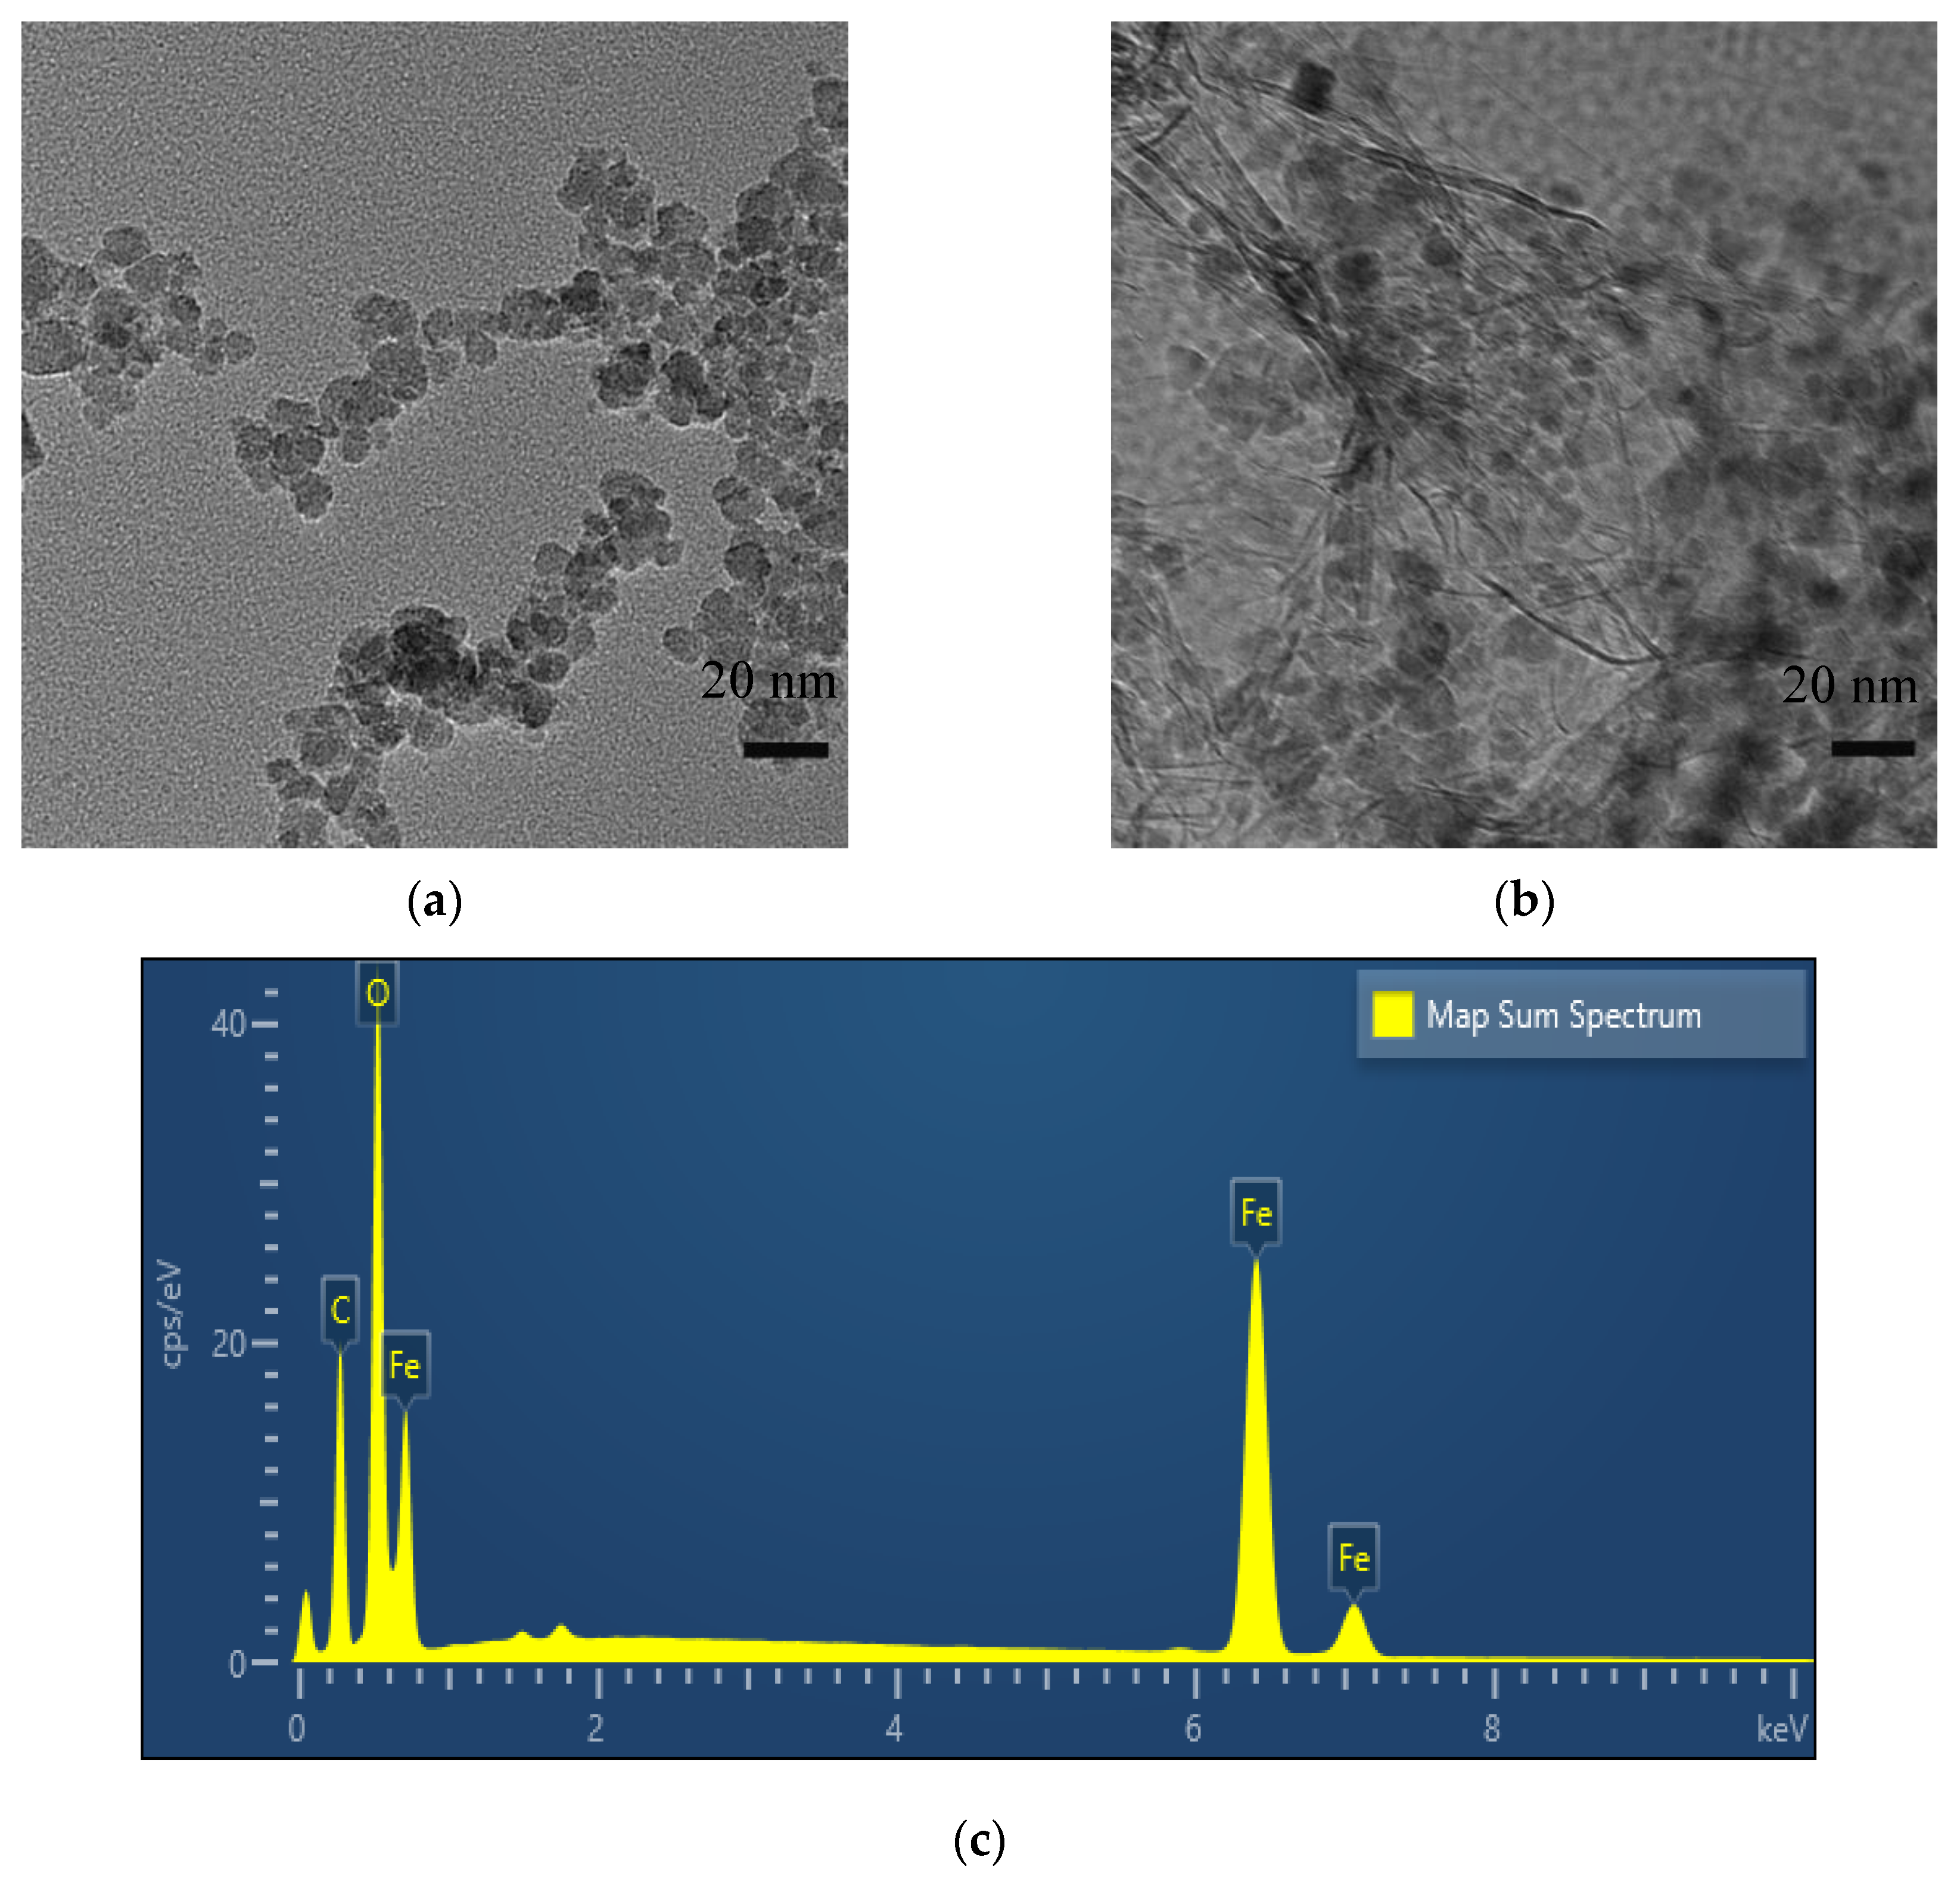
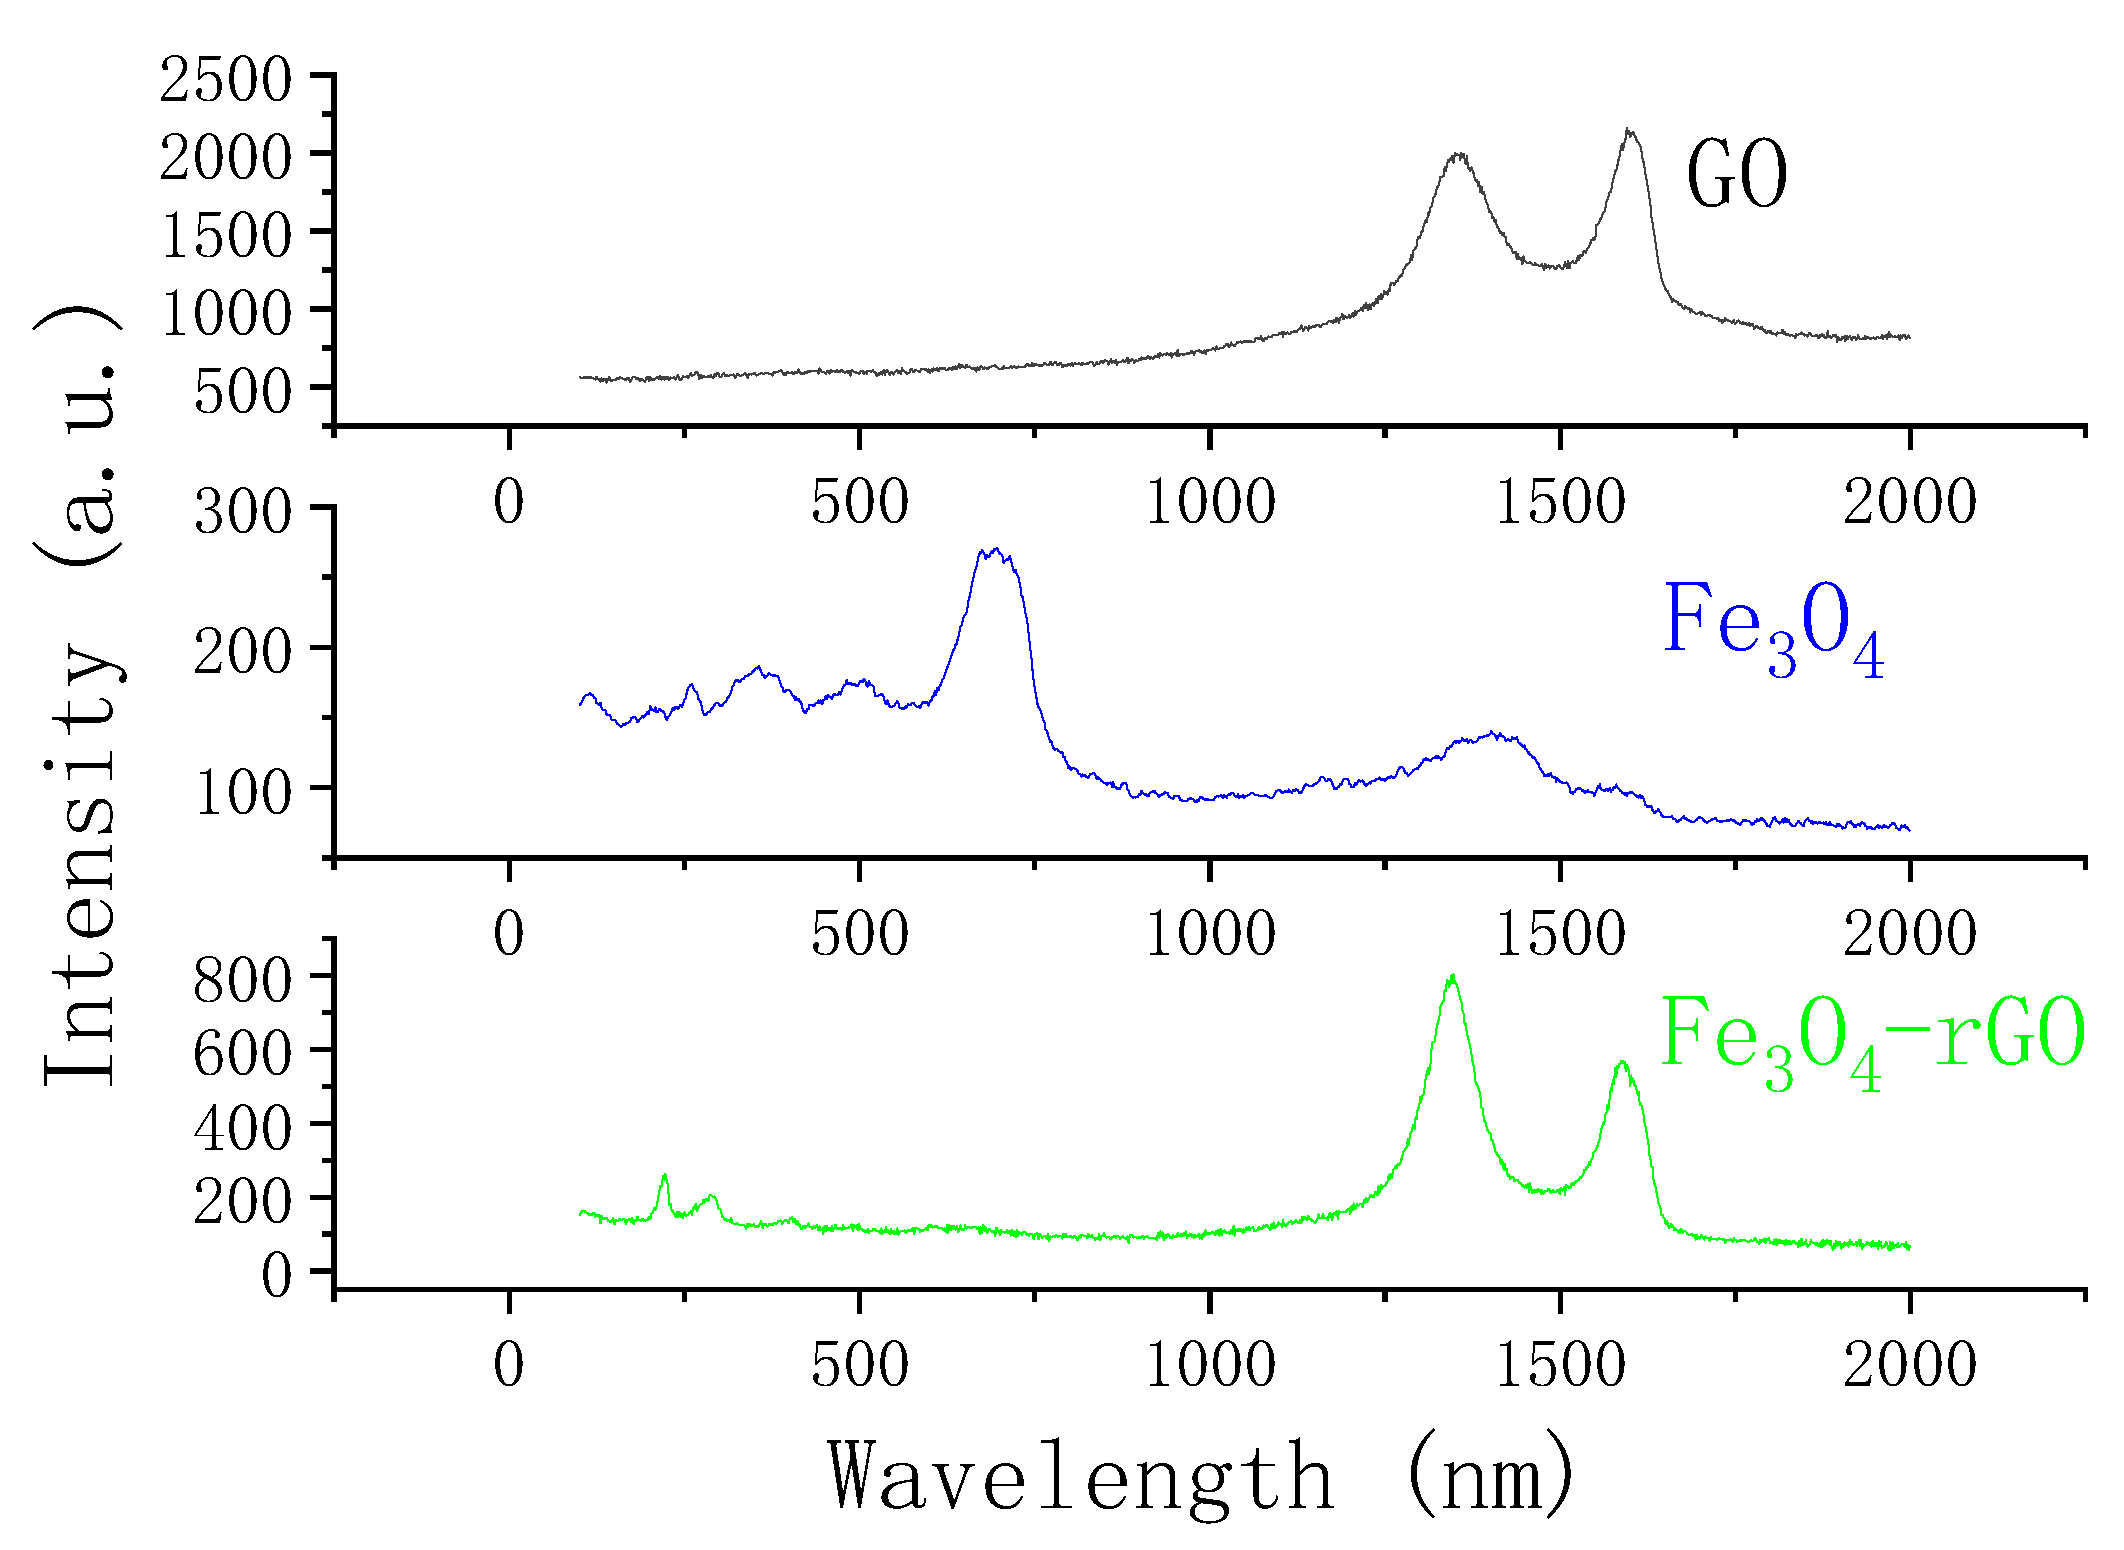
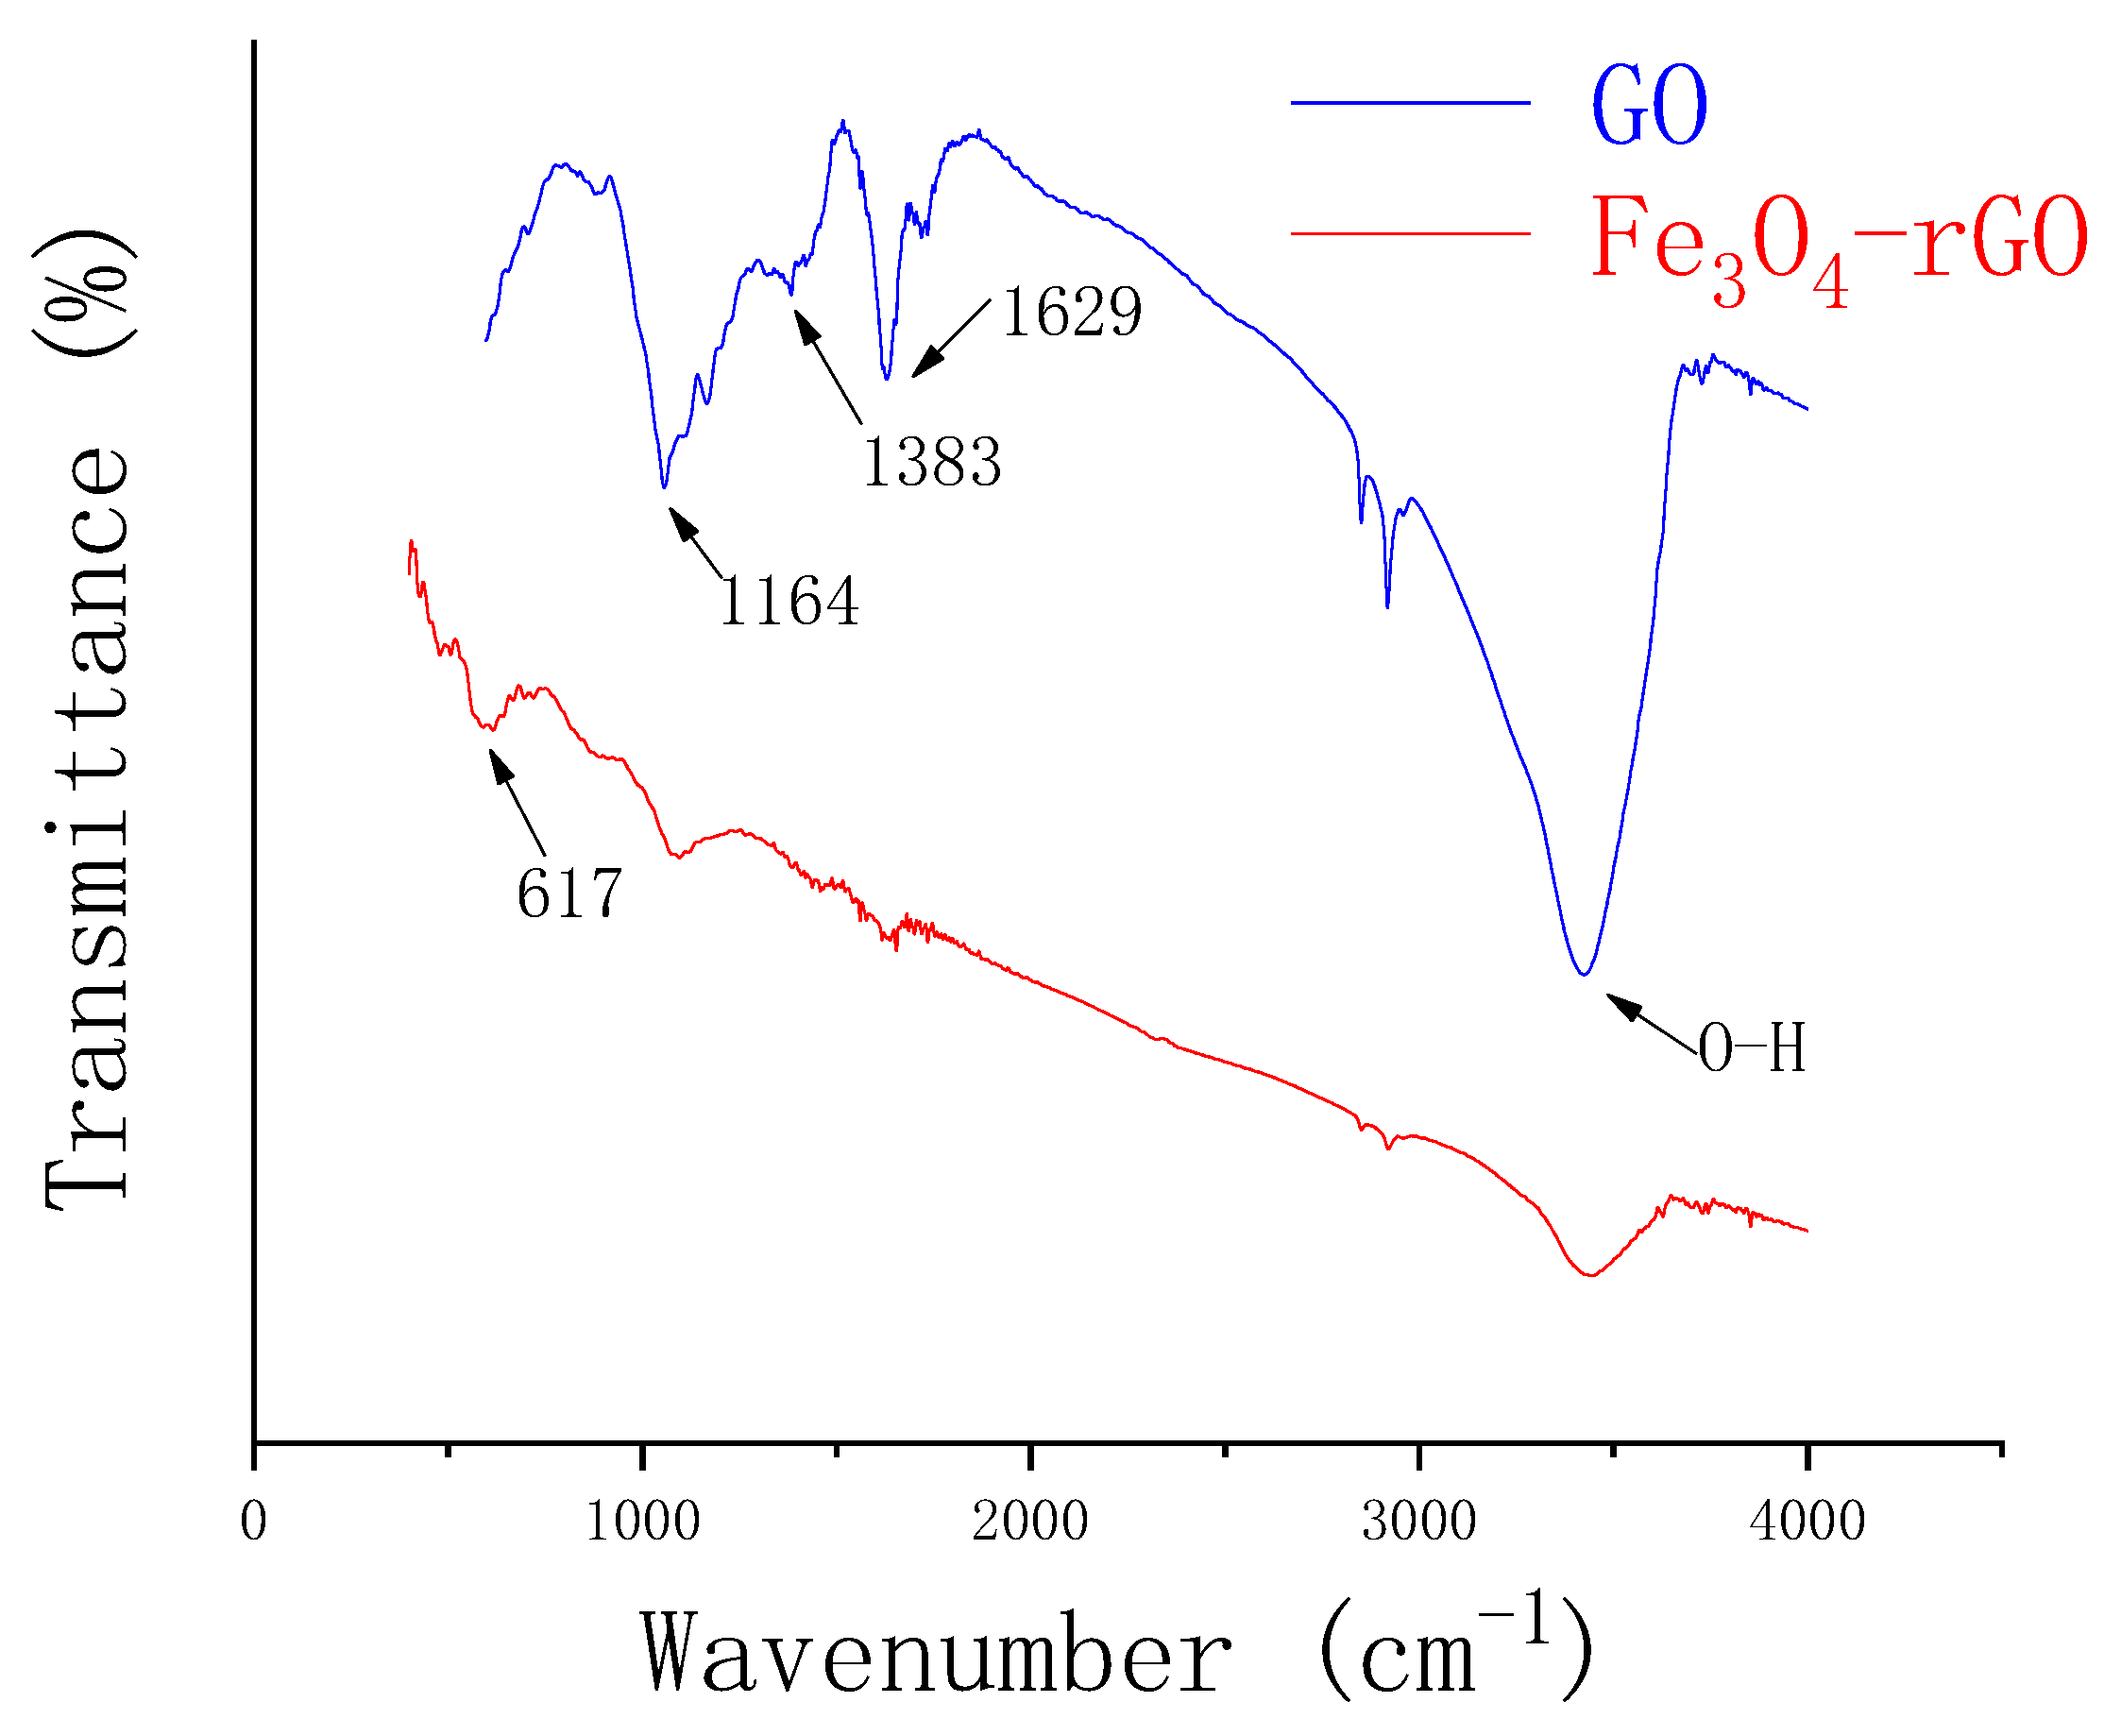
3.1. Characterization of Fe3O4–rGO Nanocomposites

The morphology and structural properties of GO, Fe3O4, and Fe3O4–rGO were tested by SEM, TEM, FTIR, and Raman spectroscopy. Figure 1a is a typical SEM image of GO, from which we can see the smooth surface of GO and its obvious flake structure. Figure 1b is a SEM image of Fe3O4. Fe3O4 nanoparticles are clearly visible and agglomerated due to magnetic properties. Figure 1c is a SEM picture of Fe3O4–rGO. It can be seen that Fe3O4 nanoparticles are assembled and distributed widely and densely on rGO. Figure 2a is a TEM picture of Fe3O4 nanoparticles. By comparing with the standard width of 20 nm, it was found that the particle size was about 20 nm, which proves the success of Fe3O4 nanoparticle synthesis. Figure 2b is a TEM picture of Fe3O4–rGO nanocomposite. It can be seen that Fe3O4 nanoparticles are attached to the layered rGO. Figure 2c is the EDS diagram of Fe3O4–rGO nanocomposite. We can clearly see the relevant elements, mainly Fe, O, and C. There are no other interfering elements mixed in during the manufacturing process, which also proves that the preparation of Fe3O4–rGO nanocomposite was successful.
Raman is a non-destructive testing technique to identify the type of materials. As shown in Figure 3, under the excitation wavelength of 532 nm, three kinds of materials—GO, Fe3O4, and Fe3O4–rGO—were analyzed by Raman spectroscopy. The results show that GO has two characteristic peaks at 1359 nm and 1595 nm, which are attributed to the D and G bands, respectively, and the intensity ratio (ID:IG) is 0.93. In Fe3O4–rGO, the two characteristic peaks shifted to 1347 nm and 1587 nm, respectively, and the strong contrast between the D-band and G-band (ID:IG) also increased significantly to 1.4. The reason for this may be the existence of sp3 defects in the sp2 cluster during the GO reduction process, or the increase in size of the sp2 domain due to the introduction of Fe3O4 nanoparticles [22]. For Fe3O4 nanoparticles, its characteristic peak exists at 695 nm, which also indicates the successful synthesis of Fe3O4 nanoparticles [23].
As shown in Figure 4, the FTIR images of GO and Fe3O4–rGO reveal the relevant functional groups. In the FTIR image of GO, the peak at 3500 cm−1 is -OH, that at 1629 cm−1 is the stretching mode of the sp2 C network in the aromatic ring, that at 1383 cm−1 is O=C-O, and that at 1164 cm−1 is C-OH. In the image for Fe3O4–rGO, the peak at 617 cm−1 is the characteristic peak of Fe3O4, while at the -OH peak, compared with that for GO, the band is wider and the peak intensity is also reduced [24,25].

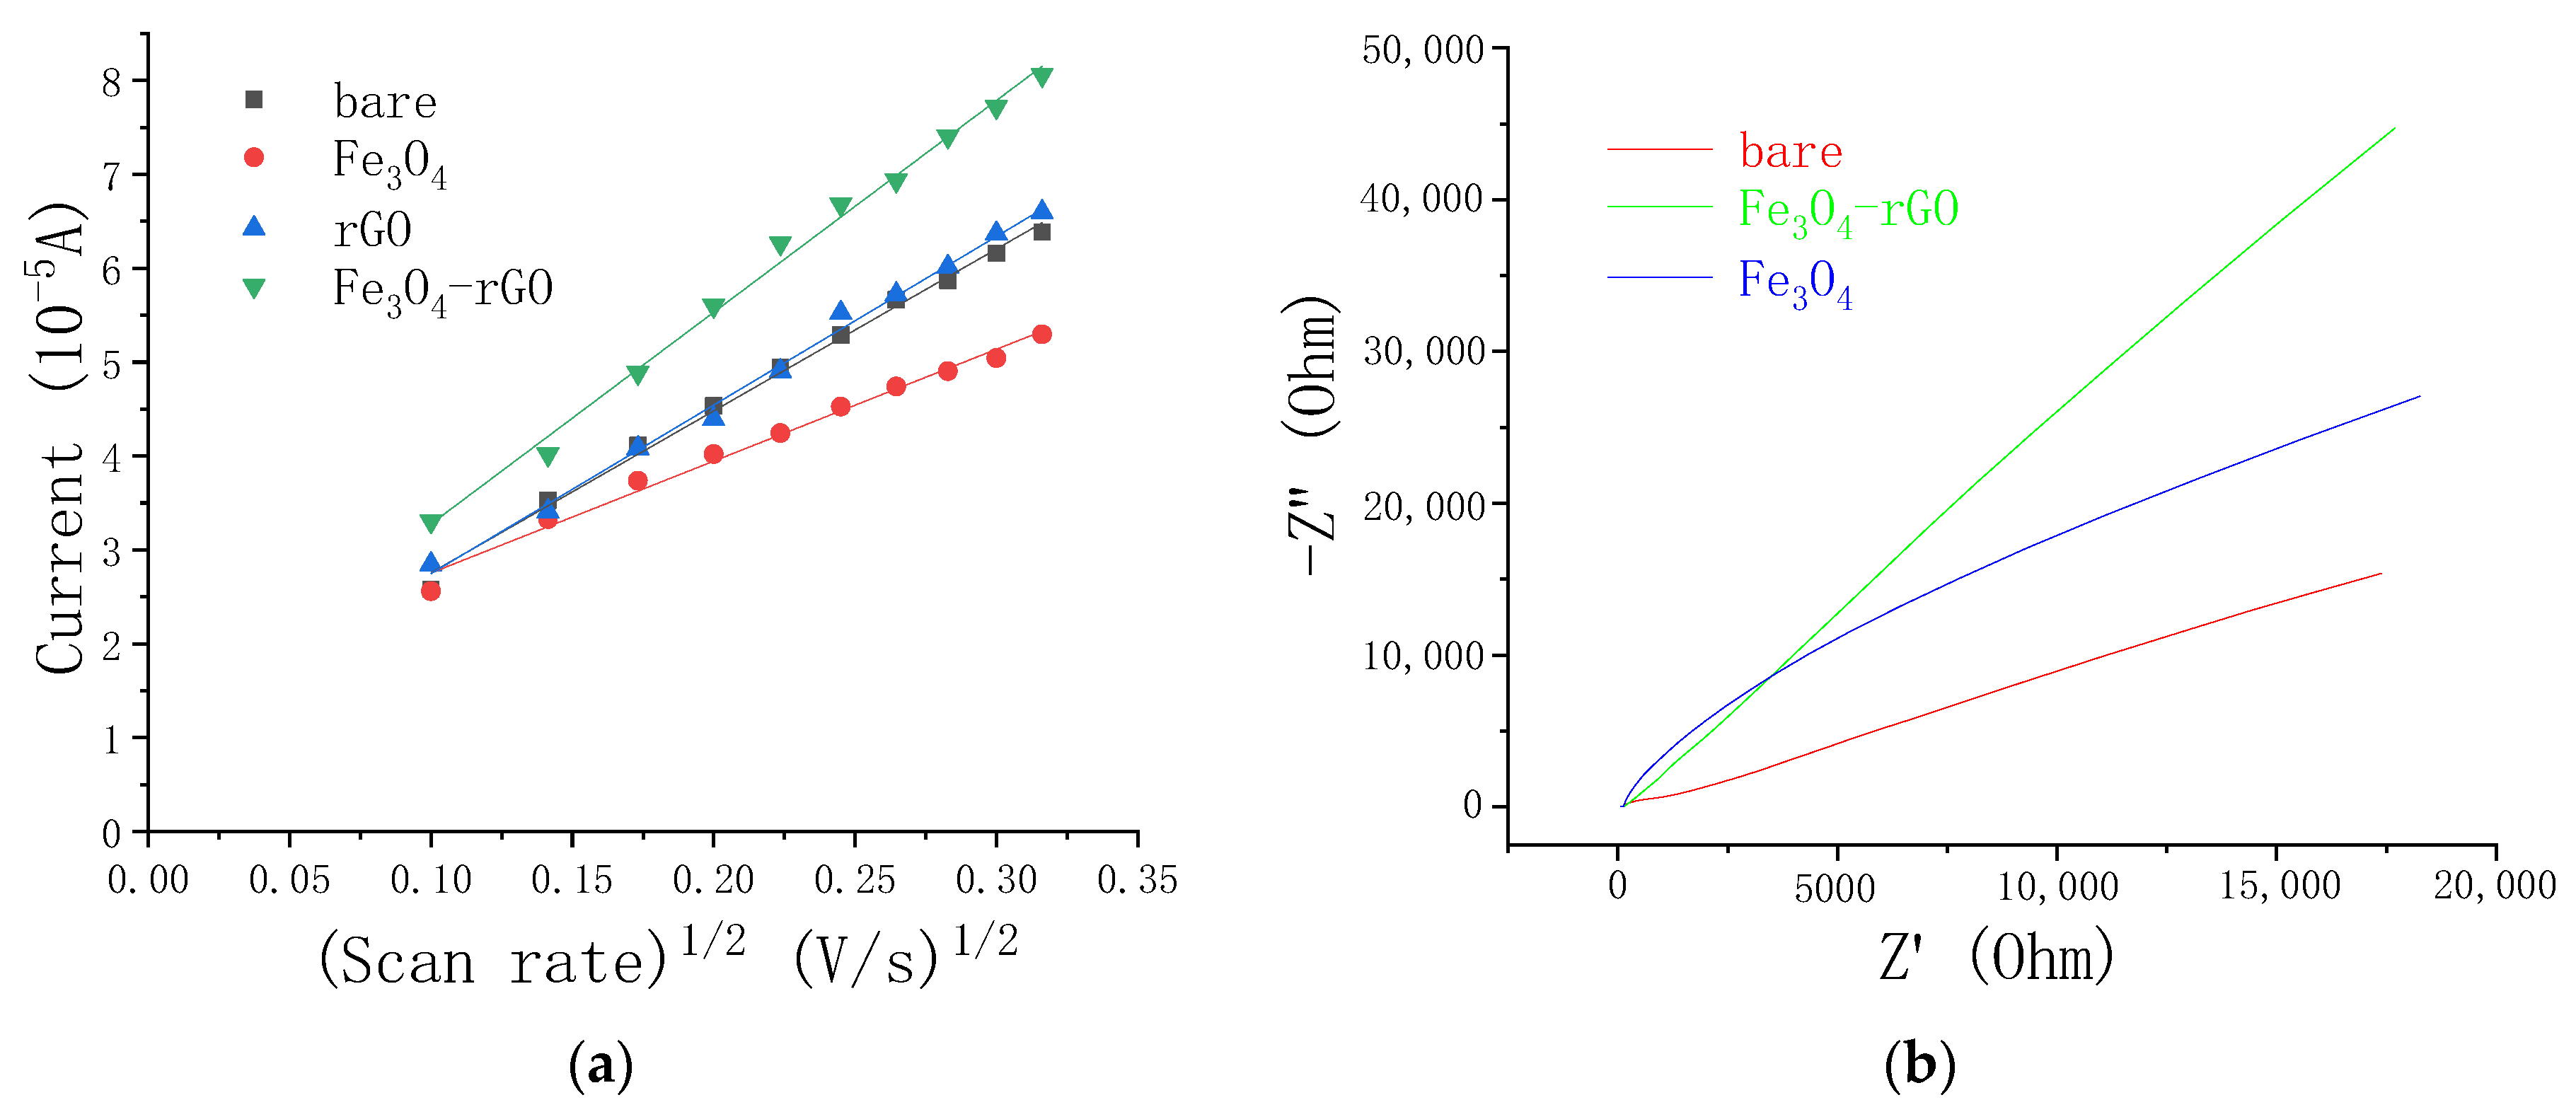
3.2. Electrochemical Characterization of NC/GC Electrodes

In order to evaluate the modified electrode, we carried out electrochemical characterization. Potassium ferricyanide K3[Fe(CN)6] was selected as the modification solution; the content of potassium ferricyanide K3[Fe(CN)6] was 5 mM, and the content of KCI was 0.1 M. K3[Fe(CN)6] was used as a probe to label the electrochemical behavior. By CV, we selected different scan rates (10–100 mV/s) and recorded the cyclic voltammograms of the bare electrode and the modified electrode. In the CV curve, the change in peak current and the separation of electrode peaks were related to the electron transfer rate constant. It can be seen from Figure 5a that in terms of the peak current density of the anode and cathode related to the redox process of Fe2+/Fe3+, the efficiency of the modified electrode is better than that of the bare electrode, which may be due to the composite materials providing a large surface area. However, the effect of the Fe3O4-modified electrode is not as good as that of the bare electrode. This may be due to the fact that although Fe3O4 is conductive, it is not as good as the bare electrode to a certain extent. The effect of the electrode modified by rGO alone is similar to that of the bare electrode. The reason for this is also related to the close conductivity of rGO and the bare electrode. Under the condition of 50 mV/s, in the bare electrode, the peak potential separation is 81 mV and the cathodic peak current is 4.984 μA, while in the modified electrode, the peak potential separation is 127 mV and the cathodic peak current is 6.267 μA. In addition, for the modified electrode surface, the peak current ia/ic ratio is about +1.39, indicating that the Fe2+/Fe3+ oxidation/reduction process is reversible to a certain extent [26].
In order to study the relationship between the electron transfer dynamics of the modified electrode and the scanning rate of the CV, we estimated their respective equation curves. It can be clearly seen that the peak current increases linearly with the square root of the scan rate [11,27], and the Fe3O4–rGO-modified electrode had the fastest electron transfer speed [28]. The formulas were as follows:
bare :   Ip = 17.24 v 1 / 2 + 1.03 ( R 2 = 0.995 )
Fe 3 O 4 :   Ip = 11.91 v 1 / 2 + 1.56 ( R 2 = 0.988 )
rGO :   Ip = 17.95 v 1 / 2 + 0.95 ( R 2 = 0.995 )
Fe 3 O 4 rGO :   I p = 22.55 v 1 / 2 + 1.02 ( R 2 = 0.995 )
The Randles–Sevcik formula was used to calculate the electroactive surface area of the modified electrode [29]. The formula was as follows:
Ipa = ( 2.687 × 10 5 ) A × D 1 / 2 × n 3 / 2 × v 1 / 2 × Co
where Ipa is the anode peak current, A is the surface area of the active electrode, D is the diffusion coefficient (6.3 × 10⁻⁶ cm2 s−1), n is the number of mobile electrons in K3[Fe(CN)6], v is the scanning rate, and Co is the concentration of K3[Fe(CN)6]. It was found that the value for Fe3O4–rGO is 0.0083 cm2, the value for Fe3O4 is 0.0056 cm2, the value for rGO is 0.0065 cm2, and the value for the bare electrode is 0.0083 cm2. These values are related to the number of electroactive sites on each electrode [30].
The high electroactive surface area and good electrochemical response of Fe3O4–rGO/GCE can be attributed to the wide surface area of rGO providing attachment sites for Fe3O4 nanoparticles. At the same time, Fe3O4 nanoparticles also reduced the stacking effect of rGO. The Fe3O4–rGO/GCE surface created more conductive paths (active surface) for electron transfer.
EIS was used to study the impedance characteristics of surface-modified electrodes [31]. The frequency range of the Nyquist diagram of the electrode is 0.01–106 Hz. It can be seen in Figure 5b that the linear part corresponds to the diffusion process, and the linear part for Fe3O4–rGO is the most obvious [32]. This can be attributed to the super large surface area of rGO and the good conductivity of Fe3O4–rGO, which speeds up the transfer of electrons.

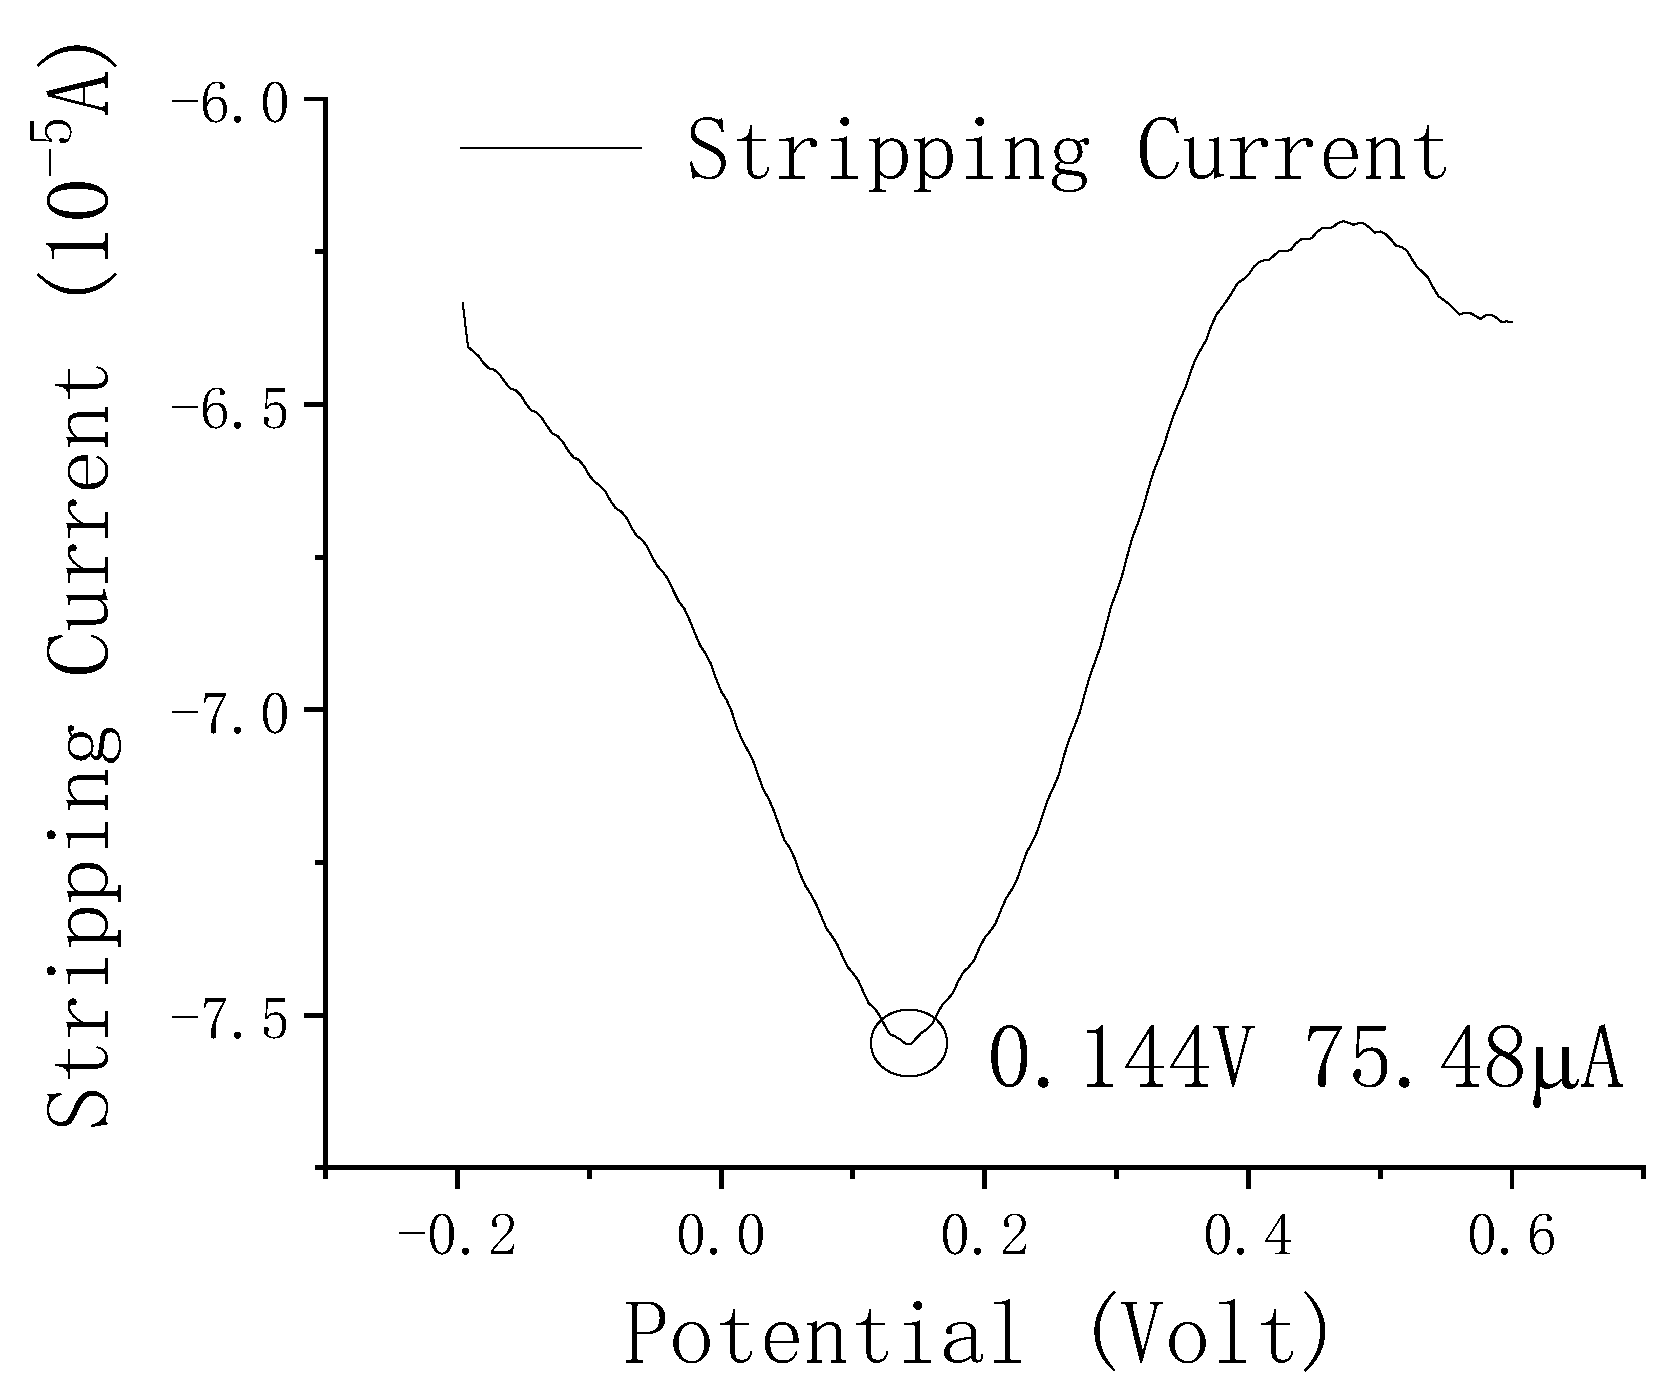
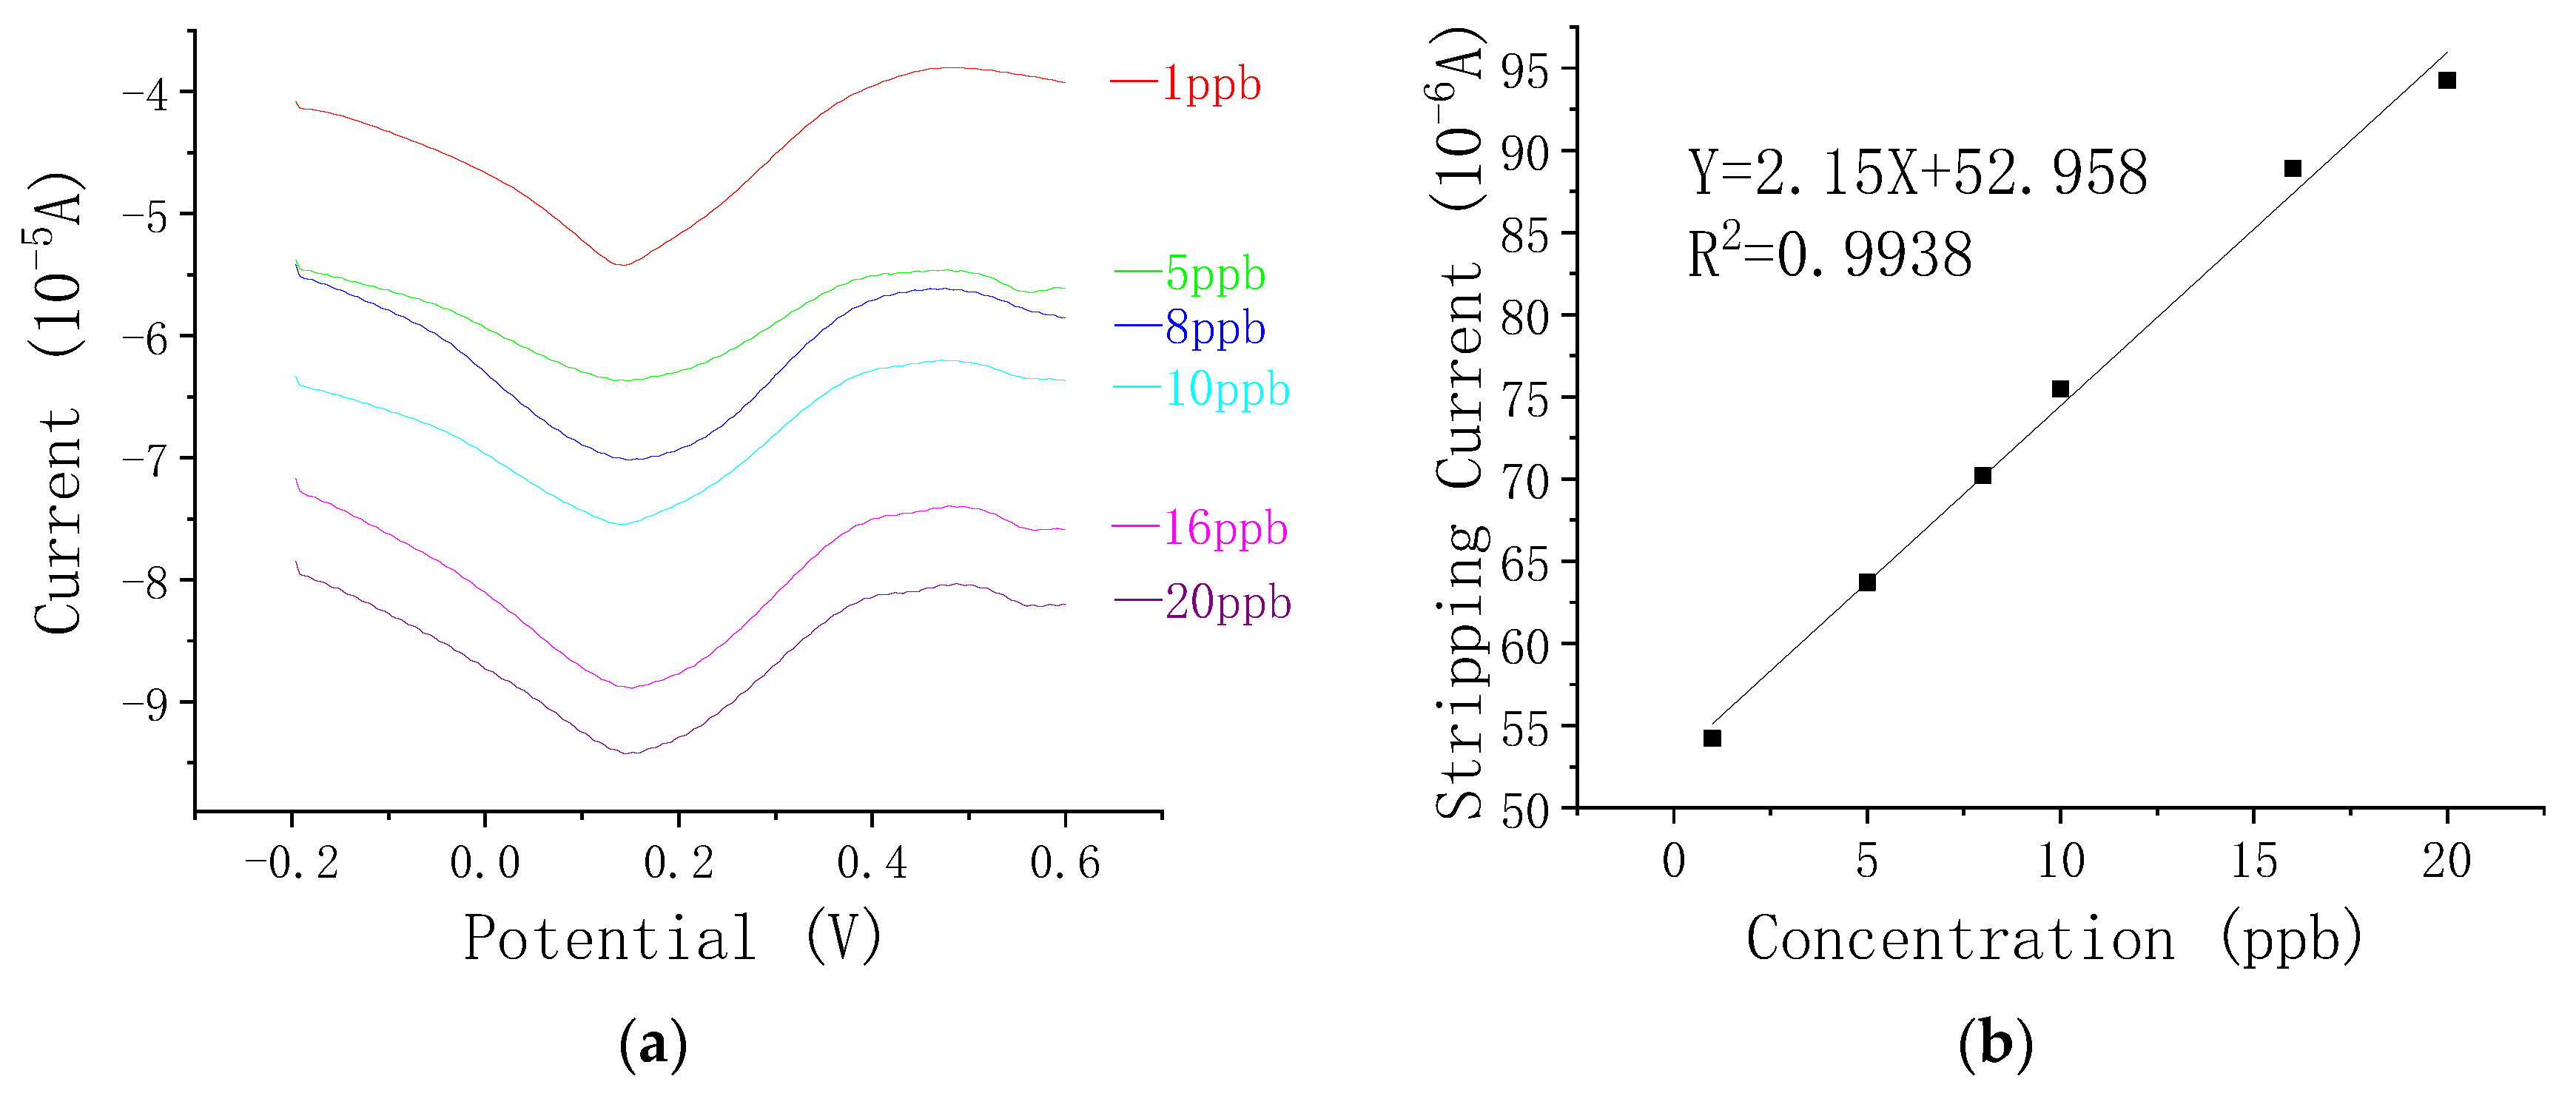
3.3. Analytical Performance of the Fe3O4–rGO-Nanocomposite—Modified Electrode towards As(III)

In order to further test the analytical performance of electrodes modified with composite materials for arsenic, we decided to use SWV because it has higher sensitivity than CV. Figure 6 shows the results with 10 ppb concentration of As(III) at a deposition potential of −0.4 V, a potential range of −0.2 V to 0.6 V, a potential increment of 4 mV, an amplitude of 25 mV, and a frequency of 40 Hz.
In the stripping scan from −0.2 V to 0.6 V, around 0.140 V, a significant peak with a peak current of 75.48 μA was observed.
Compared with other related papers, although the materials used for electrode modification are the same, the peak current response of As(III) measured in this paper is about seven times that in other papers, and this is still under the condition of a lower As(III) concentration [33,34]. Among these other papers, Devi et al. obtained a peak current response of about 16 μA in a 60 ppb As(III) solution. Chimezie et al. obtained a peak current response of about 7.3 μA in an As(III) solution of 150 ppb. In the case of bare electrodes, the peak current detected was 6 μA, which is much smaller than the peak current of the modified electrode, which is about 1/10. The higher the peak current, the more conducive it is to subsequent current amplification, noise removal, and other processing.
In the deposition step, As(III) is reduced to As(0) at a deposition potential of −0.4 V and pre-concentrated from the solution to the surface of the modified electrode. During stripping, the peak current observed is that when As(0) is oxidized to As(III). Afterwards, in order to dissolve the remaining small amount of As(0) into the solution, we performed a desorption process for 150 s at a voltage of 0.4 V. The reasons for such superior peak current response are as follows: Fe3O4 has good selectivity to arsenic ions, and both Fe3O4 and rGO have good electrical conductivity. The super large surface area of rGO provides many attachment sites for Fe3O4 nanoparticles. Secondly, due to the existence of various oxygen-containing groups, the excellent catalytic performance of Fe3O4–rGO may promote the oxidation of reduced arsenic species on the surface of the modified electrode [2,35].

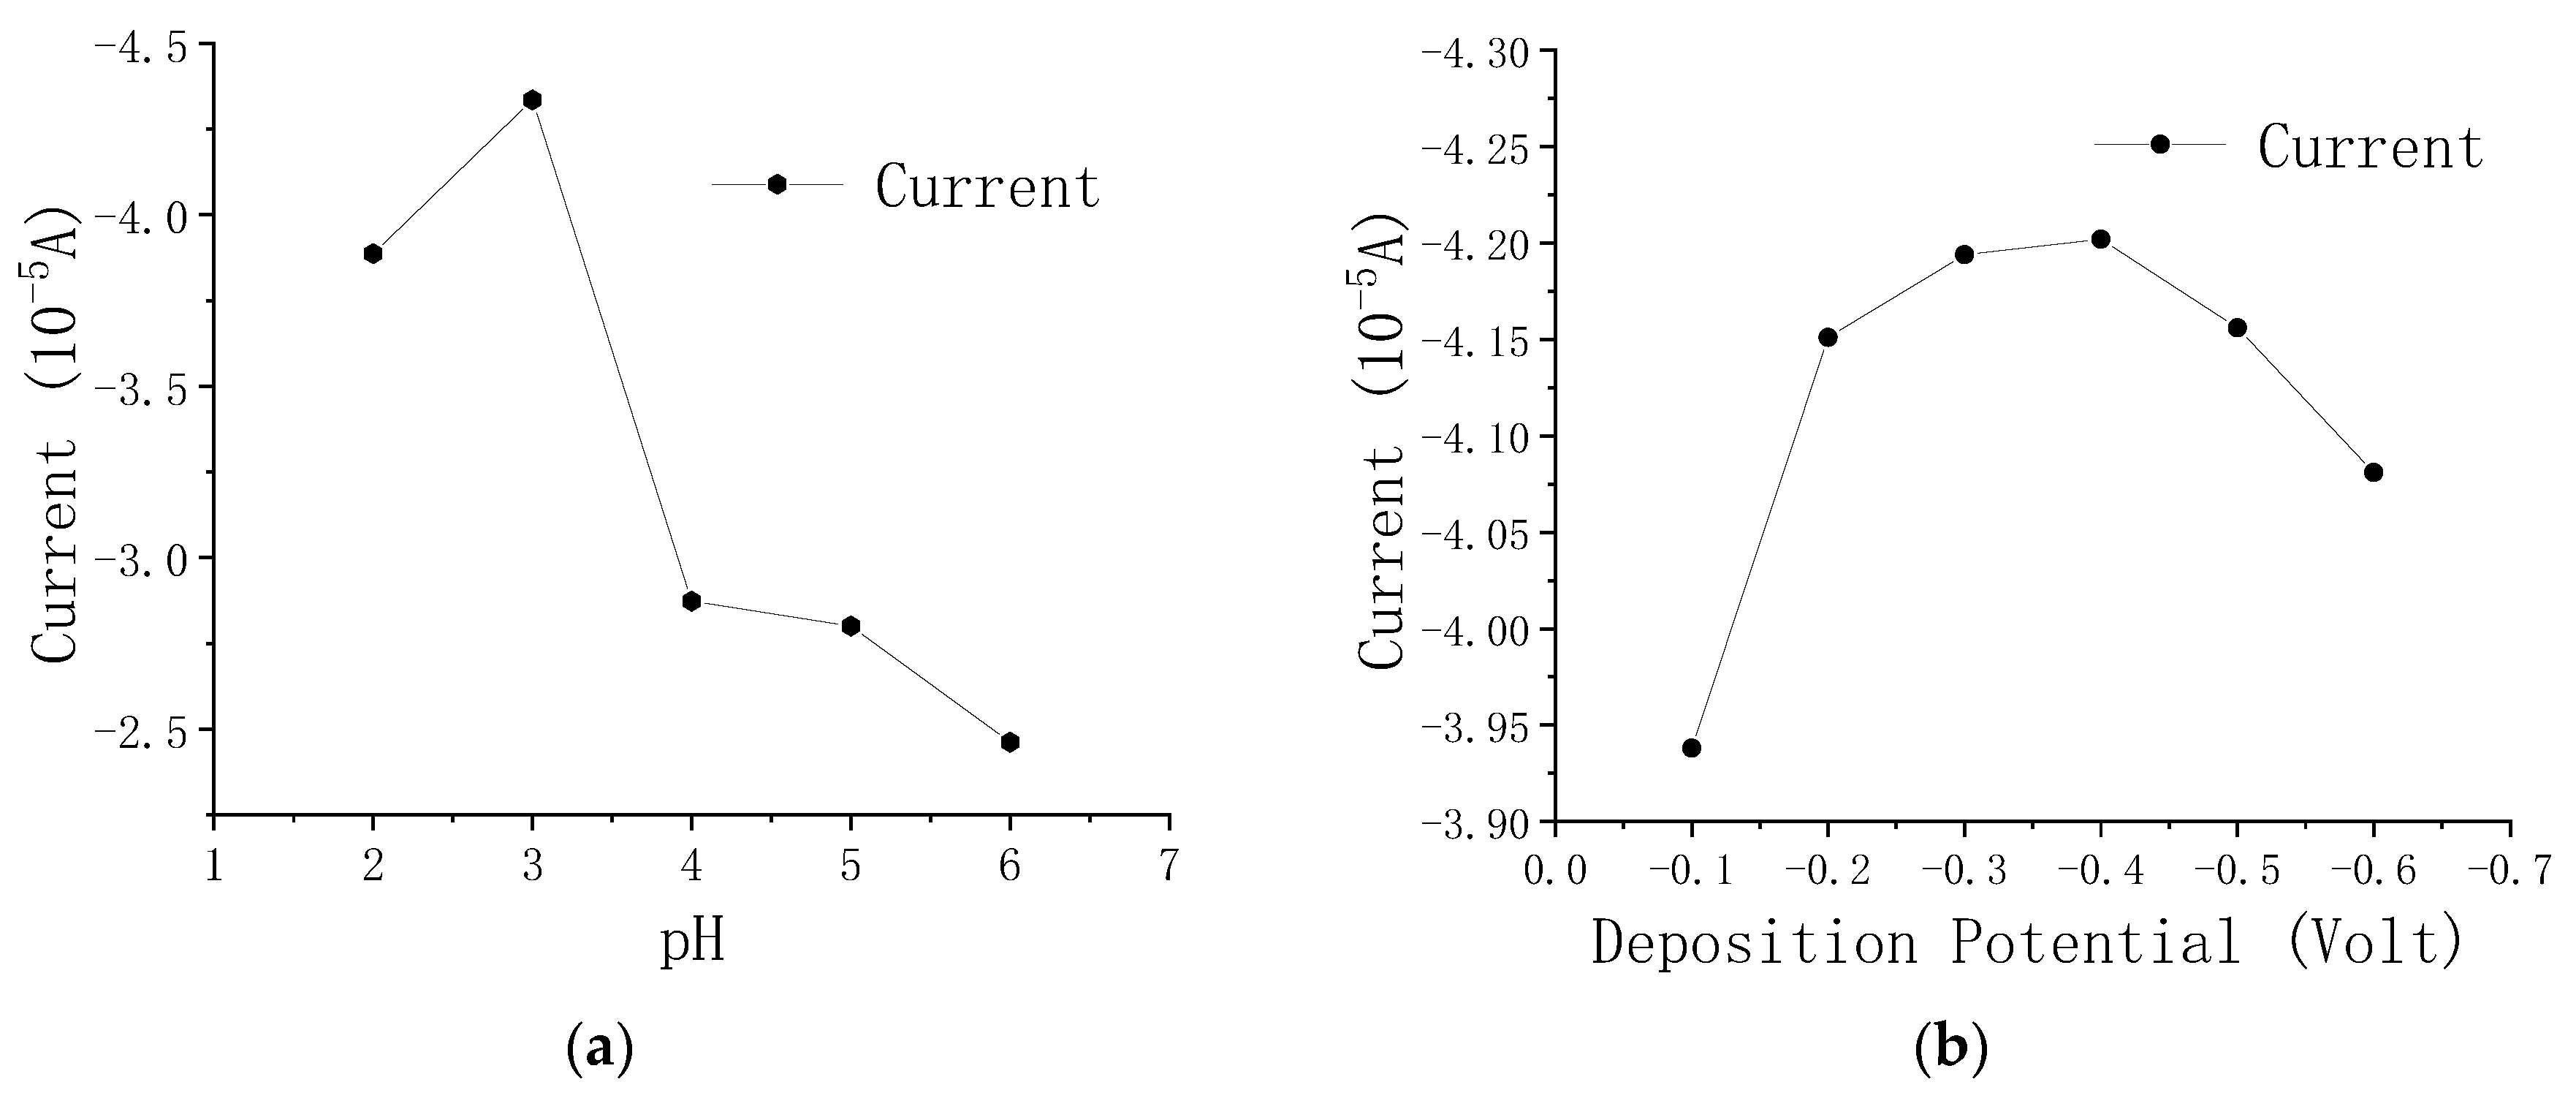
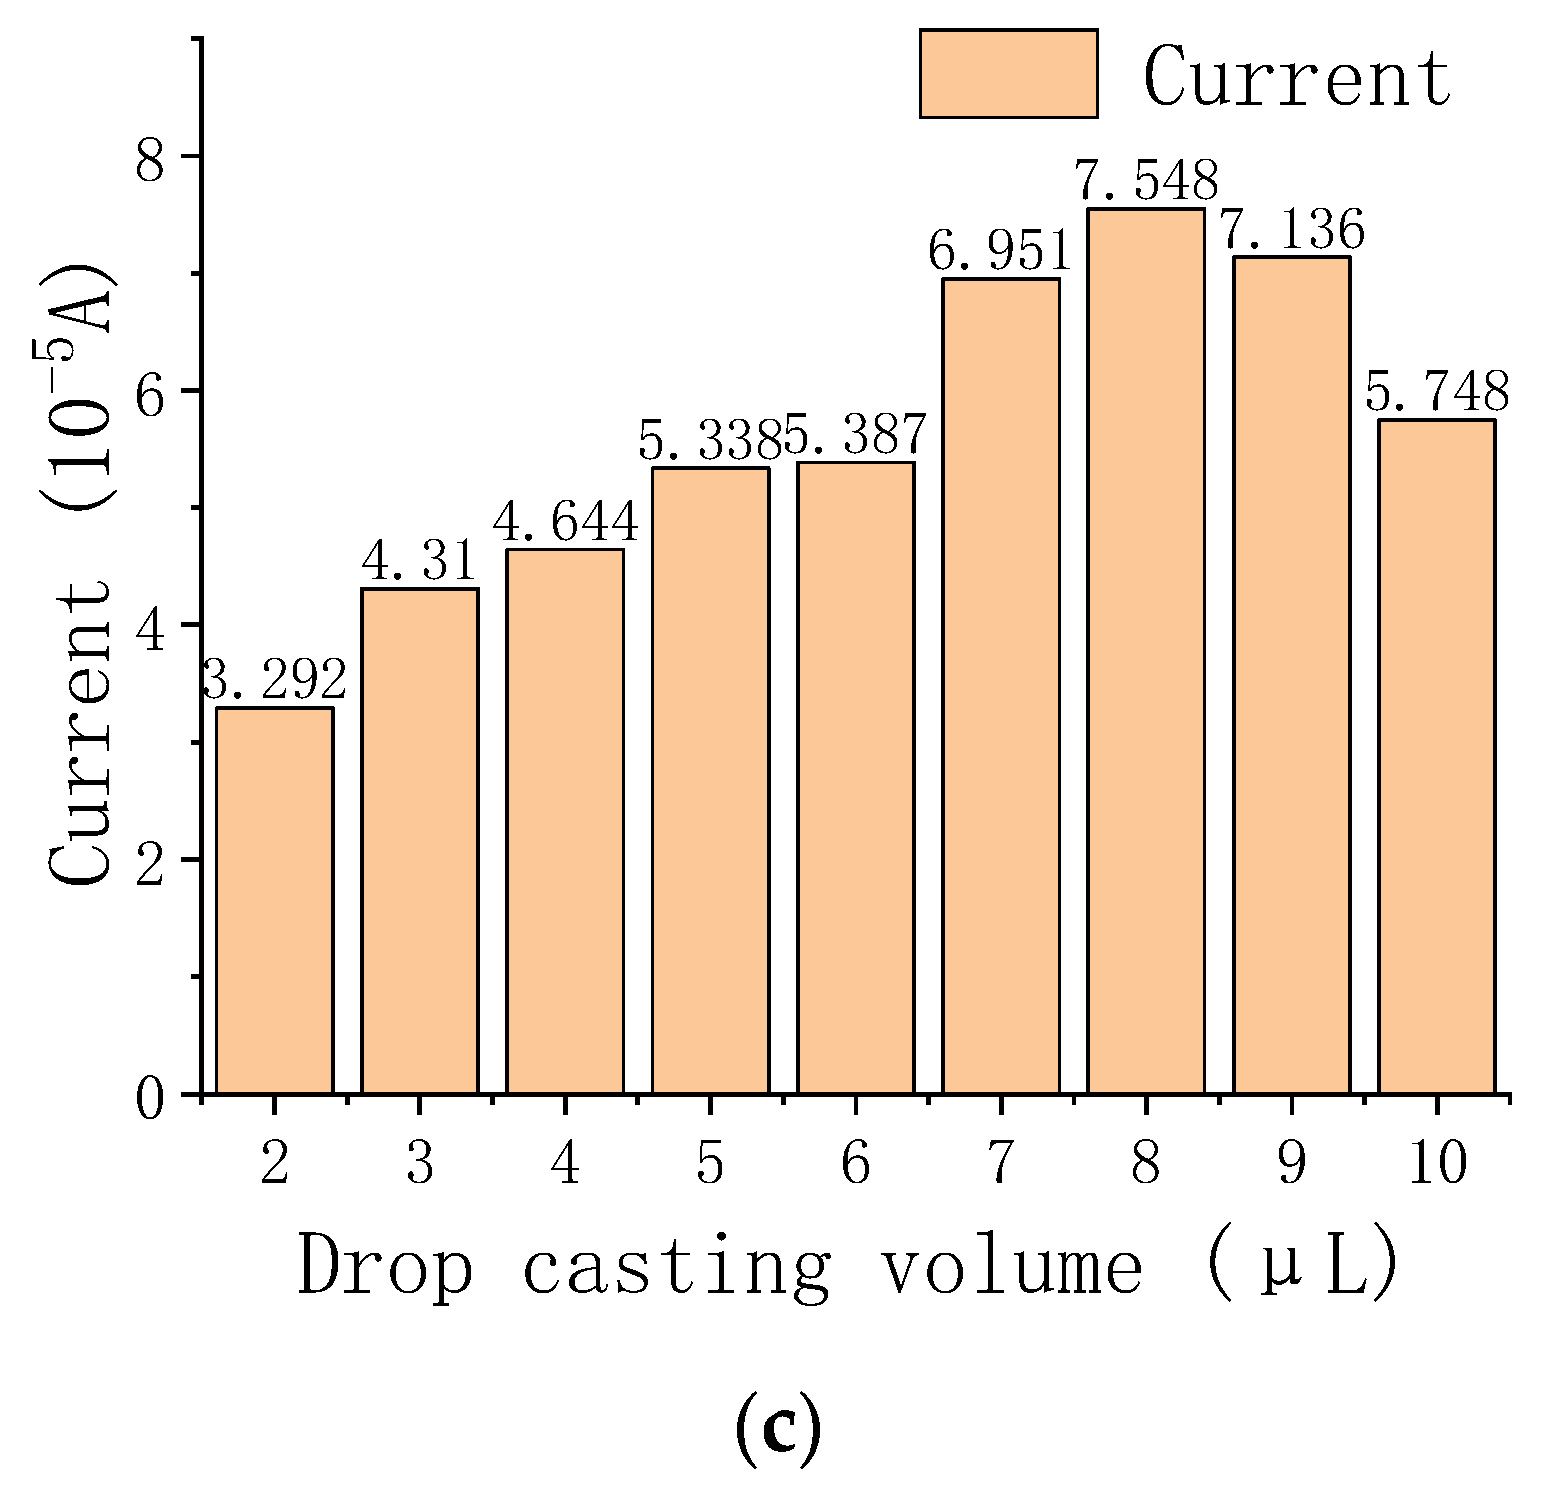
3.4. Optimization of Experimental Conditions for the Electrochemical Detection of As(III)

After the electrode is modified by the composite material, in order to obtain the best peak current response, the experimental conditions need to be gradually optimized. Compared with CV, SWV has higher sensitivity and lower background noise, so SWV is the best experimental method.
First, we compared the effects of phosphate buffers with different pH values on the peak current. The experimental results are shown in Figure 7a. Among the five phosphate buffers with pH 2, 3, 4, 5, and 6, the response of pH 3 was best in phosphate buffer. When the pH is low, too much H+ will interfere with the reduction of As3+, and when the pH is high, the solubility of As(III) will decrease. Like in other reports, at lower pH, the adsorption capacity for As(III) was poor [36,37]. As shown in Figure 7b, under different deposition potentials (from −0.1 V to −0.6 V), different peak current responses were shown. Among them, the current response was very small under the condition of −0.1 V, and the response was the best under the condition of −0.4 V. This is because at larger negative potentials (over −0.4 V), the reduction potential is close to the hydrogen reduction potential, which will generate bubbles during the experiment and reduce the effective surface area of the working electrode, thereby reducing the response to As(III) [38,39]. During the experiment, composite material suspension with a concentration of 1 mg/mL was dropped on the electrode surface, so different drops also affected the final current response. As shown in Figure 7c, the experiment was carried out from 2 μL to 10 μL. The response was best at 8 μL, and the response was not much different from 7 μL to 9 μL. Therefore, the final optimized experimental conditions were: a phosphate buffer with a pH of 3, a deposition potential of −0.4 V, and a dropping amount of 8 μL. In addition, other experimental parameters were: square wave voltammetry as the experimental method, 150 s deposition time and desorption time, and +0.4 V desorption potential.
Figure 8a shows the SWV response of a glassy carbon electrode modified with Fe3O4–rGO under different As(III) concentrations. Figure 8b shows the relationship between the peak current of the Fe3O4–rGO/GCE and the concentration of As(III), where the concentration of arsenic ranges from 1 to 20 ppb. The experimental results showed that the peak current close to 0.144 V is proportional to the As(III) concentration. Through linear fitting, it can be concluded that its sensitivity is 2.15 μA/ppb, R2 = 0.9938, and then by taking K = 3 (where K is the confidence factor), the calculated limit of detection (LOD) is 1.19 ppb, which is far lower than the standard of 10 ppb LOD specified by WHO. Compared with the results of other papers, it also has certain advantages, as shown in Table 1. Although the previous research has been sufficient, there are still some problems. For example, the use of toxic and harmful chemicals [16], or the use of expensive gold nanoparticles or platinum nanoparticles [40,41], has limitations in terms of cost. Another advantage of this experiment is its high peak corresponding current, which is not achieved by related materials. These results can be attributed to the synergistic effect of Fe3O4 nanoparticles and rGO, in which rGO has ultra-high conductivity and electrocatalytic performance, and Fe3O4 nanoparticles have good selectivity to As(III). It is worth mentioning that the deposition potential of As(V) is −1.2 V, which will not interfere with the experiment [42].

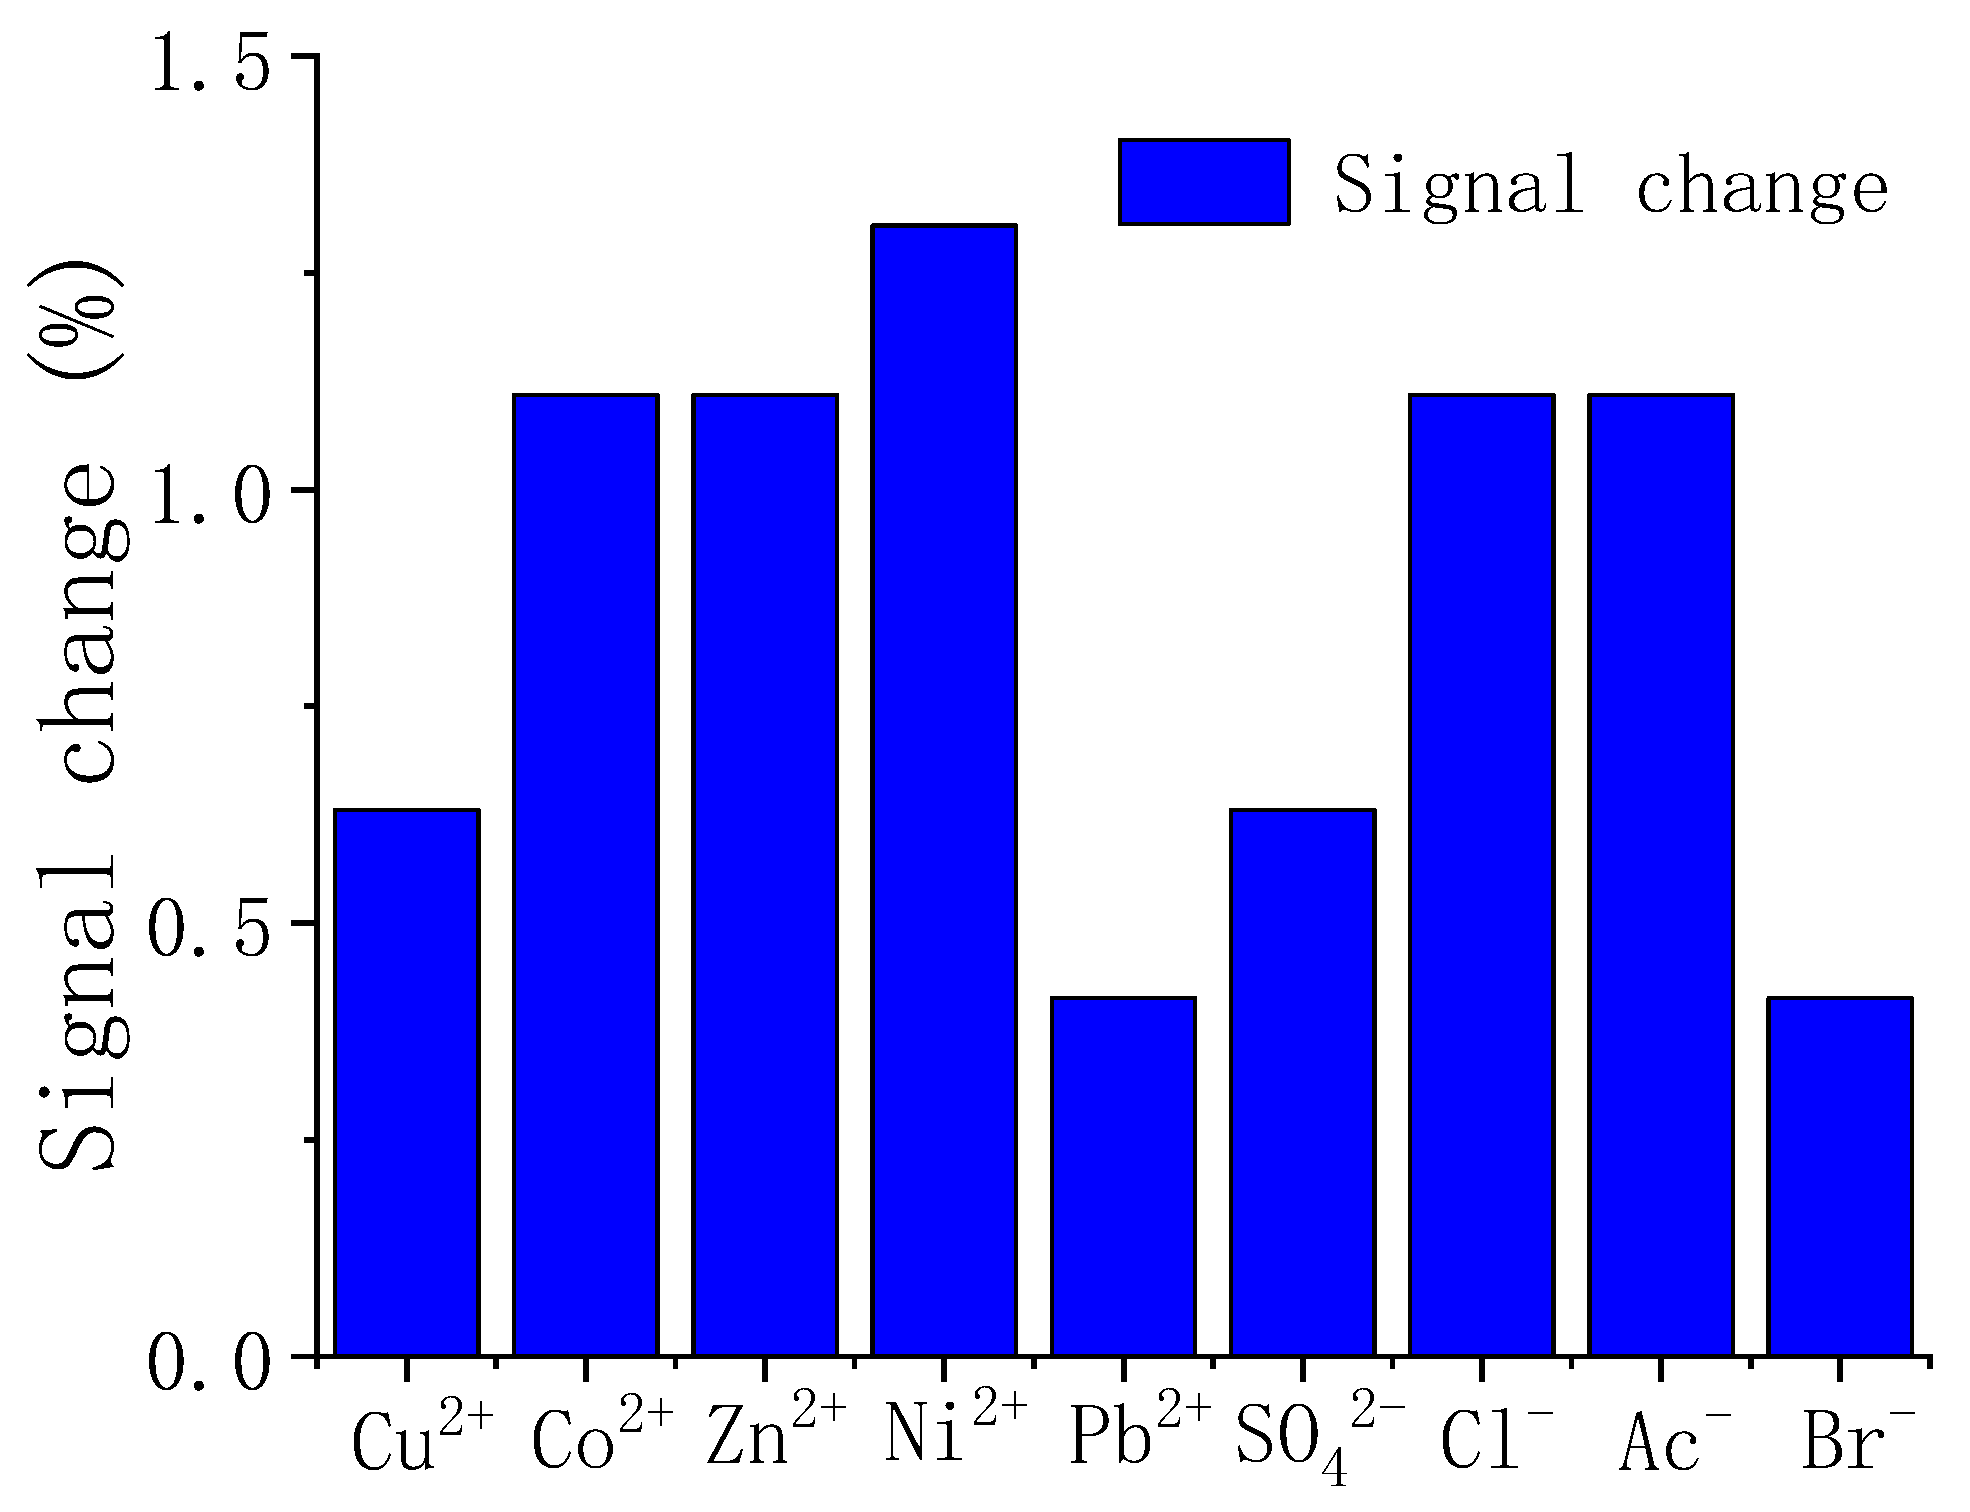
3.5. Interference Measurement

In the actual environmental sample and the same detection conditions, there will be other ions that may codeposit with arsenic ions. This will limit the application of electrochemical detection. In this regard, we evaluated the detection performance of arsenic ions by artificially adding interfering ions. The concentration of arsenic ion was 10 ppb, and the concentrations of other interfering ions were as follows: 100 ppb for Cu2+, Co2+, Zn2+, Ni2+, Pb2+, and SO42−, and 200 ppb for Ac, CI, and Br.
The results in Figure 9 show that the modified electrode has a good selectivity to arsenic ions, and other ions were not observed to have a great influence on the stripping current. Compared with the arsenic ion solution, the error of the detection result of the arsenic ion solution with added interfering ions was about 1%, which is far better than the selectivity mentioned in other papers [34].

3.6. Stability and Reproducibility Measurement

For the detection of As(III), the stability and repeatability of the modified electrodes are also very important.
Firstly, we carried out five cycles of testing on the modified electrode under the same optimized conditions. Comparing the results of the five times with the average value, it was found that the smallest deviation was 0.045% and the largest deviation was 1.18% (Figure S2). The electrode modified with Fe3O4–rGO thus has good repeatability, and in actual measurements, it will not be too limited by repeatability. Secondly, we placed the glassy carbon electrode modified with Fe3O4–rGO nanocomposite material in a dust-free box at room temperature for 7 days or 10 days, then tested it under the same optimal test conditions and compared it with the previous test results. We compared the average of the three measurements with each result; the largest deviation was −0.76%, and the smallest deviation was only −0.07% (Figure S3). This also proves that the electrode modified with Fe3O4–rGO has good stability and will not cause great errors in short-term measurement. In subsequent experiments, it was found that if the storage time exceeded 15 days, the results measured by the modified electrode showed large deviation, so the service life of the electrochemical sensor should be within 15 days.

4. Conclusions

In this work, we chose SWV to detect trace amounts of As(III) in water by using Fe3O4–rGO to modify the electrode. The Fe3O4–rGO nanocomposite material showed very good electrochemical performance and is very sensitive to trace arsenic; the sensitivity is 2.15 μA/ppb, which is better than others in the literature, and the peak current of the response is far beyond the reach of other papers. In addition, it also shows good selectivity with interfering ions, with an error of about one percent. Moreover, the As(III) test shows satisfactory repeatability and stability, which also determines that the test will not be greatly affected by the number or the duration of tests. The related findings provide a new method for the electrochemical detection of As(III) to prepare materials with good performance.

Supplementary Materials

The following are available online at https://www.mdpi.com/article/10.3390/chemosensors9060150/s1, In supplementary materials, supplementary figure contains three figures, respectively: Figure S1: Test chart of polished glassy carbon electrode, Figure S2: Repetitive Study of Modified Electrode, and Figure S3: Stability Study of Modified Electrode. The remaining supplementary materials are the materials related to material characterization.

Author Contributions

Conceptualization, H.H. and W.L.; methodology, F.M.; validation, W.L. and X.L.; formal analysis, H.H.; investigation, W.L.; resources, F.M.; data curation, W.L.; writing—original draft preparation, W.L.; writing—review and editing, J.Z.; project administration, H.H.; funding acquisition, H.H. All authors have read and agreed to the published version of the manuscript.

Funding

This research was funded by the Natural Science Foundation of Anhui Province (1808085QE140) and the project of Research on Sensing Properties of Graphene-Based Composite Materials (W2020JSFW0662).

Data Availability Statement

Data are contained within the article or supplementary material.

Conflicts of Interest

The authors declare no conflict of interest.

References

  1. Flavio, M.; Maria, L.; Antonio, R. Heavy Metal/Toxins Detection Using Electronic Tongues. Chemosensors 2019, 7, 36. [Google Scholar]
  2. Liu, Z.-G.; Huang, X.-J. Voltammetric determination of inorganic arsenic. TrAC Trends Anal. Chem. 2014, 60, 25–35. [Google Scholar] [CrossRef]
  3. Annija, L.; Jonh, C. A Rewiew of Microfluidic Detection Strategies for Heavy Metals in Water. Chemosensors 2021, 9, 60. [Google Scholar]
  4. Smedley, P.L.; Kinniburgh, D.G. A review of the source, behaviour and distribution of arsenic in natural waters. Appl. Geochem. 2002, 17, 517–568. [Google Scholar] [CrossRef] [Green Version]
  5. Stojanovic, R.S.; Bond, A.M.; Butler, E.C.V. Liquid chromatography-electrochemical detection of inorganic arsenic using a wall jet cell with conventional and microsized platinum disk electrodes. Anal. Chem. 1990, 62, 2692–2697. [Google Scholar] [CrossRef]
  6. Simm, A.O.; Banks, C.E.; Compton, R.G. Sonically assisted electroanalytical detection of ultratrace arsenic. Anal. Chem. 2004, 76, 5051–5055. [Google Scholar] [CrossRef] [PubMed]
  7. Prakash, R.; Srivastava, R.C.; Seth, P.K. Direct Estimation of Total Arsenic Using a Novel Metal Side Disk Rotating Electrode. Electroanalysis 2003, 15, 1410–1414. [Google Scholar] [CrossRef]
  8. March, G.; Nguyen, T.D.; Piro, B. Modified electrodes used for electrochemical detection of metal ions in environmental analysis. Biosensors (Basel) 2015, 5, 241–275. [Google Scholar] [CrossRef] [PubMed] [Green Version]
  9. Ratinac, K.R.; Yang, W.; Gooding, J.J.; Thordarson, P.; Braet, F. Graphene and Related Materials in Electrochemical Sensing. Electroanalysis 2011, 23, 803–826. [Google Scholar] [CrossRef]
  10. Aragay, G.; Merkoçi, A. Nanomaterials application in electrochemical detection of heavy metals. Electrochim. Acta 2012, 84, 49–61. [Google Scholar] [CrossRef]
  11. Aikens, D.A. Electrochemical methods, fundamentals and applications. J. Chem. Educ. 1983, 60, A25. [Google Scholar] [CrossRef]
  12. Yang, Y.; Ma, N.; Wang, H.; Liang, Q.; Bian, Z. Pd-Ag/Graphene Electrochemical Sensor for Chlorophenol Contaminant Determination. J. Electrochem. Soc. 2019, 166, B266–B275. [Google Scholar] [CrossRef]
  13. Liu, Y.; Li, M.; Li, H.; Wang, G.; Long, Y.; Li, X.; Yang, B. In Situ Detection of Melatonin and Pyridoxine in Plants Using a CuO-Poly(L-lysine)/Graphene-Based Electrochemical Sensor. ACS Sustain. Chem. Eng. 2019, 7, 19537–19545. [Google Scholar] [CrossRef]
  14. Li, F.; Wang, A.; Lai, G.; Su, W.; Malherbe, F.; Yu, J.; Lin, C.; Yu, A. Defects regulating of graphene ink for electrochemical determination of ascorbic acid, dopamine and uric acid. Talanta 2018, 180, 248–253. [Google Scholar]
  15. Ramesha, G.K.; Sampath, S. In-situ formation of graphene–lead oxide composite and its use in trace arsenic detection. Sens. Actuators B Chem. 2011, 160, 306–311. [Google Scholar] [CrossRef]
  16. Kempegowda, R.; Antony, D.; Malingappa, P. Graphene–platinum nanocomposite as a sensitive and selective voltammetric sensor for trace level arsenic quantification. Int. J. Smart Nano Mater. 2014, 5, 17–32. [Google Scholar] [CrossRef] [Green Version]
  17. Khatamian, M.; Khodakarampoor, N.; Saket-Oskoui, M. Efficient removal of arsenic using graphene-zeolite based composites. J. Colloid Interface Sci. 2017, 498, 433–441. [Google Scholar] [CrossRef] [PubMed]
  18. Baig, S.A.; Sheng, T.; Sun, C.; Xue, X.; Tan, L.; Xu, X. Arsenic removal from aqueous solutions using Fe3O4-HBC composite: Effect of calcination on adsorbents performance. PLoS ONE 2014, 9, e100704. [Google Scholar] [CrossRef]
  19. Dixit, S.; Hering, J.G. Comparison of arsenic (V) and arsenic (III) sorption onto iron oxide minerals: Implications for arsenic mobility. Environ. Sci. Technol. 2003, 37, 4182–4189. [Google Scholar] [CrossRef]
  20. He, H.; Gao, C. Graphene nanosheets decorated with Pd, Pt, Au, and Ag nanoparticles: Synthesis, characterization, and catalysis applications. Sci. China Chem. 2011, 54, 397–404. [Google Scholar] [CrossRef]
  21. Stoller, M.D.; Park, S.; Zhu, Y.; An, J.; Ruoff, R.S. Graphene-based ultracapacitors. Nano Lett. 2008, 8, 3498–3502. [Google Scholar] [CrossRef]
  22. Ferrari, A.C.; Basko, D.M. Raman spectroscopy as a versatile tool for studying the properties of graphene. Nat. Nanotechnol. 2013, 8, 235–246. [Google Scholar] [CrossRef] [PubMed] [Green Version]
  23. Ritter, K.; Odziemkowski, M.S.; Gillham, R.W. An in situ study of the role of surface films on granular iron in the permeable iron wall technology. J. Contam. Hydrol. 2002, 55, 87–111. [Google Scholar] [CrossRef]
  24. Sohouli, E.; Khosrowshahi, E.M.; Radi, P.; Naghian, E.; Nasrabadi, M.R.; Ahmadi, F. Electrochemical sensor based on modified methylcellulose by graphene oxide and Fe3O4 nanoparticles: Application in the analysis of uric acid content in urine. J. Electroanal. Chem. 2020, 877, 114503. [Google Scholar] [CrossRef]
  25. Chimezie, A.B.; Hajian, R.; Yusof, N.A.; Woi, P.M.; Shams, N. Fabrication of reduced graphene oxide-magnetic nanocomposite (rGO-Fe3O4) as an electrochemical sensor for trace determination of As(III) in water resources. J. Electroanal. Chem. 2017, 796, 33–42. [Google Scholar] [CrossRef]
  26. Simm, A.O.; Banks, C.E.; Wilkins, S.J.; Karousos, N.G.; Davis, J.; Compton, R.G. A comparison of different types of gold-carbon composite electrode for detection of arsenic (III). Anal. Bioanal. Chem. 2005, 381, 979–985. [Google Scholar] [CrossRef]
  27. Ali, M.A.; Kamil Reza, K.; Srivastava, S.; Agrawal, V.V.; John, R.; Malhotra, B.D. Lipid-lipid interactions in aminated reduced graphene oxide interface for biosensing application. Langmuir 2014, 30, 4192–4201. [Google Scholar] [CrossRef]
  28. Mukherjee, M.D.; Dhand, C.; Dwivedi, N.; Singh, B.P.; Sumana, G.; Agarwal, V.V.; Tawale, J.S.; Malhotra, B.D. Facile synthesis of 2-dimensional transparent graphene flakes for nucleic acid detection. Sens. Actuators B Chem. 2015, 210, 281–289. [Google Scholar] [CrossRef]
  29. Das, M.; Dhand, C.; Sumana, G.; Srivastava, A.K.; Nagarajan, R.; Nain, L.; Iwamoto, M.; Manaka, T.; Malhotra, B.D. Electrophoretic fabrication of chitosan-zirconium-oxide nanobiocomposite platform for nucleic acid detection. Biomacromolecules 2011, 12, 540–547. [Google Scholar] [CrossRef]
  30. Salinas-Torres, D.; Huerta, F.; Montilla, F.; Morallón, E. Study on elect roactive and electrocatalytic surfaces of single walled carbon nanotube-modified electrodes. Electrochim. Acta 2011, 56, 2464–2470. [Google Scholar] [CrossRef]
  31. Jia, L.; Wang, H. Electrochemical reduction synthesis of graphene/Nafion nanocomposite film and its performance on the detection of 8-hydroxy-2′-deoxyguanosine in the presence of uric acid. J. Electroanal. Chem. 2013, 705, 37–43. [Google Scholar] [CrossRef]
  32. Macdonald, J.R.; Barsoukov, E. Impedance Spectroscopy: Theory, Experiment, and Applications; John Wiley & Sons: Hoboken, NJ, USA, 2005. [Google Scholar]
  33. Devi, P.; Sharma, C.; Kumar, P.; Kumar, M.; Bansod, B.K.S.; Nayak, M.K.; Singla, M.L. Selective electrochemical sensing for arsenite using rGO/Fe3O4 nanocomposites. J. Hazard. Mater. 2017, 322, 85–94. [Google Scholar] [CrossRef] [PubMed]
  34. Peik-See, T.; Pandikumar, A.; Ngee, L.H.; Ming, H.N.; Hua, C.C. Magnetically separable reduced graphene oxide/iron oxide nanocomposite materials for environmental remediation. Catal. Sci. Technol. 2014, 4, 4396–4405. [Google Scholar] [CrossRef] [Green Version]
  35. Gao, C.; Yu, X.Y.; Xiong, S.Q.; Liu, J.H.; Huang, X.J. Electrochemical detection of arsenic (III) completely free from noble metal: Fe3O4 microspheres-room temperature ionic liquid composite showing better performance than gold. Anal. Chem. 2013, 85, 2673–2680. [Google Scholar] [CrossRef]
  36. Cui, H.; Yang, W.; Li, X.; Zhao, H.; Yuan, Z. An electrochemical sensor based on a magnetic Fe3O4 nanoparticles and gold nanoparticles modified electrode for sensitive determination of trace amounts of arsenic (III). Anal. Methods 2012, 4, 4176–4181. [Google Scholar] [CrossRef]
  37. Zhou, S.-F.; Han, X.-J.; Fan, H.-L.; Zhang, Q.-X.; Liu, Y.-Q. Electrochemical detection of As (III) through mesoporous MnFe2O4 nanocrystal clusters by square wave stripping voltammetry. Electrochim. Acta 2015, 174, 1160–1166. [Google Scholar] [CrossRef]
  38. Wang, L.; Xu, W.H.; Yang, R.; Zhou, T.; Hou, D.; Zheng, X.; Liu, J.H.; Huang, X.J. Electrochemical and density functional theory investigation on high selectivity and sensitivity of exfoliated nano-zirconium phosphate toward lead (II). Anal. Chem. 2013, 85, 3984–3990. [Google Scholar] [CrossRef]
  39. Sanllorente-Méndez, S.; Domínguez-Renedo, O.; Arcos-Martínez, M.J. Determination of Arsenic (III) Using Platinum Nanoparticle-Modified Screen-Printed Carbon-Based Electrodes. Electroanalysis 2009, 21, 635–639. [Google Scholar] [CrossRef]
  40. Hossain, M.M.; Islam, M.M.; Ferdousi, S.; Okajima, T.; Ohsaka, T. Anodic Stripping Voltammetric Detection of Arsenic (III) at Gold Nanoparticle-Modified Glassy Carbon Electrodes Prepared by Electrodeposition in the Presence of Various Additives. Electroanalysis 2008, 20, 2435–2441. [Google Scholar] [CrossRef]
  41. Wang, D.; Zhao, Y.; Jin, H.; Zhuang, J.; Zhang, W.; Wang, S.; Wang, J. Synthesis of Au-decorated tripod-shaped Te hybrids for applications in the ultrasensitive detection of arsenic. ACS Appl. Mater. Interfaces 2013, 5, 5733–5740. [Google Scholar] [CrossRef]
  42. Wu, S.; Zhao, Q.; Zhou, L.; Zhang, Z. Stripping Analysis of Trace Arsenic Based on the MnOx/AuNPs Composite Film Modified Electrode in Alkaline Media. Electroanalysis 2014, 26, 1840–1849. [Google Scholar] [CrossRef]
  43. Li, S.S.; Zhou, W.Y.; Li, Y.X.; Jiang, M.; Guo, Z.; Liu, J.H.; Huang, X.J. Noble-Metal-Free Co0.6Fe2.4O4 Nanocubes Self-Assembly Monolayer for Highly Sensitive Electrochemical Detection of As (III) Based on Surface Defects. Anal. Chem. 2018, 90, 1263–1272. [Google Scholar] [CrossRef] [PubMed]
Figure 1. (a) SEM image of GO; (b) SEM image of Fe3O4; (c) SEM image of Fe3O4–rGO.
Chemosensors 09 00150 g001
Figure 2. (a) TEM image of Fe3O4; (b) TEM image of Fe3O4–rGO; (c) EDX image of Fe3O4–rGO.
Chemosensors 09 00150 g002
Figure 3. Raman spectroscopy results of GO, Fe3O4, and Fe3O4–rGO.
Chemosensors 09 00150 g003
Figure 4. FTIR results of GO and Fe3O4–rGO.
Chemosensors 09 00150 g004
Figure 5. (a) linearity curve between the anodic peak current and the square root of the scan rate; (b) EIS plot of bare/GCE, Fe3O4/GCE, and Fe3O4–rGO/GCE.
Chemosensors 09 00150 g005
Figure 6. Square wave voltammogram of Fe3O4–rGO/GCE electrodes towards As(III).
Chemosensors 09 00150 g006
Figure 7. Effect of (a) pH under −0.5 V deposition potential, 10 ppb As(III) concentration, and 5 μL of dropping amount; (b) deposition potential under pH 3 phosphate buffer, 5 ppb As(III) concentration, and 5 μL of dropping volume; (c) drop casting volume under pH 3 phosphate buffer, −0.4 V deposition potential, and 10 ppb As(III) concentration.
Chemosensors 09 00150 g007aChemosensors 09 00150 g007b
Figure 8. (a) SWV response of Fe3O4–rGO/GCE towards As(III) under pH 3 phosphate buffer, −0.4 V deposition potential, and 8 μL drop volume; (b) relation between the peak current and As(III) concentration under pH 3 phosphate buffer, −0.4 V deposition potential, and 8 μL drop volume.
Chemosensors 09 00150 g008
Figure 9. Influence of interfering ions (Cu2+, Co2+, Zn2+, Ni2+, Pb2+, SO42−, Ac, CI, and Br).
Chemosensors 09 00150 g009
Table 1. Comparative study on the performance of different electrochemical sensors for As(III) detection.
ElectrodeMethodSensitivity (μA/ppb)Linear Range (ppb)LOD (ppb)References
MnOX-AuLSASV a0.1930.5–800.057[42]
Au-CSWV0.133 0.375[26]
Gr-PtSWASV b 0.75–7.490.08[16]
PtCV 12–975.68[39]
AuASV c 0–871.80[40]
RTIL-Fe3O4SWASV4.911–108 × 10 −4[35]
Co0.6Fe2.4O4
Nanocubes
SWASV2.121–200.093[43]
Fe3O4–rGOSWASV0.281 0.12[33]
Fe3O4–rGODPASV d0.1422–3000.10[25]
Fe3O4–rGOSWV2.151–201.19This work
a Linear sweep anodic stripping voltammetry; b Square wave anodic stripping voltammetry; c Anodic stripping voltammetry; d Differential pulse anodic stripping voltammetry.
Publisher’s Note: MDPI stays neutral with regard to jurisdictional claims in published maps and institutional affiliations.

