
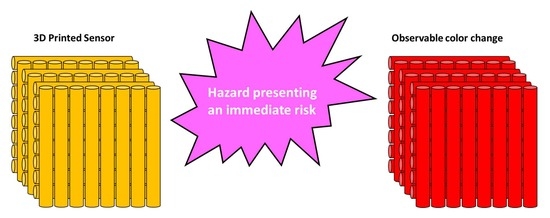
3D Printed Chromophoric Sensors


Abstract
:
1. Introduction
2. Experimental
2.1. Materials
2.2. Formulation Development
2.3. Material Characterization Techniques
3. Results and Discussion
3.1. Sensor Performance
3.2. Sensor Material Characterization
3.3. 3D Printing
4. Conclusions
Author Contributions
Funding
Data Availability Statement
Acknowledgments
Conflicts of Interest
References
- Jung, B.-J.; Kim, J.; Kim, J.-A.; Jang, H.; Seo, S.; Lee, W. PDMS-parylene hybrid, flexible microfluidics for real-time modulation of 3D helical inertial microfluidics. Micromachines 2018, 9, 255. [Google Scholar] [CrossRef] [PubMed] [Green Version]
- Warkiani, M.E.; Khoo, B.L.; Tan, D.S.-W.; Bhagat, A.A.S.; Lim, W.-T.; Yap, Y.S.; Lee, S.C.; Soo, R.A.; Han, J.; Lim, C.T. An ultra-high-throughput spiral microfluidic biochip for the enrichment of circulating tumor cells. Analyst 2014, 139, 3245–3255. [Google Scholar] [CrossRef]
- Bhagat, A.A.S.; Hou, H.W.; Li, L.D.; Lim, C.T.; Han, J. Pinched flow coupled shear-modulated inertial microfluidics for high-throughput rare blood cell separation. Lab A Chip 2011, 11, 1870–1878. [Google Scholar] [CrossRef]
- Warkiani, M.E.; Bhagat, A.A.S.; Khoo, B.L.; Han, J.; Lim, C.T.; Gong, H.Q.; Fane, A.G. Isoporous Micro/Nanoengineered Membranes. ACS Nano 2013, 7, 1882–1904. [Google Scholar] [CrossRef] [PubMed]
- Nam, J.; Jang, W.S.; Lim, C.S. Viscoelastic separation and concentration of fungi from blood for highly sensitive molecular diagnostics. Sci. Rep. 2019, 9, 1–12. [Google Scholar] [CrossRef] [Green Version]
- Chun, J.; Kim, J.W.; Jung, W.-S.; Kang, C.-Y.; Kim, S.-W.; Wang, Z.L.; Baik, J.M. Mesoporous pores impregnated with Au nanoparticles as effective dielectrics for enhancing triboelectric nanogenerator performance in harsh environments. Energy Environ. Sci. 2015, 8, 3006–3012. [Google Scholar] [CrossRef]
- Shahriar, M.; Vo, C.P.; Ahn, K.K. Self-powered flexible PDMS channel assisted discrete liquid column motion based triboelectric nanogenerator (DLC-TENG) as mechanical transducer. Int. J. Precis. Eng. Manuf. Green Technol. 2019, 6, 907–917. [Google Scholar] [CrossRef]
- Zhu, G.; Yang, W.Q.; Zhang, T.; Jing, Q.; Chen, J.; Zhou, Y.S.; Bai, P.; Wang, Z.L. Self-powered, ultrasensitive, flexible tactile sensors based on contact electrification. Nano Lett. 2014, 14, 3208–3213. [Google Scholar] [CrossRef]
- Shin, S.-Y.; Saravanakumar, B.; Ramadoss, A.; Kim, S.J. Fabrication of PDMS-based triboelectric nanogenerator for self-sustained power source application. Int. J. Energy Res. 2016, 40, 288–297. [Google Scholar] [CrossRef]
- Borenstein, J.T.; Terai, H.; King, K.R.; Weinberg, E.; Kaazempur-Mofrad, M.; Vacanti, J. Microfabrication technology for vascularized tissue engineering. Biomed. Microdevices 2002, 4, 167–175. [Google Scholar] [CrossRef]
- Leclerc, E.; Sakai, Y.; Fujii, T. A multi-layer PDMS microfluidic device for tissue engineering applications. In Proceedings of the Sixteenth Annual International Conference on Micro Electro Mechanical Systems, Kyoto, Japan, 23 January 2003; pp. 415–418. [Google Scholar]
- Mata, A.; Fleischman, A.J.; Roy, S. Characterization of polydimethylsiloxane (PDMS) properties for biomedical micro/nanosystems. Biomed. Microdevices 2005, 7, 281–293. [Google Scholar] [CrossRef]
- Li, J.; Liu, X.; Crook, J.; Wallace, G.G. Development of a porous 3D graphene-PDMS scaffold for improved osseointegration. Colloids Surf. B Biointerfaces 2017, 159, 386–393. [Google Scholar] [CrossRef]
- Wang, C.C.; Ding, Z.; Purnawali, H.; Huang, W.M.; Fan, H.; Sun, L. Repeated Instant Self-healing Shape Memory Composites. J. Mater. Eng. Perform. 2012, 21, 2663–2669. [Google Scholar] [CrossRef]
- Orellana, J.; Moreno-Villoslada, I.; Bose, R.K.; Picchioni, F.; Flores, M.E.; Araya-Hermosilla, R. Self-healing polymer nanocomposite materials by Joule effect. Polymers 2021, 13, 649. [Google Scholar] [CrossRef] [PubMed]
- Sun, L.; Huang, W.; Ding, Z.; Zhao, Y.; Wang, C.; Purnawali, H.; Tang, C. Stimulus-responsive shape memory materials: A review. Mater. Des. 2012, 33, 577–640. [Google Scholar] [CrossRef]
- Cui, H.P.; Song, C.L.; Huang, W.M.; Wang, C.C.; Zhao, Y. Rubber-like electrically conductive polymeric materials with shape memory. Smart Mater. Struct. 2013, 22, 055024. [Google Scholar] [CrossRef]
- Murphy, E.; Dumont, J.H.; Park, C.H.; Kestell, G.; Lee, K.; Labouriau, A. Tailoring properties and processing of Sylgard 184: Curing time, adhesion, and water affinity. J. Appl. Polym. Sci. 2020, 137, 48530. [Google Scholar] [CrossRef]
- Brounstein, Z.; Zhao, J.; Wheat, J.; Labouriau, A. Tuning the 3D Printability and Thermomechanical Properties of Radiation Shields. Polymers 2021, 13, 3284. [Google Scholar] [CrossRef] [PubMed]
- Ibarlucea, B.; Fernández-Sánchez, C.; Demming, S.; Büttgenbach, S.; Llobera, A. Selective functionalisation of PDMS-based photonic lab on a chip for biosensing. Analyst 2011, 136, 3496–3502. [Google Scholar] [CrossRef]
- Ghasemi, M.; Roostaei, N.; Sohrabi, F.; Hamidi, S.; Choudhury, P. Biosensing applications of all-dielectric SiO 2-PDMS meta-stadium grating nanocombs. Opt. Mater. Express 2020, 10, 1018–1033. [Google Scholar] [CrossRef]
- Van Dang, B.; Hassanzadeh-Barforoushi, A.; Syed, M.S.; Yang, D.; Kim, S.-J.; Taylor, R.A.; Liu, G.-J.; Liu, G.; Barber, T. Microfluidic Actuation via 3D-Printed Molds toward Multiplex Biosensing of Cell Apoptosis. ACS Sens. 2019, 4, 2181–2189. [Google Scholar] [CrossRef]
- Su, L.; Jiang, Z.; Tian, Z.; Wang, H.; Wang, H.; Zi, Y. Self-powered, ultrasensitive, and high-resolution visualized flexible pressure sensor based on color-tunable triboelectrification-induced electroluminescence. Nano Energy 2021, 79, 105431. [Google Scholar] [CrossRef]
- Lei, K.F.; Lee, K.-F.; Lee, M.-Y. Development of a flexible PDMS capacitive pressure sensor for plantar pressure measurement. Microelectron. Eng. 2012, 99, 1–5. [Google Scholar] [CrossRef]
- Gong, X.X.; Fei, G.T.; Fu, W.B.; Fang, M.; Gao, X.D.; Zhong, B.N.; De Zhang, L. Flexible strain sensor with high performance based on PANI/PDMS films. Org. Electron. 2017, 47, 51–56. [Google Scholar] [CrossRef]
- Wu, S.; Ladani, R.B.; Zhang, J.; Ghorbani, K.; Zhang, X.; Mouritz, A.P.; Kinloch, A.J.; Wang, C.H. Strain Sensors with Adjustable Sensitivity by Tailoring the Microstructure of Graphene Aerogel/PDMS Nanocomposites. ACS Appl. Mater. Interfaces 2016, 8, 24853–24861. [Google Scholar] [CrossRef] [PubMed]
- Yang, J.; Wei, D.; Tang, L.; Song, X.; Luo, W.; Chu, J.; Gao, T.; Shi, H.; Du, C. Wearable temperature sensor based on graphene nanowalls. RSC Adv. 2015, 5, 25609–25615. [Google Scholar] [CrossRef]
- Wu, L.; Qian, J.; Peng, J.; Wang, K.; Liu, Z.; Ma, T.; Zhou, Y.; Wang, G.; Ye, S. Screen-printed flexible temperature sensor based on FG/CNT/PDMS composite with constant TCR. J. Mater. Sci. Mater. Electron. 2019, 30, 9593–9601. [Google Scholar] [CrossRef]
- Dang, W.; Manjakkal, L.; Lorenzelli, L.; Vinciguerra, V.; Dahiya, R. Stretchable pH sensing patch in a hybrid package. In Proceedings of the 2017 IEEE SENSORS, Glasgow, UK, 29 October–1 November 2017; IEEE: New York, NY, USA, 2017; pp. 1–3. [Google Scholar]
- Sousa, R.P.C.L.; Ferreira, B.; Azenha, M.; Costa, S.P.G.; Silva, C.J.R.; Figueira, R. PDMS Based Hybrid Sol-Gel Materials for Sensing Applications in Alkaline Environments: Synthesis and Characterization. Polymers 2020, 12, 371. [Google Scholar] [CrossRef] [Green Version]
- Mani, G.K.; Nimura, Y.; Tsuchiya, K. Advanced Artificial Electronic Skin Based pH Sensing System for Heatstroke Detection. ACS Sens. 2020, 5, 911–916. [Google Scholar] [CrossRef]
- Komazaki, Y.; Uemura, S. Stretchable, printable, and tunable PDMS-CaCl2 microcomposite for capacitive humidity sensors on textiles. Sens. Actuators B Chem. 2019, 297, 126711. [Google Scholar] [CrossRef]
- Tripathy, A.; Sharma, P.; Sahoo, N.; Pramanik, S.; Abu Osman, N. Moisture sensitive inimitable Armalcolite/PDMS flexible sensor: A new entry. Sens. Actuators B Chem. 2018, 262, 211–220. [Google Scholar] [CrossRef]
- Hwang, I.-S.; Kim, Y.-S.; Kim, S.-J.; Ju, B.-K.; Lee, J.-H. A facile fabrication of semiconductor nanowires gas sensor using PDMS patterning and solution deposition. Sens. Actuators B Chem. 2009, 136, 224–229. [Google Scholar] [CrossRef]
- Nam, Y.-S.; Yoo, I.; Yarimaga, O.; Park, I.S.; Park, D.-H.; Song, S.; Kim, J.-M.; Lee, C.W. Photochromic spiropyran-embedded PDMS for highly sensitive and tunable optochemical gas sensing. Chem. Commun. 2014, 50, 4251–4254. [Google Scholar] [CrossRef]
- Zhang, H.; Byrne, R. Spectrophotometric pH measurements of surface seawater at in-situ conditions: Absorbance and protonation behavior of thymol blue. Mar. Chem. 1996, 52, 17–25. [Google Scholar] [CrossRef]
- Yamazaki, H.; Sperline, R.; Freiser, H. Spectrophotometric determination of the dissociation constant (pKa) of arsenous acid. Anal. Chim. Acta 1993, 284, 379–384. [Google Scholar] [CrossRef]
- Balderas, P.; Ramírez-Silva, M.T.; Romo, M.A.R.; Palomar-Pardavé, M.; Roa, G.; Barrera-Díaz, C.E.; Rojas-Hernández, A. Experimental correlation between the pKa value of sulfonphthaleins with the nature of the substituents groups. Spectrochim. Acta Part A Mol. Biomol. Spectrosc. 2008, 69, 1235–1245. [Google Scholar] [CrossRef]
- Zaggout, F.R.; El-Nahhal, I.M.; Qaraman, A.E.-F.A.; Al Dahoudi, N. Behavior of thymol blue analytical pH-indicator entrapped into sol–gel matrix. Mater. Lett. 2006, 60, 3463–3467. [Google Scholar] [CrossRef]
- Nakamura, N.; Amao, Y. An optical sensor for CO2 using thymol blue and europium(III) complex composite film. Sens. Actuators B Chem. 2003, 92, 98–101. [Google Scholar] [CrossRef]
- Nakamura, N.; Amao, Y. Optical sensor for carbon dioxide combining colorimetric change of a pH indicator and a reference luminescent dye. Anal. Bioanal. Chem. 2003, 376, 642–646. [Google Scholar] [CrossRef]
- Stocker, M.K.; Sanson, M.L.; Bernardes, A.A.; Netto, A.M.; Brambilla, R. Acid–base sensor based on sol–gel encapsulation of bromothymol blue in silica: Application for milk spoilage detection. J. Sol.-Gel. Sci. Technol. 2021, 98, 568–579. [Google Scholar] [CrossRef]
- Pradhan, P.; Mascarenhas, R.J.; Thomas, T.; Namboothiri, I.N.; D’Souza, O.J.; Mekhalif, Z. Electropolymerization of bromothymol blue on carbon paste electrode bulk modified with oxidized multiwall carbon nanotubes and its application in amperometric sensing of epinephrine in pharmaceutical and biological samples. J. Electroanal. Chem. 2014, 732, 30–37. [Google Scholar] [CrossRef]
- Liu, Z.; Luo, F.; Chen, T. Phenolphthalein immobilized membrane for an optical pH sensor. Anal. Chim. Acta 2004, 510, 189–194. [Google Scholar] [CrossRef]
- Sharifabad, A.N.; Bahrami, S.H. Halochromic chemosensor from poly (acrylonitrile)/phenolphthalein nanofibers as pH sensor. IEEE Sens. J. 2015, 16, 873–880. [Google Scholar] [CrossRef]
- Ali, S.; Hassan, A.; Hassan, G.; Bae, J.; Lee, C.H. All-printed humidity sensor based on graphene/methyl-red composite with high sensitivity. Carbon 2016, 105, 23–32. [Google Scholar] [CrossRef]
- Hassan, G.; Sajid, M.; Choi, C. Highly Sensitive and Full Range Detectable Humidity Sensor using PEDOT:PSS, Methyl Red and Graphene Oxide Materials. Sci. Rep. 2019, 9, 1–10. [Google Scholar] [CrossRef] [Green Version]
- Singh, G.; Girdhar, S.; Singh, A.; Saroa, A.; Lakhi, J.S.; Khullar, S.; Mandal, S.K. Selective mercury ion recognition using a methyl red (MR) based silatrane sensor. New J. Chem. 2018, 42, 6315–6321. [Google Scholar] [CrossRef]
- Nakano, N.; Ishikawa, M.; Kobayashi, Y.; Nagashima, K. Development of a Monitoring Tape for Formaldehyde Using Hydroxylamine Sulfate and Methyl Yellow. Anal. Sci. 1994, 10, 641–645. [Google Scholar] [CrossRef] [Green Version]
- Wang, X.; Si, Y.; Wang, J.; Ding, B.; Yu, J.; Al-Deyab, S.S. A facile and highly sensitive colorimetric sensor for the detection of formaldehyde based on electro-spinning/netting nano-fiber/nets. Sens. Actuators B Chem. 2012, 163, 186–193. [Google Scholar] [CrossRef]
- Cruickshank, D.L.; Hendon, C.H.; Verbeek, M.J.R.; Walsh, A.; Wilson, C.C. Polymorphism of the azobenzene dye compound methyl yellow. CrystEngComm 2016, 18, 3456–3461. [Google Scholar] [CrossRef] [Green Version]
- Patterson, G.S. A Simplified Method for Finding the pKa of an Acid-Base Indicator by Spectrophotometry. J. Chem. Educ. 1999, 76, 395. [Google Scholar] [CrossRef]
- Shokrollahi, A.; Zarghampour, F.; Akbari, S.; Salehi, A. Solution scanometry, a new method for determination of acidity constants of indicators. Anal. Methods 2015, 7, 3551–3558. [Google Scholar] [CrossRef]
- Chasse, W.; Lang, M.; Sommer, J.-U.; Saalwachter, K. Cross-link density estimation of PDMS networks with precise consideration of networks defects. Macromolecules 2012, 45, 899–912. [Google Scholar] [CrossRef]
- Dimitriyev, M.S.; Chang, Y.-W.; Goldbart, P.M.; Fernández-Nieves, A. Swelling thermodynamics and phase transitions of polymer gels. Nano Futures 2019, 3, 042001. [Google Scholar] [CrossRef] [Green Version]
- Brounstein, Z.; Zhao, J.; Geller, D.; Gupta, N.; Labouriau, A. Long-Term Thermal Aging of Modified Sylgard 184 Formulations. Polymers 2021, 13, 3125. [Google Scholar] [CrossRef]
- Chassé, W.; Lang, M.; Sommer, J.-U.; Saalwächter, K. Correction to cross-link density estimation of PDMS networks with precise consideration of networks defects. Macromolecules 2015, 48, 1267–1268. [Google Scholar] [CrossRef]
- Krumova, M.; López, D.; Benavente, R.; Mijangos, C.; Pereña, J. Effect of crosslinking on the mechanical and thermal properties of poly(vinyl alcohol). Polymers 2000, 41, 9265–9272. [Google Scholar] [CrossRef]
- Safranski, D.L.; Gall, K. Effect of chemical structure and crosslinking density on the thermo-mechanical properties and toughness of (meth)acrylate shape memory polymer networks. Polymers 2008, 49, 4446–4455. [Google Scholar] [CrossRef] [Green Version]
- Dumont, J.; Murphy, E.; Geller, D.; Lee, K.-S.; Labouriau, A. Effects of thermal aging and ionizing radiation on sPVC and aromatic polyether urethane used to store nuclear materials. Polym. Test. 2019, 78, 105960. [Google Scholar] [CrossRef]
- Titow, M. PVC Technology; Springer Science & Business Media: Berlin, Germany, 2012. [Google Scholar]
- Engel, J.; Chen, J.; Bullen, D.; Liu, C. Polyurethane rubber as a MEMS material: Characterization and demonstration of an all-polymer two-axis artificial hair cell flow sensor. In Proceedings of the 18th IEEE International Conference on Micro Electro Mechanical Systems, Miami Beach, FL, USA, 30 January–3 February 2005; IEEE: New York, NY, USA, 2005; pp. 279–282. [Google Scholar]
- Zulfiqar, S.; Ahmad, S. Thermal degradation of blends of PVAC with polysiloxane—II. Polym. Degrad. Stab. 2001, 71, 299–304. [Google Scholar] [CrossRef]
- Olima, M. Mechanical Characterization of Polydimethylsiloxane. Master’s Thesis, The University of Oklahoma, Norman, OK, USA, 2017. [Google Scholar]
- Thomas, T.H.; Kendrick, T.C. Thermal analysis of polydimethylsiloxanes. I. Thermal degradation in controlled atmospheres. J. Polym. Sci. Part A-2 Polym. Phys. 1969, 7, 537–549. [Google Scholar] [CrossRef]
- Örn, A. Degradation Studies on Polydimethylsiloxane. Master’s Thesis, Åbo Akademi University, Turku, Finland, 2019. [Google Scholar]


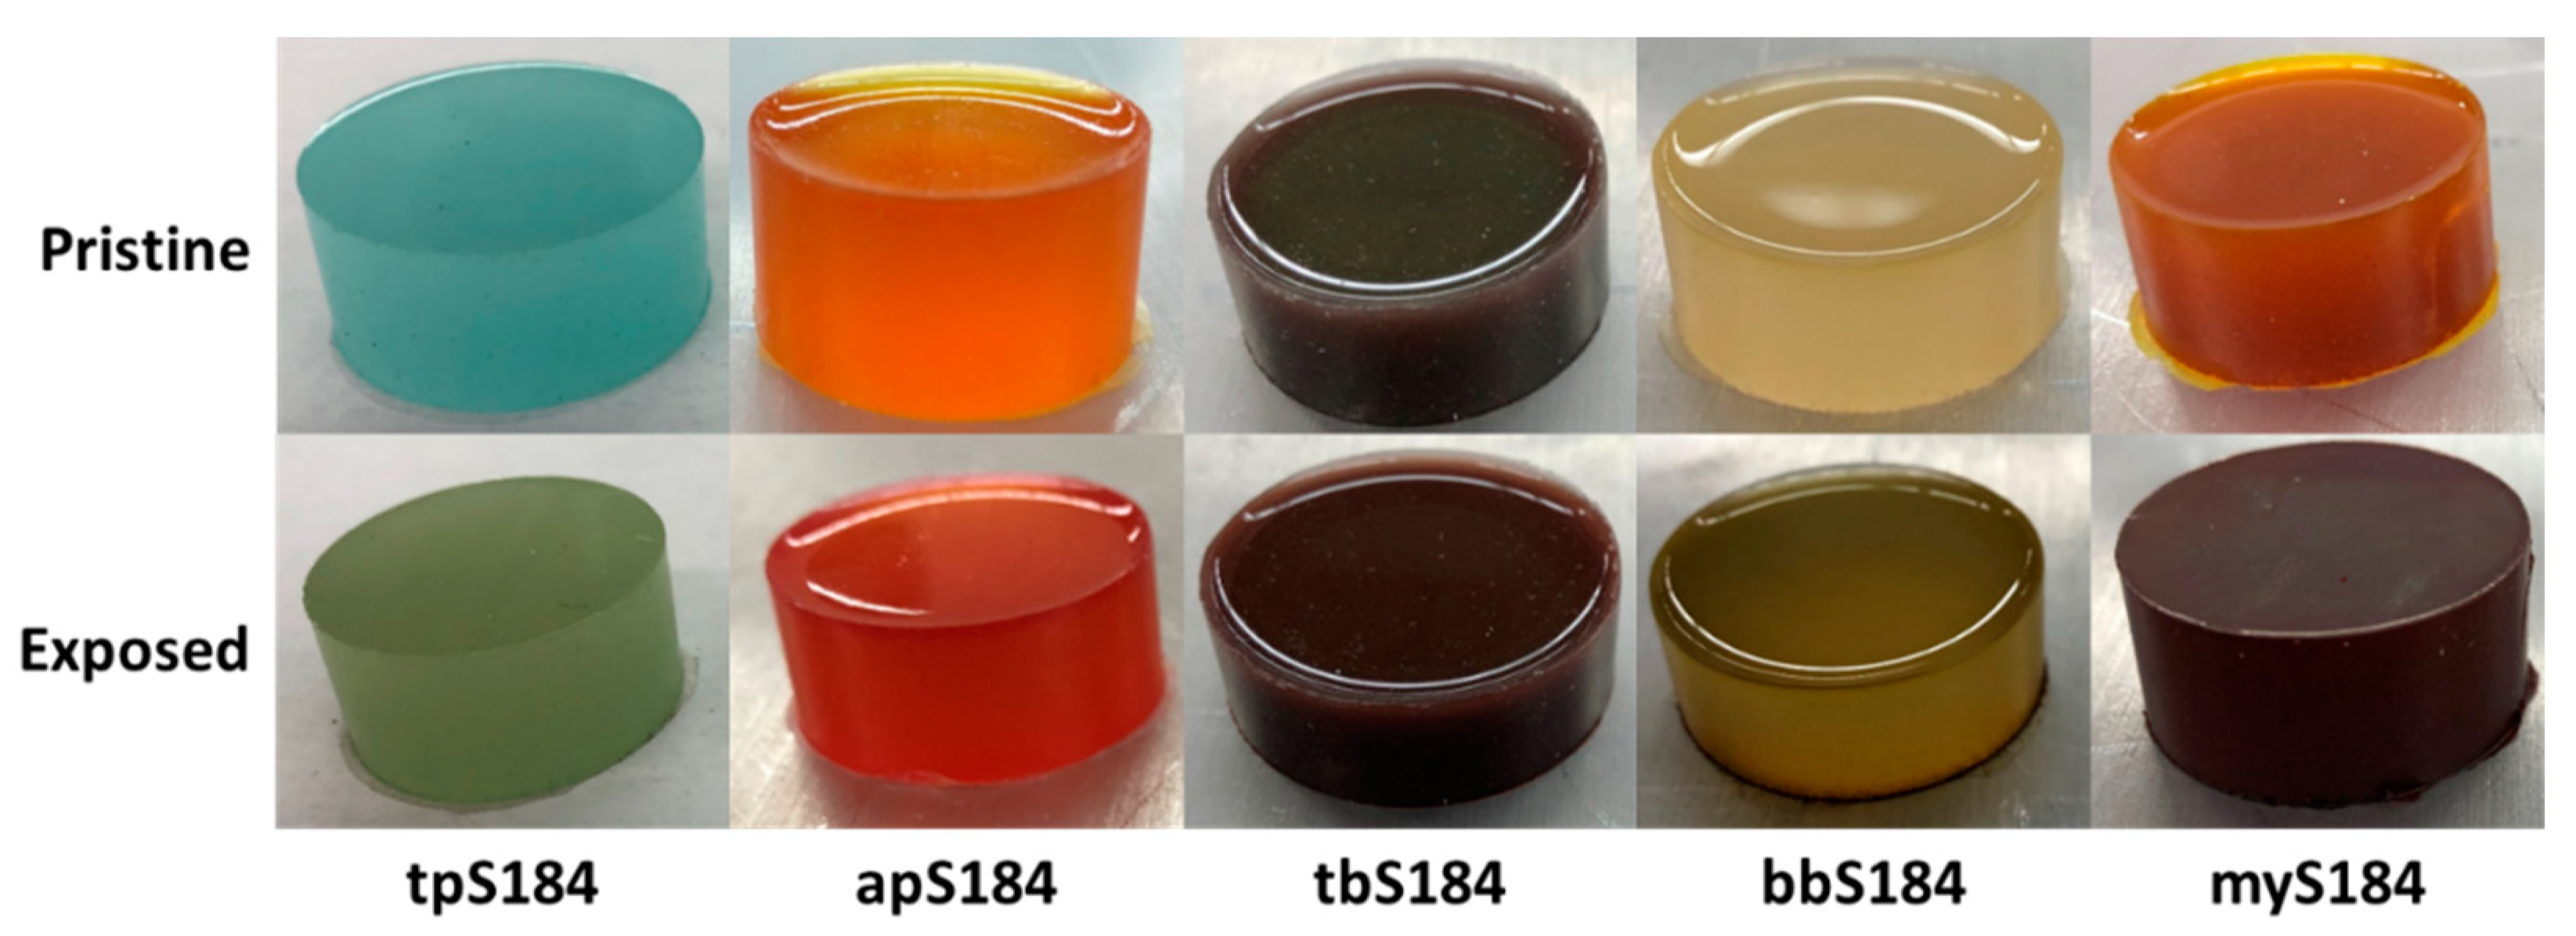
| Indicator | Solution pH, Color | Solution pH, Color |
|---|---|---|
| Thymol blue [36] | <8, yellow | >9, blue |
| Bromothymol blue [38] | <6, yellow | >7, blue |
| Phenolphthalein [52] | >8, pink | |
| Methyl red [52,53] | <4, red | >6, yellow |
| Methyl yellow [53] | <3, red | >4, yellow |
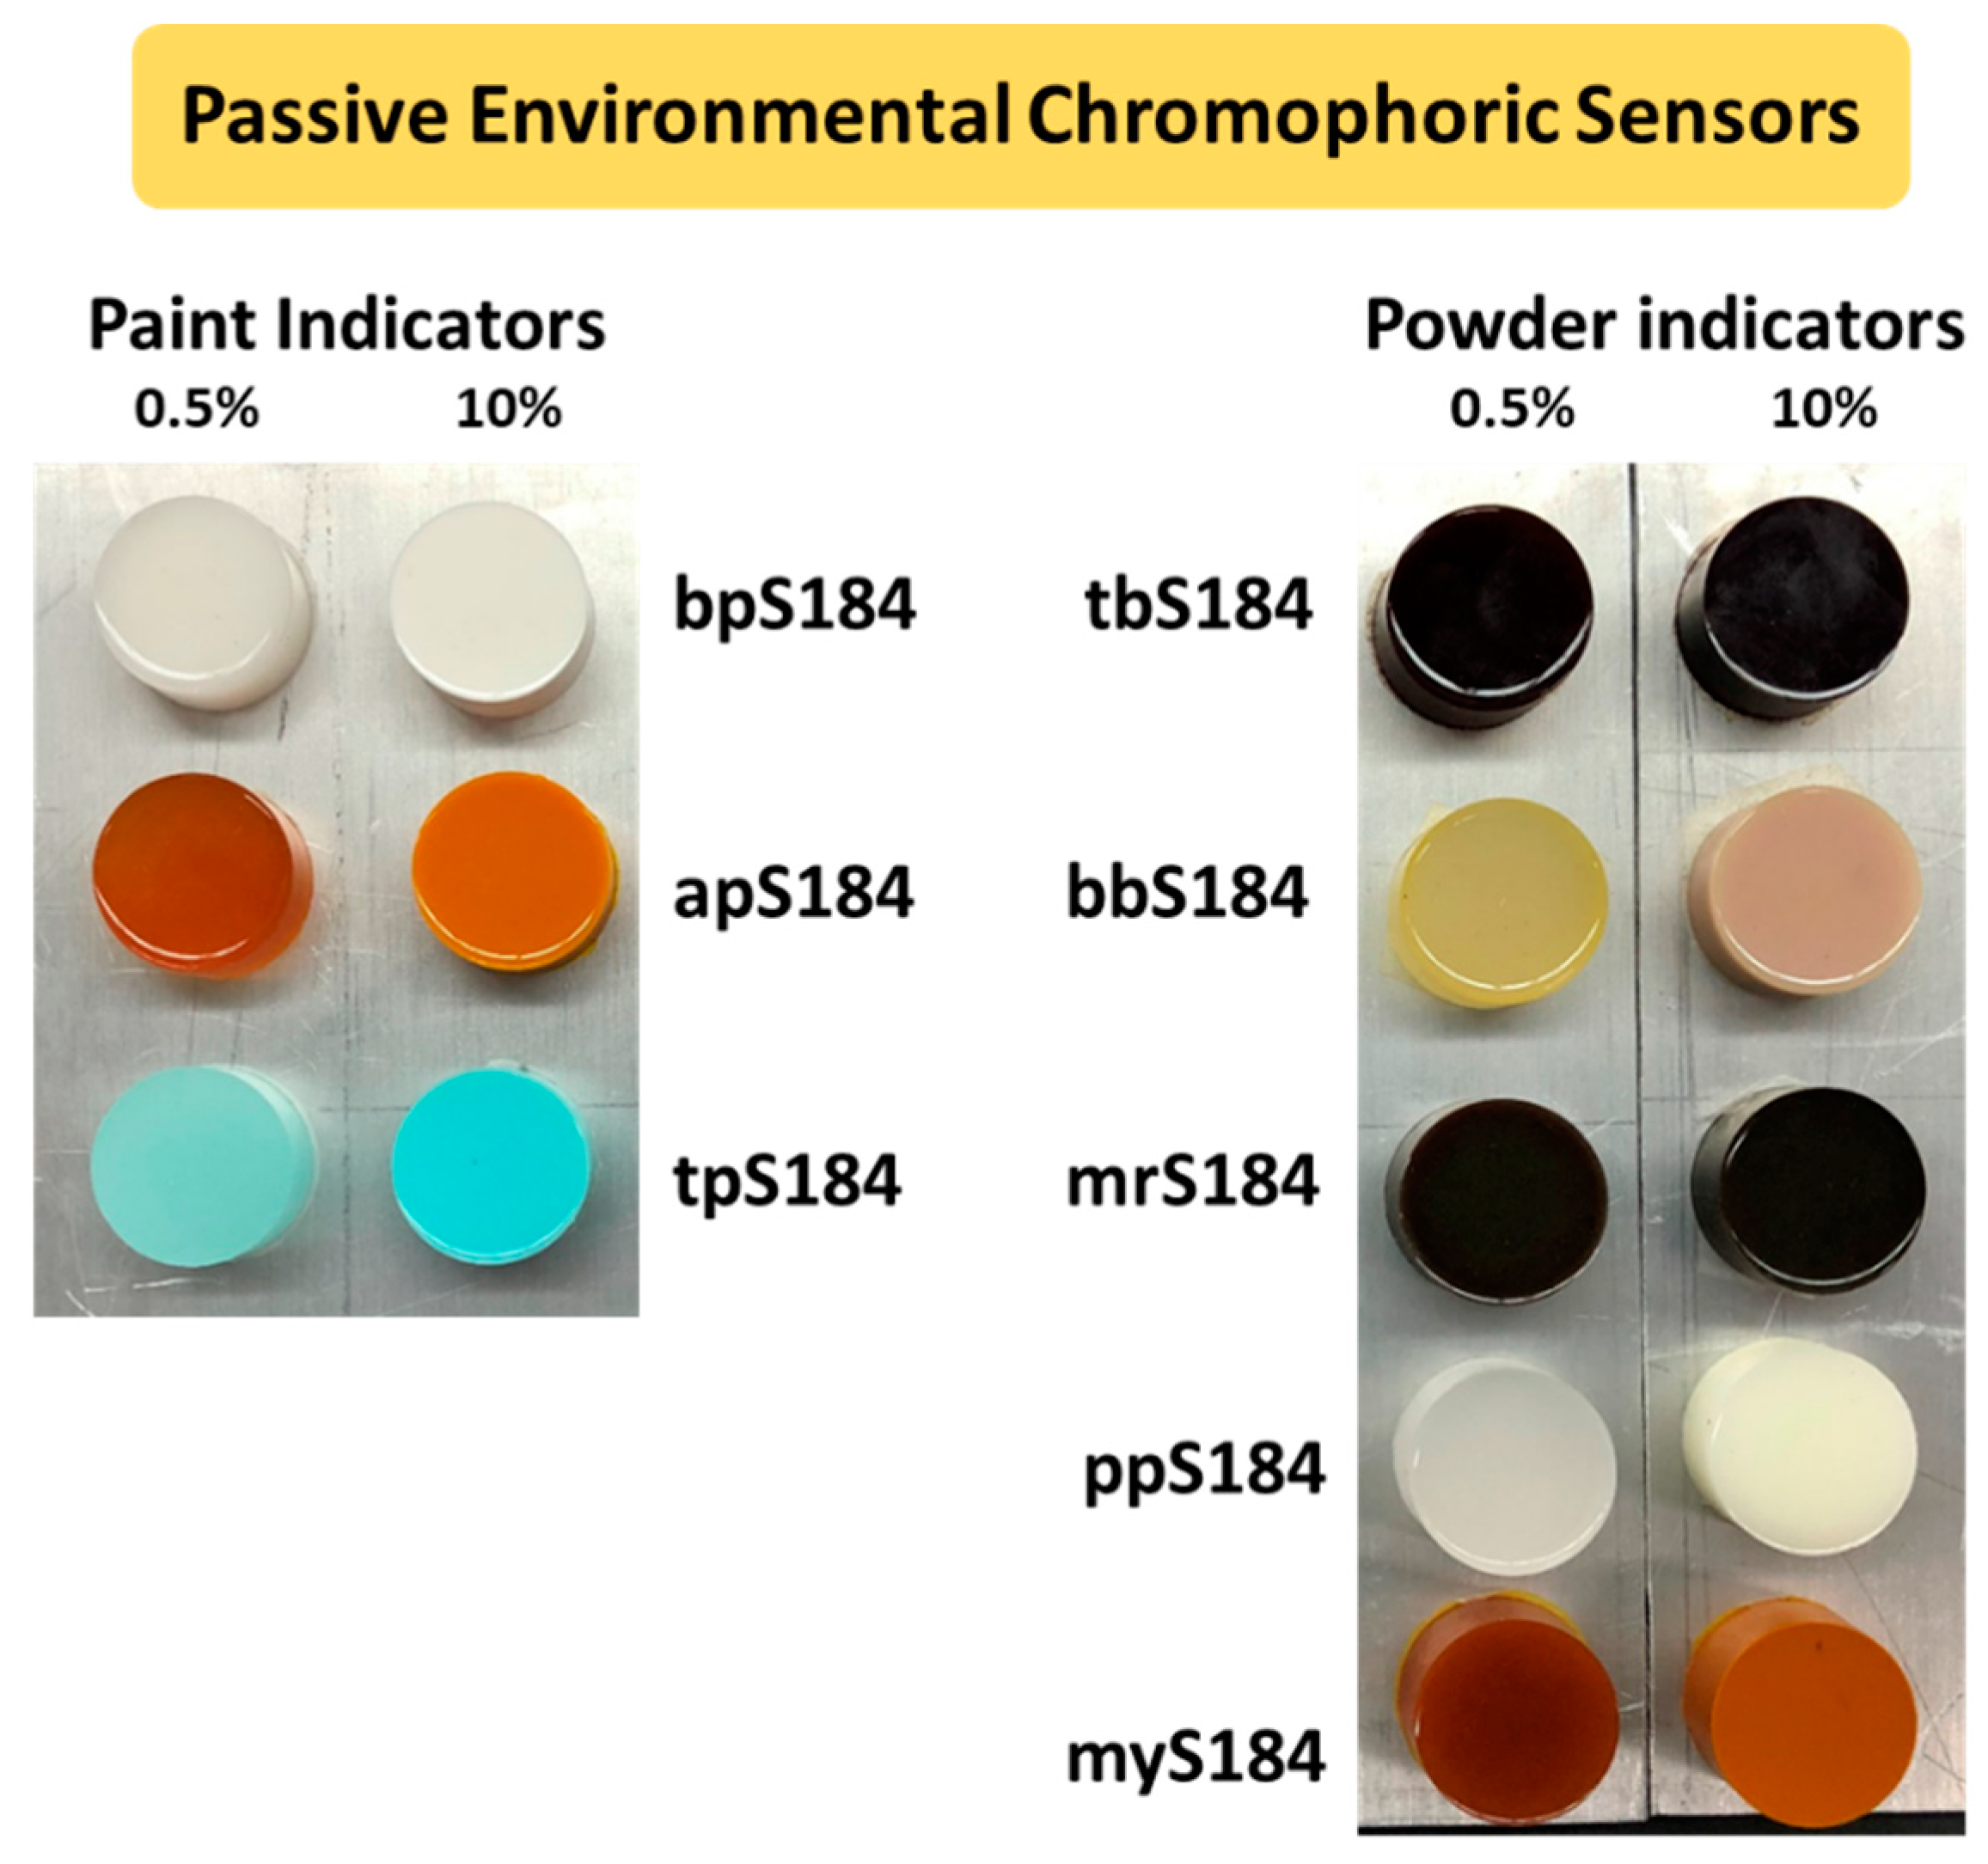
| Sample | Components | |
|---|---|---|
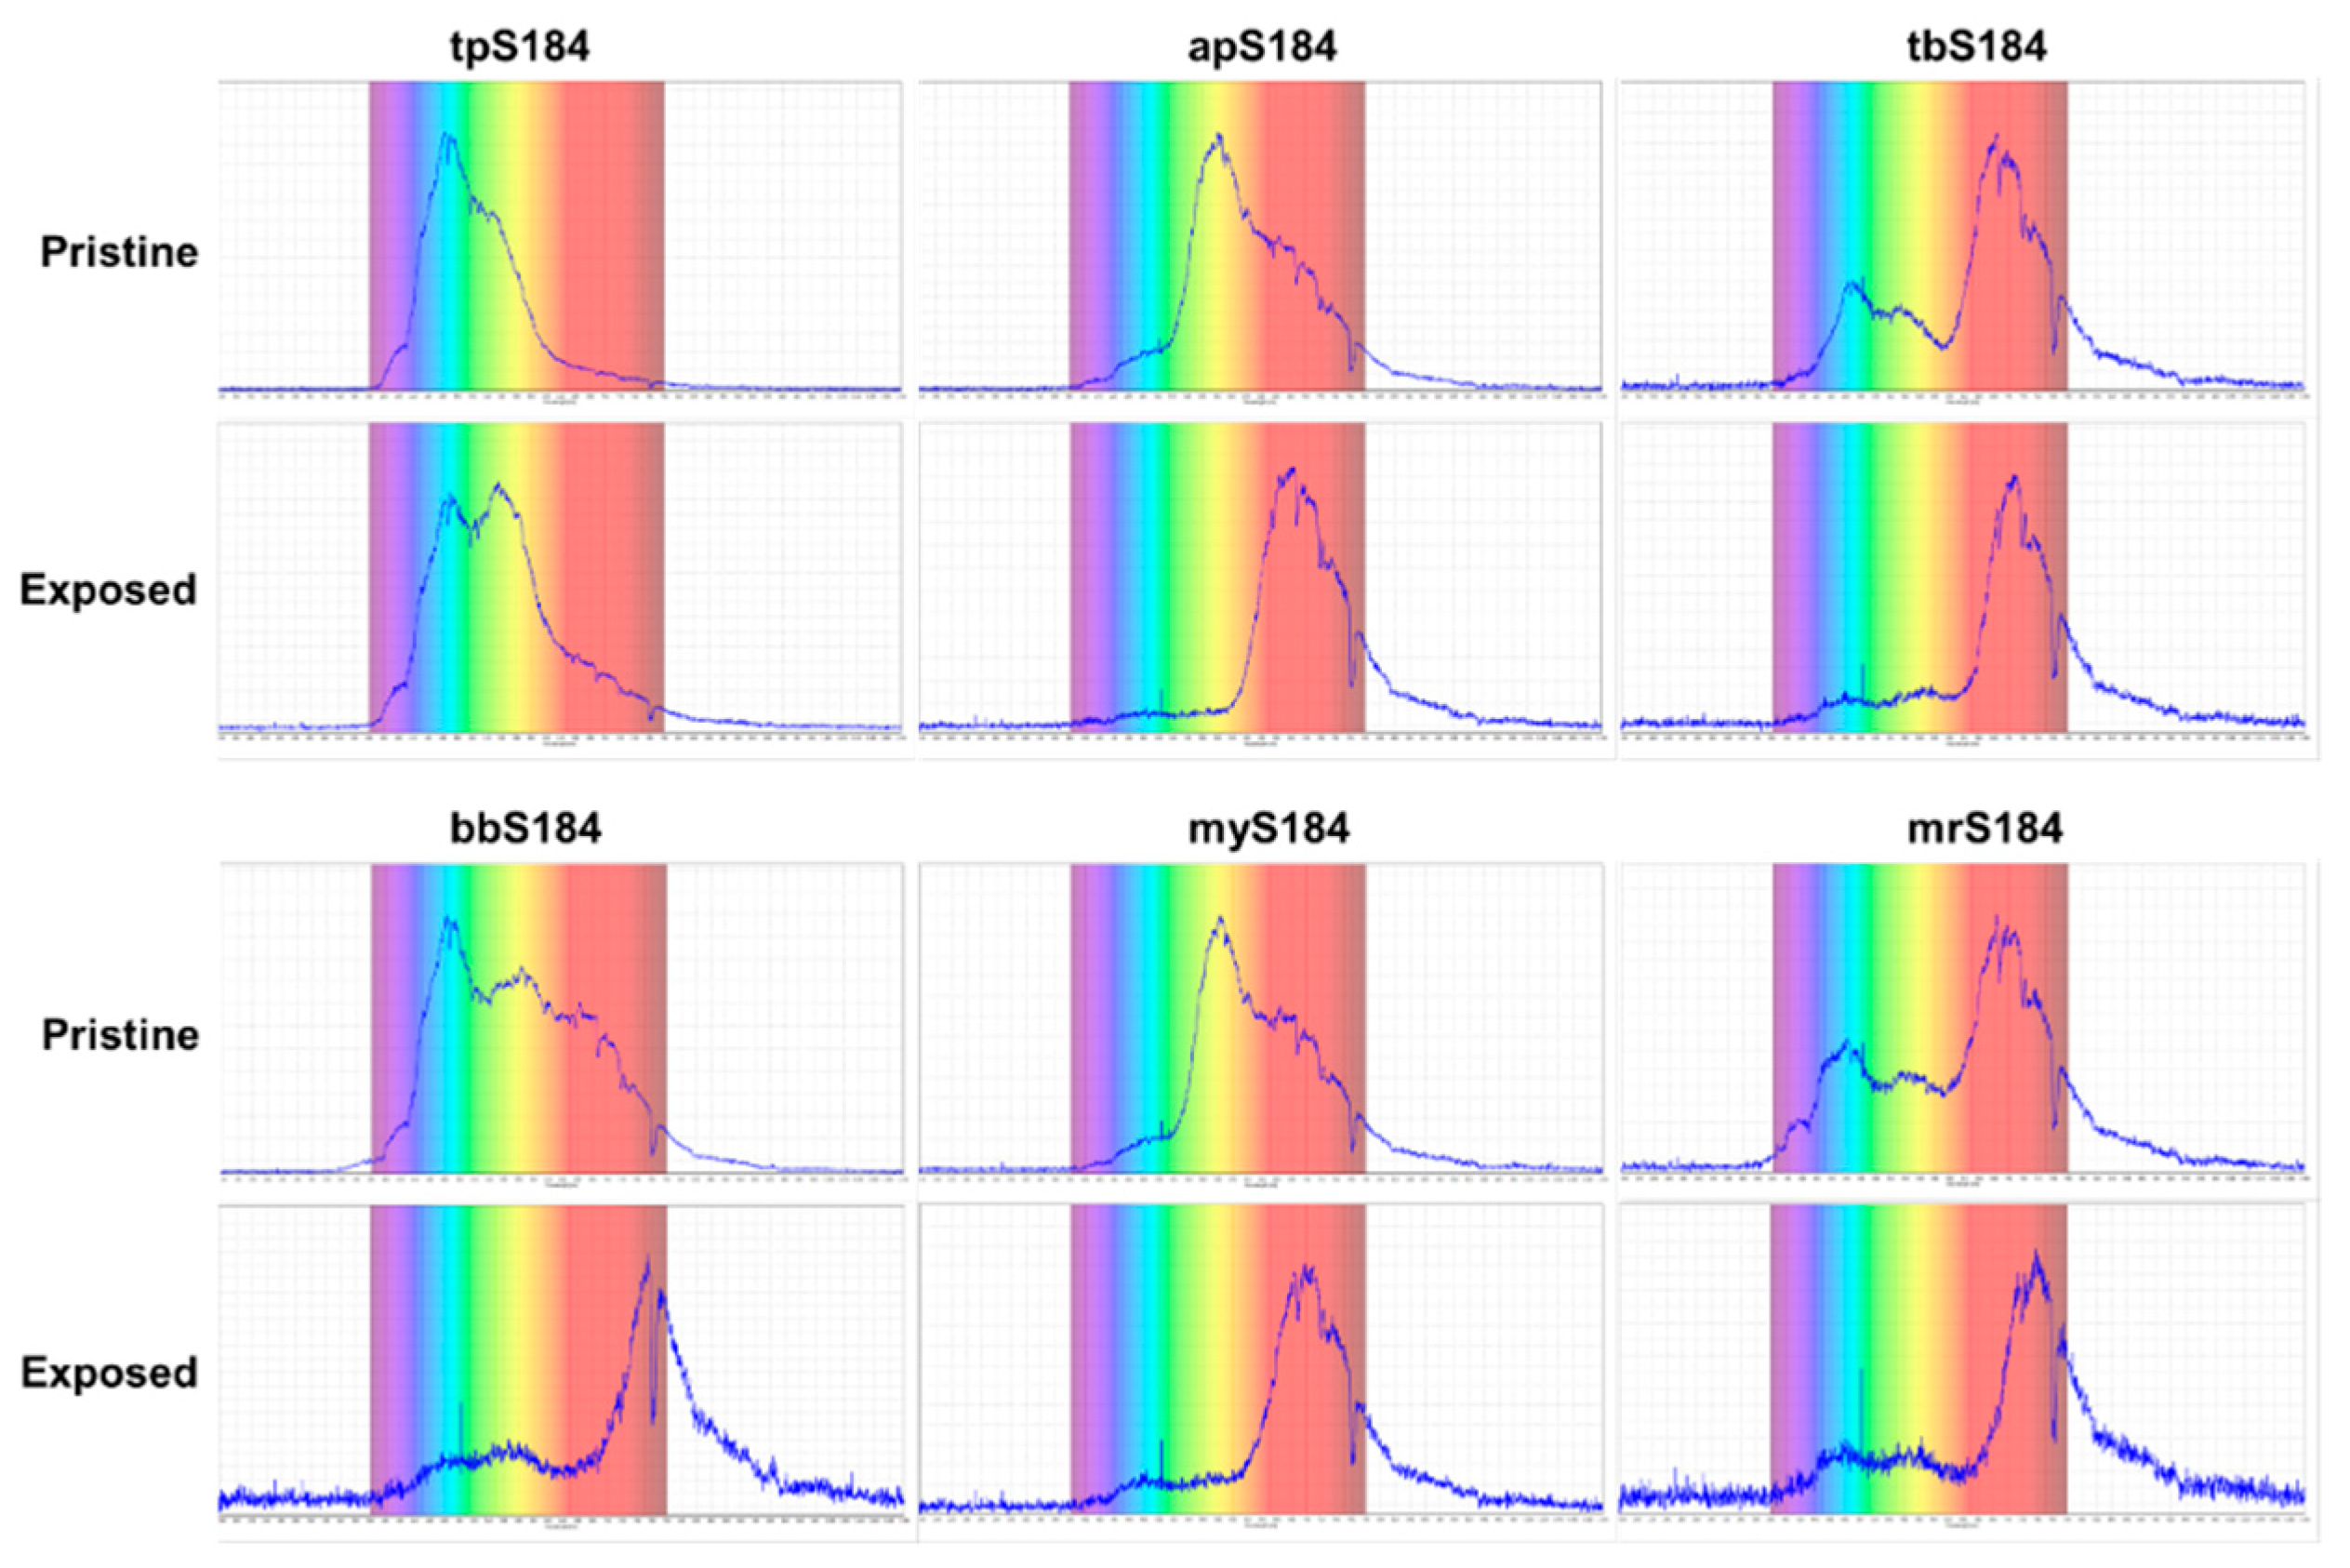
| tpS184 | Sylgard 184 + | thermal paint |
| bpS184 | Sylgard 184 + | base paint |
| apS184 | Sylgard 184 + | acid paint |
| tbS184 | Sylgard 184 + | thymol blue |
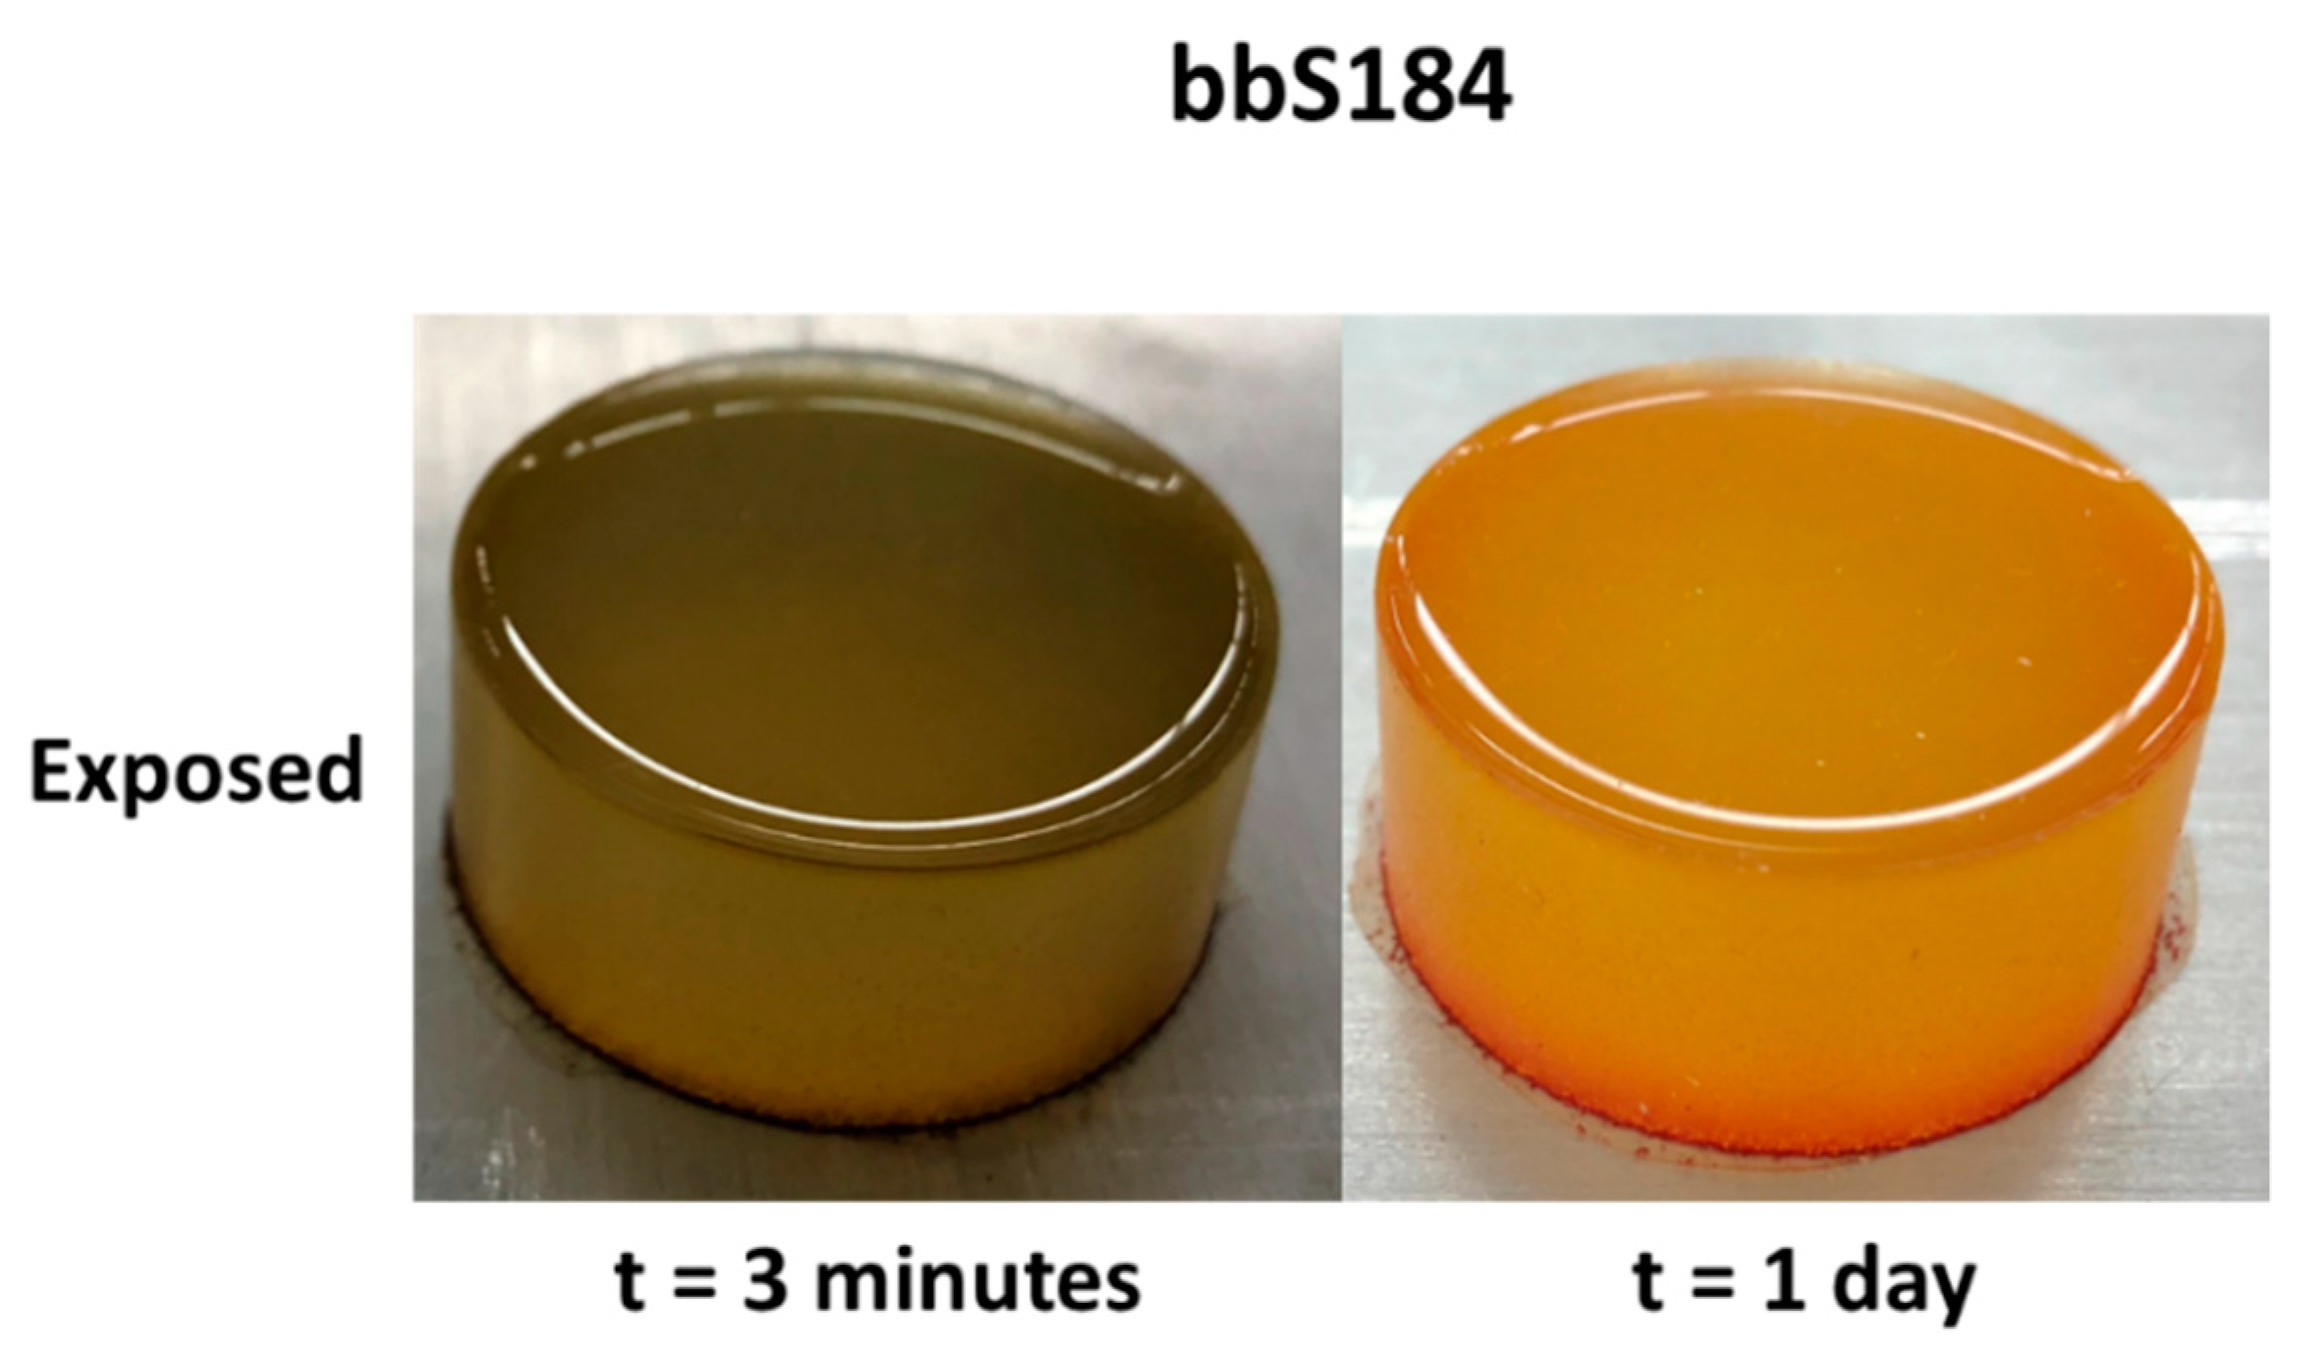
| bbS184 | Sylgard 184 + | bromothymol blue |
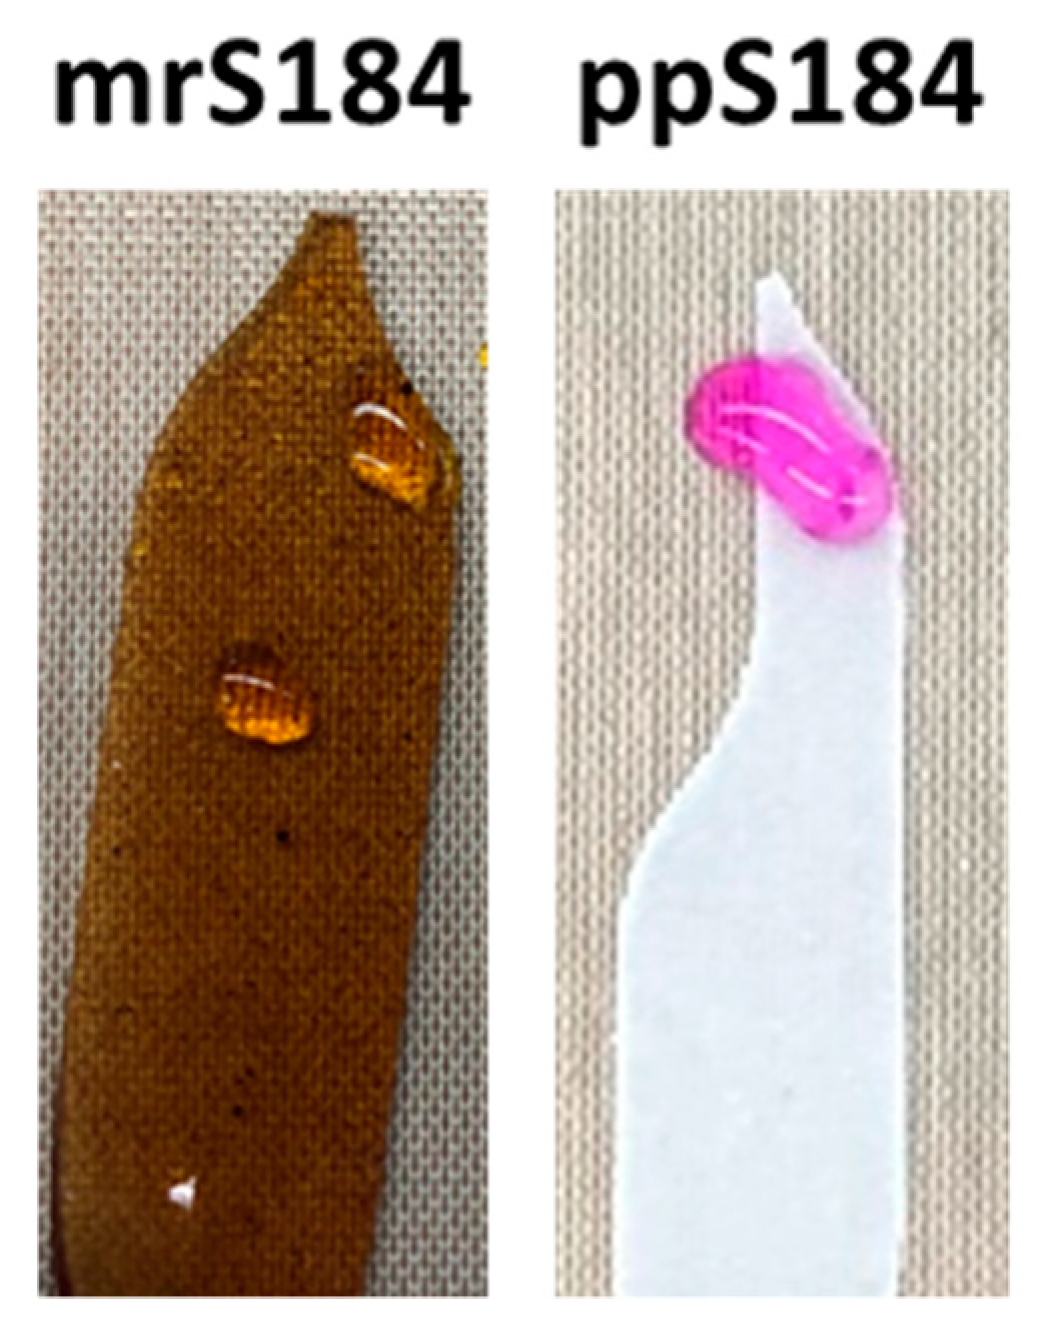
| ppS184 | Sylgard 184 + | phenolphthalein |
| mrS184 | Sylgard 184 + | methyl red |
| myS184 | Sylgard 184 + | methyl yellow |
| Sample | Network Swelling (%) | Specific Crosslink Density (mol Crosslink/g Material) | Shore A Hardness |
|---|---|---|---|
| tpS184 | 115 ± 3 | 3.60 10−4 | 42.6 ± 0.4 |
| bpS184 | 151 ± 2 | 2.52 10−4 | 31.2 ± 1.0 |
| apS184 | 149 ± 7 | 2.57 10−4 | 31.2 ± 1.4 |
| tbS184 | 106 ± 0 | 3.94 10−4 | 42.9 ± 0.2 |
| bbS184 | 122 ± 2 | 3.35 10−4 | 41.0 ± 1.1 |
| ppS184 | 127 ± 2 | 3.27 10−4 | 43.0 ± 0.4 |
| mrS184 | 159 ± 3 | 2.44 10−4 | 32.2 ± 0.6 |
| myS184 | 149 ± 2 | 2.48 10−4 | 30.4 ± 0.2 |
| Sylgard 184 | 147 ± 1 | 3.16 10−4 | 37.3 ± 0.3 |
| Sample | Td5% (°C) | TdMax (°C) | mf (%) |
|---|---|---|---|
| tpS184 | 409 | 544 | 33 |
| bpS184 | 424 | 616 | 46 |
| apS184 | 400 | 508 | 31 |
| tbS184 | 426 | 579 | 47 |
| bbS184 | 415 | 665 | 31 |
| ppS184 | 409 | 499 | 35 |
| mrS184 | 423 | 527 | 20 |
| myS184 | 408 | 527 | 28 |
| Syglard 184 | 370 | 540 | 45 |
Publisher’s Note: MDPI stays neutral with regard to jurisdictional claims in published maps and institutional affiliations. |
© 2021 by the authors. Licensee MDPI, Basel, Switzerland. This article is an open access article distributed under the terms and conditions of the Creative Commons Attribution (CC BY) license (https://creativecommons.org/licenses/by/4.0/).
Share and Cite
Brounstein, Z.; Ronquillo, J.; Labouriau, A. 3D Printed Chromophoric Sensors. Chemosensors 2021, 9, 317. https://doi.org/10.3390/chemosensors9110317
Brounstein Z, Ronquillo J, Labouriau A. 3D Printed Chromophoric Sensors. Chemosensors. 2021; 9(11):317. https://doi.org/10.3390/chemosensors9110317
Chicago/Turabian StyleBrounstein, Zachary, Jarrod Ronquillo, and Andrea Labouriau. 2021. "3D Printed Chromophoric Sensors" Chemosensors 9, no. 11: 317. https://doi.org/10.3390/chemosensors9110317
APA StyleBrounstein, Z., Ronquillo, J., & Labouriau, A. (2021). 3D Printed Chromophoric Sensors. Chemosensors, 9(11), 317. https://doi.org/10.3390/chemosensors9110317