Abstract
Novel reliable and cost-effective potentiometric screen-printed sensors for free bilirubin (BR) detection were presented. The sensors were fabricated using ordered mesoporous carbon (OMC) as an ion-to-electron transducer. The ion-association complex [Ni(bphen)3]2+[BR]2− was utilized as a sensory recognition material in the plasticized Polyvinyl Chloride (PVC) membrane. The membrane was drop-casted on the OMC layer, which is attached on a carbon conductor (2-mm diameter). In a 50 mM phosphate solution of pH 8.5, the electrodes offered a Nernstian slope of −26.8 ± 1.1 (r2 = 0.9997) mV/decade with a range of linearity 1.0 × 10⁻⁶–1 × 10⁻² M towards free bilirubin with a detection limit 8.8 × 10⁻⁷ M (0.52 µg/mL). The presented sensors offered good features in terms of reliability, ease of design, high potential stability, high specificity and good accuracy and precision. Chronopotentiometric and electrochemical impedance spectrometric measurements were used for short-term potential stability and interfacial capacitance calculations. The sensors were used for the determination of free bilirubin in biological fluids. The data obtained are fairly well consistent with those obtained by the reference spectophotometric method. Based on the interaction of free BR with albumin (1:1), the sensors were also utilized for the assessment of albumin in human serum.
1. Introduction
Bilirubin (BR) is a tetrapyrrole compound that can be found in digestive juice due to the breakdown of hemoglobin (Hb) in vertebrates [1]. It exists in two forms, un-conjugated bilirubin (UCB), which is water insoluble and binds to albumin in serum, and conjugated bilirubin (CB) (i.e., free bilirubin), which is conjugated with glucuronic acid in the liver [2,3]. The solubility of free BR is pH dependent and can deposit in tissues [4]. Free bilirubin can accumulate in brain tissue, leading to irreversible damage. This damage can lead to death through various neurological deficits, seizures, abnormal reflexes and eye movements. Bilirubin-induced brain dysfunction is known as kernicterus or bilirubin encephalopathy [5,6]. The reference concentration level of free BR in healthy adults’ serum is 5–34 μM; however, in hyperbilirubinemia newborns, the level of free BR is higher than 500 μM [7]. In cases of hyperbilirubinemia, it is very important to monitor the level of free BR in serum. Acute bilirubin encephalopathy, in which BR crosses the blood–brain barrier and can cause irreversible neurological damage, has been found in newborns with normal levels of total BR but high levels of free BR [8]. Therefore, analysis of free bilirubin at point of care will facilitate the proposed treatment protocols that will reduce the risk of brain damage or death.
Several analytical techniques were reported for BR quantification, such as fluorimetry [9], voltammetry [7], enzymatic electrochemical sensors based on enzymatic reactions [10,11,12], chemiluminescence [13], high-performance liquid chromatography (HPLC) [14], piezoelectricity [15] and capillary electrophoresis [16]. Bilirubin has been measured in clinical laboratories in three common methods. The first is based on the reaction of BR with diazotized sulfanilic acid and the product is measured spectrophotometrically [17]. This method is highly affected by pH variation. The second method is a direct spectroscopic method which has severed interference from the presence of other heme containing proteins and does not quantify free BR [18]. The last method is the transcutaneous bilirubinometry (i.e., a skin reflectance technique), which is employed in most hospitals, and the results can be influenced by skin pigmentation [19,20]. These methods suffer from severe limitations, namely they are time consuming, complicated instruments are required, they are expensive and non-reliable, multiple steps for sample preparation and separation are needed, and expensive and unstable reagents are required. In addition, all of these methods are not able to determine free BR but they measure only the total BR (complexed and free).
Ion-selective electrodes (ISEs) based on potentiometric transduction are characterized by many distinctive features such as high sensitivity in measurement, good selectivity, easy operation and can be a good alternative to free BR detection. These types of sensors have been widely used to detect several analytes in clinical, environmental and industrial analyses [21,22,23,24,25,26]. Disposable screen-printed electrodes (SPEs) can be integrated in potentiometric techniques and offered an attractive alternative to the conventional potentiometry [27,28]. SPE can be assigned to mass-production technology, which is based on the screening of the electro-conductive material and insulating inks at a controlled thickness onto planar substrates made from different materials (i.e., plastic, ceramic, paper, polymers, etc.). The integration of SPE in potentiometric techniques offered many advantages, such as: the elimination of associated cumbersome handling related to the use of the conventional electrochemical cells, no need for the lengthy cleaning procedures and ease of integration with portable instruments [29,30].
Direct application of the ion-sensing membrane to the screen of the electroc-conductive material in SPEs can be considered as a type of coated wire electrodes (CWEs). These types of electrodes rely on the blocked interface between ionic conductor (membrane) and electronic conductor and in general show poor stability. Even if the interface is ideally blocked with no charge transfer a variable parasitic capacitance will affect the stability of the signal [31]. However, in the solid-contact ISEs (SC-ISEs), the solid-contact material inserted between the ion-sensing membrane (ISM) and the electron-conducting substrate serves as the ion-to-electron transducer. Recently, carbon-based nano-materials have been used as solid-contact transducers in manufacturing of potentiometric ISEs. These materials include carbon nanotubes, graphene, graphene oxide (GO), ordered mesoporous carbon (OMC) and carbon black. They are the most researched nano-solid contacts owing to their unique characteristics including high interfacial area, fast charge transfer and excellent hydrophobicity [32].
To the best of our findings, only one cited paper-based potentiometric sensor was found to detect free BR in human serum [33]. The sensor has an error in explaining the response mechanism of the proposed sensor, lack of method validation and other important ions such as urate, creatinine and dopamine that are present in the biological fluids were not studied in selectivity study.
In this work, a cost-effective, robust and reliable sensor based on potentiometric transduction was prepared, characterized and presented for free bilirubin detection in human serum. The sensor’s design is based on the use of screen-printed carbon platform modified with ordered mesoporous carbon. The sensing material was the ion association of [Ni(bphen)3]2+[BR]2− complex in a plasticized PVC matrix. The potentiometric characteristics of the proposed sensors, such as linearity, sensitivity, selectivity and reliability, were studied. The short-term potential stability and double-layer capacitance of the sensor were characterized by chronopotentiometry and electrochemical impedance spectroscopy measurements. The sensor was successfully introduced for free bilirubin detection in human serum. Application to human serum albumin through indirect determination was also checked using the proposed sensor.
2. Materials and Methods
2.1. Chemicals and Instrumentation
Bilirubin, L-ascorbic acid, D-(+)-glucose, creatinine, uric acid and dopamine were supplied from Sigma-Aldrich (St. Louis, MO, USA) (www.sigmaaldrich.com). Tetrahydrofuran (THF), poly(vinyl) chloride (PVC), 4,7-Diphenyl-1,10-phenanthroline (bphen) (≥97% purity) and o-nitrophenyloctyl ether (o-NPOE) were purchased from Merck Inc. (Darmstadt, Germany). All the other chemicals were of analytical grade and used as received.
All solutions were prepared using Millipore water (18.2 MΩ·cm). A 50 mMphosphate buffer solution (PBS) of pH 8.5 was prepared and used as for serial dilutions and as a measurements background. Stock solution of bilirubin was prepared in 1M NaOH and then the pH of the solution is adjusted to pH 8.5. All bilirubin standard solutions were prepared in 50 mM phosphate buffer solution (PBS) of pH 8.5.
Screen-Printed Carbon Electrodes (SPCEs) modified with Ordered Mesoporous Carbon (OMC) (110 OMC) were purchased from DropSens (Metrohm, Switzerland). These SPCEs were designed for the development of (bio)sensors with an enhanced electrochemical active area and enhanced electronic transfer properties. They are based on ceramic substrate 9 L33 × W10 × H0.5 mm) with silver electric contacts. Electrochemical experiments were carried out using PXSJ-216 pH/mV meter (INESA-Scientific Instrument Co. Ltd., Shanghai, China). Metrohompotentiostat/galvanostat (Autolab-model 204, Herisau, Switzerland) were used for both chronopotentiometry and electron impedance spectroscopy (EIS) measurements. In these measurements, screen-printed carbon electrodes (SPCEs) modified with Ordered Mesoporous Carbon (OMC) as a three-electrode cell containing silver as a reference electrode and carbon as an auxiliary electrode were employed. The current applied for these measurements was ±1 nA in a solution containing 50 µM bilirubin. The spectrophotometric studies were carried out on a Shimadzu UV/VIS spectrophotometer (Shimadzu UV-1601 PC, Kyoto, Japan).
2.2. Sensors Constructions
The nickelII-bathophenanthroline/bilirubin ion-pair complex was prepared as previously described [34]. A 100-mg portion of4,7-Diphenyl-1,10-phenanthroline (bphen) was dissolved in 25-mL of ethanolic solution (70% v/v) followed by the addition of 1-mL of 0.1M nickel(II) sulfate. The solution was stirred and mixed with a 3-mL aliquot of 1.0 × 10⁻¹ M aqueous bilirubin solution (pH 8.5). A greenish precipitate of NiII-bathophenanthroline/bilirubinate was formed, filtered, and washed with de-ionized water several times. After drying, the precipitate was ground to fine powder and exposed to elemental analysis. The obtained data confirmed the formation of [Ni(bphen)3][BR] ion-pair complex. The elemental analysis obtained for the solid complex agree fairly well with the formula 1:1 of [Ni(bphen)3]2+[BR]2− (Calculated, C: 76.896%, H: 5.011%, N: 8.544%, found, C:76.834%, H: 5.004%, N:8.523%).
The ion-sensing membrane (ISM) was prepared by dissolving 65.0 mg of PVC powder, 124.0 mg of o-NPOE as a solvent mediator and 5.0 mg of [Ni(bphen)3][BR] ion-pair complex as previously described [35]. All were dissolved in 2.0 mL THF until homogenous membrane cocktail is obtained. A total of 10 µL of the previous cocktail solution was drop-casted over the ordered meso-porous carbon (OMC) layer in the orifice of the screen-printed platform and then left to dry. The prepared screen-printed electrode was conditioned before use in 10−3 M bilirubinate solution (pH 8.5) for 4 h. When not in use, the sensors were stored in de-ionized water. For various BR concentrations, the potential readings corresponding to each concentration was measured after potential stabilization ±2 mV and then plotted versus log [BR] concentration to construct the calibration graph.
2.3. Determination of Free BR in Presence of Albumin
A total of 1mL of albumin solution containing 800 μM was introduced to 9 mL of 50 mM PBS, pH 8.5 containing different BR concentrations (100, 150, 200 and 500 μM). So, these solutions are now containing 80 μM albumin as a final concentration. As reported in the literature [36], the binding of BR to albumin is assumed to be 1:1. Therefore, each solution will contain 20, 70, 120 and 370 μM as a detected free BR. The sensors were inserted in the test solution and the potential reading is then recorded. From the calibration plot, the concentration of the free BR in each solution was detected.
2.4. Determination of Human Serum Albumin (HSA)
For the quantitative determination of human serum albumin (HSA), a calibration plot for albumin was constructed. A total of 10 mL of 500 µM free BR, pH 8.5 was transferred to a 25-mL beaker and the proposed electrochemical cell was immersed in the solution. After a constant potential reading was obtained, different aliquots of albumin containing 100–400 µM were added. The potential reading after each addition is recorded and the rate curves (potential/time) were plotted. The maximum initial rate (ΔE/Δt) was plotted versus the concentration of albumin. The constructed calibration plot was used for albumin determination in unknown samples. In absence of albumin, a blank experiment was carried out under the same conditions.
For HSA assessment in real samples, blood samples were collected from healthy volunteers and then kept in the refrigerator for 8 h. Serum was extracted from the samples after centrifugation at 12,000 rpm for 20 min. A total of 400 μL serum (100 μL in each injection) was added to 9 mL phosphate buffer solution (PBS) of pH 8.5 contains 500 μM bilirubin. The potential reading after sample addition is recorded and the rate curve (potential/time) was plotted. The maximum initial rate (ΔE/Δt) was calculated and compared with the calibration plot. All subjects gave their informed consent for inclusion before they participated in the study. The study was conducted in accordance with the Declaration of Helsinki, and the protocol was approved by the National Research Centre Medical Research Ethics Committee (HU/IACUC20187).
3. Results and Discussions
3.1. Response Characteristics of BR Sensor
The ion pair complexes of BR2− were prepared after its association with the cationic complex nickel tris-bathophenanthroline [Ni(bphen)3]2+ to form a suitable sensing material used in potentiometric membrane sensors. Bilirubin (BR2−) produces a well-defined water insoluble 1:1 ion association complex upon its reaction with the divalent [Ni(bphen)3]2+ cation. This [Ni(bphen)3]2+[BR]2− complex was incorporated with a suitable o-NPOE as a solvent mediator in a PVC matrix membrane [37]. Solid-contact bilirubin sensors based on [Ni(bphen)3]2+[BR]2− ion-association and ordered mesoporous carbon (OMC) as an ion-to-electron transducer were prepared and characterized for free BR detection. A schematic representation for the response mechanism of the proposed sensors is shown in Figure 1. Over the concentration range of 1.0 × 10⁻⁷ to 1.0 × 10⁻³ M BR2−, the potential corresponding to each concentration was recorded and plotted versus the log a(BR2)−. The sensors revealed a Nernstian slope of −26.8 ± 1.1 (r2 = 0.9997) mV/decade over the linear range of 1.0 × 10⁻⁶–1 × 10⁻² M with a detection limit 8.8 × 10⁻⁷ M (0.52 µg/mL). The potential plot versus log [BR2−] was presented in Figure 2.
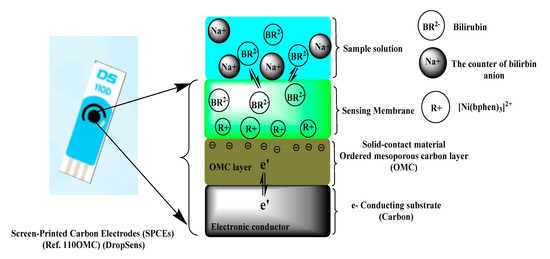
Figure 1.
Schematic representation of the response mechanism presented by the proposed bilirubin sensor (ion-to-electron transfer mechanism).
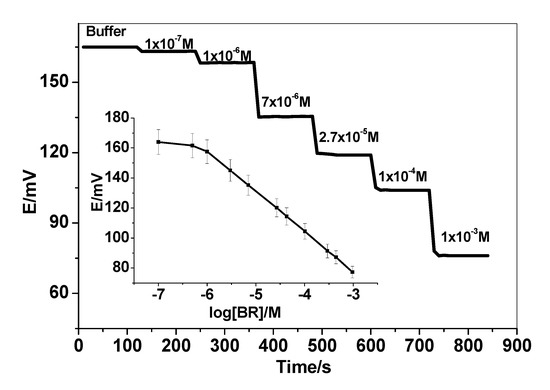
Figure 2.
Potentiometric and time response of the proposed bilirubin sensor in 50 mM phosphate buffer solution of pH 8.5.
The pH of the working solution was chosen to be 8.5, at which 99% of BR is present in its divalent ionized form (pKa1 = 4.2, pKa2 = 4.9) [38]. So, 50 mM phosphate buffer solution of pH 8.5 was used as a solution background for all subsequent measurements.
The response time of the presented sensor to attain 95% of the potential equilibrium was found to be <5 s upon a 10-fold increase in BR2− concentration. As shown in Figure 2, the presented sensor shows the fast response over a range of bilirubin concentration starting from 0.1 μM to 1.0 mM). This wide linear range is enough to cover the clinically relevant concentration range of free BR in either healthy patients or those suffering from hyper-bilirubinemia (30–500 μM) [39].
The long-term potential stability of bilirubin sensors was evaluated by continuously measuring in freshly prepared bilirubin solutions with different concentrations (10 µM and 0.1 mM) for 15 days. The sensors were stored in a dry state at room temperature. The sensitivity (in terms of slope of the calibration plot) was calculated according to three assay results every day. The variation of the slope of calibration plots is <1.3 mV/decade after the third day and in the following 12 days, showing fairly good stability.
3.2. Data Repeatability and Reproducibility
To check the repeatability and reproducibility of the presented method, the spread of results when BR samples contained10–50.0 µM was measured either within a day or between-days. These measurements were used to conform the data agreement between those obtained with the control BR samples under different conditions with different sensors assemblies and instruments at different times. The reproducibility (R) was calculated from the standard deviation data of the results (SR).
R = 2.8 × SR
The reproducibility within a day and between days was found to be 1.7 ± 0.2–1.1 ± 0.4% and 1.3 ± 0.2–1.2 ± 0.5%, respectively.
3.3. Sensors’ Selectivity
The selectivity coefficients (KpotBR,J) of bilirubin sensor were evaluated using the modified separate solutions method (MSSM) [40]. Typical potentiograms for all studied interfering ions are presented in Figure 3. For sensors based on ion exchangers, selectivity is governed by the high lipophilicity of the target ion. So, the high lipophilicity of BR permits it to be monitored by the proposed sensors with high selectivity over the other less lipophilic species present in the bold serum. The calculated selectivity coefficients of the presented sensor were shown in Table 1. The sensor revealed high selectivity over different anions, such as Cl−, HPO42−, NO3−, HCO3−, salicylate, ascorbic acid, deoxycholate, lactate, and pyruvate that are commonly present in serum. The data obtained showed good discrimination for bilirubin over these common anions. According to literature survey, only one potentiometric sensor was reported for bilirubin determination [33]. The sensor was paper-based and used the separate solution method (SSM) for estimating the selectivity values. According to this method, bias selectivity values were obtained because of the leaching of the primary ion from the membrane that influences the response to the weakly interfering ion. Bias selectivity coefficient values may be also obtained when the interfering agent is highly preferred and the sensor reveals counter ion interference. So, the modified separate solutions method (MSSM) is used to determine the un-biased selectivity coefficients values and the obtained values were compared with that reported by Bell et al. [33].
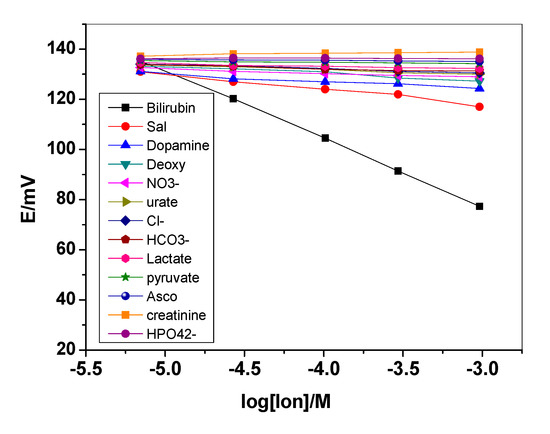
Figure 3.
Potentiometric response of the presented bilirubin electrode towards all studied interfering ions.

Table 1.
Selectivity coefficient values of the proposed screen-printed bilirubin sensor.
3.4. Chronopotentiometry and Electrochemical Impedance Spectroscopy (EIS) Measurements
Short-term potential stability for the proposed sensors can be evaluated using the method proposed by Bobacka 1999 [48]. The electrode is polarized after applying ±1 nA of direct current while the potential of the electrode is recorded in the presence of 50 µM bilirubin solution. Upon reversing the current, the bulk resistance of the sensor can be estimated from the Ohmic drop (iR). This approach has become a standard method to estimate the short-term potential stabilities of all-solid-state ion selective electrodes. The potential drift of the modified screen-printed electrode with OMC was obtained calculated from the slope (ΔE/Δt) of the curve and was found to be 0.3 mV/s. It was found that these values are much lower than those obtained from the non-modified screen-printed electrode (0.78 mV/s). The current-reversal chronopotentiogram for modified and non-modified BR sensors is shown in Figure 4. These obtained data reveal that the potential stability of the modified screen-printed BR electrodes is enhanced by inserting the OMC layer as a solid contact transducer. The low-frequency capacitance (CL) for both modified and non-modified screen-printed BR electrodes was calculated to be 52.3 ± 1.3 and 19.1 ± 0.8 μF, respectively.
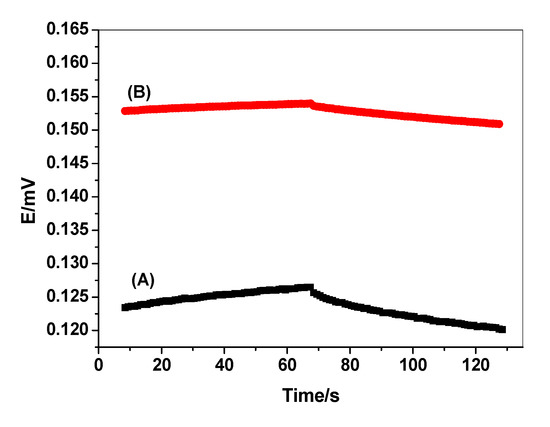
Figure 4.
Chronopotentiogram for (A) un-modified and (B) modified bilirubin sensors. Conditions: applying current= ±1 nA; 50 μM bilirubin (BR) solution.
Impedance measurements were carried out using the screen-printed carbon electrodes (SPCEs) un-modified/modified with OMC as a three-electrode cell containing silver as a reference electrode and carbon as an auxiliary electrode. The cell was immersed in 50 μM BR solution. The impedance spectra were plotted within the frequency range 100 kHz–10 mHz as a sinusoidal excitation signal. A typical impedance spectrum of the proposed sensors is shown in Figure 5. From the high-frequency semicircle, the bulk resistances (Rb) of the modified and non-modified screen-printed electrodes were found to be 0.84 ± 0.6 and 1.3 ± 0.2 MΩ, respectively. From the low frequency semicircle of the modified and non-modified screen-printed electrodes, the double-layer capacitance (CL) were found to be 51.4 ± 0.7 and 18.8 ± 0.6 µF. This confirms that the existence of the OMC layer as an ion-to-electron transducer significantly contributes to faster charge transportation between the interfaces and offers a stable potential response for the presented BR solid-contact sensor.
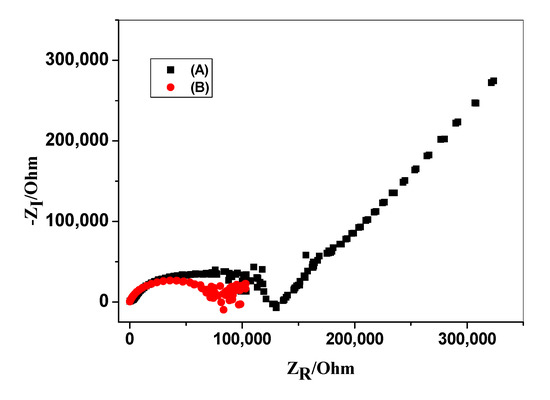
Figure 5.
Electrochemical impedance spectra of (A) un-modified and (B) modified bilirubin sensors. Conditions: frequency range 100 kHz–10 mHz; 50 μM BR solution.
3.5. Bilirubin Assessment in Serum
The applicability of the proposed sensors for the successful determination of free BR in different sample solutions was examined. The sample solutions contained different known concentrations of BR (i.e., 100, 150, 200 and 500 μM) in the presence of 80 µM of albumin as a final concentration. The levels of free BR in these samples were potentiometrically measured using the BR sensor. The data obtained were compared with those obtained by the standard spectrophotmetric kit (Bilirubin Assay Kit (Z5030053), BioChain, CA, USA) (Table 2). The standard reference method utilized the reaction of bilirubin with diazotized sulfanilic acid, in which a red-colored product was formed and the intensity of the color was measured at 510–550 nm. From t-student and F tests, the obtained results show that there are no significant differences between the results obtained by the two methods and showed the successful applicability of the presented sensor as a new analytical protocol for free BR assessment.
Table 2.
Free BR assessment in presence of albumin using the proposed bilirubin sensor.
3.6. Application to Human Serum Albumin (HSA) Determination
For further validity use of the presented sensors, they were tested in detecting human serum albumin (HSA). When diluted HSA solutions react with an excess of BR, there is a good approach to the overall reaction expressed as:
BR2− + HSA ⇆ [BR2−][HSA]
The reaction kinetics follow 2nd-order behavior. The potential E of the bilirubin sensor used for monitoring the reaction is given by:
E = E0 − 0.0591/2 log [BR]
Differentiating Equation (3) with time produces:
where k is the overall reaction rate constant. Substituting Equation (5) in Equation (4) yields:
ΔE/Δt = −0.059/2 × 1/[BR] × Δ[BR]/Δt
Δ[BR]/Δt = −k [BR][HSA]
ΔE/Δt = 0.059/2 × k [HSA]
From all of the above, the initial rate of substrate consumption measured from the initial slope of the potential–time graph (mV/s) will be linearly related to the HSA concentration. As shown in Figure 6, at 500 µM BR concentration as a background, a measurable change in the reaction rate at different HSA concentration was obtained with a better linearity of calibration plot (from 100 to 400 µM), and a fast response of the sensor was revealed for albumin detection. Herein, the experiment demonstrates the successful application of the presented sensor in the indirect assessment of albumin in addition to the free bilirubin.
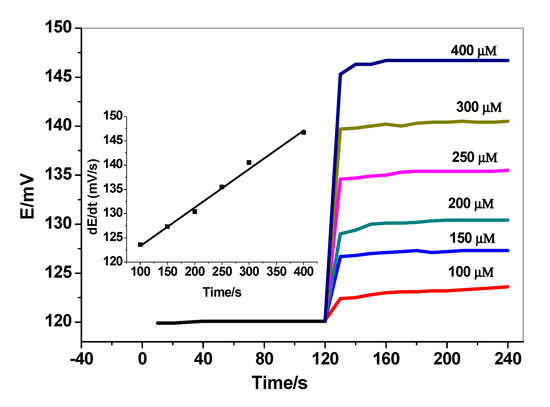
Figure 6.
Dynamic potentiometric response of bilirubin screen-printed electrodes for human serum albumin (HSA). Conditions: (500 µM bilirubin in 50 mM PBS; pH = 8.5). The inset shows the measuring calibration plot for HSA.
4. Conclusions
Novel screen-printed electrodes based on potentiometric transduction were fabricated and presented for free bilirubin detection. The sensors were modified with ordered mesoporous carbon (OMC) as an ion-to-electron transducer. The sensory material was the[Ni(bphen)3]2+[BR]2− ion-association complex, which is dispersed in a plasticized PVC membrane. The sensors revealed a Nernstian slope of −26.8 ± 1.1 (r2 = 0.9997) mV/decade over a linear range of 1.0 × 10⁻⁶–1 × 10⁻² M with a detection limit of 8.8 × 10⁻⁷ M (0.52 µg/mL) towards free bilirubin. They exhibited considerable stability and good performance characteristics in terms of durability, ease of manufacture, potential stability, selectivity and accuracy. The sensors were used for the successful determination of free bilirubin in human serum. In addition, the sensors were successfully used for the determination of human serum albumin (HAS). The kinetic assessment is based on the interaction of free bilirubin with albumin in the stoichiometric ratio (1:1).
Author Contributions
A.H.K., H.R.G. and A.E.-G.E.A. conceptualized the study, interpreted the results, carried out the experiments, and prepared the manuscript; A.H.K. and A.E.-G.E.A. cooperated in the preparation of the manuscript; M.A.A.-O. and A.A.A. performed the clinical studies. All authors have read and agreed to the published version of the manuscript.
Funding
The authors are grateful to the Deanship of Scientific Research, king Saud University for funding through Vice Deanship of Scientific Research Chairs.
Conflicts of Interest
The authors declare no conflict of interest.
References
- Tiribelli, C.; Ostrow, J.D. The molecular basis of bilirubin encephalopathy and toxicity: Report of an EASL Single Topic Conference. J. Hepatol. 2005, 43, 156–166. [Google Scholar] [CrossRef] [PubMed]
- Zunszain, P.A.; Ghuman, J.; McDonagh, A.F.; Curry, S. Crystallographic analysis of human serum albumin complexed with 4Z,15E-bilirubin-IXalpha. J. Mol. Biol. 2008, 381, 394–406. [Google Scholar] [CrossRef] [PubMed]
- Vitek, L.; Ostrow, J.D. Bilirubin chemistry and metabolism; harmful and protective aspects. Curr. Pharm. Des. 2009, 15, 2869–2883. [Google Scholar] [CrossRef] [PubMed]
- Erlinger, S.; Arias, I.M.; Dhumeaux, D. Inherited disorders of bilirubin transport and conjugation: New insights into molecular mechanisms and consequences. Gastroenterology 2014, 146, 1625–1638. [Google Scholar] [CrossRef]
- Jacobsen, J.; Wennberg, R.P. Determination of unbound bilirubin in the serum of newborns. Clin.Chem. 1974, 20, 783–789. [Google Scholar] [CrossRef]
- American Academy of Pediatrics Subcommittee on Hyperbilirubinemia. Management of hyperbilirubinemia in the new borninfant 35 or more weeks of gestation. Pediatrics 2004, 114, 297. [Google Scholar] [CrossRef]
- Balamurugan, T.; Berchmans, S. Non-enzymatic detection of bilirubin based on agraphene-polystyrene sulfonate composite. RSC Adv. 2015, 5, 50470–50477. [Google Scholar] [CrossRef]
- Ahlfors, C.E.; Wennberg, R.P.; Ostrow, J.D.; Tiribelli, C. Unbound (free) bilirubin: Improving the paradigm for evaluating neonatal jaundice. Clin. Chem. 2009, 55, 1288–1299. [Google Scholar] [CrossRef]
- Santhosh, M.; Chinnadayyala, S.R.; Kakoti, A.; Goswami, P. Selective and sensitive detection of free bilirubin in blood serum using human serum albumin stabilized gold nanoclusters as fluorometric and colorimetric probe. Biosens. Bioelectron. 2014, 59, 370–376. [Google Scholar] [CrossRef]
- Joseph, W.; Mebmet, O. A polishableamperometric biosensor for bilirubin. Electroanalysis 1990, 2, 647–650. [Google Scholar]
- Doumas, B.T.; Perry, B.; Jendrzejczak, B.; Davis, L. Measurement of Direct bilirubin by use of bilirubin oxidase. Clin. Chem. 1987, 33, 1349–1353. [Google Scholar] [CrossRef] [PubMed]
- Shoham, B.; Migron, Y.; Riklin, A.; Willner, I.; Tartakovsky, B. A bilirubin biosensor based on a multilayer network enzyme electrode. Biosens. Bioelectron. 1995, 10, 341–352. [Google Scholar] [CrossRef]
- Lu, C.; Lin, J.M.; Huie, C.W. Determination of total bilirubin in human serum by chemiluminescence from the reaction of bilirubin and peroxynitrite. Talanta 2004, 63, 333–337. [Google Scholar] [CrossRef] [PubMed]
- Ma, G.; Lin, J.; Cai, W.; Tan, B.; Xiang, X.; Zhang, Y.; Zhang, P. Simultaneous determination of bilirubin and its glucuronides in liver microsomes and recombinant UGT1A1 enzyme incubation systems by HPLC method and its application to bilirubin glucuronidation studies. J. Pharm. Biomed. Anal. 2014, 92, 149–159. [Google Scholar] [CrossRef] [PubMed]
- Yang, Z.; Yan, J.; Zhang, C. Piezoelectric detection of bilirubin based on bilirubin imprinted titaniafilm electrode. Anal. Biochem. 2012, 421, 37–42. [Google Scholar] [CrossRef]
- Nie, Z.; Fung, Y.S. Microchip capillary electrophoresis for frontal analysis of free bilirubin and study of its interaction with human serum albumin. Electrophoresis 2008, 29, 1924–1931. [Google Scholar] [CrossRef]
- Rand, R.N.; Pasqua, A.D. A new diazo method for the determination of bilirubin. Clin. Chem. 1962, 8, 570–578. [Google Scholar] [CrossRef]
- Chen, J.; Song, G.; Yu He, Y.; Yan, Q. Spectroscopic analysis of the interaction between bilirubin and bovine serum albumin. Microchim. Acta 2007, 159, 79–85. [Google Scholar] [CrossRef]
- Ho, H.T.; Ng, T.K.; Tsui, K.C.; Lo, Y.C. Evaluation of a new transcutaneous bilirubinometer in Chinese newborns. Arch. Dis. Child. Fetal Neonatal Ed. 2006, 91, F434–F438. [Google Scholar] [CrossRef]
- Tan, K.L.; Dong, F. Transcutaneous bilirubinometry during and after phototherapy. Acta Paediatr. 2003, 92, 327–331. [Google Scholar] [CrossRef]
- Kamel, A.H.; Hassan, A.M.E. Solid Contact Potentiometric Sensors Based on Host-Tailored MolecularlyImprinted Polymers for Creatine Assessment. Int. J. Electrochem. Sci. 2016, 11, 8938–8949. [Google Scholar] [CrossRef]
- El-Naby, E.H.; Kamel, A.H. Potential transducers based man-tailored biomimetic sensors for selective recognition of dextromethorphan as an antitussive drug. Mater. Sci. Eng. C 2015, 54, 217–224. [Google Scholar] [CrossRef] [PubMed]
- El-Kosasy, A.; Kamel, A.H.; Hussin, L.; Ayad, M.F.; Fares, N. Mimicking new receptors based on molecular imprinting and their application to potentiometric assessment of 2, 4-dichlorophenol as a food Taint. Food Chem. 2018, 250, 188–196. [Google Scholar] [CrossRef] [PubMed]
- Kamel, A.H.; Jiang, X.; Li, P.; Liang, R. A paper-based potentiometric sensing platform based on molecularly imprinted nanobeads for determination of bisphenol A. Anal. Meth. 2018, 10, 3890–3895. [Google Scholar] [CrossRef]
- Kamel, A.H.; Soror, T.Y.; Al-Romian, F.M. Graphite Solid-Contact Mepiquat Potentiometric Sensors Based on Molecularly Imprinted Polymers and Their Application to Flow Through Analysis. Anal. Meth. 2012, 4, 3007–3012. [Google Scholar] [CrossRef]
- Hassan, S.S.M.; Badr, I.H.A.; Kamel, A.H.; Mohamed, M.S. A Novel Poly (Vinyl Chloride) Matrix Membrane Sensor for Batch and Flow-injection Determination of Thiocyanate, Cyanide and Some Metal Ions. Anal. Sci. 2009, 25, 911–917. [Google Scholar] [CrossRef]
- Hassan, S.S.M.; Amr, A.E.; Elbehery, N.H.A.; Al-Omar, M.A.; Kamel, A.H. Non-equilibrium potential responses towards neutral orcinol using all-solid-state potentiometric sensors integrated with molecularly imprinted polymers. Polymers 2019, 11, 1232. [Google Scholar] [CrossRef]
- Kamel, A.H.; Amr, A.E.; Ashmawy, N.H.; Galal, H.R.; Al-Omar, M.A.; Sayed, A.Y.A. Solid-Contact Potentiometric Sensors Based on Stimulus-Responsive Imprinted Polymers for Reversible Detection of Neutral Dopamine. Polymers 2020, 12, 1406. [Google Scholar] [CrossRef] [PubMed]
- Zuliani, C.; Diamond, D. Opportunities and challenges of using ion-selective electrodes in environmental monitoring and wearable sensors. Electrochim. Acta 2012, 84, 29–34. [Google Scholar] [CrossRef]
- Li, Y.; Chen, Y.; Yu, H.; Tian, L.; Wang, Z. Portable and smart devices for monitoring heavy metal ions integrated with nanomaterials. TrAC Trends Anal. Chem. 2018, 98, 190–200. [Google Scholar] [CrossRef]
- Janata, J. Potentiometric microsensors. Chem. Rev. 1990, 90, 691–703. [Google Scholar] [CrossRef]
- Yan, R.; Qiu, S.; Tong, L.; Qian, Y. Review of progresses on clinical applications of ion selective electrodes for electrolytic ion tests: From conventional ISEs to graphene-based ISEs. Chem. Speciat. Bioavailab. 2016, 28, 72–77. [Google Scholar] [CrossRef]
- Bell, J.G.; Mousavi, M.P.S.; Abd El-Rahman, M.K.; Tan, E.K.W.; Homer-Vanniasinkam, S.; Whitesides, G.M. Paper-based potentiometric sensing of free bilirubin in blood serum. Biosens. Bioelectron. 2019, 126, 115–121. [Google Scholar] [CrossRef] [PubMed]
- Hassan, S.S.M.; Sayour, H.E.M.; Kamel, A.H. A simple-potentiometric method for determination of acid and alkaline phosphatase enzymes in biological fluids and dairy products using a nitrophenylphosphate plastic membrane sensor. Anal. Chim. Acta 2009, 640, 75–81. [Google Scholar] [CrossRef]
- Kamel, A.H.; Sayour, H.E.M. Flow-Through Assay of Quinine Using Solid Contact Potentiometric Sensors Based on Molecularly Imprinted Polymers. Electroanalysis 2009, 21, 2701–2708. [Google Scholar] [CrossRef]
- Jacobsen, J.; Brodersen, R. Albumin-bilirubin binding mechanism—Kinetic and spectroscopic studies of binding of bilirubin and Xanthobilirubic acid to human serum albumin. J. Biol. Chem. 1983, 258, 6319–6326. [Google Scholar]
- Guerreiro, J.R.L.; Kamel, A.H.; Sales, M.G.F. FIA potentiometric system based on periodate polymeric membrane sensors for the assessment of ascorbic acid in commercial drinks. Food Chem. 2010, 120, 934–939. [Google Scholar] [CrossRef][Green Version]
- Hahm, J.S.; Ostrow, J.D.; Mukerjee, P.; Celic, L. Ionization and self-association of unconjugated bilirubin, determined by rapid solvent partition from chloroform, with further-studies of bilirubin solubility. J. Lipid Res. 1992, 33, 1123–1137. [Google Scholar]
- Silbernagl, S.; Despopoulos, A. Color Atlas of Physiology, 6th ed.; Thieme: Stuttgart, Germany; New York, NY, USA, 2009; Volume 459, pp. 520–521. [Google Scholar]
- Bakker, E.; Pretsch, E.; Buhlmann, P. Selectivity of Potentiometric Ion Sensors. Anal. Chem. 2000, 72, 1127–1133. [Google Scholar] [CrossRef]
- Lopez, J.; Burtis, C.A.; Ashwood, E.R.; Bruns, D.E. Tietz textbook of clinical chemistry and molecular diagnosis (5th edition). Indian J. Clin. Biochem. 2013, 28, 104–105. [Google Scholar] [CrossRef]
- Levine, M.; Rumsey, S.C.; Daruwala, R.; Park, J.B.; Wang, Y.H. Criteria and recommendations for vitamin C intake. JAMA J. Am. Med. Assoc. 1999, 281, 1415–1423. [Google Scholar] [CrossRef] [PubMed]
- Krishnamurthy, K.; Wang, G.H.; Rokhfeld, D.; Bieberich, E. Deoxycholate promotes survival of breast cancer cells by reducing the level of pro-apoptotic ceramide. Breast Cancer Res. 2008, 10, 1–16. [Google Scholar] [CrossRef] [PubMed]
- Nakamura, H.; Murakami, Y.; Yokoyama, K.; Tamiya, E.; Karube, I. A compactly integrated flow cell with a chemiluminescent FIA system for determining lactate concentration in serum. Anal. Chem. 2001, 73, 373–378. [Google Scholar] [CrossRef] [PubMed]
- Mascini, M.; Mazzei, F. Amperometric sensor for pyruvate with immobilized pyruvate oxidase. Anal. Chim. Acta 1987, 192, 9–16. [Google Scholar] [CrossRef]
- Hassan, S.M.M.; Elnemma, E.M.; Ayman, H.K.; Mohamed, A.H.K. Novel Biomedical Sensors for Flow Injection Potentiometric Determination of Creatinine in Human Serum. Electroanalysis 2005, 17, 2246–2253. [Google Scholar] [CrossRef]
- Zhao, J.; Huang, Y. Salivary uric acid as a noninvasive biomarker for monitoring the efficacy of urate-lowering therapy in a patient with chronic gouty arthropathy. Clin. Chim. Acta 2015, 450, 115–120. [Google Scholar] [CrossRef]
- Bobacka, J. Potential stability of all-solid-state ion-selective electrodes using conducting polymers as ionto-electron transducers. Anal. Chem. 1999, 71, 4932–4937. [Google Scholar] [CrossRef]
© 2020 by the authors. Licensee MDPI, Basel, Switzerland. This article is an open access article distributed under the terms and conditions of the Creative Commons Attribution (CC BY) license (http://creativecommons.org/licenses/by/4.0/).