Abstract
In this study, Volvariella volvacea (VV) mushroom was utilized as a green carbon precursor to synthesize carbon dots (CDs) and applied as a fluorescent (FL) sensor to detect Fe3+ and Pb2+ ions. The VV-CDs showed a high photostability and FL properties with a quantum yield of about 11.5%. The VV-CDs exhibited an excitation-dependent emission manner, with an optimum emission wavelength at 440 nm excited at 360 nm. The VV-CDs were evaluated and shown to be facile and effective FL sensors for detecting Pb2+ and Fe3+ ions based on the FL quenching efficiency, demonstrating the special complex chelate between the metal ions and effective surface functional groups of VV-CDs. VV-CDs displayed high responses to Fe3+ and Pb2+ ions, with the linear relationship of 1-100 μM and limits of detection (LODs) of 12 and 16 nM for Pb2+ and Fe3+ ions, respectively. Furthermore, the FL sensor was validated with real water samples, showing very good spike recoveries.
1. Introduction
The pollution caused by heavy metals has become a critical threat to human health and the environment. This problem has led to the need to efficiently monitor the level of heavy metal ions in the environment [1]. Among them, iron (Fe3+) and lead (Pb2+) ions are both famous toxic and harmful heavy metal ions. Fe3+ is frequently used in agricultural and industrial processes and plays a significant role in many pathological and physiological processes, including oxygen transport, metabolism, and enzyme catalysis [2]. Meanwhile, Pb2+ has been found to be easily accumulated in human cardiovascular and nervous systems after being exposed to contaminated water and air sources because of its non-biodegradability [3]. Both metal ions can lead to severe diseases, including hemochromatosis, arthritis, anemia, diabetes, cancer, heart failure, hepatitis, mental retardation, brain damage, developmental disorders, neurological disorders, and cardiovascular disorders [4,5,6,7,8]. Therefore, it is necessary to promote fast and sensitive methods to detect these metal ions at trace levels.
Lately, carbon dots (CDs), as recent members of fluorescent (FL) nanoparticles, have drawn tremendous interest because of their potential applications, especially in bioimaging and sensing [9]. CDs are generally spherical with an average size below 10 nm and exhibit stable and strong FL properties. CDs have fascinating properties, such as a low toxicity, high water solubility, good biocompatibility, good photostability, great electrical conductivity, superior optical properties, and simple functionalization or modification [10], which mean that they can be efficiently used for practical applications. Generally, CDs can be produced by simple and facile synthetic methods with eco-friendly and easily available raw materials. However, some CDs have been used to detect several metal ions with their weakness, including complex synthetic and application procedures. Therefore, it is still necessary to develop simple synthetic and application procedures for CDs in order to detect heavy metal ions.
CDs have been prepared by using various methods, such as laser ablation, Arc-discharge, chemical oxidation, electrochemical oxidation, microwave synthesis, ultrasonic synthesis, hydrothermal treatment, thermal decomposition, plasma treatment, and templated routes [11]. Currently, the hydrothermal treatment method is one of the most popular methods for preparing CDs owing to its advantages of being simple, low-cost, and convenient to operate. Several natural products have been reported to be natural carbon precursors for CDs, including corn flour [12], mint leaf [13], groundnut [14], sweet potato [15], and star fruit [16]. Additionally, several CDs have been effectively prepared by utilizing natural products. This strategy avoids the consumption of extensive amounts of expensive and toxic chemicals with complicated post-treatment processes.
In this study, Volvariella volvacea (VV) mushroom was utilized as a new carbon precursor to synthesize CDs through a facile hydrothermal treatment method. VV mushroom, well-known as straw mushroom, is cultivated in many countries and can be easily found in many markets with a cheap price. VV mushroom can be used as a carbon precursor because it contains amino acids, proteins, fibers, fats, and carbohydrates [17], which provide abundant sources of carbon, hydrogen, oxygen, and nitrogen, resulting in the formation of various surface functional groups on CDs via hydrothermal treatment. Several CDs with surface functional groups, such as –OH and –COOH groups, might interact with Fe3+ and Pb2+ ions. The CDs derived from cranberry beans [18], Boswellia ovalifoliolata bark [19], and phenylalanine and citric acid [20] were used to detect Fe3+ ions, while several other CDs derived from lysine and glutathione [21], bovine serum albumin [22], and glutathione [23] were used to detect Pb2+ ions. However, the detection limits of Fe3+ and Pb2+ ions using the above-mentioned CDs were higher than those of the VV-CDs. The VV-CDs showed the highest selectivity for both Fe3+ and Pb2+ ions. More significantly, the VV-CDs exhibited a higher FL quantum yield than that of several CDs derived from natural products, as shown in Table S1. This is the first report on the synthesis and application of CDs derived from VV mushroom for detecting Fe3+ and Pb2+ ions. The FL sensor of VV-CDs provides a new alternative approach for detecting these metal ions. Furthermore, the VV-CDs were also applied in real water samples, which showed a very good result of spiked recoveries.
2. Experimental
2.1. Materials and Chemicals
VV mushroom was bought from a grocery store near our campus. FeCl3 and PbCl2 were purchased from Sigma Aldrich and Shimakyu’s Pure Chemicals, respectively. NaOH, SnCl2∙2H2O, NiCl2∙6H2O, CuCl2∙2H2O, ZnCl2, NaCl, KCl, and CaCl2∙2H2O were obtained from Showa Chemical Co. Ltd., Tokyo, Japan. Quinine sulfate dihydrate, CdCl2∙xH2O, FeCl2∙4H2O, HgCl2, and CoCl2∙6H2O were obtained from Alfa Aesar. Threonine (Thr), valine (Val), tyrosine (Tyr), serine (Ser), proline (Pro), lysine (Lys), leucine (Leu), isoleucine (Ile), glutamine (Gln), cysteine (Cys), asparagine (Asn), arginine (Arg), and alanine (Ala) were also obtained from Alfa Aesar. HCl and H2SO4 were purchased from Fisher Scientific and Honeywell Research Chemicals, respectively. Ultrapure water used for all experiments was obtained from the Simplicity® Millipore water purification system.
2.2. Synthesis of VV-CDs
The VV-CDs were produced by a hydrothermal treatment method based on our previous report [24]. The mushroom was dried overnight at 90 °C and crushed into powder. A total of 1.0 g of VV mushroom powder was poured into 15 mL ultrapure water inside a 50 mL hydrothermal autoclave vessel with a Teflon chamber. Then, the Teflon-lined stainless steel autoclave was placed into an oven at 200 °C for 25 h at a constant pressure of 3 MPa. Subsequently, the autoclave was taken out of the oven after heating and placed in a safe place at ambient temperature for several hours. The obtained brown solution was filtered by Advantec Grade No. 1 Filter Paper (retention > 10 µm), followed by centrifugation (9000 rpm, 30 min), to remove large particles. The supernatant was taken out and further filtered by a 0.22 µm syringe filter membrane, followed by a dialysis process for the final solution of VV-CDs. The VV-CDs were stored at 4 °C in a dark bottle for experiments.
2.3. Characterization of VV-CDs
The surface character of VV-CDs was examined by utilizing the Hitachi HT-7700 Transmission Electron Microscope (TEM). The surface functional groups of VV-CDs were confirmed by using the ALPHA FTIR Spectrometer from Bruker. The Raman spectrum of VV-CDs was recorded by using Raman Spectroscopy (Micro Raman Identify Spectrometer, ProTrusTech Co. Ltd., Tainan, Taiwan. The zeta potential value of VV-CDs was assessed by a Zeta-potential & Particle size Analyzer (ELSZ-2000, Otsuka Electronics Co., Ltd., Hirakata, Japan). The FL characteristics and sensing applications were carried out on a UV-light at 365 nm (UVP UVGL-25, Analytik Jena US, Upland, CA, USA) and an Agilent Cary Eclipse Fluorescence Spectrophotometer. The UV-Vis absorption spectra were measured by a Spectra Academy UV-Visible Spectrometer SV-2100 and Agilent 8453 UV-Vis Spectrometer. The hydrothermal heating was performed in a channel precision oven.
2.4. FL Measurements of Fe3+ and Pb2+ Ions
To perform the FL sensing of Fe3+ and Pb2+ ions, an appropriate amount of Fe3+ and Pb2+ ions with a final concentration of 1–1000 µM (200 µL) was mixed with VV-CDs solution (15-fold of the dilution factor, 800 µL). The mixtures were stirred for 1 min and kept at ambient temperature for 2 min. The FL spectra were recorded at 360 nm excitation. For a selectivity study, several other metal ions, including K+, Cd2+, Na+, Zn2+, Sn2+, Ca2+, Co2+, Ni2+, Hg2+, Cu2+, and Fe2+ at the concentration of 1000 µM, were mixed individually with VV-CDs solution in a similar way for the sensing of Fe3+ and Pb2+ ions. Moreover, various amino acids, such as Arg, Ala, Asn, Gln, Cys, Ile, Lys, Leu, Pro, Ser, Tyr, Thr, and Val (1000 µM), were also checked for their effects on the FL spectra of VV-CDs. These mixtures were allowed to stand for 2 min after stirring for 1 min and the FL emission intensities were recorded.
2.5. Analysis of Real Water Samples
Three water samples (tap water, drinking water, and groundwater) were utilized in this study. The tap water, drinking water, and groundwater samples were obtained from the department lobby, our lab, and our campus, respectively. All real water samples were used without any pre-treatment or purification. The aliquots of spiked solutions (Fe3+ and Pb2+) were diluted in 800 µL real water samples to obtain a 1000 µL final volume with concentrations of 5, 10, and 20 µM. Then, 200 µL of spiked solutions was mixed with 800 µL VV-CDs (15-fold of the dilution factor), and their FL spectra were recorded.
3. Results and Discussion
3.1. Optimum Conditions for FL Properties of VV-CDs
The VV-CDs were easily produced by a hydrothermal treatment to detect Fe3+ and Pb2+ ions via the FL quenching efficiency, as displayed in Figure 1. In this method, the biomolecules contained in natural carbon precursors transform into CD particles that may proceed with the step of dehydration, polymerization, and carbonization [25]. The FL characteristics of VV-CDs were completely influenced by the preparation conditions including the hydrothermal temperature and reaction time duration. The quality of VV-CDs was explored by observing their FL emission spectra as the parameter. The VV-CDs exhibited the highest FL emission intensity with the enhancement in the synthetic temperature and reaction time duration (Figure S1). The highest FL emission intensity was achieved at a 200 °C temperature and 25 h reaction time with 1.0 g VV mushroom powder. The enhancement of the hydrothermal temperature and reaction time duration generated more carbon nuclei and led to the optimal FL properties. A short reaction time duration and low temperature may lead to a slow reaction and insufficient process of carbonization, resulting in low FL characteristics [26]. After the preparation of VV-CDs with the optimal synthetic conditions, the solution became brown, indicating the formation of VV-CDs. The VV-CDs solution was observed to have a light-brown transparent color irradiated under daylight. Meanwhile, the VV-CDs solution emitted a bright-blue color irradiated with UV-light of 365 nm like the emission color of most plant part-derived CDs [27]. Therefore, with great FL characteristics, the VV-CDs were utilized to detect Fe3+ and Pb2+ ions in this study.
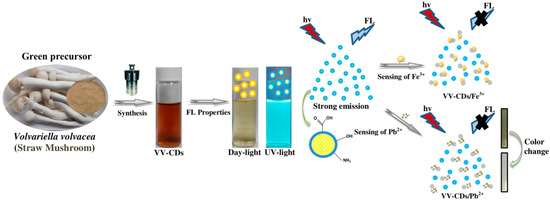
Figure 1.
The schematic synthetic procedure, fluorescent (FL) properties, and application of Volvariella volvacea (VV)-carbon dots (CDs) for Fe2+ and Pb2+ ions.
3.2. Characterization of VV-CDs
The TEM image of VV-CDs was taken to represent their structural shape and size. The TEM image showed that VV-CDs marked by white circles display mono-disperse particles over all parts of spherical-like shapes, which separate without obvious aggregation (Figure 2a). The small size of VV-CDs was distributed from 3 to 8 nm, as depicted in the histogram (Figure 2b). The average size of VV-CDs was estimated to be 5.8 nm. In addition, the functional groups on the surface of VV-CDs were confirmed by FTIR spectroscopy. As shown in Figure 2c, a broad absorption band was observed between 3351 and 3095 cm−1, indicating O-H and N-H bonds with stretching vibrations [28]. This band represents the availability of -OH and -NH2 groups on the VV-CDs’ surface. The peak observed at 2951 cm−1 was correlated with the symmetric stretching of -CH2 [29]. Furthermore, the VV-CDs showed peaks at 1665 and 1585 cm−1, which were associated with C=O stretching and C=C stretching/-COO− asymmetric stretching modes, respectively. The peaks viewed at 1410 and 1073 cm−1 were correlated with -COOH/C-N and C-O bonds, respectively [30,31,32,33,34]. Moreover, the C-N bonds were found at the peak of 1300 cm−1. Other peaks were viewed at 526, 656, 871, and 938 cm−1 and correlated with the C-H, O-H, N-H, and C-O bonds, respectively. All peaks showed that VV-CDs have substantial surface functional groups. A plentiful quantity of -OH and -COOH functional groups on the VV-CDs may support the good water solubility of VV-CDs.
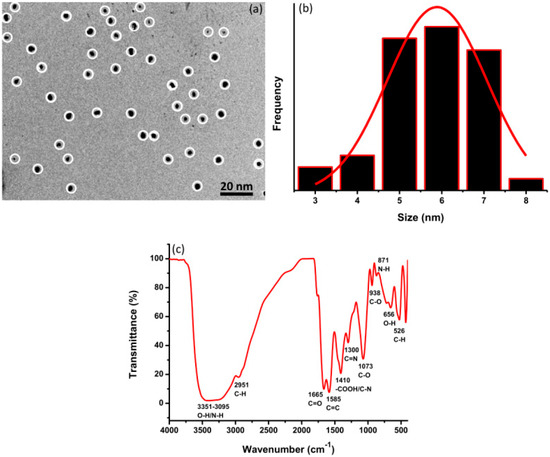
Figure 2.
(a) Transmission Electron Microscope (TEM) image, (b) size distribution, and (c) FTIR spectrum of VV-CDs.
Raman spectroscopy was used to reveal two different peaks of VV-CDs correlated with a disordered D-band and crystalline G-band centered at 1340 and 1563 cm−1, respectively (Figure 3a). The D-band is assigned to the sp3-hybridized carbon atom vibrations with dangling bonds, reflecting the graphitic sheet defects [35]. The G-band corresponds to the E2g mode of graphite, correlated with the in-plane sp2-hybridized carbon atom vibrations in the graphitic sheet. The intensity ratio (ID/IG) of the D-band to G-band was measured and shown to be 0.83, indicating that VV-CDs have a graphitic structure with enough structural defects [36]. The surface defects were particularly induced by surface oxidation or nitrogen doping. In addition, the value of the zeta potential of the VV-CDs solution was measured to determine their surface electrical charge and solution stability. The value of the zeta potential of VV-CDs is depicted in Figure 3b. This zeta potential value was recorded to be −16.92 mV, denoting the existence of negatively charged functional groups, such as -OH and -COOH groups, on the surface of VV-CDs. The negative electrical charge value of VV-CDs demonstrates the good colloidal stability of VV-CDs.
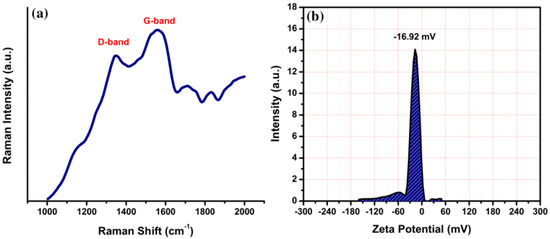
Figure 3.
(a) Raman spectrum and (b) zeta potential value of VV-CDs.
3.3. Optical Properties of VV-CDs
The FL and UV-Vis spectra of VV-CDs were measured to characterize the optical properties. The FL spectra of VV-CDs at different excitation wavelengths are shown in Figure 4a. The FL spectra showed the typical excitation-dependent emission wavelength property of VV-CDs. The FL emission peaks were evidently red-shifted when changing the excitation wavelength from 300 to 440 nm with a 20 nm increment. The FL intensity slowly enhanced when increasing the wavelength from 300 to 360 nm. Then, the FL emission intensity decreased gradually when changing the excitation wavelength from 360 to 440 nm. These results reveal that the FL emission spectra were changed by changing the excitation wavelength. Figure 4b shows the normalized FL spectra of VV-CDs, which clearly represent the red-shift characteristics of FL peaks with different excitation wavelengths. A strong emission peak was observed at 440 nm (red line) with the excitation wavelength of 360 nm (black line), as shown in Figure 4c. The FL emission intensity depends on the surface characteristics and many particles of VV-CDs excited at 360 nm. Moreover, the UV-Vis spectrum disclosed broad absorbance from 200 to 600 nm (Figure 4d). The absorption peak at around 260 to 280 nm is the result of the π-π* energy transition of conjugated C=C bonds, while the shoulder peak from 300 to 380 nm is the result of the n-π* energy transition of C=O bonds [37]. These findings confirm that VV-CDs have good optical properties based on FL and UV-Vis characteristics.
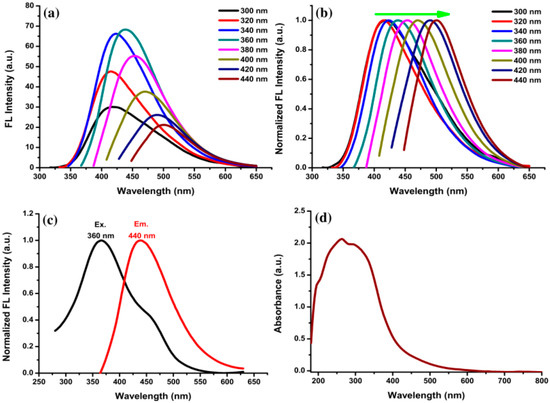
Figure 4.
(a) FL spectra of VV-CDs solution with excitation wavelengths ranging from 300 to 440 nm; (b) normalized spectra of VV-CDs solution with different excitation wavelengths from 300 to 440 nm; (c) optimal excitation and emission spectra at 360 and 440 nm, respectively; and (d) UV-Vis spectrum of VV-CDs. The VV-CDs solution was diluted by 15-fold of the dilution factor.
The FL quantum yield (QY) of VV-CDs was estimated according to a previous literature procedure [18]. To measure the QY of VV-CDs, the FL emission intensity and absorbance were monitored at a 360 nm excitation wavelength with an absorbance below 0.1. The quinine sulfate solution in 0.1 M H2SO4 (QY = 54%) was used as a reference. The QY was calculated to be about 11.5%, which is notably higher than for some other CDs. A comparison of the excitation wavelength (λex), emission wavelength (λem), and QY of CDs prepared from various natural carbon precursors is presented in Table S1.
3.4. FL Stability of VV-CDs
The stability of VV-CDs solution in terms of the FL properties under several conditions was desired due to the factual environmental conditions that can disturb the applicability of VV-CDs. The thermal stability of VV-CDs was examined by temperature-based heating at 20, 30, 40, 50, 60, 70, 90, and 100 °C. Figure S2a shows that there was insignificant quenching in the FL intensity, even at 100 °C. The temperature could not constantly break down the structure of VV-CDs and the oxygen- or nitrogen-containing groups could prevent the aggregation of particles at a high temperature, maintaining the stability of VV-CDs [38]. In addition, the influence of the ionic strength on the FL properties was evaluated by mixing NaCl solution with concentrations of 0, 100, 200, 300, 400, 500, and 1000 mM in the VV-CDs solution to confirm their stability. The FL intensity was slightly quenched with a small effect after adding NaCl solution at a high concentration (1000 mM) (Figure S2b). This phenomenon indicates that the VV-CDs remained stable at a high ionic concentration, and the electrostatic interaction did very little in terms of perturbing the FL characteristics. The VV-CDs solution stability at a high ionic concentration can be explained by the ionization absence of VV-CDs’ surface functional groups [39].
Furthermore, the FL properties of VV-CDs were monitored after being continuously irradiated for 0, 5, 10, 15, 20, 30, 40, 50, and 60 min with UV-light. The FL emission intensity of VV-CDs was diminished by up to 18% after being irradiated with UV-light for 60 min (Figure S2c). Therefore, it is better to store the VV-CDs solution in dark bottles instead of under UV-light illumination to maintain its FL nature. In addition, the long-term storage stability of VV-CDs was also evaluated by keeping the VV-CDs solution for 1, 10, 20, and 30 days. The alteration in the FL intensity could be neglected, even after 30 days of storage in the freezer (Figure S2d). All of the findings showed that, overall, the VV-CDs are stable, suggesting that VV-CDs have good characteristics for FL sensing applications.
3.5. pH Effect on the FL of VV-CDs
The FL intensity of VV-CDs was recorded under pH values of 2–12 to evaluate their effects on the FL characteristics of VV-CDs. The FL intensity of VV-CDs increased by tuning the pH value from 2 to 5 (Figure S3a). Then, once the pH value was changed from 5 to 12, the FL emission intensity gradually decreased (Figure S3b). The optimum FL emission intensity was monitored at pH values from 3 to 6, with an almost unchanged intensity, as shown in Figure S3c. The change of FL intensity may be correlated with the protonation/deprotonation entangled with diverse surface functional groups on the VV-CDs, such as -OH, -COOH, C=O, -C-O, -C-H, and -NH2 groups [40]. VV-CDs establish series of energy levels in their surface states, resulting in emissive trap formation [41].
3.6. The Selectivity of VV-CDs towards Metal Ions
A high selectivity of VV-CDs as FL sensors towards specific metal ions is an important parameter. In this study, the effects of several metal ions (K+, Cd2+, Na+, Zn2+, Sn2+, Ca2+, Co2+, Ni2+, Hg2+, Cu2+, Fe2+, Fe3+, and Pb2+ ions at 1000 µM) on the FL characteristics of VV-CDs were evaluated. The results proved that only Fe3+ and Pb2+ ions could significantly quench the FL intensity of VV-CDs (Figure 5a,b). The FL quenching effect of other metal ions was weak or even insignificant. These results demonstrate that the FL intensity of VV-CDs had responses to Fe3+ and Pb2+ ions due to the fact that these two metal ions have a stronger binding affinity to VV-CDs than other metal ions [42]. The binding affinity order of metal ions to VV-CDs is illustrated in Figure S4. Furthermore, the effects of various amino acids, such as Arg, Ala, Asn, Gln, Cys, Ile, Lys, Leu, Pro, Ser, Tyr, Thr, and Val (1000 µM), on the FL emission intensity of VV-CDs were also investigated. As shown in Figure 5c,d, the amino acids hardly reduced the FL emission intensity of VV-CDs. These findings confirm that this FL sensor has great selectivity towards Fe3+ and Pb2+ ions. In addition, the influence of the simultaneous detection of coexisting ions (both Fe3+ and Pb2+ at 500 µM) was recorded (Figure S5). The results clearly demonstrated that the simultaneous detection of Fe3+ and Pb2+ ions could disturb the FL intensity of VV-CDs with a higher quenching portion than that of the FL intensity after adding only Fe3+ or Pb2+ ions at the same concentration.
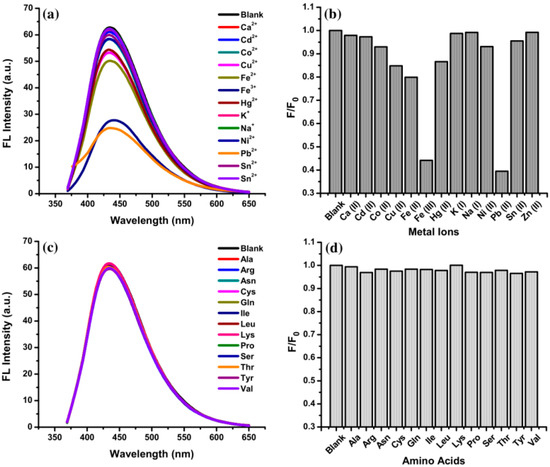
Figure 5.
The FL quenching efficiency of VV-CDs solution after adding (a,b) various metal ions and (c,d) amino acids at a concentration of 1000 µM excited at 360 nm.
Furthermore, VV-CDs serve as superior sensors for the detection of Pb2+ ions. It was quite interesting to see that the color of VV-CDs solution under daylight changed from a clear brown color to cloudy white color in the presence of Pb2+ ions (1000 µM), which could be seen by the naked eye in the cuvette container (Figure 6). This color change was due to the aggregation of VV-CDs induced by the addition of Pb2+ ions [37]. The color change of VV-CDs perturbed the FL emission behavior, inducing quenching of the FL intensity.
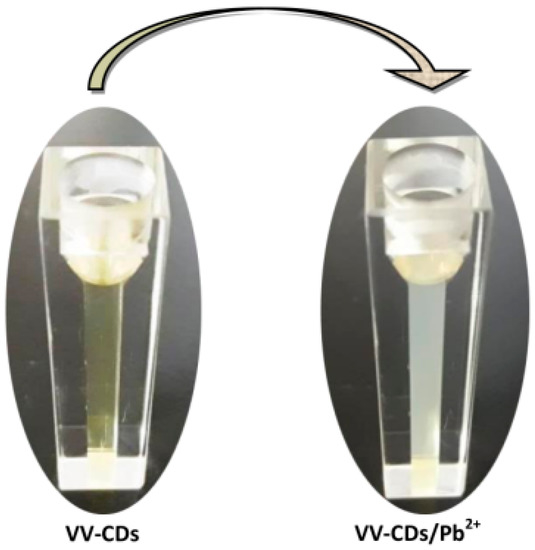
Figure 6.
VV-CDs solution without and with the addition of 1000 µM Pb2+ ions.
3.7. The Sensitivity of VV-CDs towards Fe3+ and Pb2+ Ions
The detection of Fe3+ and Pb2+ ions is important owing to their high toxicity to living things. In this study, the VV-CDs were utilized as an FL sensor to detect Fe3+ and Pb2+ ions. The FL intensities of VV-CDs after adding Fe3+ and Pb2+ ions at the concentration of 1–1000 µM were recorded as depicted in Figure 7a,b. It can be seen that the incubation time of 2 min was sufficient for the interaction of Fe3+ and Pb2+ ions with VV-CDs (Figure S6). The FL emission intensity at 440 nm nearly remained unchanged, even after incubating the sample for 20 min. The quenching efficiencies of VV-CDs induced with Fe3+ and Pb2+ ions were plotted by fitting the concentration of these metal ions with the FL quenching efficiency, F/F0, where F is the FL emission intensity with the existence of metal ions and F0 is the FL intensity of VV-CDs without the addition of metal ions at 440 nm (Figure S7). Then, Fe3+ ion detection with concentrations from 1 to 100 µM had a limit of detection (LOD) of 16 nM (S/N = 3, R2 = 0.99933; Figure 7c). Meanwhile, the LOD of Pb2+ ions was 12 nM, with a good relationship ranging from 1 to 100 µM (S/N = 3, R2 = 0.99853; Figure 7d). As listed in Table S2, these results were compared with those of several reported CDs. The LODs of Fe3+ and Pb2+ ions in this study are evidently comparable to those in previous reports with low LODs. Therefore, this FL sensor is able to detect Fe3+ and Pb2+ ions with a high sensitivity.
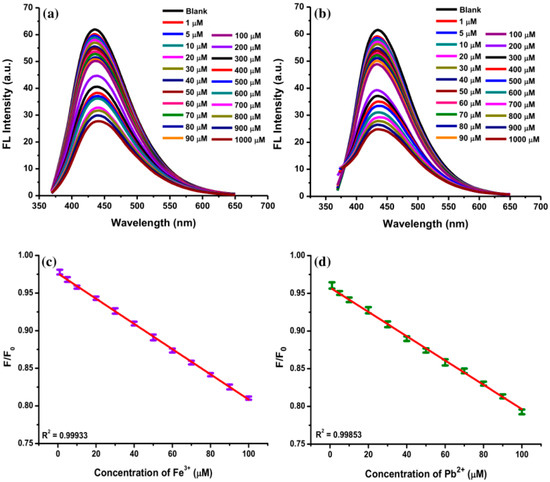
Figure 7.
The FL emission spectra of VV-CDs excited at 360 nm at various concentrations (1 to 1000 µM) of (a) Fe3+ ions and (b) Pb2+ ions. The linear correlation of F/F0 values versus the concentration (1–100 µM) of (c) Fe3+ ions and (d) Pb2+ ions.
3.8. FL Quenching Mechanisms
In this study, the FL spectra of VV-CDs were observed to display a significant shift in their emission peak at 440 nm after adding Fe3+ and Pb2+ ions. This phenomenon indicates that the most probable mechanism is related to electron transfer [22]. When Fe3+ and Pb2+ ions were added to the VV-CDs solution, their FL emission intensities were quenched, as shown in Figure 8a. The strong coordination ability between the Fe3+ and Pb2+ ions and the effective surface functional groups of VV-CDs, such as –COOH and –OH groups, can form a complex chelate compared to other metal ions. This chelating can simplify the non-radiative recombination of excitons via an effectual process of electron transfer, causing a valuable quenching of the FL emission intensity of VV-CDs [43]. Owing to this complex formation, the electrons of VV-CDs from the excited state were moved to the half-filled 3D orbital of Fe3+ ions [44]. The Pb2+ ions can quench the FL intensity of VV-CDs through facilitating the recombinant of excited electrons in the conduction band to the valence band hole [22]. This effect will encourage the attraction of electrons towards the nucleus of the element. Once this happens close to the effective surface of VV-CDs, the FL character will be disturbed and will cause a lower FL intensity of VV-CDs [22]. Furthermore, the metal ions interacting with -COOH and -OH groups of VV-CDs to bridge neighboring CDs induced aggregation of the solution [45]. The interaction disrupted the FL stability of surface functional groups. The VV-CDs were slightly agglomerated after interacting with Fe3+ and Pb2+ ions, which was observed at the bottom of the tubes (inset of Figure 8a). This occurrence was due to the high-affinity interaction between these metal ions and effective surface functional groups of VV-CDs [29].
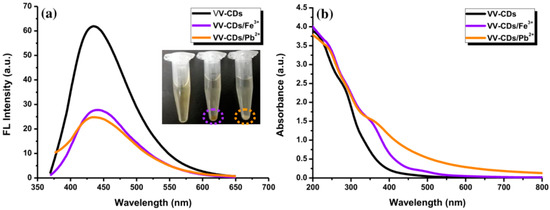
Figure 8.
(a) The FL emission excited at 360 nm and (b) UV-Vis spectra of VV-CDs (black line), VV-CDs/Fe3+ (purple line), and VV-CDs/Pb2+ (orange line).
Probable ground state complex formation can be explored via the absorbance spectra of VV-CDs/metal ion complexes. The absorption peak intensity of VV-CDs was evidently enhanced at 360 nm with the addition of Fe3+ and Pb2+ ions, indicating that there were interactions between them (Figure 8b). This enhancement may have occurred owing to the complex formation between these metal ions and VV-CDs [46]. These findings differed from the absorbance peaks of VV-CDs after adding other metal ions, except Fe2+ ions, which induced a slight but insignificant enhancement of the absorbance peak of VV-CDs (Figure S8). This result is in line with the FL quenching results, where Fe2+ ions were the third quencher for VV-CDs’ FL intensity besides Fe3+ and Pb2+ ions (Figure 5b). Based on these results, it can be deduced that the coordination between Fe3+ or Pb2+ ions and surface functional groups of VV-CDs can form stable complexes, leading to the non-radiative electron transfer of the excited electrons of VV-CDs to Fe3+ and Pb2+ ions.
Furthermore, the photoluminescence excitation (PLE) features of the VV-CDs/Pb2+ and VV-CDs/Fe3+ complexes were measured to specify the electron transfer mechanism between VV-CDs and metal ions. For the PLE of VV-CDs, there are three appreciable characteristic excitation peaks located at 235, 360, and 635 nm. Figure S9 shows that the PLE peak at 235 nm was decreased after adding Fe3+ ions. This peak disappeared after adding Pb2+ ions. The peak of VV-CDs at 360 nm shifted to 380 nm after adding Pb2+ and Fe3+ ions. This peak from the VV-CDs/Pb2+ system is lower than that from the VV-CDs/Fe3+ system. Conversely, the peak at 635 nm increased after adding the metal ions. The intensity was higher for Pb2+ than Fe3+ at this wavelength, showing an attractive change in the excitation band’s shape. The PLE spectra showed bands with a shifting peak at 360 nm and increasing intensity at 635 nm, attributed to the absorption transition of Pb2+ and Fe3+ ions from the ground state to the excited state.
To further observe the interaction between VV-CDs and Pb2+/Fe3+ ions, the infrared spectra of VV-CDs/Pb2+ and VV-CDs/Fe3+ were measured. Figure 9a depicts the FTIR spectra of VV-CDs, VV-CDs/Pb2+, and the subtraction result, while Figure 9b shows the FTIR spectra of VV-CDs, VV-CDs/Fe3+, and the subtraction result, respectively. As shown in Figure 9, the FTIR spectral characteristics of VV-CDs were changed with the addition of Pb2+ and Fe3+ ions. The interaction of Pb2+ ions with -COOH groups mainly caused the disappearance of the absorption band located at 1585 cm−1, which can be assigned as -COO- asymmetric stretching and/or C=C stretching vibrations. Meanwhile, the subtraction results showed that two absorption bands located at 1728 and 1645 cm−1 were observed, which implied the formation of a VV-CDs/Pb2+ complex, resulting in band shifts of the -COO-. Other than the region at around 1600 cm−1, the disappearance of the peak located at 1300 cm−1 (C=N) and a shift of the peak from 1080 and 1050 cm−1 (C-O) to 1037 and 990 cm−1 where the molar absorptivities of the absorption bands at around 1050 cm−1 increased after adding Pb2+, were also observed. It is noted that the molar absorptivities of the absorption bands at around 570 cm−1 to 540 cm−1, which can be assigned as the bending modes of the carboxylic ions, were also increased. Additionally, the interaction of Pb2+ ions with -OH groups reduced the peak at 871 cm−1 (N-H) and 656 cm−1 (O-H). Similarly, the interaction of Fe3+ ions with functional groups on the surfaces of VV-CDs also perturbed several bonds. For example, the absorption band at 1580 cm−1 shifted to 1650 and 1730 cm−1. Peak shifting from 1080 and 1050 cm−1 to 1037 and 990 cm−1 with increasing molar absorptivities was also observed. The disappearance of the band at 1300 cm−1 and the increment of the molar absorptivities of the absorption bands at around 570 to 540 cm−1 were also observed in the VV-CDs/Pb2+ system. Interestingly, the peak at 1415 cm−1, which can be assigned as the symmetric stretching of -COO-, increased significantly, which was only observed in the VV-CDs/Fe3+ system. The FTIR spectroscopic results confirmed the interaction of Pb2+ and Fe3+ ions with –COOH and -OH groups of VV-CDs to form VV-CDs/Pb2+ and VV-CDs/Fe3+ complexes, which is consistent with the results of FL results.
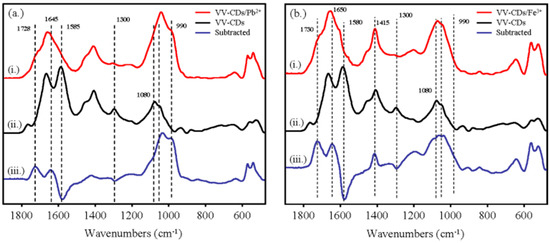
Figure 9.
FTIR absorption spectra of VV-CDs and after interacting with (a) Pb2+ ions and (b) Fe3+ ions.
3.9. Analysis of Real Water Samples
The developed FL sensor exhibited a good selectivity and sensitivity for Fe3+ and Pb2+ ions. The tap water, drinking water, and groundwater samples were used without any purification or filtration to evaluate the feasibility and applicability of the sensor in real water samples. The blank and spiked samples were analyzed by the developed method. The standard addition method was utilized to calculate the recovery. The water samples were added with Fe3+ and Pb2+ ions (5, 10, and 20 µM) and interacted with VV-CDs. The FL emission intensity was assessed with three repetitive measurements to calculate their recovery percentages and relative standard deviations (RSDs). The results of spiked water samples are displayed in Table S3. It can be observed that the spiked recoveries ranged from 99.07% to 101.39% and 99.19% to 100.75% for Fe3+ and Pb2+ ions, respectively. The RSDs ranged from 0.43% to 1.14% for Fe3+ ions and from 0.43% to 1.13% for Pb2+ ions. These findings demonstrated that VV-CDs as an FL sensor would be competitive and could be utilized as an alternative method to detect Fe3+ and Pb2+ ions in real water samples.
4. Conclusions
In this study, an easy and simple hydrothermal treatment was used to synthesize VV-CDs from the VV mushroom as an easily available and low-cost natural carbon precursor. The VV-CDs exhibited a bright blue color under UV-light with excitation and emission wavelengths of 360 and 440 nm, respectively. The VV-CDs showed a relatively high QY of about 11.5%. Then, the VV-CDs were utilized as an FL sensor to detect Fe3+ and Pb2+ ions. The FL emission intensity of VV-CDs was significantly quenched by Fe3+ and Pb2+ ions based on their concentrations. The broad linear range was from 1 to 100 µM with a good correlation, as well as LODs of 12 and 16 nM for Pb2+ and Fe3+ ions, respectively. This FL sensor was tested with three real water samples and very satisfactory spiked recoveries were obtained. The present study proposes a new approach for developing a cheap, simple, fast, and effective FL sensor to detect Fe3+ and Pb2+ ions in the environment.
Supplementary Materials
The following are available online at https://www.mdpi.com/2227-9040/8/3/47/s1, Figure S1: FL emission spectra of VV-CDs prepared at different (a) hydrothermal temperatures and (b) hydrothermal reaction time durations. (excitation wavelength: 360 nm), Figure S2: The FL emission spectra of VV-CDs solution under various (a) heating temperatures, (b) ionic strength concentrations, (c) UV-light irradiation times, and (d) storage times (excitation wavelength = 360 nm), Figure S3: FL emission spectra of VV-CDs solution under (a) pH 2–5 and (b) pH 5–12. (c) A comparison of the FL emission intensity of VV-CDs for pH values ranging from 2 to 12, Figure S4: The affinity order of metal ions to VV-CDs, Figure S5: The FL emission spectra of VV-CDs (black line), VV-CDs/Fe3+ (purple line), VV-CDs/Pb2+ (orange line), and VV-CDs/Fe3+/Pb2+ (green line). The concentration of Fe3+ and Pb2+ was 500 µM, Figure S6: Incubation time for the reaction of VV-CDs with Pb2+ and Fe3+ ions (1000 µM) showing the FL quenching efficiency, Figure S7: The plots of F/F0 with various concentrations from 1 to 1000 µM of (a) Fe3+ ions and (b) Pb2+ ions, Figure S8: The UV-Vis spectra of VV-CDs after adding different metal ions, Figure S9: Photoluminescence excitation spectra of V-CDs (black line), VV-CDs/Fe3+ (purple line), and VV-CDs/Pb2+ (orange line), Table S1: A comparison of the λex, λem, and QY from some natural product-derived CDs, Table S2: The analytical performances of some CDs to detect Fe3+ and Pb2+ ions, Table S3: The analysis of Fe3+ and Pb2+ ions in real water samples.
Author Contributions
Conceptualization, M.Z. and G.G.H.; methodology, M.Z. and G.G.H.; validation, M.Z. and G.G.H.; formal analysis, M.Z. and Y.-H.P.; investigation, M.Z., K.-C.L., and S.D.; resources, G.G.H.; data curation, K.-C.L.; writing—original draft preparation, M.Z.; writing—review and editing, M.Z., A.R., and G.G.H.; visualization, M.Z.; supervision, G.G.H.; project administration, G.G.H.; funding acquisition, G.G.H. All authors have read and agreed to the published version of the manuscript.
Funding
This study was funded by the Taiwan Ministry of Science and Technology (MOST107-2113-M-037-013) and the Kaohsiung Medical University Research Foundation (KMU-M109025).
Acknowledgments
We thank the head of the Department of Medicinal and Applied Chemistry, Kaohsiung Medical University, for providing the accessibility of instruments and other facilities.
Conflicts of Interest
The authors declare no conflicts of interest.
References
- Vodyanitskii, Y.N. Contamination of soils with heavy metals and metalloids and its ecological hazard (analytic review). Eurasian Soil Sci. 2013, 46, 793–801. [Google Scholar] [CrossRef]
- Hentze, M.W.; Muckenthaler, M.U.; Galy, B.; Camaschella, C. Two to Tango: Regulation of Mammalian Iron Metabolism. Cell 2010, 142, 24–38. [Google Scholar] [CrossRef] [PubMed]
- Schwartz, J. Societal Benefits of Reducing Lead Exposure. Environ. Res. 1994, 66, 105–124. [Google Scholar] [CrossRef] [PubMed]
- Torti, S.V.; Torti, F.M. Iron and cancer: More ore to be mined. Nat. Rev. Cancer 2013, 13, 342–355. [Google Scholar] [CrossRef]
- Lu, Y.; Li, X.; Wang, G.; Tang, W. A highly sensitive and selective optical sensor for Pb2+ by using conjugated polymers and label-free oligonucleotides. Biosens. Bioelectron. 2013, 39, 231–235. [Google Scholar] [CrossRef]
- Narayanaswamy, N.; Govindaraju, T. Aldazine-based colorimetric sensors for Cu2+ and Fe3+. Sens. Actuators B Chem. 2012, 161, 304–310. [Google Scholar] [CrossRef]
- Hou, C.; Xiong, Y.; Fu, N.; Jacquot, C.C.; Squier, T.C.; Cao, H. Turn-on ratiometric fluorescent sensor for Pb2+ detection. Tetrahedron Lett. 2011, 52, 2692–2696. [Google Scholar] [CrossRef]
- Weinstein, D.A.; Roy, C.N.; Fleming, M.D.; Loda, M.F.; Wolfsdorf, J.I.; Andrews, N.C. Inappropriate expression of hepcidin is associated with iron refractory anemia: Implications for the anemia of chronic disease. Blood 2002, 100, 3776–3781. [Google Scholar] [CrossRef]
- Zhang, J.; Yu, S.H. Carbon dots: Large-scale synthesis, sensing and bioimaging. Mater. Today 2016, 19, 382–393. [Google Scholar] [CrossRef]
- Wang, Y.; Zhu, Y.; Yu, S.; Jiang, C. Fluorescent carbon dots: Rational synthesis, tunable optical properties and analytical applications. RSC Adv. 2017, 7, 40973–40989. [Google Scholar] [CrossRef]
- Wang, R.; Lu, K.-Q.; Tang, Z.-R.; Xu, Y.-J. Recent progress in carbon quantum dots: Synthesis, properties and applications in photocatalysis. J. Mater. Chem. A 2017, 5, 3717–3734. [Google Scholar] [CrossRef]
- Wei, J.; Zhang, X.; Sheng, Y.; Shen, J.; Huang, P.; Guo, S.; Pan, J.; Feng, B. Dual functional carbon dots derived from cornflour via a simple one-pot hydrothermal route. Mater. Lett. 2014, 123, 107–111. [Google Scholar] [CrossRef]
- Raveendran, V.; Suresh Babu, A.R.; Renuka, N.K. Mint leaf derived carbon dots for dual analyte detection of Fe(III) and ascorbic acid. RSC Adv. 2019, 9, 12070–12077. [Google Scholar] [CrossRef]
- Roshni, V.; Misra, S.; Santra, M.K.; Ottoor, D. One pot green synthesis of C-dots from groundnuts and its application as Cr(VI) sensor and in vitro bioimaging agent. J. Photochem. Photobiol. A Chem. 2019, 373, 28–36. [Google Scholar]
- Shen, J.; Shang, S.; Chen, X.; Wang, D.; Cai, Y. Facile synthesis of fluorescence carbon dots from sweet potato for Fe3+ sensing and cell imaging. Mater. Sci. Eng. C 2017, 76, 856–864. [Google Scholar] [CrossRef] [PubMed]
- Zulfajri, M.; Dayalan, S.; Li, W.Y.; Chang, C.J.; Chang, Y.P.; Huang, G.G. Nitrogen-doped carbon dots from Averrhoa carambola fruit extract as a fluorescent probe for methyl orange. Sensors 2019, 19, 5008. [Google Scholar] [CrossRef]
- Zakhary, J.W.; E-mahdy, A.R.; Abo-bakr, T.M.; Tabey-shehata, A.M.E. Cultivation and Chemical Composition of the Paddy-Straw Mushroom (Volvariella volvaceae). Food Chem. 1984, 13, 265–276. [Google Scholar] [CrossRef]
- Zulfajri, M.; Gedda, G.; Chang, C.J.; Chang, Y.P.; Huang, G.G. Cranberry Beans Derived Carbon Dots as a Potential Fluorescence Sensor for Selective Detection of Fe3+ Ions in Aqueous Solution. ACS Omega 2019, 4, 15382–15392. [Google Scholar] [CrossRef] [PubMed]
- Venkatesan, G.; Rajagopalan, V.; Chakravarthula, S.N. Boswellia ovalifoliolata bark extract derived carbon dots for selective fluorescent sensing of Fe3+. J. Environ. Chem. Eng. 2019, 7, 103013. [Google Scholar] [CrossRef]
- Pu, Z.; Wen, Q.; Yang, Y.; Cui, X.; Ling, J.; Liu, P.; Cao, Q. Fluorescent carbon quantum dots synthesized using phenylalanine and citric acid for selective detection of Fe3+ ions. Spectrochim. Acta Part A Mol. Biomol. Spectrosc. 2019, 229, 117944. [Google Scholar] [CrossRef]
- Kim, Y.; Kim, J. Bioinspired thiol functionalized carbon dots for rapid detection of lead (II) ions in human serum. Opt. Mater. 2020, 99, 109514. [Google Scholar] [CrossRef]
- Wee, S.S.; Ng, Y.H.; Ng, S.M. Synthesis of fluorescent carbon dots via simple acid hydrolysis of bovine serum albumin and its potential as sensitive sensing probe for lead (II) ions. Talanta 2013, 116, 71–76. [Google Scholar] [CrossRef] [PubMed]
- Yarur, F.; Macairan, J.-R.; Naccache, R. Ratiometric Detection of Heavy Metal Ions Using Fluorescent Carbon Dots. Environ. Sci. Nano 2019, 6, 1121–1130. [Google Scholar] [CrossRef]
- Zulfajri, M.; Rasool, A.; Huang, G.G. A fluorescent sensor based on oyster mushroom-carbon dots for sensing nitroarenes in aqueous solutions. New J. Chem. 2020, 44, 10525–10535. [Google Scholar] [CrossRef]
- Roy, P.; Chen, P.C.; Periasamy, A.P.; Chen, Y.N.; Chang, H.T. Photoluminescent carbon nanodots: Synthesis, physicochemical properties and analytical applications. Mater. Today 2015, 18, 447–458. [Google Scholar] [CrossRef]
- Ogi, T.; Aishima, K.; Permatasari, F.A.; Iskandar, F.; Tanabe, E.; Okuyama, K. Kinetics of nitrogen-doped carbon dot formation: Via hydrothermal synthesis. New J. Chem. 2016, 40, 5555–5561. [Google Scholar] [CrossRef]
- Zulfajri, M.; Abdelhamid, H.N.; Sudewi, S.; Dayalan, S.; Rasool, A.; Habib, A.; Huang, G.G. Plant Part-Derived Carbon Dots for Biosensing. Biosensors 2020, 10, 68. [Google Scholar] [CrossRef]
- Li, L.; Yu, B.; You, T. Nitrogen and sulfur co-doped carbon dots for highly selective and sensitive detection of Hg (II) ions. Biosens. Bioelectron. 2015, 74, 263–269. [Google Scholar] [CrossRef]
- Yang, X.; Zhuo, Y.; Zhu, S.; Luo, Y.; Feng, Y.; Dou, Y. Novel and green synthesis of high-fluorescent carbon dots originated from honey for sensing and imaging. Biosens. Bioelectron. 2014, 60, 292–298. [Google Scholar] [CrossRef]
- Qu, Y.Y.; Ren, G.; Yu, L.; Zhu, B.; Chai, F.; Chen, L. The carbon dots as colorimetric and fluorescent dual-readout probe for 2-nitrophenol and 4-nitrophenol detection. J. Lumin. 2019, 207, 589–596. [Google Scholar] [CrossRef]
- Li, L.S.; Jiao, X.Y.; Zhang, Y.; Cheng, C.; Huang, K.; Xu, L. Green synthesis of fluorescent carbon dots from Hongcaitai for selective detection of hypochlorite and mercuric ions and cell imaging. Sens. Actuators B Chem. 2018, 263, 426–435. [Google Scholar] [CrossRef]
- Atchudan, R.; Edison, T.N.J.I.; Chakradhar, D.; Perumal, S.; Shim, J.J.; Lee, Y.R. Facile green synthesis of nitrogen-doped carbon dots using Chionanthus retusus fruit extract and investigation of their suitability for metal ion sensing and biological applications. Sens. Actuators B Chem. 2017, 246, 497–509. [Google Scholar] [CrossRef]
- Liu, W.; Diao, H.; Chang, H.; Wang, H.; Li, T.; Wei, W. Green synthesis of carbon dots from rose-heart radish and application for Fe3+ detection and cell imaging. Sens. Actuators B Chem. 2017, 241, 190–198. [Google Scholar] [CrossRef]
- Purbia, R.; Paria, S. A simple turn on fluorescent sensor for the selective detection of thiamine using coconut water derived luminescent carbon dots. Biosens. Bioelectron. 2016, 79, 467–475. [Google Scholar] [CrossRef]
- Edison, T.N.; Atchudan, R.; Sethuraman, M.G.; Shim, J.J.; Lee, Y.R. Microwave assisted green synthesis of fluorescent N-doped carbon dots: Cytotoxicity and bio-imaging applications. J. Photochem. Photobiol. B Biol. 2016, 161, 154–161. [Google Scholar] [CrossRef]
- Edison, T.N.J.I.; Atchudan, R.; Shim, J.J.; Kalimuthu, S.; Ahn, B.C.; Lee, Y.R. Turn-off fluorescence sensor for the detection of ferric ion in water using green synthesized N-doped carbon dots and its bio-imaging. J. Photochem. Photobiol. B Biol. 2016, 158, 235–242. [Google Scholar] [CrossRef]
- Ansi, V.A.; Renuka, N.K. Table sugar derived Carbon dot—A naked eye sensor for toxic Pb2+ ions. Sens. Actuators B Chem. 2018, 264, 67–75. [Google Scholar] [CrossRef]
- Khan, W.U.; Wang, D.; Wang, Y. Highly Green Emissive Nitrogen-Doped Carbon Dots with Excellent Thermal Stability for Bioimaging and Solid-State LED. Inorg. Chem. 2018, 57, 15229–15239. [Google Scholar] [CrossRef]
- Zhang, H.; Chen, Y.; Liang, M.; Xu, L.; Qi, S.; Chen, H.; Chen, X. Solid-phase synthesis of highly fluorescent nitrogen-doped carbon dots for sensitive and selective probing ferric ions in living cells. Anal. Chem. 2014, 86, 9846–9852. [Google Scholar] [CrossRef]
- Soni, H.; Pamidimukkala, P.S. Green synthesis of N,S co-doped carbon quantum dots from triflic acid treated palm shell waste and their application in nitrophenol sensing. Mater. Res. Bull. 2018, 108, 250–254. [Google Scholar] [CrossRef]
- Sahu, S.; Behera, B.; Maiti, T.K.; Mohapatra, S. Simple one-step synthesis of highly luminescent carbon dots from orange juice: Application as excellent bio-imaging agents. Chem. Commun. 2012, 48, 8835–8837. [Google Scholar] [CrossRef] [PubMed]
- Zhang, S.; Li, J.; Zeng, M.; Xu, J.; Wang, X.; Hu, W. Polymer nanodots of graphitic carbon nitride as effective fluorescent probes for the detection of Fe3+ and Cu2+ ions. Nanoscale 2014, 6, 4157–4162. [Google Scholar] [CrossRef] [PubMed]
- Barati, A.; Shamsipur, M.; Arkan, E.; Hosseinzadeh, L.; Abdollahi, H. Synthesis of biocompatible and highly photoluminescent nitrogen doped carbon dots from lime: Analytical applications and optimization using response surface methodology. Mater. Sci. Eng. C 2015, 47, 325–332. [Google Scholar] [CrossRef] [PubMed]
- Yang, R.; Guo, X.; Jia, L.; Zhang, Y.; Zhao, Z.; Lonshakov, F. Green preparation of carbon dots with mangosteen pulp for the selective detection of Fe3+ ions and cell imaging. Appl. Surf. Sci. 2017, 423, 426–432. [Google Scholar] [CrossRef]
- Zhu, X.; Zhang, Z.; Xue, Z.; Huang, C.; Shan, Y.; Liu, C.; Qin, X.; Yang, W.; Chen, X.; Wang, T. Understanding the Selective Detection of Fe3+ Based on Graphene Quantum Dots as Fluorescent Probes: The Ksp of a Metal Hydroxide-Assisted Mechanism. Anal. Chem. 2017, 89, 12054–12058. [Google Scholar] [CrossRef] [PubMed]
- Sahoo, N.K.; Jana, G.C.; Aktara, M.N.; Das, S.; Nayim, S.; Patra, A.; Bhattacharjee, P.; Bhadra, K.; Hossain, M. Carbon dots derived from lychee waste: Application for Fe3+ ions sensing in real water and multicolor cell imaging of skin melanoma cells. Mater. Sci. Eng. C 2020, 108, 110429. [Google Scholar] [CrossRef]
© 2020 by the authors. Licensee MDPI, Basel, Switzerland. This article is an open access article distributed under the terms and conditions of the Creative Commons Attribution (CC BY) license (http://creativecommons.org/licenses/by/4.0/).