Article

Yeast Propagation Control: Low Frequency Electrochemical Impedance Spectroscopy as an Alternative for Cell Counting Chambers in Brewery Applications

by
Georg Christoph Brunauer
1,2,
Oliver Spadiut
3,
Alfred Gruber
4 and
Christoph Slouka
3,*
1
Campus Kuchl, Salzburg University of Applied Sciences Urstein Süd, 5412 Puch/Salzburg, Austria
2
Institute for Energy Systems and Thermodynamics, TU Wien, 1060 Vienna, Austria
3
Research Division Biochemical Engineering, Group for Integrated Bioprocess Development, Institute of Chemical Engineering, TU Wien, 1060 Vienna, Austria
4
Alfred Gruber GmbH, Eugendorf, 5301 Salzburg, Austria
*
Author to whom correspondence should be addressed.
Chemosensors 2020, 8(2), 27; https://doi.org/10.3390/chemosensors8020027
Submission received: 5 March 2020 / Revised: 31 March 2020 / Accepted: 4 April 2020 / Published: 7 April 2020

Abstract

:
Electrochemical impedance spectroscopy is a powerful tool in life science for cell and pathogen detection, as well as for cell counting. The measurement principles and techniques using impedance spectroscopy are highly diverse. Differences can be found in used frequency range (β or α regime), analyzed quantities, like charge transfer resistance, dielectric permittivity of double layer capacitance and in off- or online usage. In recent contributions, applications of low-frequency impedance spectroscopy in the α regime were tested for determination of cell counts and metabolic burden in Escherichia coli and Saccharomyces cerevisiae. The established easy to use methods showed reasonable potential in the lab scale, especially for S. cerevisiae. However, until now, measurements for cell counts in food science are generally based on Thoma cell counting chambers. These microscopic cell counting methods decelerate an easy and quick prediction of yeast viability, as they are labor intensive and result in a time delayed response signal. In this contribution we tested our developed method using low frequency impedance spectroscopy locally at an industrial brewery propagation site and compared results to classic cell counting procedures.

1. Introduction

Cultivation technology using microorganisms, like bacteria and yeasts, is not only applied in pharmaceutical technology, but also in branches like food and bulk chemical production and highly emerging in waste-to-value concepts [1]. In all those applications, process monitoring (process analytical technology—PAT) is of utmost importance to control the system and react timely upon metabolic changes. pH, dissolved oxygen (dO2) and off-gas analytics are widely applied and can be regarded as state of the art in today’s industrial cultivation process to aim for product quality and safety. The most important parameter in bioprocesses, the biomass, is generally analyzed using offline methods like cell chamber counting, cell dry weight or optical density (OD600). As control and analytical tools aiming for biomass determination are often cost intensive, they are used for high value products like in the pharmaceutical biotech, by default. In contrast, classical bulk food products—such as yeast and beer—are low value products with costs of only some Euro/kg. These products are therefore produced in uncontrolled environments and often result in batch to batch variations and even whole batch losses. For these systems complex raw material—like molasses or sulfur spent liquor—are used as they are considered as waste and therefore low in price. These materials have the further drawback that no accurate determination of biomass using offline and online methods is possible anymore, since the media is optical dense and has a high number of particles inside [2]. Knowledge about the growth conditions of the yeast (propagation and fermentation) are of high importance for the quality of the final product. The use of accurate and reliable biomass measurement systems [3,4], especially of viable cell concentrations (VCCs), would enable proper process control tools. This would enhance the robustness of the bioprocess and reduce the batch to batch variations. Accurate determination of the VCC is possible using flow cytometry or confocal microscopy. Beside the known forward-scatter and side-scatter effects, which can be used for size and shape determinations, these systems rely on marker proteins or fluorescence probes for living/dead screening [5,6]. Propidium Iodide—marking the DNA of the cells—and other stains can be used for these screenings [7]. As these methods are cost intensive, the implementation of online vitality measurements in the brewing industry has historically been hindered by affordable, simple, robust and reproducible tests [8].
Online and inline biomass measurement approaches are rather scarce and are based on physical measurement principles. Beside the optical measurements, many biosensors use a change of an electrical signal for analysis. Many applications in this branch use impedance spectroscopy or cyclovoltammetry for detection of low amounts of a target proteins, cells, virus, etc. [9,10,11,12,13]. In general, these systems use recognition elements like antibodies, aptamers or DNA to bind the target protein, cell, etc. The benefit of these systems is generally the very low limit of detection, but the drawback is the early saturation of such probes. In contrast, sensors used in process analytics would need not a low limit of detection and a high sensitivity for low amounts of the target, but a high linearity from cell densities of about 1 g/L to 100 g/L of cell dry weight. Many commercial sensors rely on high frequency alternating current (AC) impedance spectroscopy with high field amplitudes based. This relaxation phenomenon is referred to as ß-dispersion [14,15]. Cells with an intact cell membrane affect the relative permittivity between at least two electrodes in contrast to dead cells. The magnitude of change of the permittivity signal is then used for the estimation of VCCs. Details on the measurement principles can be found elsewhere [16,17,18,19]. The model organism for AC measurements in the ß-dispersion range is yeast, being a very important expression host for recombinant proteins [20,21,22] and of high interest for food processing industry. Additionally, approaches towards more complex expression systems, such as filamentous fungi and Chinese hamster ovary (CHO) cells, were performed [23,24,25,26]. The drawbacks are that these measurements show a strong dependence upon physical process parameters (e.g., aeration and stirring—causing gas bubbles, temperature shifts and pH gradients). Also changes in the media during fermentation show effects on the signal amplitude and make complex data analysis necessary [24].
However, the ß-relaxation in the frequency range from 107 to 104 Hz is not the only relaxation phenomenon which can be exploited for the determination of biomass. Changes of the electrical double layer by the adsorption/desorption of cells at the electrode surface, the so-called α-dispersion in a frequency range from 104 to 10−2 Hz, can provide valuable information. While ß-dispersion effects the entire cells through Wagner–Maxwell polarization, α-dispersion is preliminary based on ionic interactions and relaxation phenomena on the cell membrane [15]. Different parameters can affect the signal in this range. First, the cell itself, exhibiting differences in cell wall, the membrane compositions, size and shape and metabolism. Second, physical parameters and the media (pH and ion concentrations) may show influence on the potential distribution at the electrode double layer [20,21]. Impedance spectroscopy in the α-dispersion range is until now applied for detection of bacteria in soil, food and feces-polluted water using interdigitated electrodes [27,28,29,30,31,32,33,34,35]. First approaches towards process monitoring were shown in [36]. The authors showed the feasibility for measuring changes in the double-layer capacitance (CDL). However, they extracted only discrete capacitance values at given frequencies and did not consider the entire spectrum. Recent studies by our group on Escherichia coli and S. cerevisiae showed reasonable results for VCC determination throughout the whole cultivation range. We cultivated in batch phase, but also in the fed-batch, which led to high cell densities [37,38].
In this study, we applied the developed impedance measurement technique in the α-regime in a laboratory lab scale run using media and yeast from Stiegl brewery (Salzburg, Austria). In a second step we tested our system at the brewery on site. Samples were taken from the propagation reactor and put to a self-built test setup in order to maintain sterility of the propagation reactor. The samples were temperature-controlled and measured. Different state-of-the-art methods were applied for determination of the corresponding total biomass—dry cell weight (DCW), optical density (OD610) and offline flow cytometry with propidium iodide for cell physiology evaluation. For the on-site measurement offline determination using cell counting chambers were performed. With this knowledge, we were able to correlate the total biomass to the extracted CDL and show the straight-forward application of the system for cell number determination even in industrial-scale applications.

2. Materials and Methods

2.1. Expression Host and Cultivation

Lab cultivations were performed using the S. cerevisiae strain, supplied by Brauerei Stiegl (Salzburg, Austria). Batch propagation was performed in a stainless-steel Sartorius Biostat Cplus bioreactor (Sartorius, Göttingen, Germany) with a 10 L working volume. We added 1 L of supplied yeast suspension (Stiegl) to an autoclaved reactor with 4 L of wort. The stirrer was operated at 1400 rpm stirrer speeds with an aeration of 2 vvm pressurized air. Temperature was set to 12 °C throughout the whole process.
Industrial propagation was performed at Brauerei Stiegl in Salzburg using a stainless-steel propagator with a volume of 1500 L. Process aeration was alternated with pumping of the broth. Temperature in the propagator was uncontrolled, Figure 1a. In order to maintain sterility intact, samples were taken through a sampling valve and put into a custom-made cooling reactor with included impedance measurement setup. The so taken samples were analyzed using the atline measurement setup given in detail in Reference [38].

2.2. Process Analytics

For the lab scale experiment, we determined biomass by cell dry weight (CDW) measurements and OD600. Following methodological procedure was performed: 2 mL of the cultivation broth were centrifuged at 4500 g, subsequently washed with 0.9% NaCl solution and centrifuged again. The cells were put into a furnace at 105 °C for 48 h and afterwards the dry pellet was evaluated gravimetrically using an analytical scale. These measurements were performed in triplicates and the mean error for CDW was always below 3%. OD600 was measured at a UV/VIS photometer Genisys 20 (Thermo Scientific, Waltham, MA, US). For determination of sugar in the fermentation broth we used a Supelco C-610H HPLC column (Supelco, Bellefonte, PA, USA) on an Ultimate 3000 HPLC system (Thermo Scientific, Waltham, MA, US) with 0.1% H3PO4 as a running buffer at 0.5 mL/min. Ethanol in the cultivation broth was analyzed using an Aminex HPLC column (Biorad, Hercules, CA, USA) on an Agilent 1100 System (Agilent Systems, Santa Clara, CA, USA) with 40 mM H2SO4 as a running buffer at 0.6 mL/min. The cultivation off-gas was analyzed by following gas sensors: IR for CO2 and ZrO2-based for O2 (Blue Sens Gas analytics, Herten, Germany). Details on the flow cytometry method can be found elsewhere [39]. A CytoSense flow cytometer (CytoBuoy, Woerden, Netherlands) with two forward scatter (FSC), one sideward scatter (SSC) and two fluorescence channels (green, red) was used for analysis of the yeast cells. The implemented laser had a wavelength of 488 nm. The configuration of the filter set was 515–562 ± 5 nm for the green fluorescence channel (FL-green, used for fluorescein diacetate) and 605–720 ± 5 nm for the red fluorescence channel (FL-red, used for propidium iodide)
Industrial cell counting measurements were performed using Thoma cell measurements. The number of cells in the suspension can be determined by Equation (1):
T o t a l   c e l l   n u m b e r = ( c o u n t e d   c e l l s / n u m b e r   o f   c o u n t e d   c a r r a y s )   x   400   x   10 4   x   d i l u t i o n   f a c t o r
With 400 × 104 being the factor of Thoma chamber. Differentiation between viable and dead cells was not performed. A sketch of the used Thoma chamber is given in Supplementary Figure S1.

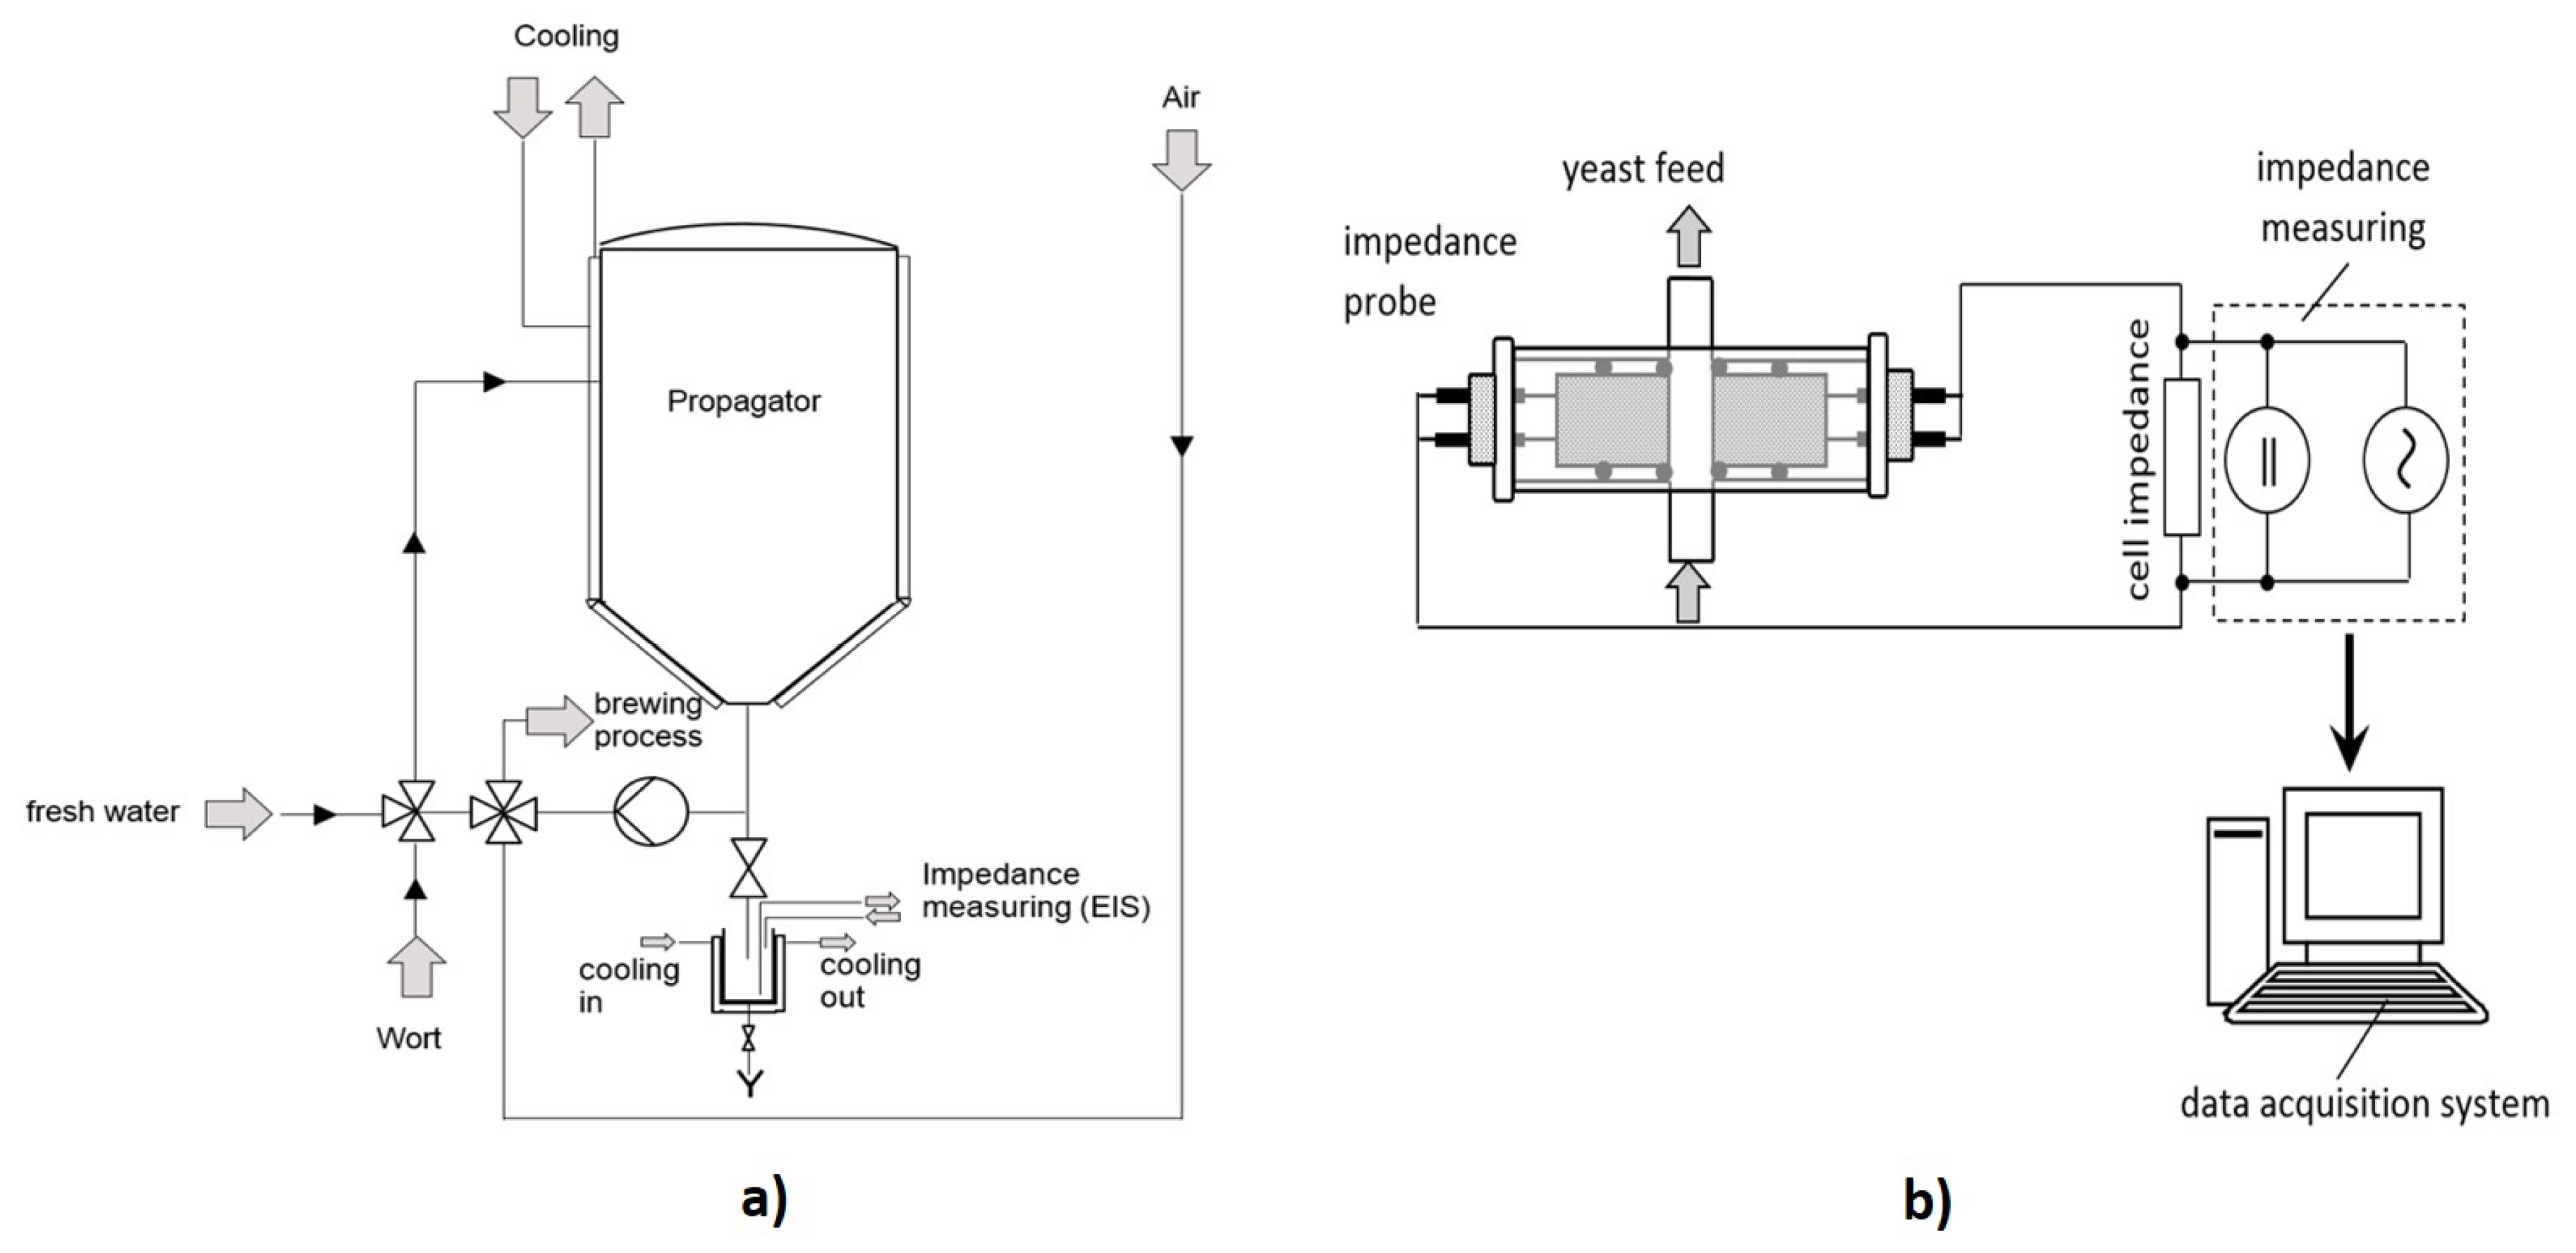
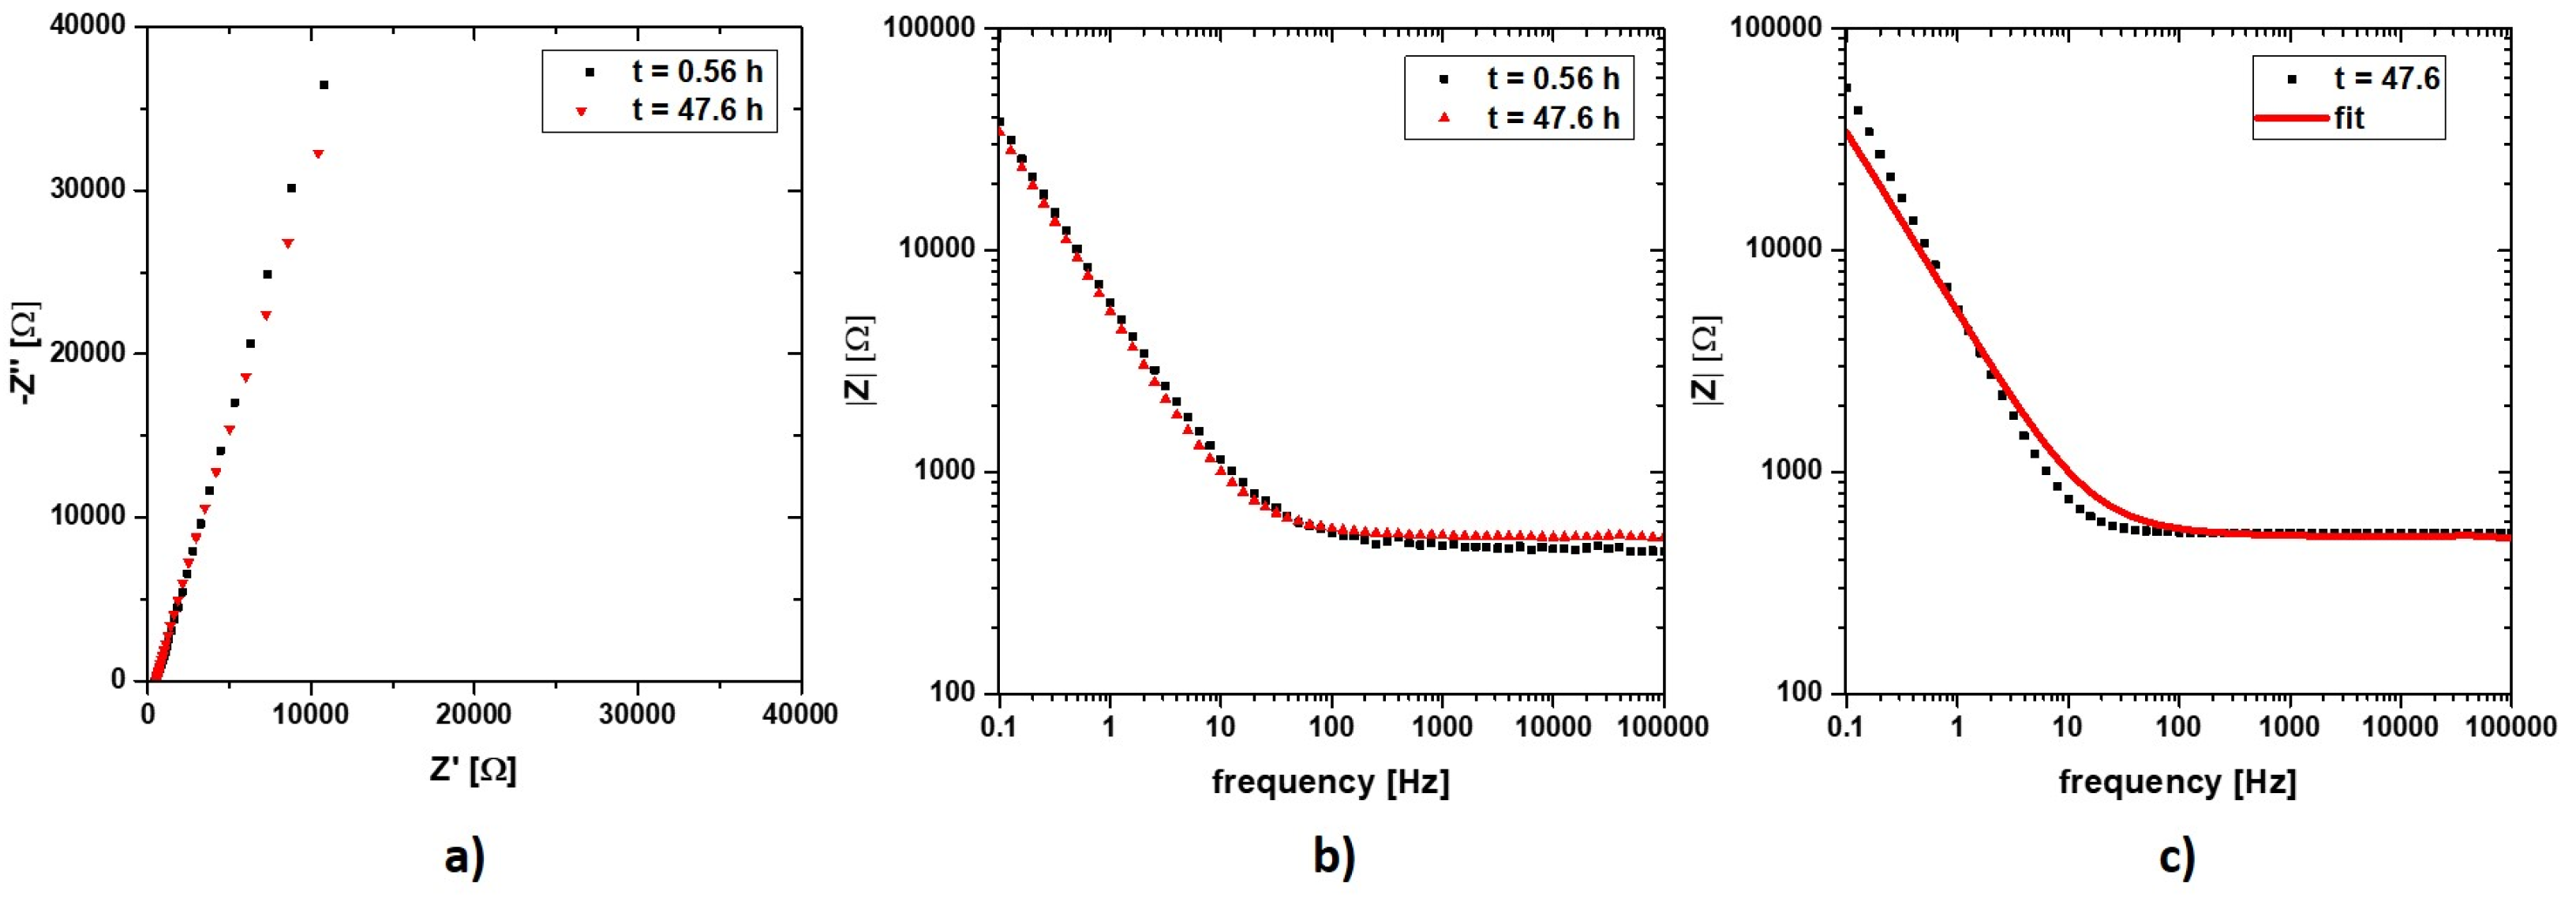
2.3. Impedance Measurements

Analysis of viable cell concentrations is of utmost importance for industrial applications. The majority of these systems rely on β-dispersion (107–104 Hz) and are strongly dependent on process parameters (e.g., stirring, temperature, pH, salt and substrate concentration, etc.) and the cultivation phase (exponential growth phase, starvation phase, etc.) [12,33]. For our impedance measurements we exploited a different physical phenomenon (α-dispersion), which inherits valuable information regarding the biomass concentration. The “α-dispersion effect”, at frequencies below 1 to 10 kHz is most likely a result of deformation of ionic species around the cell membranes. The dielectric response was therefore proportional to the ionic charge gathered around the membrane of adsorbed cells on the stainless-steel electrode [20,21]. Impedance measurements were recorded in the range of 106 to 10−1 Hz with amplitudes up to 100 mV using the N4L PSM 1735 frequency analyzer (Newton4th Ltd., Leicester, UK). No DC voltage was applied during the measurement. Because measurements in this frequency range are largely determined by the double-layer region between the electrode and the media, rather minor interferences with the process parameters (aeration and stirring) were to be expected. For measurement an online probe presented in a recent publication was used for the lab scale cultivation [38].

3. Results and Discussion

Yeast propagation is a crucial process step in industrial breweries. Differences in the cell numbers after propagation directly affect the quality of the produced beer and result in batch to batch variations and in the worst-case scenario to batch loss. A reliable online or even inline method for viable cell number and metabolic state determination would revolutionize this step. Therefore, we tested the proposed measurement technique based on α-dispersion [37] in real food technological environment in a small scale fermenter (10 L) in the lab, as well as in a large scale propagation tank with a volume of 1500 L on the production site.

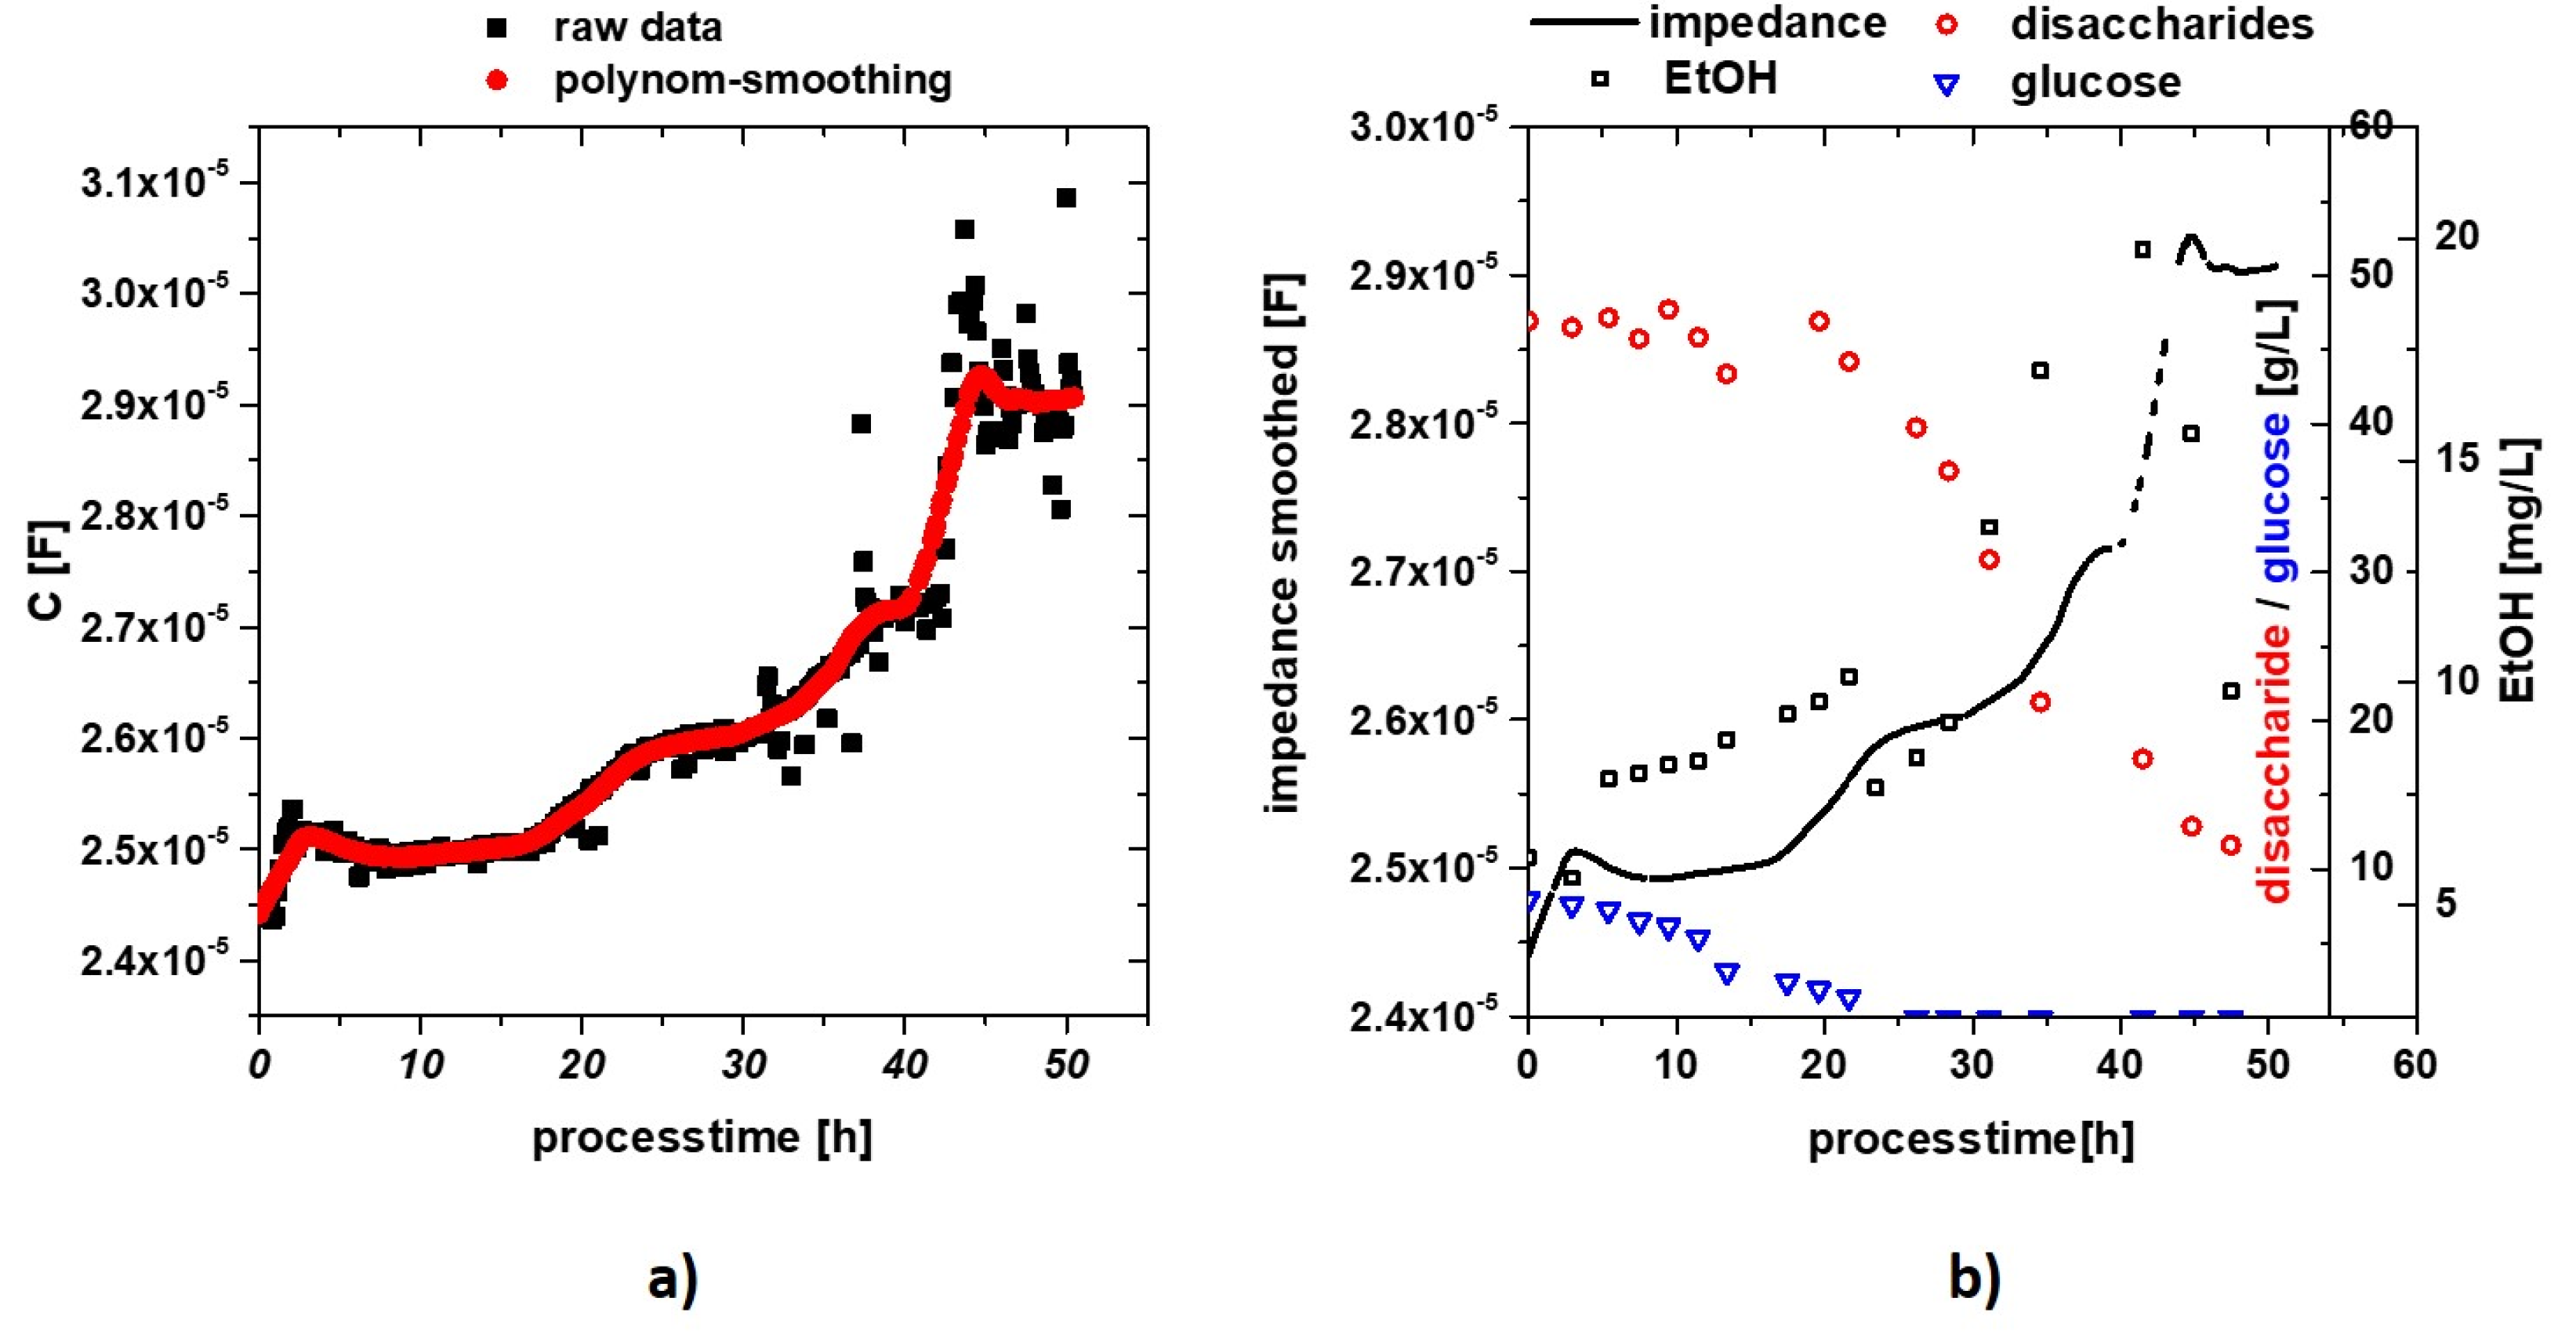
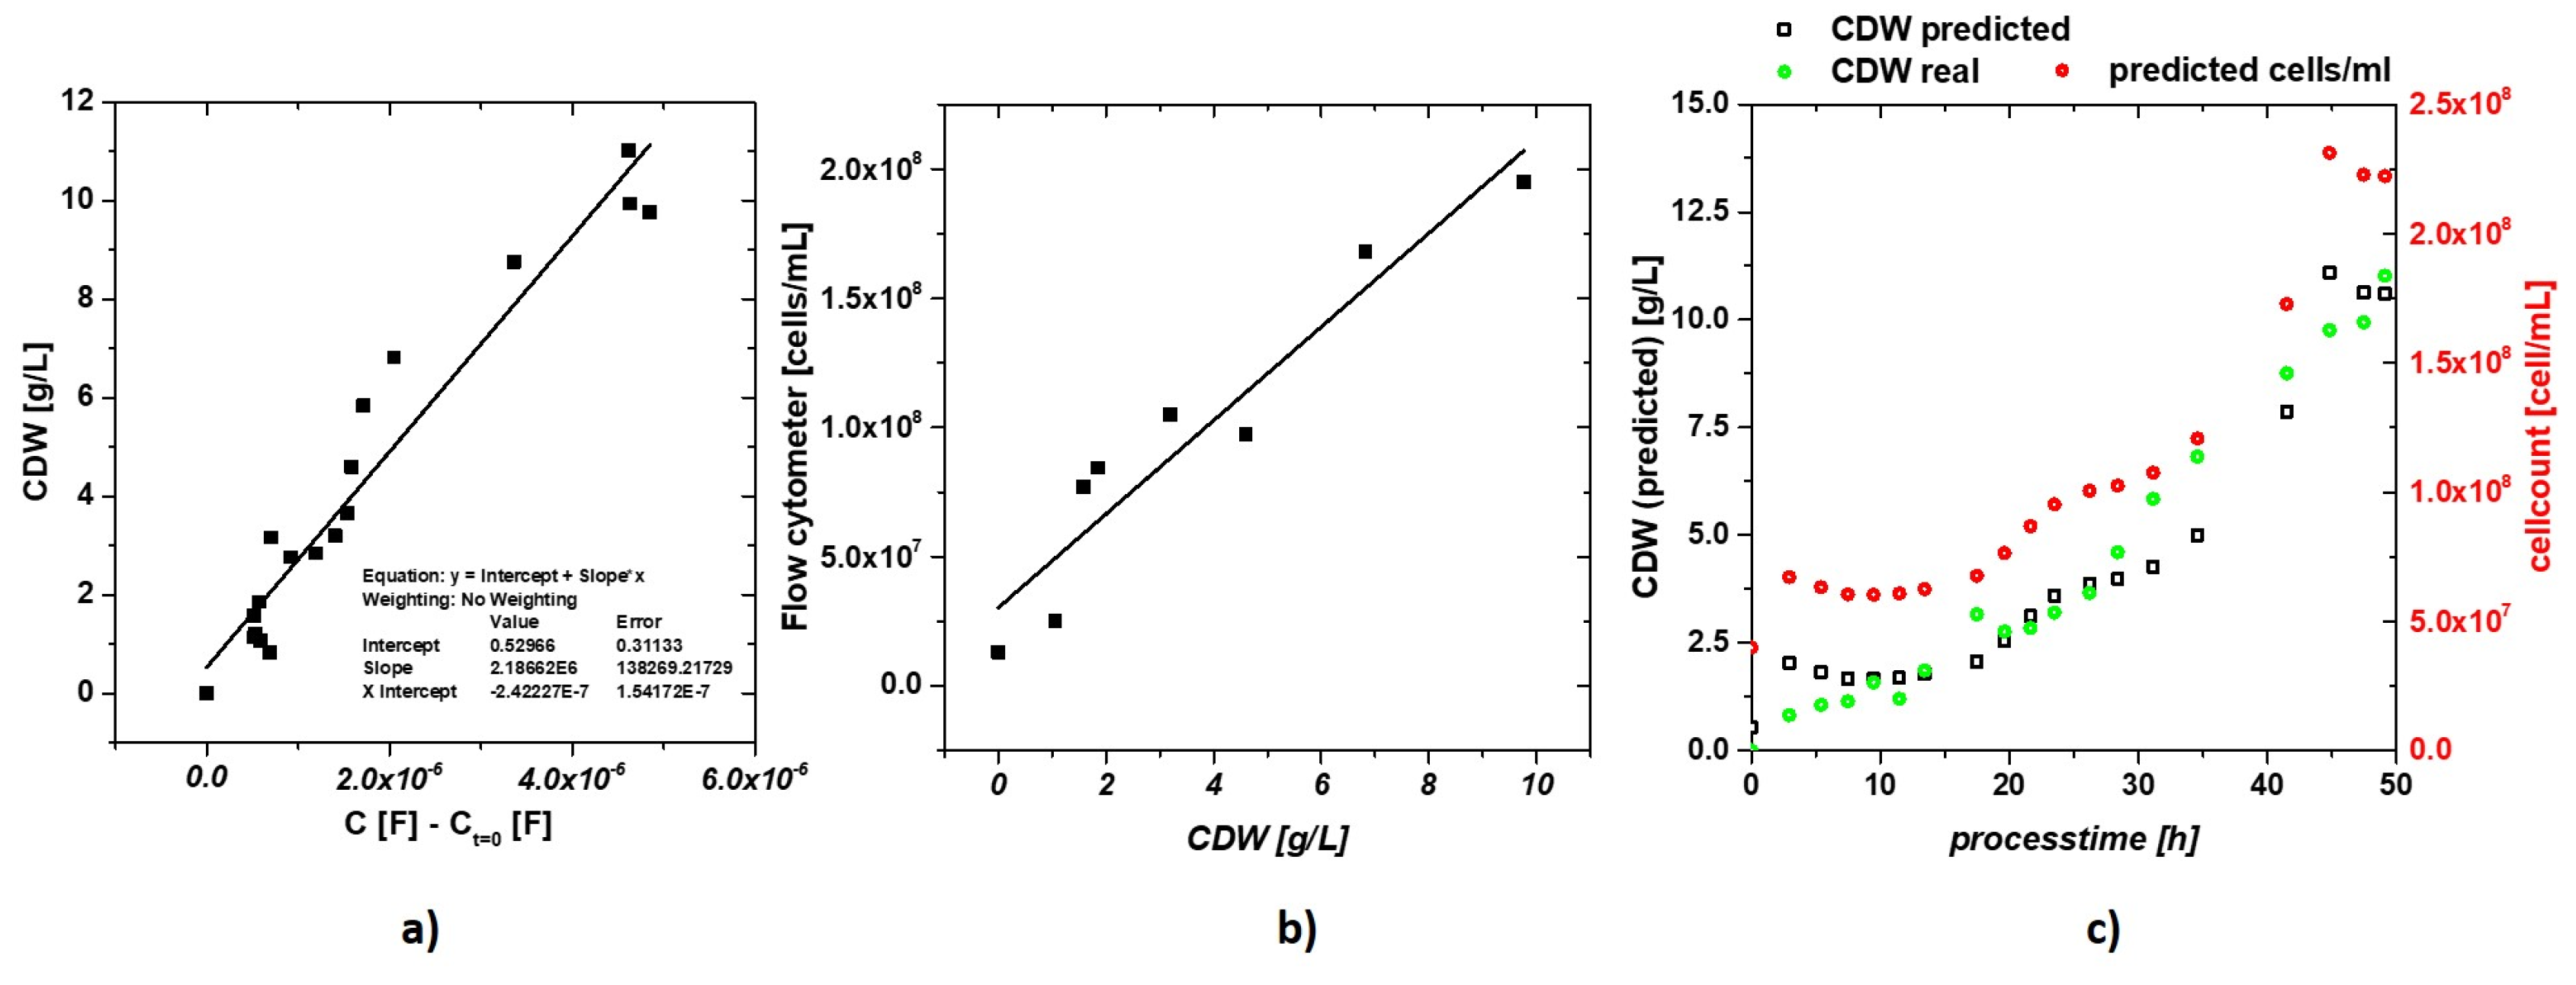
3.1. Labscale Propagation

For the feasibility measurement a lab scale propagation was performed using raw materials and yeasts supplied by Stiegl brewery. We used constant temperature of 12 °C for microbial growth and sampled regularly in intervals of about 2 h. Dissolved oxygen was always higher than 70%, indicating complete aerobic growth. Table 1 shows results of process analytics.
The cultivation reveals well-known behavior for S. cerevisiae indicating, beside aerobic growth, ethanol fermentation based on the limits in aerobic capacity of the cells, so called Crabtree effect [40]. So, highest amounts of 1.7% ethanol were produced within the lab scale cultivation, which are believed to show no inhibitory effects on the yeast growth [41]. Viability was also monitored via flow cytometry using propidium iodide as marker for cell death. Within the run almost no dead cells were found (0.1% in the last sample—Supplementary Figure S2). In Figure 2 the raw data for impedance measurement during the lab scale cultivation are presented, right after inoculation and at elevated batch times. a presents the Nyquist plot, while b shows the Bode plot with absolute value of impedance.
As clearly visible in the raw data, a small shoulder is visible for the media contribution at high frequencies, while at lower frequencies the contribution of the double layer is predominant. In general, such data are fitted using complex circuit models.
As already given in recent publications [37,38] the data can be fitted using constant phase elements (CPE) in combination with a resistance (R), so called R-CPE element, and resulted in an excellent fit of the raw data. Using CPE n and Q fitting parameters are used to calculate the sample capacitance (C) according to Equation (2). [42], with C being the sample capacitance and R the real part of the R-CPE element.
C = ( R 1 n   Q ) 1 / n
However, we experienced problems in correct fitting of the R element since the error was tremendous high and this makes it impossible to determine the accurate capacitance in this case via Equation (2). These problems were also experienced in recent studies using low cell densities [37,38]. Therefore, we fitted our data using in a straightforward way: an offset resistance for cable and contact resistance and an ideal capacitor equivalent circuit element for the double layer capacitance were applied, see Equation (3).
Chemosensors 08 00027 i001
The equivalent circuit shown in Equation (3) was fitted by complex non-linear least square fitting (CNLS) using the software ZView (Scribner, Southern Pines, NC, USA) using a resistance for the cable/setup offset and an ideal capacitanceThe results for the fit are displayed in Figure 2c. The fit with the ideal capacitance is not ideal, but give C values with an error of about 3%. The capacitance values for the entire cultivation are given in Figure 3a. As the raw data showed certain fluctuations in the signal, we smoothed the signal using a polynomial smoothing procedure using the OriginPro 2016G (Northampton, MA, USA). This results in the impedance signal given in Figure 3b. Certain plateaus are visible in the impedance data. Such effects were already observed in recent publications and indicate a change in metabolism of the cells affecting ionic cloud and membrane composition. First plateau at about 25 h resembles the depletion of the monosaccharide glucose, which is the favored carbon source for most heterotroph microorganisms. A switch to disaccharides in metabolism is clearly indicated. The main disaccharide in wort is maltose, but also different polysaccharides are present, which cannot be separated by our respective HPLC method and not metabolized. Upon carbon source depletion at about 45 h also the impedance signal stagnates, indicating the direct response to cell number in the cultivation broth, even when complex media, like wort, is used. This is also indicated by reduction of ethanol in the broth, since S. cerevisiae starts feeding on alcohol as last available carbon source. Figure 4a shows the linear fit of the impedance signal extracted using the equivalent circuit in Equation (3). The fit quality is high except for deviations in the beginning, when only a low number of cells are present in the broth and upon metabolism change as discussed before. We predicted the CDW based on the fit in Figure 4a.
As process analytics in Stiegl brewery rely on cell counting methods, we also evaluated our cell numbers in the broth using flow cytometry as explained in the material part. We did a correlation of the CDW to the cell numbers determined by flow cytometry. Linear correlation is given in Figure 4b and used for calculation of the cells/mL in Figure 4c. Maximum cell numbers are about 100 million cells/mL during the lab scale cultivation. The results are given in Figure 4c. Except in the beginning the fit quality is high enough and gives a reasonable approximation of the CDW in the broth.

3.2. Impedance Measurement Atline at Stiegl Brewery

After successful tests in the small scale we tested the impedance measurement technique on site at Stiegl brewery in a 1500 L propagation reactor. To keep the sterile environment of the propagation system intact, broth was sampled and circulated inside the measurement apparatus built by Gruber GmbH (Salzburg, Austria). During propagation of yeast in the reactor temperature rose from about 8 °C to 12 °C in the end of the cultivation. The measurement system was cooled to 7.6 to 8 °C for measurement. For inline measurement drifts in temperature during the run would have to be considered as the impedance signal is generally strongly dependent on the measurement temperature. Furthermore, aeration in the propagation system is very different to the lab scale setup. The lab scale is an ideal stirred tank reactor with aeration through sparger and mechanic stirring. The industrial propagation relies on alternating pumping of the cells and aeration of the system. Therefore, differences in the metabolic state of the samples is to be expected during this process design as cells always react upon differences in the dissolved oxygen level and may switch between aerobic and anaerobic conditions. After sampling, cells were circulated in the built setup, compare to Figure 1b. In Figure 5a the impedance signal measured in the measurement setup is given. Shallow fluctuations are visible at each sample. The data points were averaged and compared to the measured cell concentrations.
Cell numbers were analyzed by Stiegl in-house analytical methods using cell counting chambers. These values were compared to averaged capacitance value. Linear correlations are given in Figure 5b. A high linearity between the received cell numbers and the impedance signal is given. However, we see slight deviations to the lab scale system in the linear regression. While capacitance values extracted from the signal are very similar between the two measurement runs, absolute cell numbers differed. Differences in cell counting between cell chamber counting methods and flow cytometric analysis are also reported in literature for different applications [43,44]. Flow cytometry analyzes a high number of cells within a very short time and can distinguish between single, budding and dead cells. With cell chamber counting only a very limited number of cells can be analyzed at a time. Including staining would make it possible to distinguish further between living and dead cells. Summing up, cell counting chambers seems to underestimate the cell numbers in the cultivation broth as dedicated by the measured impedance signal. Therefore, calibration with the method of choice is crucial for exact determination of cell numbers used for further transfer of a certain cell number to the subsequent process step. Furthermore, differences in metabolic state between the lab-scale and the large-scale system could account for the signal differences. It is very likely that cells in the 1500 L reactor are very homogenously active in metabolism and result in a very different signal, also based on the differences in aeration and mixing. Table 2 presents the calculated cell numbers based on the calibration for yeast propagation at the Stiegl brewery on site.
We want to highlight that we can do accurate measurement of a very shallow range of cell numbers in an industrial propagation for beer production in a large-scale system. Based on these results, this straightforward measurement principle might find further applications in different food industrial branches, using yeasts and different microorganism.

4. Conclusions and Outlook

Within this contribution, we transferred the established impedance measurement method in the α-dispersion regime to industrial large-scale application in the brewing industry. We tested propagation in a lab scale system using wort and yeasts from the industrial partner. With the at-line measurement system we were able to measure impedance of the propagation broth on site without risking sterility of the propagation system. The received correlation between cell counting (done at Stiegl) and the impedance signal can now be used for direct measurement of cell numbers during propagation. The next step would be the manufacturing of an inline measurement system in the propagation tank including temperature compensation of the system and direct visualization of cell numbers.

Supplementary Materials

The following are available online at https://www.mdpi.com/2227-9040/8/2/27/s1, Figure S1: Cell counting procedure for Thoma chamber cell counting; Figure S2: l.h.s. all events measured in the flow cytometer; r.h.s. zoom in to living cell, almost no dead cells can be seen during the cultivation.

Author Contributions

G.C.B. and C.S. conducted the experiments. G.C.B. and A.G. built the measurement setup and applied it at Stiegl brewery. O.S. and C.S. conducted data analysis and drafted the manuscript. C.S. supervised the work. O.S. gave valuable input in conceptualization. All authors have read and agreed to the published version of the manuscript.

Funding

We thank the FFG Project Number: 874206 for funding.

Acknowledgments

We thank Stiegl brewery Salzburg for the opportunity to test the system on site. The authors also acknowledge TU Wien Bibliothek for financial support through its Open Access Funding Program.

Conflicts of Interest

The authors declare no financial or commercial conflict of interest.

Abbreviations

VCCviable cell concentration
FCMflow cytometry
ACalternating current
DCdirect current
ODoptical density
CDWcell dry weight
Ccapacitancelayer,
Roffsetoffset resistance,
Zimpedance,
HPLChigh performance liquid chromatography.

References

  1. Gavrilescu, M.; Chisti, Y. Biotechnology—A sustainable alternative for chemical industry. Biotechnol. Adv. 2005, 23, 471–499. [Google Scholar] [CrossRef] [PubMed]
  2. Salgado, A.; Folly, R.; Valdman, B. Biomass monitoring by use of a continuous on-line optical sensor. Sens. Actuators B Chem. 2001, 75, 24–28. [Google Scholar] [CrossRef]
  3. Clarke, D.; Blake-Coleman, B.; Carr, R.; Calder, M.; Atkinson, T. Monitoring reactor biomass. Trends Biotechnol. 1986, 4, 173–178. [Google Scholar] [CrossRef]
  4. Kiviharju, K.; Salonen, K.; Moilanen, U.; Eerikäinen, T. Biomass measurement online: The performance of in situ measurements and software sensors. J. Ind. Microbiol. Biotechnol. 2008, 35, 657–665. [Google Scholar] [CrossRef]
  5. Davey, H.M.; Kell, D.B. Flow cytometry and cell sorting of heterogeneous microbial populations: The importance of single-cell analyses. Microbiol. Rev. 1996, 60, 641–696. [Google Scholar] [CrossRef]
  6. Veal, D.A.; Deere, D.; Ferrari, B.; Piper, J.; Attfield, P.V. Fluorescence staining and flow cytometry for monitoring microbial cells. J. Immunol. Methods 2000, 243, 191–210. [Google Scholar] [CrossRef]
  7. Fiala, J.; Lloyd, D.; Rychtera, M.; Kent, C.; Al-Rubeai, M. Evaluation of cell numbers and viability of Saccharomyces cerevisiae by different counting methods. Biotechnol. Tech. 1999, 13, 787–795. [Google Scholar] [CrossRef]
  8. Lodolo, E.J.; Kock, J.L.; Axcell, B.C.; Brooks, M. The yeast Saccharomyces cerevisiae–the main character in beer brewing. FEMS Yeast Res. 2008, 8, 1018–1036. [Google Scholar] [CrossRef] [Green Version]
  9. Park, J.-Y.; Park, S.-M. DNA hybridization sensors based on electrochemical impedance spectroscopy as a detection tool. Sensors 2009, 9, 9513–9532. [Google Scholar] [CrossRef] [Green Version]
  10. Song, K.-M.; Lee, S.; Ban, C. Aptamers and their biological applications. Sensors 2012, 12, 612–631. [Google Scholar] [CrossRef] [Green Version]
  11. Lee, J.-O.; So, H.-M.; Jeon, E.-K.; Chang, H.; Won, K.; Kim, Y.H. Aptamers as molecular recognition elements for electrical nanobiosensors. Anal. Bioanal. Chem. 2008, 390, 1023–1032. [Google Scholar] [CrossRef] [PubMed] [Green Version]
  12. Yang, L. Electrical impedance spectroscopy for detection of bacterial cells in suspensions using interdigitated microelectrodes. Talanta 2008, 74, 1621–1629. [Google Scholar] [CrossRef] [PubMed]
  13. Kim, S.; Yu, G.; Kim, T.; Shin, K.; Yoon, J. Rapid bacterial detection with an interdigitated array electrode by electrochemical impedance spectroscopy. Electrochim. Acta 2012, 82, 126–131. [Google Scholar] [CrossRef]
  14. Schwan, H.P. Electrical and acoustic properties of biological materials and biomedical applications. Biomed. Eng. IEEE Trans. 1984, 12, 872–878. [Google Scholar] [CrossRef] [PubMed]
  15. Schwan, H.P.; Foster, K.R. RF-field interactions with biological systems: Electrical properties and biophysical mechanisms. Proc. IEEE 1980, 68, 104–113. [Google Scholar] [CrossRef]
  16. Yardley, J.E.; Kell, D.B.; Barrett, J.; Davey, C.L. On-line, real-time measurements of cellular biomass using dielectric spectroscopy. Biotechnol. Genet. Eng. Rev. 2000, 17, 3–36. [Google Scholar] [CrossRef] [Green Version]
  17. Dabros, M.; Dennewald, D.; Currie, D.J.; Lee, M.H.; Todd, R.W.; Marison, I.W.; von Stockar, U. Cole–Cole, linear and multivariate modeling of capacitance data for on-line monitoring of biomass. Bioprocess Biosyst. Eng. 2009, 32, 161–173. [Google Scholar] [CrossRef] [Green Version]
  18. Soley, A.; Lecina, M.; Gámez, X.; Cairo, J.; Riu, P.; Rosell, X.; Bragos, R.; Godia, F. On-line monitoring of yeast cell growth by impedance spectroscopy. J. Biotechnol. 2005, 118, 398–405. [Google Scholar] [CrossRef]
  19. Carvell, J.P.; Dowd, J.E. On-line measurements and control of viable cell density in cell culture manufacturing processes using radio-frequency impedance. Cytotechnology 2006, 50, 35–48. [Google Scholar] [CrossRef] [Green Version]
  20. Gerngross, T.U. Advances in the production of human therapeutic proteins in yeasts and filamentous fungi. Nat. Biotech. 2004, 22, 1409–1414. [Google Scholar] [CrossRef]
  21. Buckholz, R.G.; Gleeson, M.A.G. Yeast Systems for the Commercial Production of Heterologous Proteins. Nat. Biotech. 1991, 9, 1067–1072. [Google Scholar] [CrossRef] [PubMed]
  22. Cereghino, G.P.L.; Cregg, J.M. Applications of yeast in biotechnology: Protein production and genetic analysis. Curr. Opin. Biotechnol. 1999, 10, 422–427. [Google Scholar] [CrossRef]
  23. Konakovsky, V.; Yagtu, A.C.; Clemens, C.; Müller, M.M.; Berger, M.; Schlatter, S.; Herwig, C. Universal Capacitance Model for Real-Time Biomass in Cell Culture. Sensors 2015, 15, 22128–22150. [Google Scholar] [CrossRef] [PubMed] [Green Version]
  24. Ehgartner, D.; Sagmeister, P.; Herwig, C.; Wechselberger, P. A novel real-time method to estimate volumetric mass biodensity based on the combination of dielectric spectroscopy and soft-sensors. J. Chem. Technol. Biotechnol. 2015, 90, 262–272. [Google Scholar] [CrossRef]
  25. Ferreira, A.P.; Vieira, L.M.; Cardoso, J.P.; Menezes, J.C. Evaluation of a new annular capacitance probe for biomass monitoring in industrial pilot-scale fermentations. J. Biotechnol. 2005, 116, 403–409. [Google Scholar] [CrossRef]
  26. Mishima, K.; Mimura, A.; Takahara, Y.; Asami, K.; Hanai, T. On-line monitoring of cell concentrations by dielectric measurements. J. Ferment. Bioeng. 1991, 72, 291–295. [Google Scholar] [CrossRef]
  27. Radke, S.M.; Alocilja, E.C. Design and fabrication of a microimpedance biosensor for bacterial detection. Sens. J. IEEE 2004, 4, 434–440. [Google Scholar] [CrossRef]
  28. Yang, L.; Li, Y.; Griffis, C.L.; Johnson, M.G. Interdigitated microelectrode (IME) impedance sensor for the detection of viable Salmonella typhimurium. Biosens. Bioelectron. 2004, 19, 1139–1147. [Google Scholar] [CrossRef]
  29. Liu, J.; Li, H.; Zhang, F.; Li, X.; Wang, L.; Chen, Y. Online impedance monitoring of yeast cell culture behaviors. Microelectron. Eng. 2011, 88, 1711–1713. [Google Scholar] [CrossRef]
  30. Lei, K.F. Review on impedance detection of cellular responses in micro/nano environment. Micromachines 2014, 5, 1–12. [Google Scholar] [CrossRef] [Green Version]
  31. Yang, L.; Ruan, C.; Li, Y. Detection of viable Salmonella typhimurium by impedance measurement of electrode capacitance and medium resistance. Biosens. Bioelectron. 2003, 19, 495–502. [Google Scholar] [CrossRef]
  32. Gonzalez, J.; Santana, A.F.; Mirza-Rosca, J. Effect of bacterial biofilm on 316 SS corrosion in natural seawater by EIS. Corros. Sci. 1998, 40, 2141–2154. [Google Scholar] [CrossRef]
  33. Bayoudh, S.; Othmane, A.; Ponsonnet, L.; Ouada, H.B. Electrical detection and characterization of bacterial adhesion using electrochemical impedance spectroscopy-based flow chamber. Colloids Surf. A Physicochem. Eng. Asp. 2008, 318, 291–300. [Google Scholar] [CrossRef]
  34. Wu, J.; Ben, Y.; Chang, H.-C. Particle detection by electrical impedance spectroscopy with asymmetric-polarization AC electroosmotic trapping. Microfluid. Nanofluidics 2005, 1, 161–167. [Google Scholar] [CrossRef]
  35. K’Owino, I.O.; Sadik, O.A. Impedance spectroscopy: A powerful tool for rapid biomolecular screening and cell culture monitoring. Electroanalysis 2005, 17, 2101–2113. [Google Scholar] [CrossRef]
  36. Kim, Y.-H.; Park, J.-S.; Jung, H.-I. An impedimetric biosensor for real-time monitoring of bacterial growth in a microbial fermentor. Sens. Actuators B Chem. 2009, 138, 270–277. [Google Scholar] [CrossRef]
  37. Slouka, C.; Brunauer, G.; Kopp, J.; Strahammer, M.; Fricke, J.; Fleig, J.; Herwig, C. Low-Frequency Electrochemical Impedance Spectroscopy as a Monitoring Tool for Yeast Growth in Industrial Brewing Processes. Chemosensors 2017, 5, 24. [Google Scholar] [CrossRef] [Green Version]
  38. Slouka, C.; Wurm, D.J.; Brunauer, G.; Welzl-Wachter, A.; Spadiut, O.; Fleig, J.; Herwig, C. A Novel Application for Low Frequency Electrochemical Impedance Spectroscopy as an Online Process Monitoring Tool for Viable Cell Concentrations. Sensors 2016, 16, 1900. [Google Scholar] [CrossRef]
  39. Veiter, L.; Herwig, C. The filamentous fungus Penicillium chrysogenum analysed via flow cytometry—A fast and statistically sound insight into morphology and viability. Appl. Microbiol. Biotechnol. 2019, 103, 6725–6735. [Google Scholar] [CrossRef] [Green Version]
  40. De Deken, R. The Crabtree effect: A regulatory system in yeast. Microbiology 1966, 44, 149–156. [Google Scholar] [CrossRef] [Green Version]
  41. Seward, R.; Willetts, J.C.; Dinsdale, M.G.; Lloyd, D. The effects of ethanol, hexan-1-ol, and 2-phenylethanol on cider yeast growth, viability, and energy status; synergistic inhibition. J. Inst. Brew. 1996, 102, 439–443. [Google Scholar] [CrossRef]
  42. Fleig, J. The grain boundary impedance of random microstructures: Numerical simulations and implications for the analysis of experimental data. Solid State Ion. 2002, 150, 181–193. [Google Scholar] [CrossRef]
  43. Christensen, P.; Stryhn, H.; Hansen, C. Discrepancies in the determination of sperm concentration using Bürker-Türk, Thoma and Makler counting chambers. Theriogenology 2005, 63, 992–1003. [Google Scholar] [CrossRef] [PubMed]
  44. Wasserberg, D.; Zhang, X.; Breukers, C.; Connell, B.J.; Baeten, E.; van den Blink, D.; Èlia, S.; Bloem, A.C.; Nijhuis, M.; Wensing, A.M. All-printed cell counting chambers with on-chip sample preparation for point-of-care CD4 counting. Biosens. Bioelectron. 2018, 117, 659–668. [Google Scholar] [CrossRef] [PubMed]
Figure 1. (a) Propagation reactor including sampling port and cooling/sampling device built for measurement; (b) impedance measurement principle including offline measurement probed developed in a recent study [38].
Chemosensors 08 00027 g001
Figure 2. Exemplary raw data for two time points of the lab scale cultivation: (a) Nyquist plot; (b) Bode plot using absolute value of the impedance; (c) fit with ideal capacity model.
Chemosensors 08 00027 g002
Figure 3. (a) Raw capacitance signal fitted using an ideal capacitor in the range from 1000 Hz to 100 mHz throughout the process time. Smoothing was done using polynomic smoothing procedure in OriginLab; (b) process parameters—sugar consumption and ethanol production—compared to smoothed impedance signal.
Chemosensors 08 00027 g003
Figure 4. (a) Capacitance signal subtracted by the signal at t = 0 to compensate for long time drifts of the system fitted to the measured dry cell weight; (b) correlation of CDE to cell number measured by flow cytometry; (c) predicted CDW and cell concentration signals based on the impedance data.
Chemosensors 08 00027 g004
Figure 5. (a) Raw capacitance signal of the samples taken from the propagation reactor at Stiegl brewery; (b) correlation of impedance signal to cell number measured by flow cytometry of the lab scale (blocks) and at the Stiegl site (circles).
Chemosensors 08 00027 g005
Table 1. Process analytics of the lab-scale propagation, including sugar/ethanol data and biomass related quantities (OD600 and cell dry weight [CDW]).
SampleBatch Time [h]Glucose [mmol/L]EtOH [mg/L]OD600 [AU]CDW [g/L]
wort (4 L) 59.4507 0.6
(1 L pure yeast) 0.228,3176.84.74
Batch start047.660691.40
S12.9357.156142.30.82
S25.455.678282.61.06
S37.4849.479682.91.14
S49.4740.681673.01.58
S511.4736.382433.41.2
S613.4231.287153.61.86
S717.4718.792934.33.16
S819.6211.995684.92.76
S921.645.810,1355.32.84
S1023.482.276385.93.2
S1126.210.483236.63.66
S1228.380.191166.94.6
S1331.130.013,4957.75.84
S1434.560.017,0188.66.82
S1541.490.019,75111.78.76
S1644.800.015,59912.19.76
S1747.440.0980614.39.94
S1849.090.0 16.111.02
Table 2. Calculated cell numbers based on calibration in Figure 4b.
Sample No.Time [h]C [F] – Ct=0 [F][cell/mL]
10.42.36E-072.94E+07
218.72.97E-067.36E+07
319.73.58E-068.35E+07
421.33.86E-068.80E+07
524.04.26E-069.45E+07

