Article

Synthesis and Antibacterial Activity of Rhodanine-Based Azo Dyes and Their Use as Spectrophotometric Chemosensor for Fe3+ Ions

1
Department of Chemistry, College of Science, UAE University, P.O. Box 15551, Al-Ain, UAE
2
Department of Nutrition and Dietetics, School of Health Sciences, Istanbul Gelisim University, 34310 Istanbul, Turkey
*
Authors to whom correspondence should be addressed.
Chemosensors 2020, 8(1), 16; https://doi.org/10.3390/chemosensors8010016
Submission received: 15 December 2019 / Revised: 10 February 2020 / Accepted: 21 February 2020 / Published: 25 February 2020

Abstract

:
This research includes the design and synthesis of new derivatives for rhodanine azo compounds (4a–c) containing a naphthalene ring. Physiochemical properties of the synthesized compounds were determined by their melting points, FTIR, 1H-NMR, 13C-NMR, and elemental analysis spectroscopic techniques. The biological activities of the newly prepared azo rhodanine compounds were evaluated against some pathogenic bacteria using three different bacterial species including (Escherichia coli., Pseudomonas aeruginosa, Staphylococcus aureus) and compared with amoxicillin as a reference drug. The results showed that our compounds have moderate-to-good vital activity against the mentioned pathogenic bacteria. The selectivity and sensitivity of the newly prepared rhodanine azo compounds with transition metals Co2+, Cu2+, Zn2+, Ni2+, and Fe3+ were studied using UV–vis and fluorescence spectroscopy techniques. Among the synthesized azos, azo 4c showed affinity toward Fe3+ ions with an association constant of 4.63 × 10⁸ M−1. Furthermore, this azo showed high sensitivity toward Fe3+ ions with detection limits of 5.14 µM. The molar ratio and Benesi–Hildebrand methods confirmed the formation of complexes between azo 4c and Fe3+ with 1:2 binding stoichiometry. Therefore, azo 4c showed excellent potential for developing efficient Fe3+ chemosensors.

1. Introduction

Chemosensors have received considerable attention due to their recognition of heavy-metal ions and importance in several disciplines such as clinics, biochemistry, and environment [1]. Therefore, the development of efficient sensors for the detection of metal ions is one of the most active research areas in the chemical sciences because of their simplicity, low cost, local observation, sensitive ion-induced spectroscopic changes, and real-time examination of the metal-ion content [2,3,4].
Azo dyes are a wide class of synthetic organic dyes and have been widely used in dye chemistry [5]. Numerous heterocyclic azo dyes have been used in the textile industry and medicinal applications such as photodynamic therapy, antiviral, antifungal, and antioxidant properties [6,7]. Rhodanine derivatives, a class of heterocyclic compounds, are used in colorimetric sensors, fluorescent dyes, and pharmacological studies [8]. Rhodanine-based azo compounds can interact quite easily with metal ions through the heteroatoms (S, N, and O) present in their structures. These compounds can chelate with a large number of metal ions, as they form a stable six-membered ring after complexation with a metal ion.
Iron ions are one of the most essential trace elements in the human body. The participation of these ions is very important for many physiological processes including oxygen transportation, oxygen metabolism, transcriptional regulation, and electron transfer [9]. Detecting Fe3+ is of great importance, therefore, great efforts have been devoted to developing sensors for the detection of Fe3+ with sensitivity and selectivity. However, most of the reported Fe3+ probes have several limits such as poor selectivity to Fe3+ and only a few probes have been applied in biological systems [10]. Several methods have been developed to detect Fe3+, including atomic absorption spectroscopy [11], colorimetric analysis [12,13], mass spectrometry [14], electrochemical analysis [15], and fluorescence spectroscopic analysis [16]. In the present paper, we report the synthesis of 5-naphthylazorhodanine derivatives with the potential to act as selective chemosensors for one of the following metal ions; Co2+, Cu2+, Zn2+, Ni2+, and Fe3+ using UV/vis and fluorescence spectroscopic techniques. The synthesized rhodanine azo compounds were also screened for their antibacterial activity.

2. Material and Methods

2.1. Chemistry

All chemicals, reagents, and solvents were obtained from Sigma-Aldrich and utilized without further purification. The reactions’ progress was monitored using thin-layer chromatography (TLC) on silica gel glass plates (Silica gel, 60 F254, Fluka), and a UV lamp was used to visualize the spots. The products were purified using column chromatography on silica gel S (0.063–0.1 mm). A Gallenkamp apparatus was used to measure the melting points and recorded without correction. Infrared spectra were recorded on Thermo Nicolet model 470 FT-IR spectrophotometer using KBr pellets between 4000 and 500 cm−1. 1H and 13C-NMR spectra were recorded in DMSO-d6 and CDCl3 solutions and tetramethylsilane (TMS) as an internal reference using 400 MHz Varian instruments. A Leco Model CHN-600 elemental analyzer was used to conduct the elemental analysis. UV–vis absorption spectra were obtained using a Cary 50 UV–vis spectrophotometer supported by 1.0 cm quartz cells (Varian, Austria). Fluorescence measurements were conducted inside quartz cells using a Cary Eclipse model-3 spectrofluorometer equipped with a high-intensity xenon flash lamp and 1.0 cm path length (Varian, Austria).

2.2. Synthesis of Rhodanine Azos 4a–c

2.2.1. General Procedure

Twenty-five milliliters of aqueous hydrochloric acid solution (12 M, 32.19 mmol) was added to 2-aminonapthalene (1) (5 mmol). Sodium nitrite solution (5.1 mmol, in 10 mL of water) was added dropwise over 10 min to the cooled (0 °C) and stirred mixture. The formed diazonium chloride (2) was maintained at 0–5 °C, then a 25 mL ethanolic solution of 2-thioxo-4-thiazolidinone (3) (5 mmol) containing sodium acetate (5 mmol) was added dropwise over 20 min. The produced slurry mixture was allowed to stir for 2 h at 5 °C then it was left to stand overnight. The resulted dark red precipitate was filtered by washing with water several times. The crude azo dye was recrystallized from hot ethanol giving (4) in a good yield.

2.2.2. (E)-3-Amino-5-(Naphthalen-2-Yldiazenyl)-2-Thioxothiazolidin-4-One (4a)

Dark red; yield 81%; mp 245 °C; Rf 0.50; IR(KBr, cm−1): 3435 (NH2), 3026 (C–H aromatic), 1700 (C=O), 1629 (C=C), 1468 (N=N), 1246 (C=S); 1H-NMR [DMSO-d6, 400 MHz]: 3.35 (s, 1H, CH), 5.90 (brs, 2H, NH2, exchanges with D2O), 7.37–7.93 (m, 7H, aromatic-H); 13C-NMR [DMSO-d6, 100 MHz]: 110.3 (C5-rhodanine), 116.1 (C3-naphthalene), 121.9 (C1-naphthalene), 124.9 (C7-naphthalene), 127.4 (C6-naphthalene), 127.6 (C4- naphthalene), 128.2 (C8-naphthalene), 129.9 (C5-naphthalene), 130.3 (C4a-naphthalene), 134.1 (C8a-naphthalene), 141.0 (C2-naphthalene), 159.6 (C=O), 184.9 (C=S); Anal. Calcd. for C13H10N4OS2: C, 51.64; H, 3.33; N, 18.53; O, 5.29; S, 21.21; Found: C, 52.04; H, 3.63; N, 18.73; S, 21.51.

2.2.3. (E)-2-(5-(Naphthalen-2-Yldiazenyl)-4-Oxo-2-Thioxothiazolidin-3-Yl)Acetic Acid (4b)

Dark brown; yield 89%; mp 130 °C; Rf 0.30; IR(KBr, cm−1): 3427 (OH, COOH), 3060 (C–H aromatic), 2925 (C–H aliphatic), 1720 (C=O), 1630 (C=C), 1403 (N=N), 1287 (C=S); 1H-NMR [DMSO-d6, 400 MHz]: 3.41 (brs, 1H, CH), 4.74 (s, 2H, CH2), 7.36–8.79 (m, 7H, aromatic-H), 11.69 (brs, 1H, OH, exchanges with D2O); 13C-NMR [DMSO-d6,100 MHz]: δ, ppm) 45.3 (CH2), 110.5 (C5-rhodanine), 116.2 (C3-naphthalene), 122.3 (C1-naphthalene), 125.0 (C7-naphthalene), 126.4 (C6-naphthalene), 127.6 (C4-naphthalene), 130.3 (C8-naphthalene), 134.0 (C5-naphthalene), 141.0 (C4a-naphthalene), 142.9 (C8a-naphthalene), 145.3 (C2-naphthalene), 162.1 (C=O, COOH), 167.8 (C=O), 191.1 (C=S); Anal. Calcd. for C15H11N3O3S2: C, 52.16; H, 3.21; N, 12.17; O, 13.90; S, 18.56; Found: C, 52.56; H, 3.51; N, 12.47; S, 18.75.

2.2.4. 5-(Naphthalen-2-Yldiazenyl)-2-Thioxothiazolidin-4-One (4c)

Dark red powder; yield 84%; mp 106 °C; Rf 0.53; IR (KBr, cm−1): 3430 (NH), 3063 (C–H aromatic), 2811 (C–H aliphatic), 1704 (C=O), 1629 (C=C), 1487 (N=N), 1253, 1171 (C=S); 1H-NMR [DMSO-d6, 400 MHz]: (δ, ppm) 3.76 (brs, 1H, CH), 7.35–8.90 (m, 7H, ArH), 11.38 (brs, 1H, NH, exchanges with D2O); 13C-NMR [DMSO-d6, 100 MHz]: (δ, ppm) 109.9 (C5-rhodanine), 116.2 (C3-naphthalene), 122.9 (C1-naphthalene), 125.0 (C7-naphthalene), 126.6 (C6-naphthalene), 129.9 (C4-naphthalene), 130.3 (C8-naphthalene), 134.1 (C5-naphthalene), 141.2 (C4a-naphthalene), 142.9 (C8a-naphthalene), 145.7 (C2-naphthalene), 165.3 (C=O), 206.5 (C=S); Anal. Calcd. for C13H9N3OS2: C, 54.34; H, 3.16; N, 14.62; O, 5.57; S, 22.31; Found: C, 54.74; H, 3.18; N, 14.90; S, 22.52.

2.3. Selectivity Studies for Metal Ions Using UV–Vis Spectroscopy

Stock solutions of the metal perchlorates (1.5 × 10⁻³ M) and rhodanine based azo dyes 4a–c (5.0 × 10⁻⁴ M) were prepared in DMF. The selectivity of azos 4a–c was studied with various metal ions (including Co2+, Cu2+, Zn2+, Ni2+, and Fe3+) using UV–vis spectroscopy. Spectra of azos 4a–c (2.50 × 10⁻⁵ M, 3000 µL) were recorded in the absence and the presence of four equivalents of metal-ion perchlorate (200 µL, 1.50 × 10⁻³ M). The solutions were shaken and then incubated for 3 min before scanning at room temperature. UV–vis absorption spectra of the solutions were recorded against DMF. Azo 3 showed selectivity toward Fe3+, therefore, the following experiments were conducted on azo 3 and iron (III) ions.

2.4. UV/Vis and Fluorescence Titration

The interaction between azo 4c and Fe3+ was studied using UV/Vis and fluorescence spectrometry in DMF. Azo 4c (2.50 × 10⁻⁵ M, 3000 µL) in DMF was titrated with iron (III) perchlorate (1.50 × 10⁻³ M) using UV/vis spectrophotometer and a 1 cm path-length cuvette. After each addition, the solution was shaken and then incubated for 3 min before scanning at room temperature. UV–vis absorption spectra of the solutions were recorded against DMF. Furthermore, the interaction between azo 4c and the Fe3+ was studied using fluorescence spectroscopy. Azo 4c (2.50 × 10⁻⁵ M, 3000 µL) was titrated with successive amounts of iron (III) perchlorate (1.50 × 10⁻³ M) at the same conditions.

2.5. Binding Stoichiometry Determination

The molar ratio method [17] was used in order to determine the binding stoichiometry of azo 4c with Fe3+. Azo 4c (2.50 × 10⁻⁵ M, 3000 µL) in DMF was titrated with iron (III) perchlorate (1.50 × 10⁻³ M) using UV/vis spectrophotometer and a 1 cm path-length cuvette. After each addition, the solution was shaken and then incubated for 3 min before scanning at room temperature. The relation between [Fe3+]/[azo 4c] against the obtained absorbance of azo 4c at 396 nm was generated.

2.6. Association Constant Determination

The association constant, Ka, for azo 4c with Fe3+ was calculated using the Benesi–Hildebrand equation [18]. Azo 4c (2.50 × 10⁻⁵ M, 3000 µL) in DMF was titrated with iron (III) perchlorate (1.50 × 10⁻³ M) using UV/vis spectrometry. The solution was shaken then incubated for 3 min before scanning at room temperature. Ka was calculated using Equation (1):
1 A A o = 1 { K a ( A m a x A o ) [ F e 3 + ] 2 } + 1 ( A m a x A o ) ,
where Ao is the absorbance of the receptor (azo 4c) in the absence of the guest (Fe3+), A is the absorbance of azo 4c after subsequent additions of the guest (Fe3+), Amax is absorbance of azo 4c in the presence of [Fe3+]max, and Ka is the association constant (M−1). By plotting 1/[Fe3+]2 against 1/(A − Ao), Ka could be determined from the slope of the resulting linear plot.

2.7. Detection Limit (LOD) Determination

The detection limit of azo 4c for Fe3+ was calculated based on IUPAC 3σ criteria using UV/vis spectrophotometer with a 1 cm path-length cuvette. A blank solution of azo 4c (2.50 × 10⁻⁵ M, 3000 µL) in DMF was scanned for at least five times to determine the standard deviation of the blank. The same solution was then titrated with iron (III) perchlorate (1.50 × 10⁻³ M). After each addition, the solution was shaken and then incubated for 3 min before scanning at room temperature.
A linear calibration curve was established by plotting the absorbance against the concentration of Fe3+ ions. The LOD was calculated using Equations (2) and (3):
LOD = 3σ,
σ = SD/s,
where SD is the standard deviation of the blank azo 4c solution and s is the slope of the calibration curve.

2.8. Antibacterial Activity

The antibacterial activity of 4a–c was investigated using the antibacterial agar well diffusion assay [19]. Mueller–Hinton agar was prepared by mixing 38.0 g of the agar with 1000 mL of distilled water, then autoclaved. The agar was distributed into the petri dishes and left to solidify at room temperature. The bacterial strains (106 cells/mL) were spread on the agar using pipettes and hockey sticks. Fifty microliters of the examined azo dyes were added separately into the wells and then incubated at 37 °C for 24–48 h. The diameter of the inhibition zone (mm) was measured using a transparent scale in order to determine the bacterial inhibition. The results were compared with the antibiotic amoxicillin (5.0 mg/mL) as a positive control at 50 μL/well.

2.8.1. Test Microorganisms

The activities of azos 4a–c were studied against Bacillus pumilus (NCIM 2189), Escherichia coli (NCIM 2343), Pseudomonas aeruginosa (NCIM 2863), and Staphylococcus aureus (NCIM 2127). The bacterial strains were obtained from the Institute of Microbial Technology, Chandigarh. The bacterial cultures were maintained on nutrient agar slants and stocked as glycerol stocks at −20 °C.

2.8.2. Minimum Inhibitory Concentration (MIC)

The minimum inhibitory concentrations (MIC) of azos 4a–c were investigated based on the reported protocol by Sarker et al. [20]. A sterile 96-well U-shaped microtiter plate was used to determine the MIC. Double strength Luria Bertani (LB) broth (100 μL) was added into each well of the plate. One hundred microliters of stock solutions of azos 4a–c were added separately into the first well of each row and mixed thoroughly. Serial dilutions were made for these solutions in the wells using nutrient broth. One OD600 (absorbance of a sample measured at a wavelength of 600 nm) of bacterial suspensions was prepared in Luria Bertani broth, then 10 μL of such suspensions was added to each well and then incubated at 37 °C for 18 h. Resazurin was used to estimate the viable organisms, which convert its color from blue into pink color. MIC is the lowest concentration of the compound that inhibits the growth of the organisms.

3. Results and Discussion
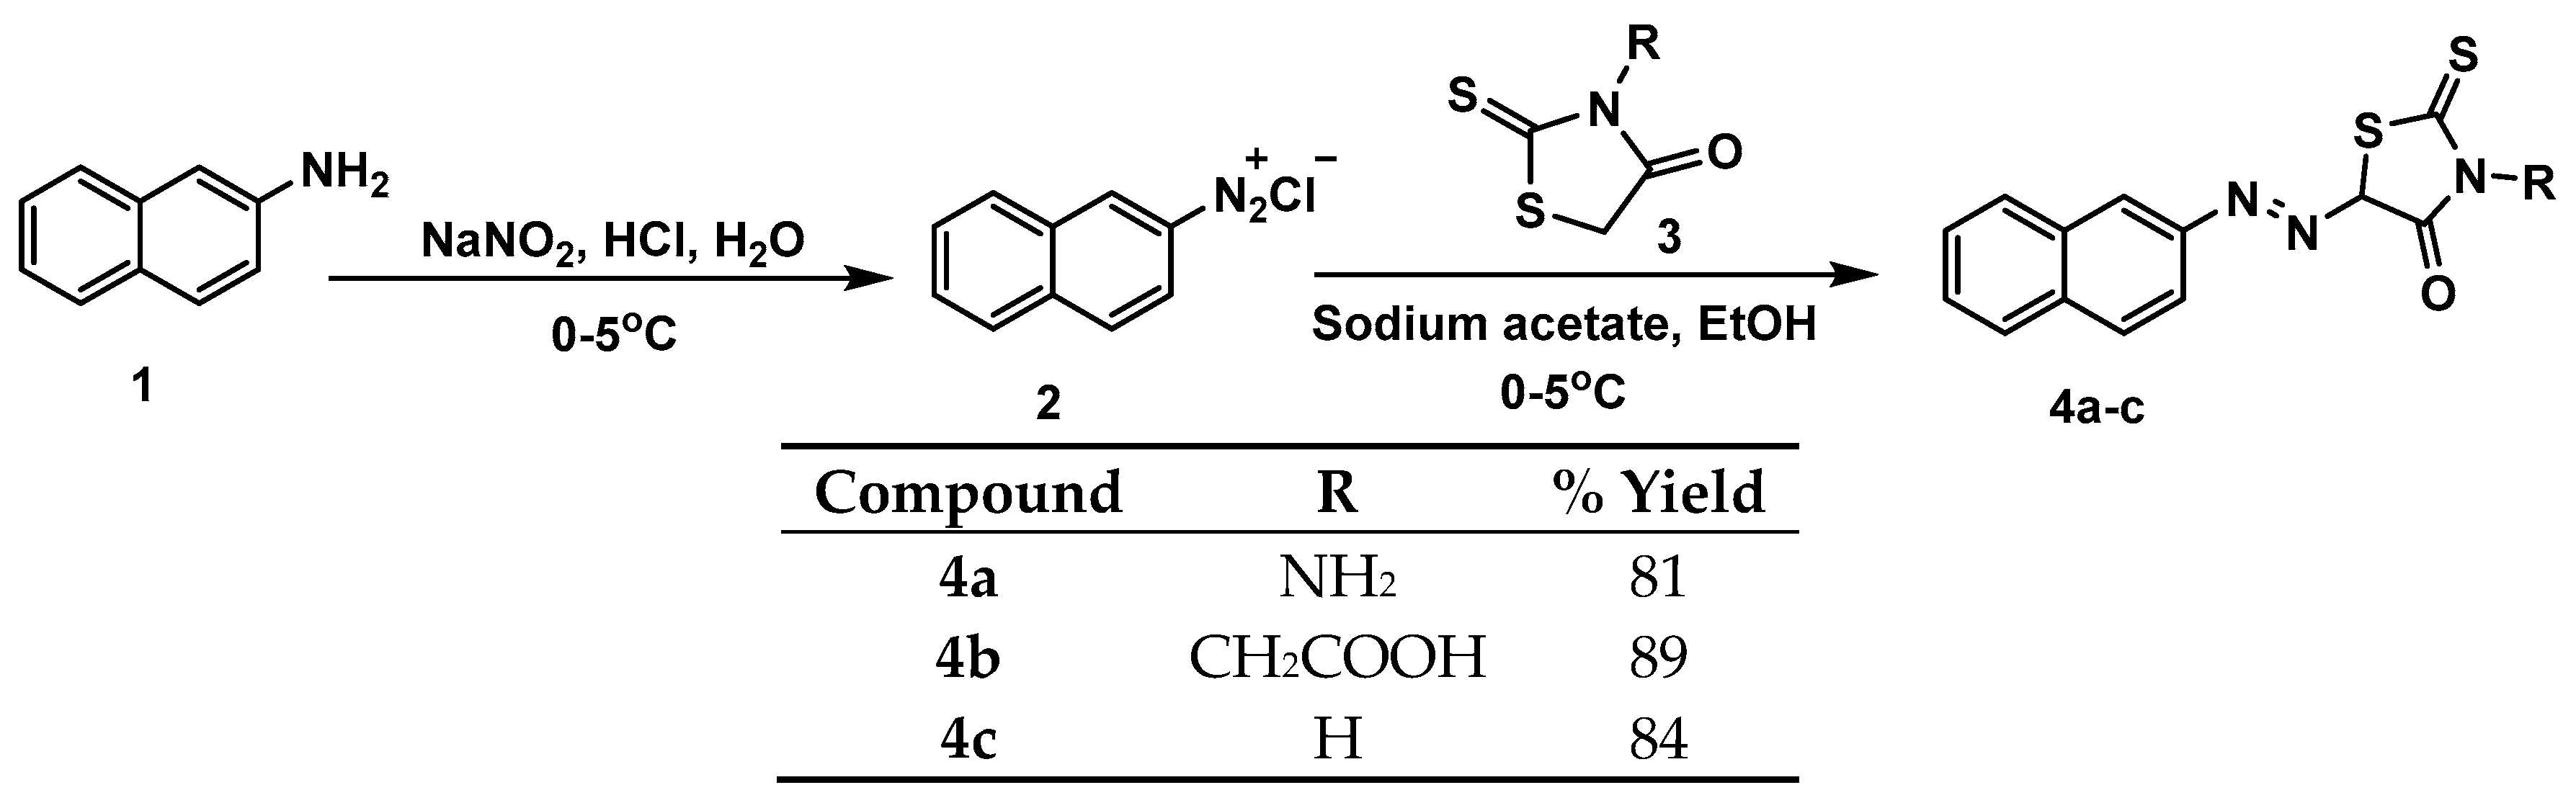
3.1. Synthesis

This research includes the design of new derivatives for naphthalene azo compounds bearing a rhodanine ring with different N-substituents (–NH2, –CH2COOH, and –H) (Figure 1). Diazonium salt of 2-aminonapthalene was prepared by reaction of 2-aminonapthalene with sodium nitrite in the presence of hydrochloric acid. Then this compound was used to prepare the azo derivatives in the presence of sodium acetate. Rhodanine based azo dyes 4a–c were obtained with a good yield percentage (81%–89%) according to Scheme 1.
All of the newly synthesized compounds 4a–c were characterized by IR, 1H NMR, 13C NMR, and elemental analysis. Spectroscopic data were in full agreement with the expected results. Compound 4b has a dark brown color with a melting point of 130 °C. In the IR spectra of compound 4b, peaks were seen around 1720 cm−1 attributable to the corresponding C=O bond and 1287 cm−1 attributable to C=S bond stretching. In addition, the appearance of a new band around the 1403 cm−1 region attributed to azo N=N bond stretching in the IR spectra of the compounds 4b confirmed the completion of the reactions. 1H-NMR spectra for compounds 4b showed that the signal appeared at δ = 11.69 ppm, which exchanged with D2O assigned for the hydroxy group. The broad singlet appeared at δ = 3.41 ppm corresponding to the H5-rhodanine and integrated into one proton. A multiple signal resonated at δ = 7.36 − 8.79 ppm and, integrated into 7 protons, was assigned to naphthalene protons. The 13C-NMR showed that the rhodanine C5 resonated at δ = 110.5 ppm. While, the two carbonyl groups appeared at δ = 167.8 and δ = 162.1 ppm and the (C=S) resonated at δ = 191.1 ppm. The elemental analysis for compound 4b was in agreement with the calculated values as follow: C, 52.56; H, 3.51; N, 12.47; S, 18.75.

3.2. Spectroscopic Analysis

3.2.1. Response Time of Azos 4a–c for Metal Ions

The sensitivity of azos 4a–c toward the examined metal ions was evaluated by determining the response time of these compounds toward metal ions in solution. A complex of azos 4a–c (2.5 × 10⁻⁵ M) and four equivalents of each metal ion in DMF was prepared separately and the change in the absorbance intensity of azos 4a–c was recorded over time. Furthermore, the response time of azo 4c toward iron (III) ion was estimated using fluorescence spectrometry at the same conditions. The absorbance intensities of azos 4a–c and the fluorescence intensity of azo 4c were changed rapidly after adding the metal ion and stabilized after 3 min. The obtained results indicated that azos are sensitive for the examined metal ions therefore, a 3 min incubation time was used in the subsequent experiments to ensure sufficient time for the interaction between the azos and the metal ions.

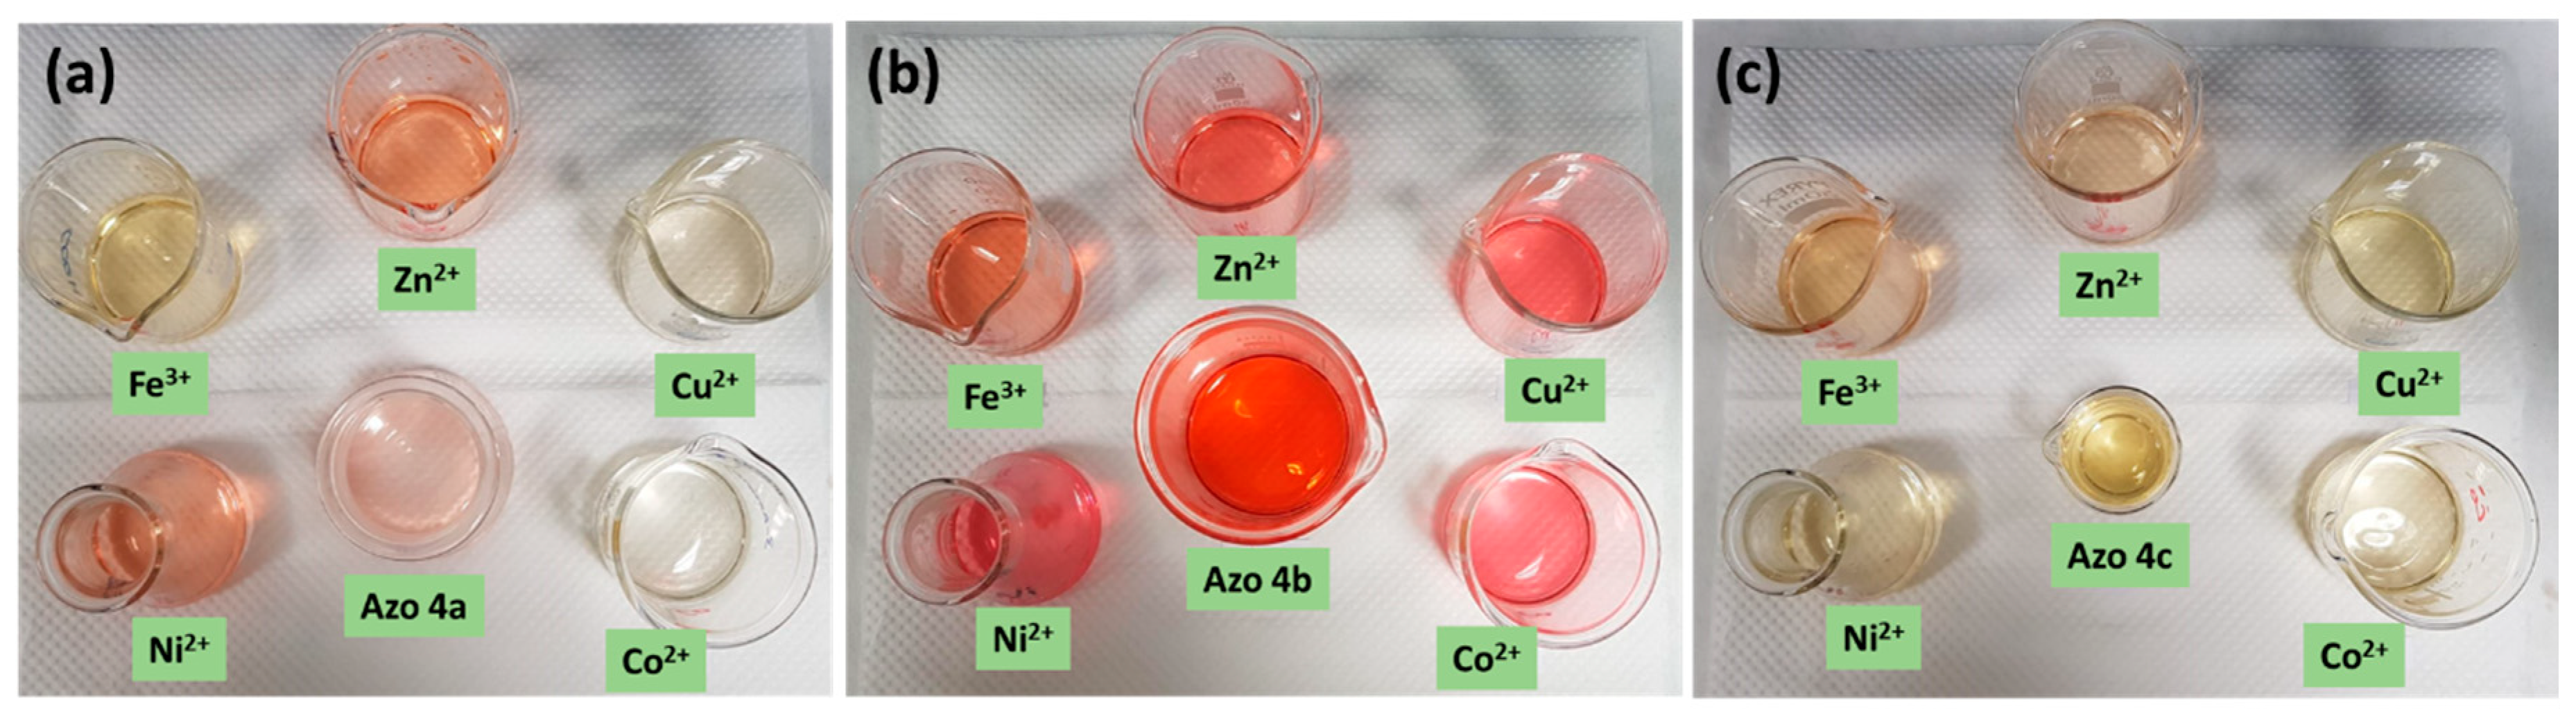
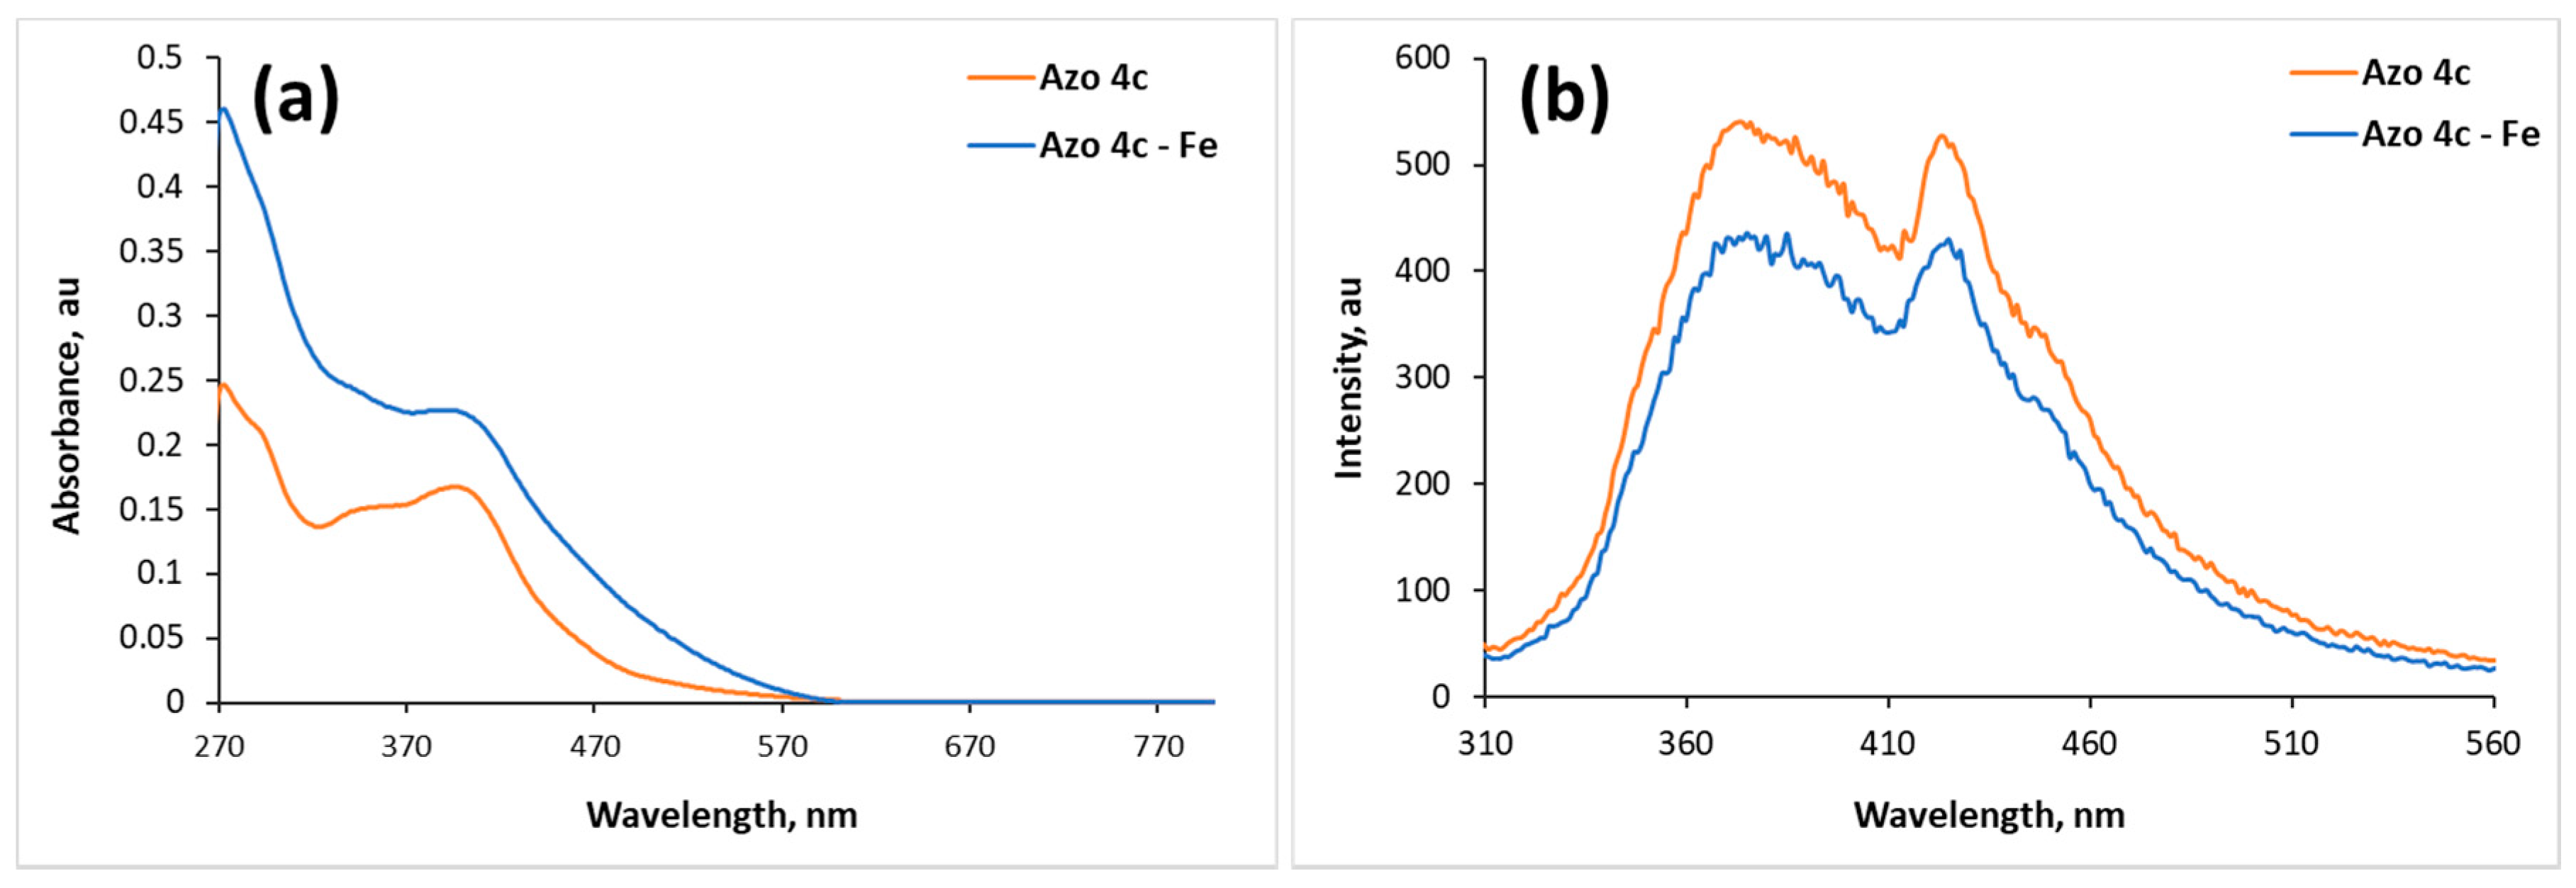
3.2.2. Colorimetric Sensing and UV/Vis Studies

The interactions between azos 4a–c and a variety of metal ions (Co2+, Cu2+, Zn2+, Ni2+, and Fe3+) as their perchlorate salt in DMF was studied using colorimetric and UV–vis spectroscopy. Azos 4a–c (2.5 × 10⁻⁵ M) were mixed separately with four equivalents of each metal ion in DMF. The solutions were mixed thoroughly and left to stand for 15 min, then the color change was recorded. When metal ions were added to azo 4a solution, its color changed from light pink into more intensive color in the case of Zn2+and Ni2+ and into yellow color in the case of Co2+, Cu2+, and Fe3+ as shown in Figure 2a (S10, Supplementary File). The color change indicated that azo 4a is sensitive for all metal ions. In the case of azo 4b solution, its color slightly changed from red into reddish brown/pink color upon addition of metal ions, as shown in Figure 2b (S11, Supplementary File), indicating that azo 4b is sensitive for all metal ions as well. Figure 2c (S12, Supplementary File) shows that addition of Co2+, Cu2+, and Ni2+ did not induce any apparent color change of the yellow color of azo 4c. Addition of Zn2+ caused a slight color change of azo 4c (light brown), while addition of Fe3+ induced a reasonable color change (brown). These results indicated that azo 4c can serve as a potential candidate for a colorimetric chemosensor of Fe3+.
The total color change (ΔE) between azo–metal complexes and the azo dyes (control) was calculated by following equation [21]:
Δ E a b = ( L * L o * ) 2 + ( a * a o * ) 2 + ( b * b o * ) 2
where L* and Lo* are the lightness of azo and its metal complex, respectively; a* and ao* are redness of azo and its metal complex, respectively; b* and bo* are yellowness of azo and its metal complex, respectively.
The total color change ΔE is the distance or the difference between two colors and it is a metric understanding how the human eye perceives color difference. Color change ΔE values more than 3 indicate that the color change is visually perceivable by the human eye [22]. All samples exhibited a color difference value of more than 10.0 as shown in the S13 (Supplementary File), indicating that the color of these samples is noticeably discernable.
Furthermore, to achieve in-depth analysis of the selectivity of azos 4a–c for metal ions, the change in UV–vis spectra of azos 4a–c (2.5 × 10⁻⁵ M) was investigated upon the addition of four equivalents of the investigated metal ions. Upon the addition of four equivalents of metal ions (Figure 3a), the absorbance of the main band of azo 4a at 498 nm increased with a small blue shift to 493 nm in the case of Zn2+ and 495 nm in the case of Ni2+. This band completely disappeared in the case of Cu2+ and Co2+ and a shoulder was formed in the case of Fe3+. These results are consistent with the results obtained from the colorimetric investigations indicating that azo 4a is sensitive to all metal ions. Addition of Co2+ and Ni2+ to azo 4b induced a small blue shift from 507 to 503 and 504 nm, respectively, without a change in the band shape as shown in Figure 3b. A strong decrease in the absorbance of azo 4b occurred after the addition of Fe3+ with a small blue shift into 503 nm and a new band was formed at 435 nm indicating that a new complex was formed. Similarly, Zn2+ and Cu2+ induced a small blue shift into 500 and 503 nm, respectively, and a new shoulder was formed at 435 nm indicating the formation of a new compound. These results showed that azo 4b is sensitive to all ions; therefore, azo 4a and azo 4b could not be used as a selective probe for any of the investigated metal ions. Unlike azo 4a and azo 4b, metal ions except Fe3+ did not show significant changes in the absorbance intensity, band shift, or band shape of azo 4c bands. These results indicated that the investigated ions did not show considerable interaction with azo 4c. Addition of four equivalents of Fe3+ caused an increase of the absorbance of azo 4c bands without any shift in the peak position, as shown in Figure 3c. These results in addition to the significant color change of azo 4c upon addition of Fe3+ indicated that the presence of other cations does not interfere significantly with the binding of azo 4c toward Fe3+ ions in comparison to azos 4a and 4b.
The interaction between azos 4a–c and metal ions is explained using the interaction between azo 4c and Fe3+ in DMF as an example. UV/vis spectrum of azo 4c showed main absorbance band at 403 nm with molar absorptivity 9360 M−1 cm−1 which may be attributed to the π–π* transition as shown in Figure 4a. The other transition, n–π*, could not be significantly identified. In general, azobenzene shows two bands: the high intense band appears at ca 350 nm and is attributed to π–π* transition while the other band, attributed to n–π* transition, has low intensity (appears at 440 nm) and is not easy to perceive [23]. When azo 4c was mixed with four equivalents of Fe3+, an increase of the absorbance of the main band was observed without shift in the peak position and without a change of the peak shape as shown in Figure 4a indicating the direct interaction between Fe3+ and azo 4c without affecting its structure.
In addition, the interaction between azo 4c and Fe3+ was studied using fluorescence spectrometry. The emission spectrum of azo 4c showed two significant bands at 374 and 423 nm when excited at 395 nm. Fluorescence intensity of azo 4c was quenched upon addition of Fe3+ without shift in its peak position as shown in Figure 4b. Ions with a paramagnetic nature such as Fe3+ have the ability to quench the fluorescence intensity of a fluorophore through photoinduced metal-to-fluorophore electron transfer or electronic energy transfer mechanisms [24,25]. It is reported that Fe3+ ion is a well-known efficient fluorescence quencher because of its paramagnetic properties via electron or energy transfer [26]. Iron (III) has been proved to preferentially bind with the nitrogen atom of imino group and oxygen atom of carbonyl group [16,27]. Therefore, we think that Fe3+ could accept electrons from the nitrogen atom of imino group and oxygen atom of carbonyl group in azo 4c molecule, since Fe3+ is six-coordinated and it has unoccupied sites which might be occupied by other azo molecules. Consequently, intra-particle cross-links are induced by the produced coordination interactions causing a quenching in the fluorescence intensity [28] as shown in Figure 5.

3.2.3. Binding Stoichiometry

The complexation ratio of azo 4c with Fe3+ was investigated using the molar ratio method. Azo 4c was titrated with Fe3+ in DMF using UV–vis spectrometry. A plot of [Fe3+]/[azo 4c] versus the absorbance of azo 4c at 398 nm was generated. The stoichiometric ratio between azo 4c and Fe3+ was found to be 1:2 as shown in Figure 6 (S14, Supplementary File) indicating that the formed complex has an M2L structure. These results are reasonable because azo 4c has two binding sites.

3.2.4. Association Constant

To get further insight into the bindings between azo 4c and Fe3+, the binding affinity of Fe3+ toward azo 4c was investigated using the Benesi–Hildebrand equation based on a 1:2 stoichiometric ratio (Equation (1)). Figure 7 shows a good linearity with correlation coefficient of R2 = 0.9896 and linear regression equation of y = 3 × 10⁻⁸x + 13.206 for azo 4c. The linearity of the obtained plot indicated that stoichiometry for azo 4c with Fe3+ was 1:2. These results are consistent with the results observed using the molar ratio method [29]. The calculations showed high association constant of azo 4c to Fe3+ as 4.63 × 10⁸ M−1 indicated that Fe3+ showed high binding affinity toward azo 4c comparable with reported receptors that show high selectivity toward Fe3+ [30,31]. For instance, rhodamine B with thiocarbonyl moieties showed a binding constant of 2.75 × 10⁴ M−1 [32], another rhodamine B derivative showed 1.52 × 10⁴ M−1 [33]. Furthermore, azo-Schiff base receptors containing azo and azomethine groups showed 7.72 × 10⁴ – 1.21 × 10⁵ M−1 [33].

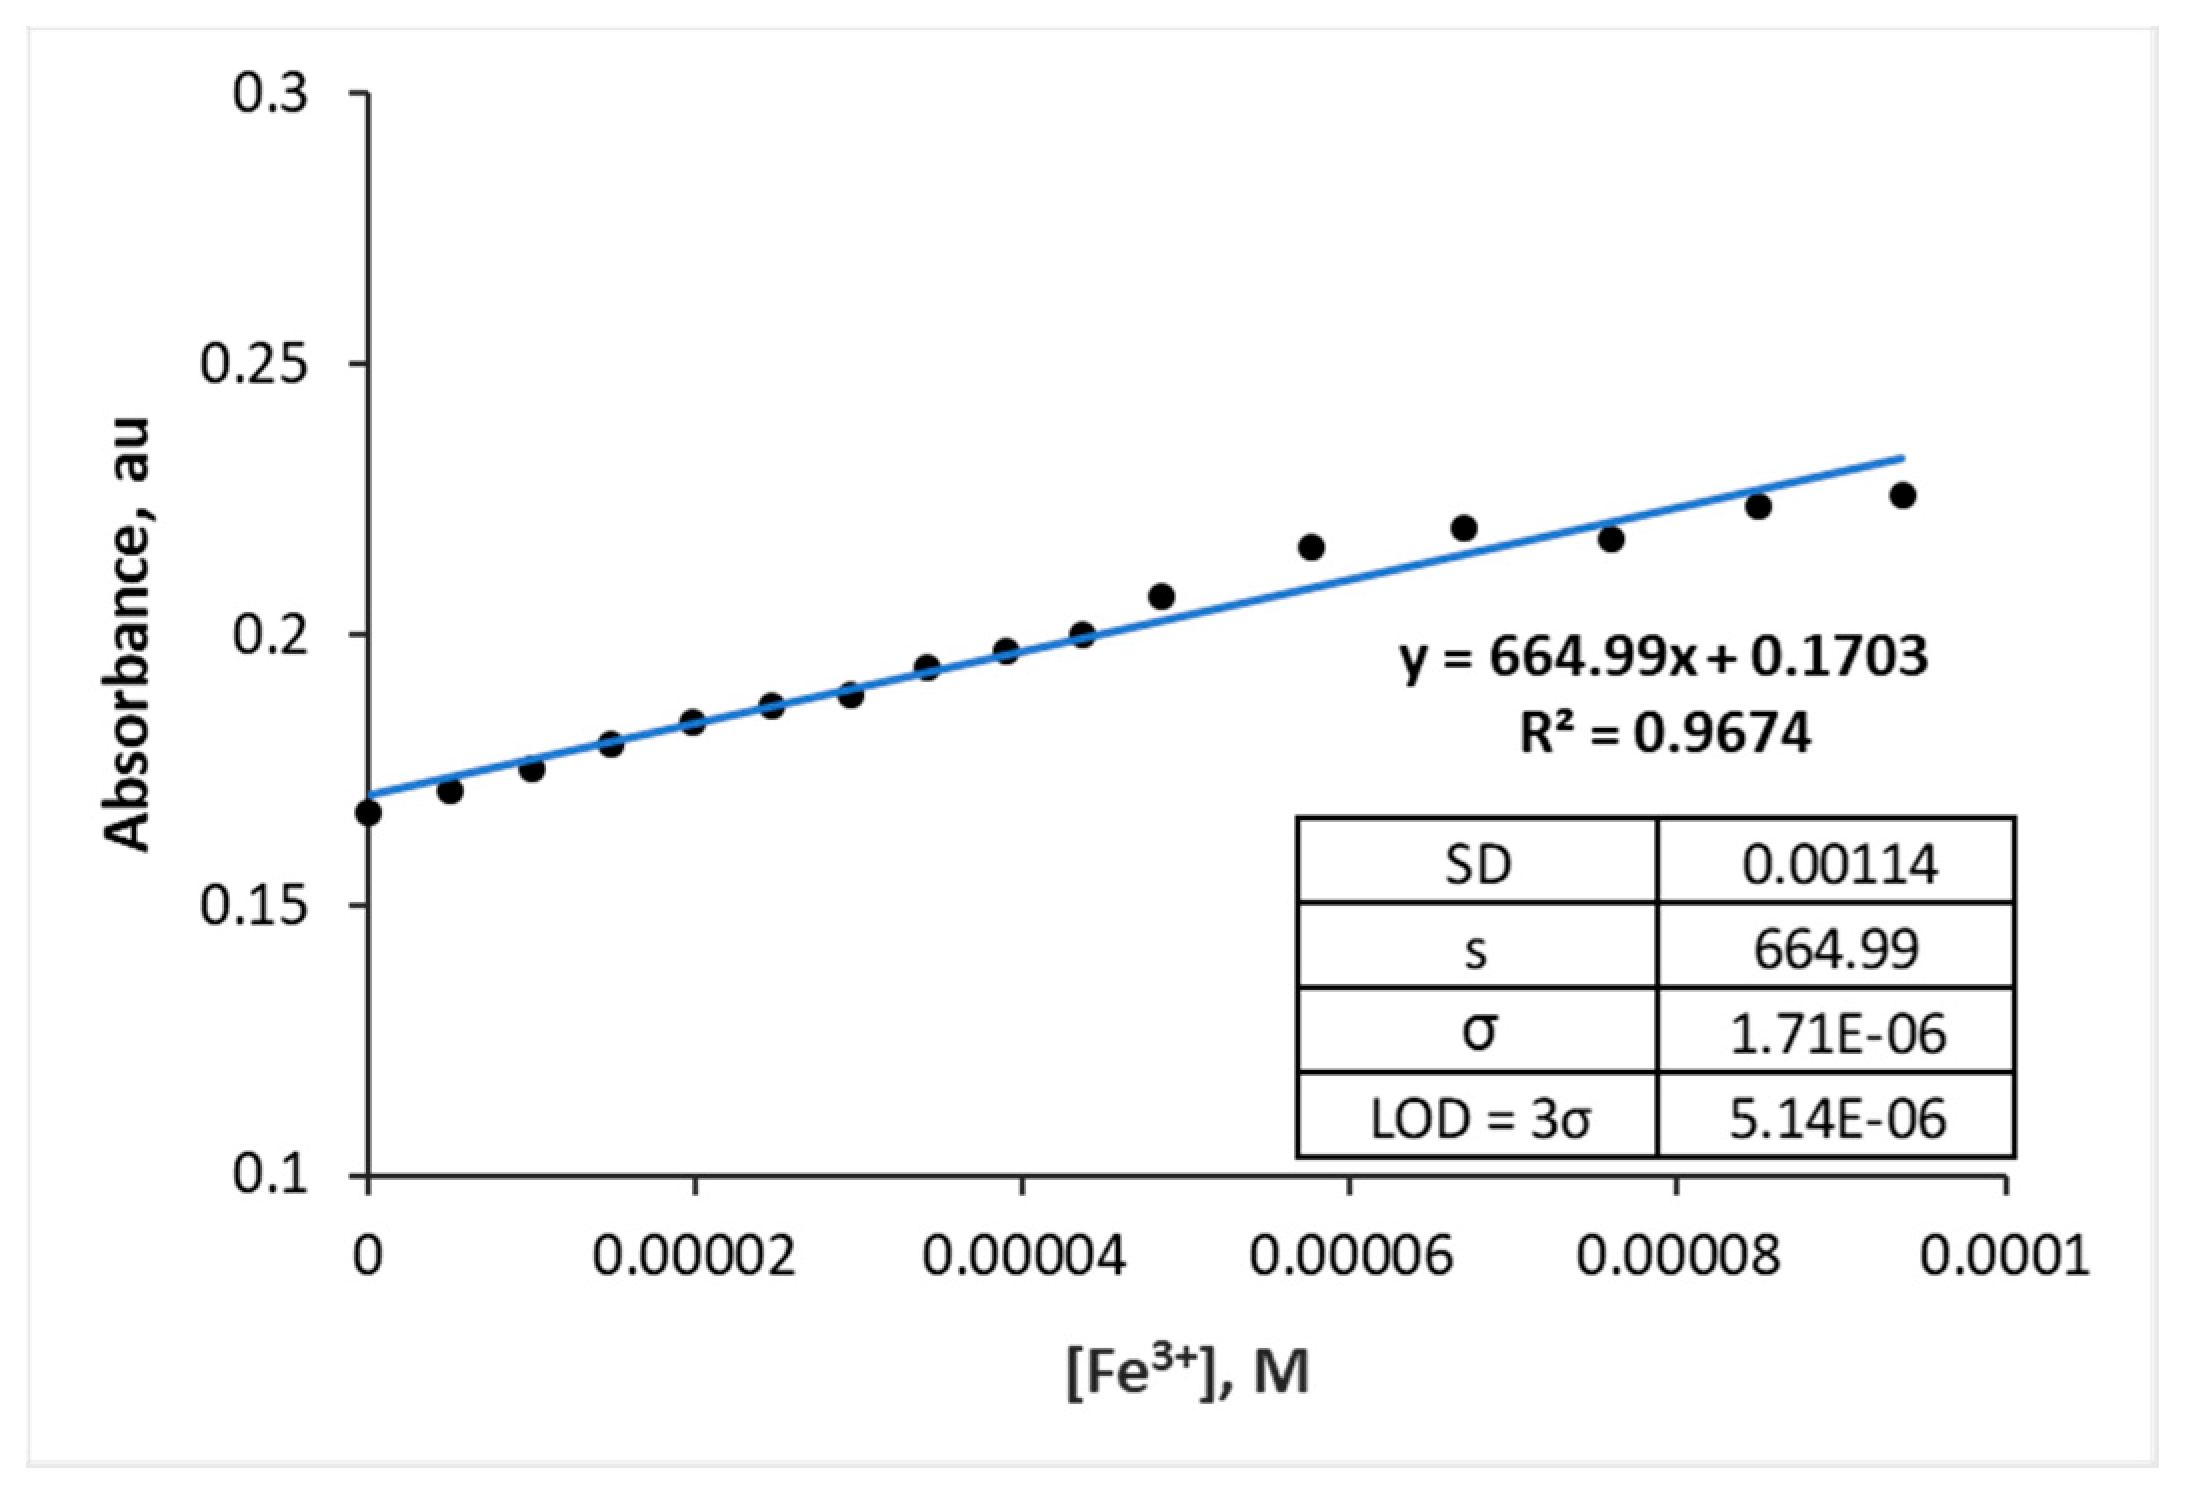
3.2.5. Detection Limit

The detection limit (LOD) of azo 4c for Fe3+ was calculated using Equations (2) and (3) based on UV/vis calibration curve. The LOD of azo 4c for Fe3+ was found to be 5.14 µM as shown in Figure 8, indicating that azo 4c showed significant sensitivity for Fe3+. Our azo probe showed an acceptable value in comparison with some of the previous reports on the Fe3+ chemosensors in terms of their LOD values. For instance, 1,10-phenanthroline complexes showed an LOD of 1.61 × 10⁻⁵ M [34], while azo-Schiff base receptors containing azo and azomethine groups showed an LOD of 6.44 × 10⁻⁶ M [31].

3.3. Biological Studies

Antimicrobial Activity

Biological activities of the compounds containing rhodanine azos 4a–c have stimulated great interest to explore the synthesis of new and potentially useful compounds. The antibacterial activities of rhodanine azos 4a–c were evaluated in vitro against one gram-positive bacterial strain namely, S. aureus (NCIM 2127); and two gram-negative bacterial strains namely, E. coli (NCIM 2343) and P. aeruginosa (NCIM 2863) using the well diffusion method. The results were compared with amoxicillin as a reference standard. The results of the obtained derivatives 4a–c are summarized in Table 1. Compounds 4a–c showed a good activity against both gram-positive and gram-negative bacteria compared with amoxicillin. The in vitro antibacterial screening of compounds 4a–c against E. coli showed that compound 4c (MIC = 0.625 μg/mL) exhibited a good antibacterial activity compared with the standard compound (amoxicillin’s MIC = 0.1 μg/mL) whereas compounds 4a and 4b showed an MIC value of 2.5 and 1.25 μg/mL respectively. Compounds 4a and 4b were found to inhibit P. aeruginosa at MIC values of 2.5 μg/mL. The remaining compound 4c showed no activity against P. aeruginosa. In addition, all compounds 4a–c exhibited good antimicrobial activities against gram-positive bacteria S. aureus strain with an MIC ranging between 1.25 and 2.5 μg/mL, where the reference compound (amoxicillin) showed no activity. Therefore, by evaluating the obtained biological results for the novel azo rhodanine analogues, 4a–c showed a good antibacterial activity against both gram-positive and gram-negative bacteria (Table 1). The structure–activity relationship (SAR) studies of our compounds revealed that the compounds with an acetyl group at the N-rhodanine ring contributed to a better antibacterial activity than those with amino or free N-rhodanine.

4. Conclusions

In summary, we have reported the synthesis of three rhodanine azo compounds. On the basis of the obtained results from the antibacterial test, compounds 4b showed a moderate growth-inhibitory effect against all tested bacteria. Among the compounds, 4c exhibited the most antibacterial activity against E. coli. UV/vis and fluorescence analyses confirmed the interaction between azos 4a–c and metal ions. However, azo 4c showed high selectivity and sensitivity for Fe3+ with a binding constant of 4.63 × 10⁸ M−1 and an LOD of 5.14 µM and with 1:2 stoichiometry. We believe that these results are sufficiently promising to conduct further studies into the development of rhodanine-based azo dye chemosensors for Fe3+ in various environmental and biological systems.

Supplementary Materials

The following are available online at https://www.mdpi.com/2227-9040/8/1/16/s1, File S1: 1H-NMR spectrum of 4a in DMSO-d6 at 298 K, File S2: 13C-NMR spectrum of 4a in DMSO-d6 at 298 K, File S3: IR Spectrum of 4a, File S4: 1H-NMR spectrum of 4b in DMSO-d6 at 298 K, File S5: 13C-NMR spectrum of 4b in DMSO-d6 at 298 K, File S6: IR Spectrum of 4b, File S7: 1H-NMR spectrum of 4c in DMSO-d6 at 298 K, File S8: 13C-NMR spectrum of 4c in DMSO-d6 at 298 K, File S9: IR Spectrum of 4c, File S10: Color change of azo 4a (2.5 × 10⁻⁵ M) upon addition of four equivalents of the metal ions, File S11: Color change of azo 4b (2.5 × 10⁻⁵ M) upon addition of four equivalents of the metal ions, File S12: Color change of azo 4c (2.5 × 10⁻⁵ M) upon addition of four equivalents of the metal ions, File S13: The color change ∆E(ab) between azo-metal complexes and the azo dyes (control), File S14: Molar ratio method for determination of the binding stoichiometry of azo 4c with Fe3+ (6 equiv).

Author Contributions

Conceptualization, S.S.A. and I.A.E.; methodology, D.A.; original draft preparation, writing—review and editing, S.S.A. and I.A.E. All authors have read and agreed to the published version of the manuscript.

Funding

This research received no external funding.

Acknowledgments

The authors are grateful to the Merck Company for the providing chemicals assistance.

Conflicts of Interest

The authors declare no competing interests.

References

  1. Chen, H.; Cho, C.; Wan, F.; Wu, T. A colorimetric sensor for Fe2+ ion. Inorg. Chem. Commun. 2014, 41, 88–91. [Google Scholar] [CrossRef]
  2. El-Kady, A.A.; Abdel-Wahhab, M. Occurrence of trace metals in foodstuffs and their health impact. Trends Food Sci. Technol. 2018, 75, 36–45. [Google Scholar] [CrossRef]
  3. Khalid, S.; Shahid, M.; Natasha, B.I.; Sarwar, T.; Shah, A.H.; Niazi, N.K. A review of environmental contamination and health risk assessment of wastewater use for crop irrigation with a focus on low and high-income countries. Int. J. Environ. Res. Public Health. 2018, 15, 895. [Google Scholar] [CrossRef] [Green Version]
  4. Rull-Barrull, J.; d’Halluin, M.; Le Grognec, E.; Felpin, F.X. Chemically-modified cellulose paper as smart sensor device for colorimetric and optical detection of hydrogen sulfate in water. Chem. Commun. 2016, 52, 2525–2528. [Google Scholar] [CrossRef] [PubMed]
  5. Khedr, A.M.; Saad, F.A. Synthesis, structural characterization, and antimicrobial efficiency of sulfadiazine azo-azomethine dyes and their bi-homonuclear uranyl complexes for chemotherapeutic use. Turk. J. Chem. 2015, 39, 267–280. [Google Scholar] [CrossRef]
  6. Refat, M.S.; El-Sayed, M.Y.; Adam, A.M.A. Cu (II), Co (II) and Ni (II) complexes of new Schiff base ligand: Synthesis, thermal and spectroscopic characterizations. J. Mol. Struct. 2013, 1038, 62–72. [Google Scholar] [CrossRef]
  7. Kadhum, A.A.H.; Al-Amiery, A.A.; Musa, A.Y.; Mohamad, A.B. The antioxidant activity of new coumarin derivatives. Int. J. Mol. Sci. 2011, 12, 5747–5761. [Google Scholar] [CrossRef] [Green Version]
  8. Bayindir, S. A simple rhodanine-based fluorescent sensor for mercury and copper: The recognition of Hg2+ in aqueous solution, and Hg2+/Cu2+ in organic solvent. J. Photoch. Photobio. A 2019, 372, 235–244. [Google Scholar] [CrossRef]
  9. Lohani, C.R.; Lee, K.H. The effect of absorbance of Fe3+ on the detection of Fe3+ by fluorescent chemical sensors. Sens. Actuators B Chem. 2010, 143, 649–654. [Google Scholar] [CrossRef]
  10. Wang, C.; Zhang, D.; Huang, X.; Ding, P.; Wang, Z.; Zhao, Y.; Ye, Y. A fluorescence ratiometric chemosensor for Fe3⁺ based on TBET and its application in living cells. Talanta 2014, 128, 69–74. [Google Scholar] [CrossRef]
  11. Ghaedi, M.; Mortazavi, K.; Montazerozohori, M.; Shokrollahi, A.; Soylak, M. Flame atomic absorption spectrometric (FAAS) determination of copper, iron and zinc in food samples after solid-phase extraction on Schiff base-modified duolite XAD 761. Mater. Sci. Eng. C Mater. Biol. Appl. 2013, 33, 2338–2344. [Google Scholar] [CrossRef] [PubMed]
  12. Mustafa, Y.F. Synthesis of new coumarin derivatives with suspected anticoagulant activity. Iraqi J. Pharm. Sci. 2012, 12, 20–32. [Google Scholar] [CrossRef]
  13. Liu, X.; Li, N.; Xu, M.-M.; Wang, J.; Jiang, C.; Song, G.; Wang, Y. Specific colorimetric detection of Fe3+ ions in aqueous solution by squaraine-based chemosensor. RSC Adv. 2018, 8, 34860–34866. [Google Scholar] [CrossRef] [Green Version]
  14. Bobrowski, A.; Nowak, K.; Zarebski, J. Application of a bismuth film electrode to the voltammetric determination of trace iron using a Fe(III)-TEA-BrO3- catalytic system. Anal. Bioanal. Chem. 2005, 382, 1691–1697. [Google Scholar] [CrossRef] [PubMed]
  15. Sil, A.; Ijeri, VS.; Srivastava, AK. Coated-wire iron(III) ion-selective electrode based on iron complex of 1,4,8,11-tetraazacyclotetradecane. Sens. Actuators B Chem. 2005, 106, 648–653. [Google Scholar] [CrossRef]
  16. Lee, M.H.; Giap, T.V.; Kim, S.H.; Lee, Y.H.; Kang, C.; Kim, J.S. A novel strategy to selectively detect Fe(III) in aqueous media driven by hydrolysis of a rhodamine 6G Schiff base. Chem. Commun. 2010, 46, 1407–1409. [Google Scholar] [CrossRef]
  17. Marcus, Y. On the Use of the Molar Ratio Method for Determining Association Stoichiometry. Isr. J. Chem. 1967, 5, 143–149. [Google Scholar] [CrossRef]
  18. Benesi, H.A.; Hildebrand, J. A spectrophotometric investigation of the interaction of iodine with aromatic hydrocarbons. J. Am. Chem. Soc. 1949, 71, 2703–2707. [Google Scholar] [CrossRef]
  19. AlNeyadi, S.S.; Salem, A.A.; Ghattas, M.A.; Atatreh, N.; Abdou, I.M. Antibacterial activity and mechanism of action of the benzazole acrylonitrile-based compounds: In vitro, spectroscopic, and docking studies. Eur. Eur. J. Med. Chem. 2017, 136, 270–282. [Google Scholar] [CrossRef]
  20. Sarker, S.D.; Nahar, L.; Kumarasamy, Y. Microtitre plate-based antibacterial assay incorporating resazurin as an indicator of cell growth, and its application in the in vitro antibacterial screening of phytochemicals. Methods 2007, 42, 321–324. [Google Scholar] [CrossRef]
  21. Barreiro, J.; Milano, M.; Sandoval, A. Kinetics of colour change of double concentrated tomato paste during thermal treatment. J. Food Eng. 1997, 33, 359–372. [Google Scholar] [CrossRef]
  22. Noh, H.L.; Park, Y.K.; Oh, B.M.; Zheng, J.; Kim, S.-H.; Lee, W.; Jong, H.K. Colorimetric chemosensor for detection of a volatile organic compound, ethylamine, under versatile conditions: Solution, thin-film, and dyed fabric. Sens. Actuators B Chem. 2019, 301, 127079. [Google Scholar] [CrossRef]
  23. Natansohn, A.; Rochon, P. Photoinduced motions in azo-containing polymers. Chem. Rev. 2002, 102, 39–76. [Google Scholar] [CrossRef] [PubMed]
  24. Pal, S.; Chatterjee, N.; Bharadwaj, P.K. Selectively sensing first-row transition metal ions through fluorescence enhancement. RSC Adv. 2014, 4, 26585–26620. [Google Scholar] [CrossRef]
  25. Varnes, A.W.; Dodson, R.B.; Wehry, E. Interactions of transition-metal ions with photoexcited states of flavines. Fluorescence quenching studies. J. Am. Chem. Soc. 1972, 94, 946–950. [Google Scholar] [CrossRef]
  26. Li, J.; Wang, Q.; Guo, Z.; Ma, H.; Zhang, Y.; Wang, B.; Bin, D.; Wei, Q. Highly selective fluorescent chemosensor for detection of Fe3+ based on Fe3O4@ZnO. Sci. Rep. 2016, 6, 23558–23566. [Google Scholar] [CrossRef] [Green Version]
  27. Weerasinghe, A.J.; Abebe, F.A.; Sinn, E. Rhodamine based turn-ON dual sensor for Fe3+ and Cu2+. Tetrahedron Lett. 2011, 52, 5648–5651. [Google Scholar] [CrossRef]
  28. Yuan, X.; Luo, Z.; Yu, Y.; Yao, Q.; Xie, J. Luminescent noble metal nanoclusters as an emerging optical probe for sensor development. Chem. Asian J. 2013, 8, 858–871. [Google Scholar] [CrossRef]
  29. Shiraishi, Y.; Sumiya, S.; Kohno, Y.; Hirai, T. A Rhodamine−cyclen conjugate as a highly sensitive and selective fluorescent chemosensor for Hg(II). J. Org. Chem. 2008, 73, 8571–8574. [Google Scholar] [CrossRef]
  30. Kaur, K.; Chaudhary, S.; Singh, S.; Mehta, S.K. Highly selective probe based on imine linkage for Zn2+ and HSO3 in mixed aqueous media. J. Lumin. 2015, 160, 282–288. [Google Scholar] [CrossRef]
  31. Özdemir, Ö. Synthesis of novel azo linkage-based Schiff bases including anthranilic acid and hexanoic acid moieties: Investigation of azo-hydrazone and phenol-keto tautomerism, solvatochromism, and ionochromism. Turk. J. Chem. 2019, 43, 266–285. [Google Scholar] [CrossRef]
  32. Fu, Y.; Pang, X.X.; Wang, Z.Q.; Chai, Q.; Ye, F. A highly sensitive and selective fluorescent probe for determination of Cu (II) and application in live cell imaging. Spectrochim Acta A Mol. Biomol. Spectrosc. 2019, 208, 198–205. [Google Scholar] [CrossRef] [PubMed]
  33. Chen, H.; Bao, X.; Shu, H.; Zhou, B.; Ye, R.; Zhu, J. Synthesis and evaluation of a novel rhodamine B-based ‘off-on’ fluorescent chemosensor for the selective determination of Fe3+ ions. Sen. Actuators B Chem. 2017, 242, 921–931. [Google Scholar] [CrossRef]
  34. Kozak, L.; Niedzielski, P.; Wachowiak, W. The tandem analytical method of flow injection diode array spectrophotometry and flame atomic absorption spectrometry (FI-DAD(vis)-FAAS) in iron speciation studies using 1,10-phenanthroline complexes. Microchem. J. 2013, 110, 54–60. [Google Scholar] [CrossRef]
Figure 1. Template design for 5-arylazorhodanine 4a–c.
Chemosensors 08 00016 g001
Scheme 1. Synthesis of azo dyes based on rhodanine 4a–c.
Chemosensors 08 00016 sch001
Figure 2. Color change of azo 4a (a), azo 4b (b) and azo 4c (c) (2.5 × 10⁻⁵ M) upon addition of four equivalents of different metal ions.
Chemosensors 08 00016 g002
Figure 3. UV–vis spectra of azos 4a (a), 4b (b), and 4c (c) (2.5 × 10⁻⁵ M) upon addition of four equivalents of different metal ions.
Chemosensors 08 00016 g003
Figure 4. UV/vis absorption spectra of (a) azo 4c (2.5 × 10⁻⁵ M) and (b) fluorescence spectra of azo 4c (2.5 × 10⁻⁵ M) in the absence and presence of Fe3+ (4 equiv.) in DMF.
Chemosensors 08 00016 g004
Figure 5. The suggested azo 4c–iron (III) complex structure.
Chemosensors 08 00016 g005
Figure 6. UV/vis titration of azo 4c (2.5 × 10⁻⁵ M) with Fe3+ (1.5 × 10⁻³ M) in DMF. Inset: Molar ratio method for determination of the binding stoichiometry of azo 4c with Fe3+ (4 equiv.).
Chemosensors 08 00016 g006
Figure 7. Benesi–Hildebrand plot for the 1:2 binding stoichiometry of azo 4c with Fe3+.
Chemosensors 08 00016 g007
Figure 8. Calibration curve for the absorbance of azo 4c as a function of [Fe3+].
Chemosensors 08 00016 g008
Table 1. Agar well diffusion method–zone of inhibition and minimum inhibitory concentration (MIC, μg/mL) of rhodanine azos 4a–c.
CompoundsZone of Inhibition (cm) *MIC (μg/mL)
E. coliP. aeruginosaS. aureusE. coliP. aeruginosaS. aureus
4a0.70.90.82.52.52.5
4b0.91.00.71.252.51.25
4c0.6NA1.00.625NA1.25
Amoxicillin0.82.2NA0.10.0125NA
* An error value of 0.1–0.05 cm can be expected.

