Article

Electrochemical Behavior and Detection of Diclofenac at a Microporous Si3N4 Membrane Modified Water–1,6-dichlorohexane Interface System

by
Eissa Mohamed Almbrok
1,2,
Nor Azah Yusof
1,3,
Jaafar Abdullah
1 and
Ruzniza Mohd Zawawi
1,*
1
Department of Chemistry, Faculty of Science, University Putra Malaysia, 43400 UPM Serdang, Selangor, Malaysia
2
Department of Chemistry, Faculty of Education, Sebha University, 18758 Sebha, Libya
3
Institute of Advanced Technology, University Putra Malaysia, 43400 UPM Serdang, Selangor, Malaysia
*
Author to whom correspondence should be addressed.
Chemosensors 2020, 8(1), 11; https://doi.org/10.3390/chemosensors8010011
Submission received: 6 December 2019 / Revised: 22 January 2020 / Accepted: 25 January 2020 / Published: 5 February 2020

Abstract

:
The electrochemical behavior when the liquid–liquid interface was modified by commercially available, microporous silicon nitride membrane, was achieved using cyclic voltammetry with tetramethyl ammonium. The transfer characteristics of the ionizable drug diclofenac ( DCF ), as an anti-inflammatory, anti-rheumatic, antipyretic, and analgesic treatment in common use in biomedical applications, were also investigated across microporous silicon nitride-modified liquid interface. Thus, some thermodynamic variables for DCF , such as the standard Gibbs energy of transfer, the standard transfer potential and lipophilicity were estimated. Furthermore, the influence of possible interfering substances (ascorbic acid, sugar, amino acid, urea, and metal ions) on the detection of DCF was investigated. An electrochemical DCF sensor is investigated using differential pulse voltammetry (DPV) as the quantification technique, a linear range of 8–56 µM and a limit of detection of 1.5 µM was possible due to the miniaturized interfaces formed within silicon nitride.

1. Introduction

Ion transfer via the liquid–liquid interface or the interface between two immiscible electrolyte solutions (ITIES) has been of growing attention in several chemical and biological applications, such as the behavior of drugs, membrane transport, and electrochemical liquid–liquid extraction [1,2]. The utilization of electrochemical sensing platforms can be a solution for an on-line detection without the need of sample extraction. Moreover, miniaturized sensing platforms offer several benefits over their macro counterparts [3]. Electrochemical sensors based on micro-interfaces between two immiscible electrolyte solutions (µITIES) have been developed in recent years [4,5]. To date, two methods to product liquid–liquid micro-interface have been reported [6,7]. The first is based on the use of micro-pipettes that the interface is formed at the tip of a pulled glass pipette [7,8]. The second is based on an inert membrane containing arrays of micron-sized pores or holes, with centers between the aqueous and organic phases [6,9]. Several studies have reported the advantages of using micro-interface arrays created on an inert membrane. Diverse membrane fabrication materials have been investigated, such as polymers (polyimide, polyester, polyethylene terephthalate (PET), and cellulose) [10,11,12,13] and silicon [6,14]. Several research attempts have been efforted on developing ion selective sensors for organic, inorganic, and biological species in addition to theoretical methods to clarify charge transfer reactions and develop new patterns [15,16]. However, Most ITIES studies on ionizable drugs have focused on understanding the lipophilicity for pharmacological drugs through voltammetric investigations via a polarized ITIES [17,18]. Despite several works published for electrochemical studies of ion transfer responses of various drugs across the ITIES [19,20,21], much fewer reports have been represented for the design of liquid–liquid interface as a sensing platform for the detection of drugs, including ractopamine [22], daunorubicin [23], α1-acid-glycoprotein [24], and propranolol [25]. We present here a novel sensing platform based on an array of microporous able to detect ionic species in a biological fluid. This sensor brings benefit of the possibility to polarise the interface constructed between the aqueous and organic phases. We have selected diclofenac as a model analyte (see Figure 1). This drug belongs to a nonsteroidal anti-inflammatory drug (NSAID) group, which is typically utilized for the treatment of chronic diseases and as it uses to relieve symptoms of arthritis, swelling, and stiffness [26]. However, DCF has been found to cause increasing blood pressure in patients with diabetes mellitus and Shy–Drager syndrome. In addition, it may cause life-threatening heart or circulation problems such as a heart attack and stroke, particularly when the patient uses it long term [27]. Thus, it is essential to develop a fast and sensitive method of DCF detection in biological and pharmaceutical applications. To date, several methods have been harnessed for the determination of DCF, such as liquid chromatography [27,28], gas chromatography [29,30], spectrophotometry [31,32], spectrofluorimetry [33], mass spectrometry [34], colorimetry [35], and voltammetry [36,37] in biological samples. Electrochemical methods have recently attracted more attention due to their fast response, accuracy, lower cost, sensitivity, simplicity, and high dynamic range compared to other methods for environmental, pharmaceutical, and biological applications [38,39,40,41]. Although several electrochemical approaches have been advanced, most of those reports were based on solid–liquid interfaces by the modification of electrodes with catalytic materials such as modified nickel electrodes [42], carbon nanotubes [43,44], Fe 3 O 4 nanoparticles [45], and a tyrosine-modified carbon paste electrode [46]. Although higher sensitivity and lower overpotentials could be achieved, extra actions to immobilize the catalytic material on the electrode can be arduous [47]. To the best of our knowledge, diclofenac has not been studied by ion transfer voltammetry at micro-ITIES. Therefore, this study opens the opportunities for the electrochemical behavior of anion diclofenac transfer across ITIES a water–1,6-dichlorohexane system using cyclic voltammetry (CV) for the first time. The analytical parameters for the transfer of ionizable diclofenac and the impact of the potentially interfering substances to DCF detection is also discussed. We present also the characterization of the silicon nitride microporous system by scanning electron microscopy (SEM) and cyclic voltammetry (CV) of tetramethyl ammonium (TMA+). This model analyte has been utilized widely in the characterization of ITIES, as it offers rapid and mechanistically simple transfers in these systems [5]. The array is then used for the detection of diclofenac by differential pulse voltammetry (DPV).

2. Experimental

2.1. Materials

All reagents used were obtained from Sigma Malaysia and used as received unless otherwise specified. Potassium phosphate mono basic (KH2PO4), D-glucose, potassium chloride (KCl), sodium sulphate Na2SO4, and glycine were purchased from HmbG chemical. Sodium chloride (NaCl) and L-ascorbic acid were purchased from Fisher Scientific Chemical, Selangor, Malaysia. Urea from BDH Laboratory Supplies, Malaysia. 1,6-dichlorohexane solvent (1,6-DCH) 98% from Sigma-Aldrich, Selangor, Malaysia and was purified according to a procedure described elsewhere [48].
10 mM lithium chloride (LiCl), as electrolyte salt for the aqueous phase, was prepared in ultrapure water (resistivity of 18.2 MΩ cm) from arium® pro-Ultrapure Water Systems (Sartorius, Kuala Lumpur, Malaysia). An electrolyte salt of the organic phase was synthesized by metathesis of potassium tetrakis(4-chlorophenyl) borate (KTPBCl) and bis(triphenylphosphoranylidene) ammonium chloride (BTPPACl). The organic phase was prepared by dissolving 10 mM of the supporting electrolyte (10 mM BTPPATPBCl) in 1,6-dichlorohexane solvent (1,6-DCH) solvent. Pre-saturated mutually was achieved before the experiments for both the aqueous and organic phase solvents. The organic reference solution was composed from 1.0 mM BTPPACl dissolved in aqueous 10 mM LiCl. Diclofenac sodium and tetramethylammonium chloride (TMACl) as analyte species were employed as drug and model ions, respectively, their stock solutions were prepared in 10mM LiCl aqueous solution. In the interfering substances study, the selected substances were prepared in phosphate-buffered saline (1 mM PBS) with 13.7 mM NaCl and 0.27 mM potassium chloride (KCl) as the supporting electrolyte. L-ascorbic acid, D-Glucose, Na2SO4, KCl, NaCl, urea, and glycine (5.0 mM) were used as models of the interfering substances.

2.2. Setup of the ITIES

The microporous silicon nitride (Si3N4) membrane ( DuraSiN TM ) was used to modify microscale-ITIES arrays (Electron Microscopy Science, Industry Road, Hatfield, PA, USA). Micropores are showed in Figure 2a,b, with 2500 pores, 1.25 ± 0.04 µm radius ( r a ), 100 µm thick silicon membrane and pore center-to-center separation ( r c ) of 10.12 ± 0.16 µm times pore radius,   r a (i.e., r c = 10.12   r a ) in a cube close-packed (CCP) arrangement. The silicon chip was sealed onto the lower orifice of a cylindrical glass tube using silicone rubber sealant (Selleys, Selangor, Malaysia) and left to dry for 3 days before use. Acetone solvent was used to clean the membrane before and after each electrochemical experiment, and it was l eft in air to dry. All experiments were carried out at room temperature (25 °C).

2.3. Electrochemical Procedure of the Microscale Interface

All experiments were carried out using a potentiostat Autolab (PGSTAT101, Metrohm Autolab, Selangor, Malaysia) with Nova 1.1 software. Differential pulse voltammetry (DPV) parameters were as follows: step potential = 5 mV, pulse amplitude = 25 mV, and scan rate = 10 mV s−1. The membrane-modified water/1,6-DCH interface was polarized operating a three-electrode cell as previously reported to compensate the resistance related with the organic phase and the membrane [5,48] with silver/silver chloride (Ag/AgCl) electrode with an internal solution of 3 M NaCl acting as a reference and counter electrode in the aqueous phase of the membrane and Ag/AgCl electrode as a reference electrode and platinum mesh (Pt) as a counter electrode in the organic phase. The cell used was placed in a Faraday cage to minimize electrical noise. The cylindrical glass tube with the membrane contained 500 µL of the aqueous phase, and then immersed in glass beaker 10 mL, which contained 1.0 mL of the organic phase and 2 mL of the organic reference solution. The surface morphology of microporous membrane was characterized via Field-emission scanning electron microscope with FESEM (JEOL JSM-7600F). The scheme for electrochemical cells used in this study is summarized as follows:
Ag   |   AgCl   |   x   µ M   DCF   in   10   mM   LiCl   ( pH   7.4 )   0.1   M   LiOH ( W )   | |   10   mM BTPPATPBCl ( 1 , 6 - DCH )   |   1.0   mM   BTPPACl   in   10   mM   LiCl ( W )   |   Ag   |   AgCl
Ag   |   AgCl   |   x   µ M   DCF   +   5.0   mM   interferent   +   10   mM   LiCl   ( pH   7.4 )   0.1   M LiOH ( W )   | |   10   mM   BTPPATPBCl ( 1 , 6 - DCH )   |   1.0   mM   BTPPACl   in   10   mM LiCl ( W )   |   Ag   |   AgCl
where x represents the concentration of diclofenac in the aqueous phase. In each electrochemical cell, the TMA+ model ion, as a control of the potential axis, was added after the final DCF or interferent addition in each the experiments. The CVs of background electrolytes at 10 mV s−1 was recorded to limit the range of the potential window before the addition of analyte to the aqueous phase.

3. Results and Discussion

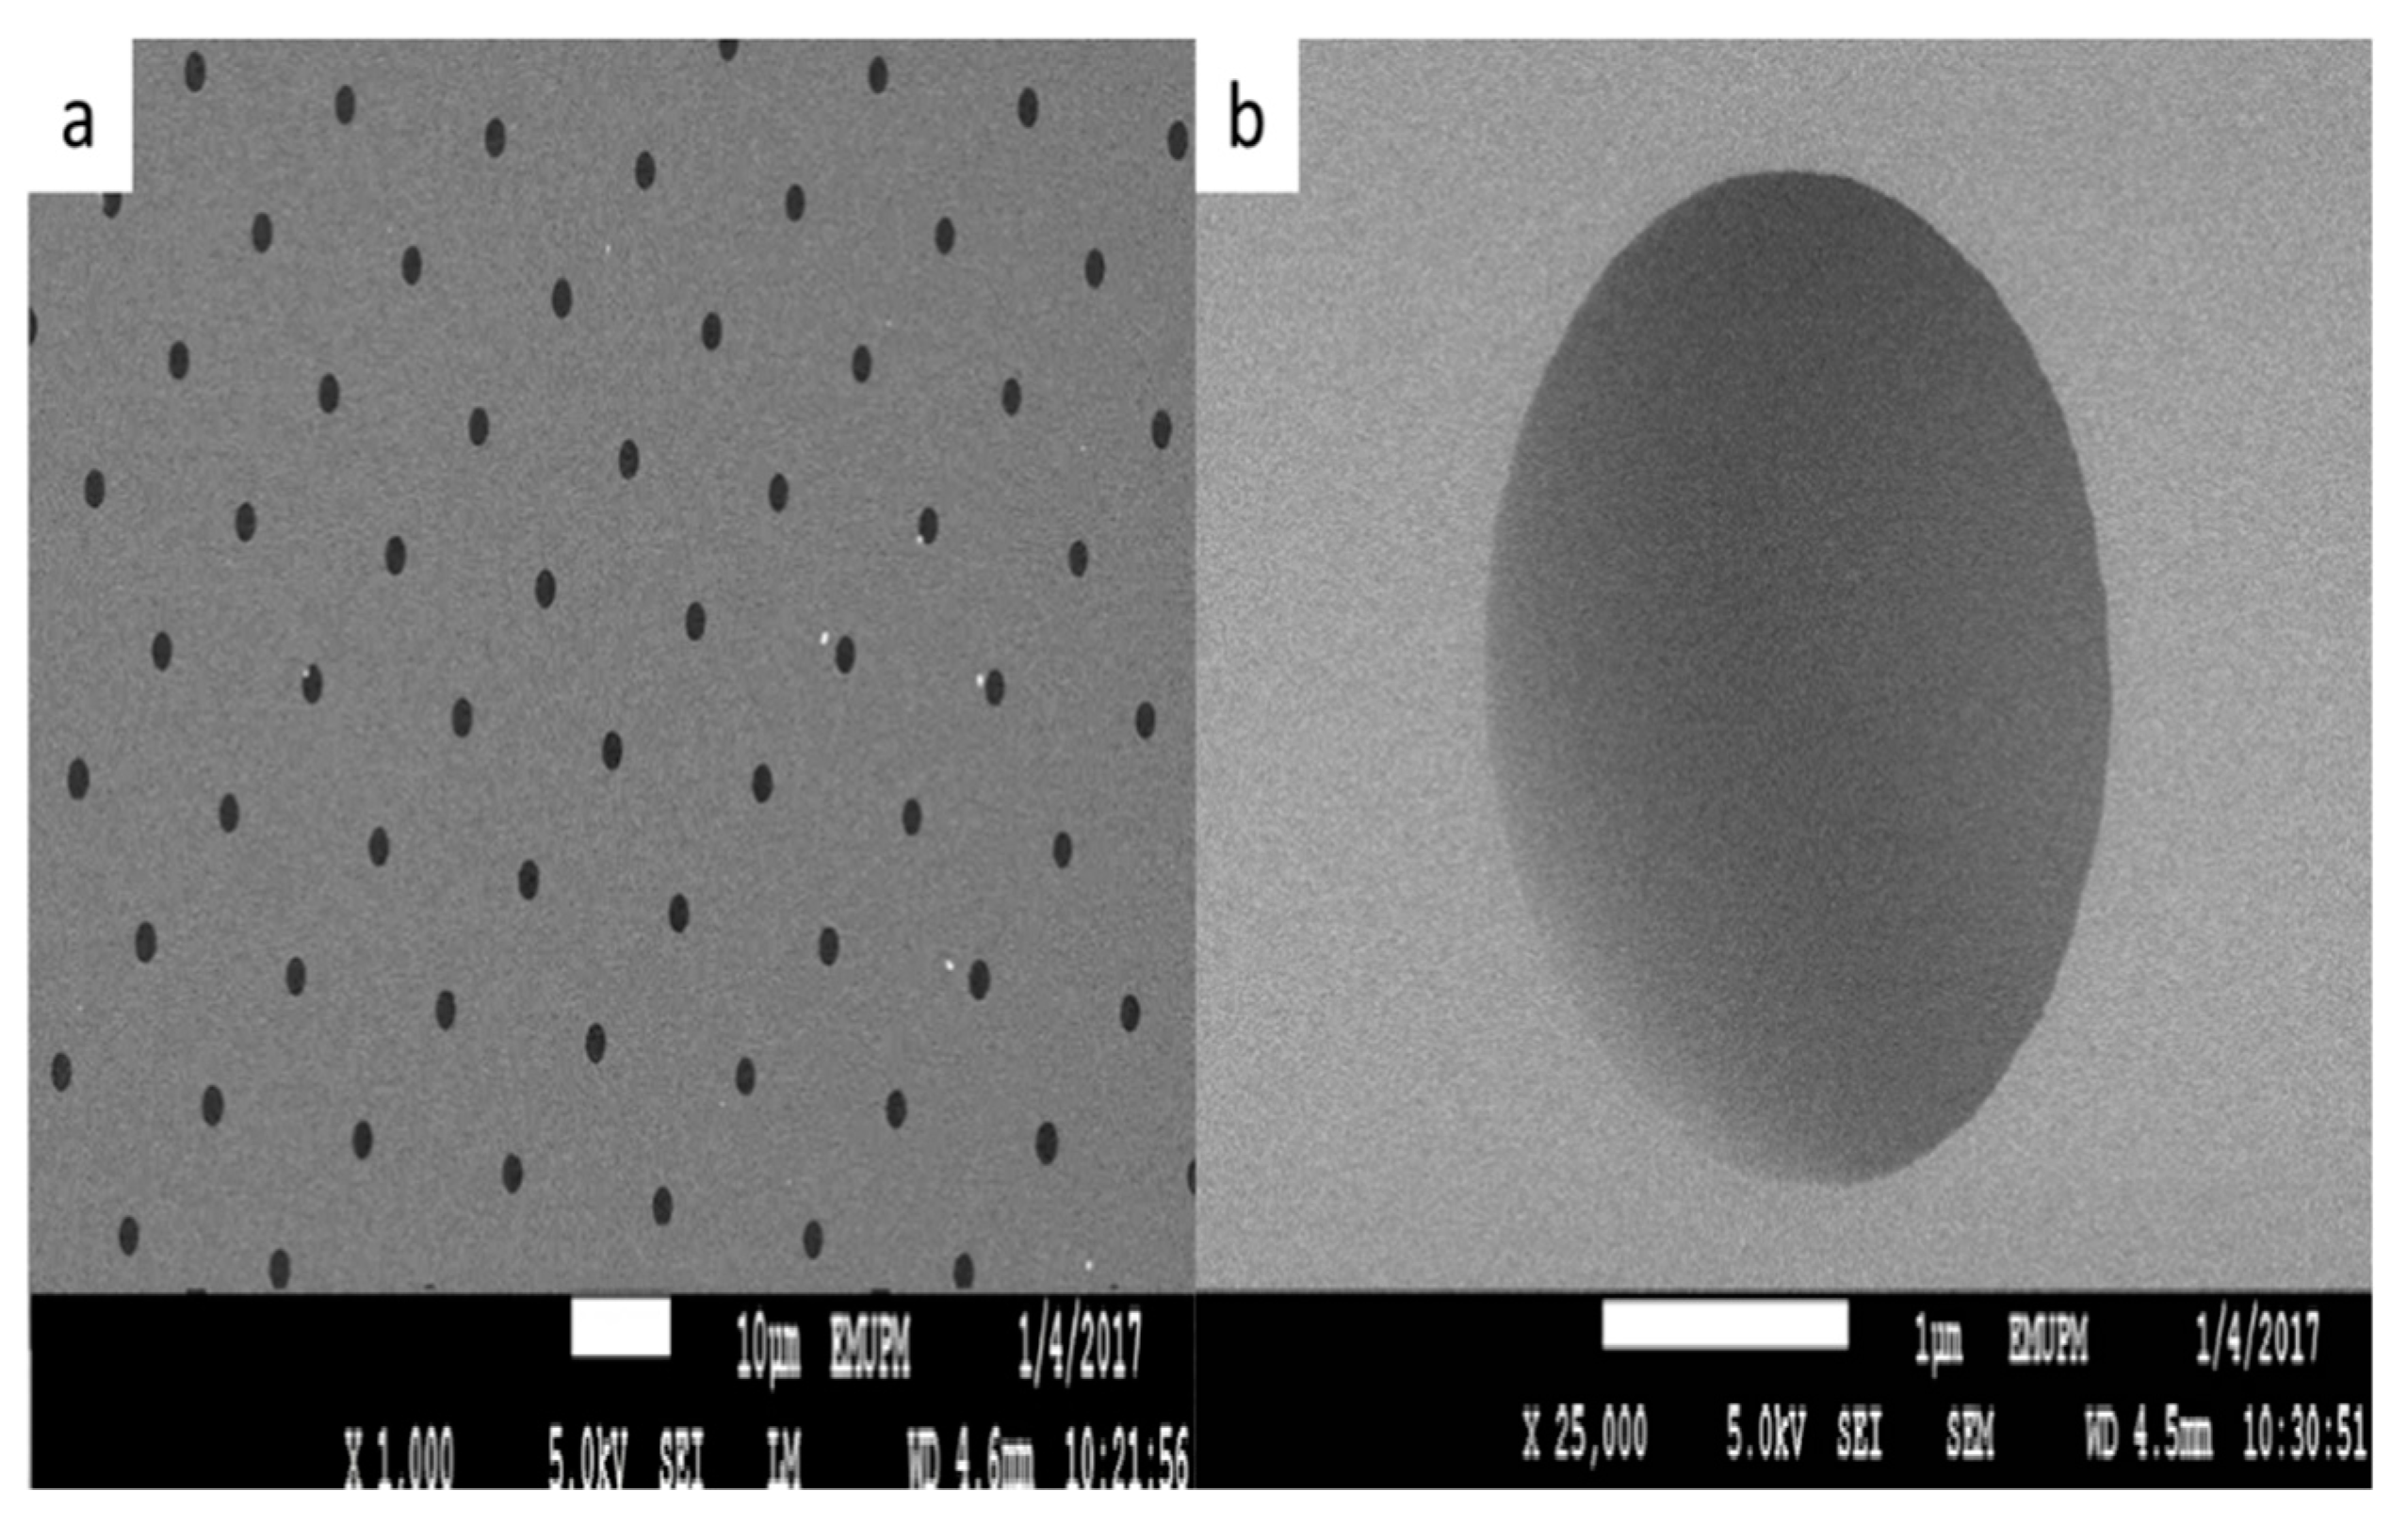
3.1. SEM Characterization of Microporous Silicon Nitride Membrane

SEM images in Figure 2a,b show microporous silicon nitride membrane with pore sizes of with the positions of pores relative to each other in a cubic close-packed (CCP) arrangement. The pore radius is approximately 1.25 ± 0.04 μm, in this case to avoid diffusion zone overlap, the pore center-to-center distances should at least 25.0 μm. Therefore, diffusion zone overlap is predictable to happen and contribute to the voltammogram shape resulted on the forward scan.

3.2. Electrochemical Characterization of Ion Transfer via Microscale-ITIES Array

The microporous Si3N4 membrane was electrochemically characterized by studying the ion transfer of tetramethylammonium ion (TMA+) as a reference and model ion using cyclic voltammetry (CV). A sequence of CVs of the background electrolyte transfer was carried out before the addition of the model ion to determine the range of potential window. Concentrations of TMACl in aqueous phase were varied in the range of 20, 40, 60, 80, and 100 µM at scan rate 10 mV/s, thus, calibration curves correlating currents (in the forward and reverse scans) with the concentration of transferring ions, TMA+ are produced. The ion transfer process here was assumed to be diffusion controlled. The shape and magnitude of the voltammetric responses and the current observed, respectively, are affected by several parameters, including: the diffusion regime shape, the geometric properties of the pores and the interface location between two phases, 𝑙 [6]. Voltammetry response of the Si3N4 membrane to TMA+ concentrations added in the aqueous phase (Figure 3a) displayed asymmetrical behavior. The resulting voltammogram from the transfer of TMA+ from aqueous to the organic phase (the forward scan), exhibited a combination of the peak and steady-state behavior, whereas peak behavior was observed from the ions transferred back of the TMA+ from the organic to the aqueous phase (the reverse scan). The potential steady state scan and the potential peak were observed at approximately 0.72 and 0.65 V for the forward and the reverse scans, respectively. These voltammograms (Figure 3a) appeared a contribution of linear and radial diffusion control on the forward scan, while in the reverse scan, a linear diffusion control was dominated. Figure 3b represents the linear relationship resulting between the experimental currents obtained (forward and reverse scans) and increased concentrations of TMA. Based on a recent computer simulation, steady-state properties can still be achieved even in instances where the array rims are controlled by radial diffusion regardless of the linear diffusion within the arrays (wherein diffusion zones overlap exist) [49]. In an earlier study by Amatore and co-workers [50], a combination of peak and steady-state behavior on the forward scan was reported, where ion transfer process may occur by both linear and radial diffusion at partially opened surfaces. The transition from an individual diffusion fields (radial diffusion) to diffusion fields overlap (linear diffusion) causes a change at the voltammetric response from steady state to peak behavior [50,51]. Previously study by Scanlon et al. [52] established that micro-arrays with smaller pore center-to-center distances had higher diffusion zone overlap at adjacent interfaces in the array, and thus little flux and current values. If 𝑟𝑐 > 20𝑟𝑎, diffusion zone overlap will lead to independent diffusion to each interface. In this study, the radius of the pore orifice is approximately 1.25 ± 0.04 µm, hence the pore center-to-center separations should at least 25.0 µm to avoid diffusion zone overlap. Since the interpore distance is only 12.65 ± 0.13 μm, diffusion zone overlap is expected to occur and contribute to the voltammogram shape observed on the forward scan. Additionally, the observed behavior of the voltammograms can be attributed to the location of the liquid–liquid interface in the pore. Silicon nitride, Si3N4, by virtue of its chemical composition is hydrophobic, the contact angles for water and DCH is about the same on as-received Si3N4 membrane in the range 60–80° [53,54,55]. Thus, the filling procedure could play an important role for the determination of kinetic parameters from the electrochemical measurements at a liquid–liquid micro-interface. Regarding inlaid configuration, the planar interface at pore orifices on aqueous membranous sides without shielding impact from adjacent pore walls. In contrast, a recessed pore could range between 0%, so, the organic phase fills the pore where interface locates on aqueous side and 100% where the aqueous phase fills the pore and interfaces at the mouth of the pore on organic sides [6]. Voltammograms of the modified micro-interface in Figure 3a display that the interface between two phases is placed within of the pore channel from of the aqueous phase side, although it may be either inlaid or recessed interfaces. Therefore, the experimental currents obtained are compared with the theoretical currents in the case inlaid and recessed interfaces. In case, a steady-state current (radial diffusion control) had been achieved [22,51], thus, the limiting current is defined as for an inlaid disc microelectrode (Equation (1))
I l i m = 4 n F D C r
where (n) represents the charge of the transporting ion species, (D) the diffusion coefficient, (F) the constant of Faraday, (r) the radius of the pore and (C) the bulk concentration of the transporting species. Thus, the experimental limiting current obtained was approximately 1.8 × 10⁻⁷ A, while the value calculated of limiting current (Equation (1)) by using the diffusion coefficient published of the TMA + (8.96 × 10⁻⁶ cm2 s−1) [5] was 2.16 × 10⁻⁵ A. The total limiting current is the product of the current per pore and the number of pores. In the case, the interface was located at the opening of the pore on the organic side of the membrane and the aqueous phase fills the micropores, then microporous membrane used will behave as a recessed interface for the transferring species from the aqueous phase to the organic phase. Therefore, the limiting current can be calculated at such a recessed micro-ITIES by (Equation (2)) [5,51]
I l i m = 4 π n F D C r 2 4 L + π r
where L is the recess depth and other parameters have their previous meanings. Thus, the limiting experimental current, 2.1 × 10⁻⁷ A was in good agreement with the calculated current, 1.8 × 10⁻⁷ A from Equation (2), in the case, the ITIES is assumed to be fully recessed with respect to the aqueous phase. It is most probably that the interface is existed somewhere within the pore channel. Since the experimental peak current for the forward scan is less strong than that for the reverse scan. However, the slightly lower experimental current values may be due to diffusion zone overlap, i.e., interfaces not located at the pore mouth but within the pore length.

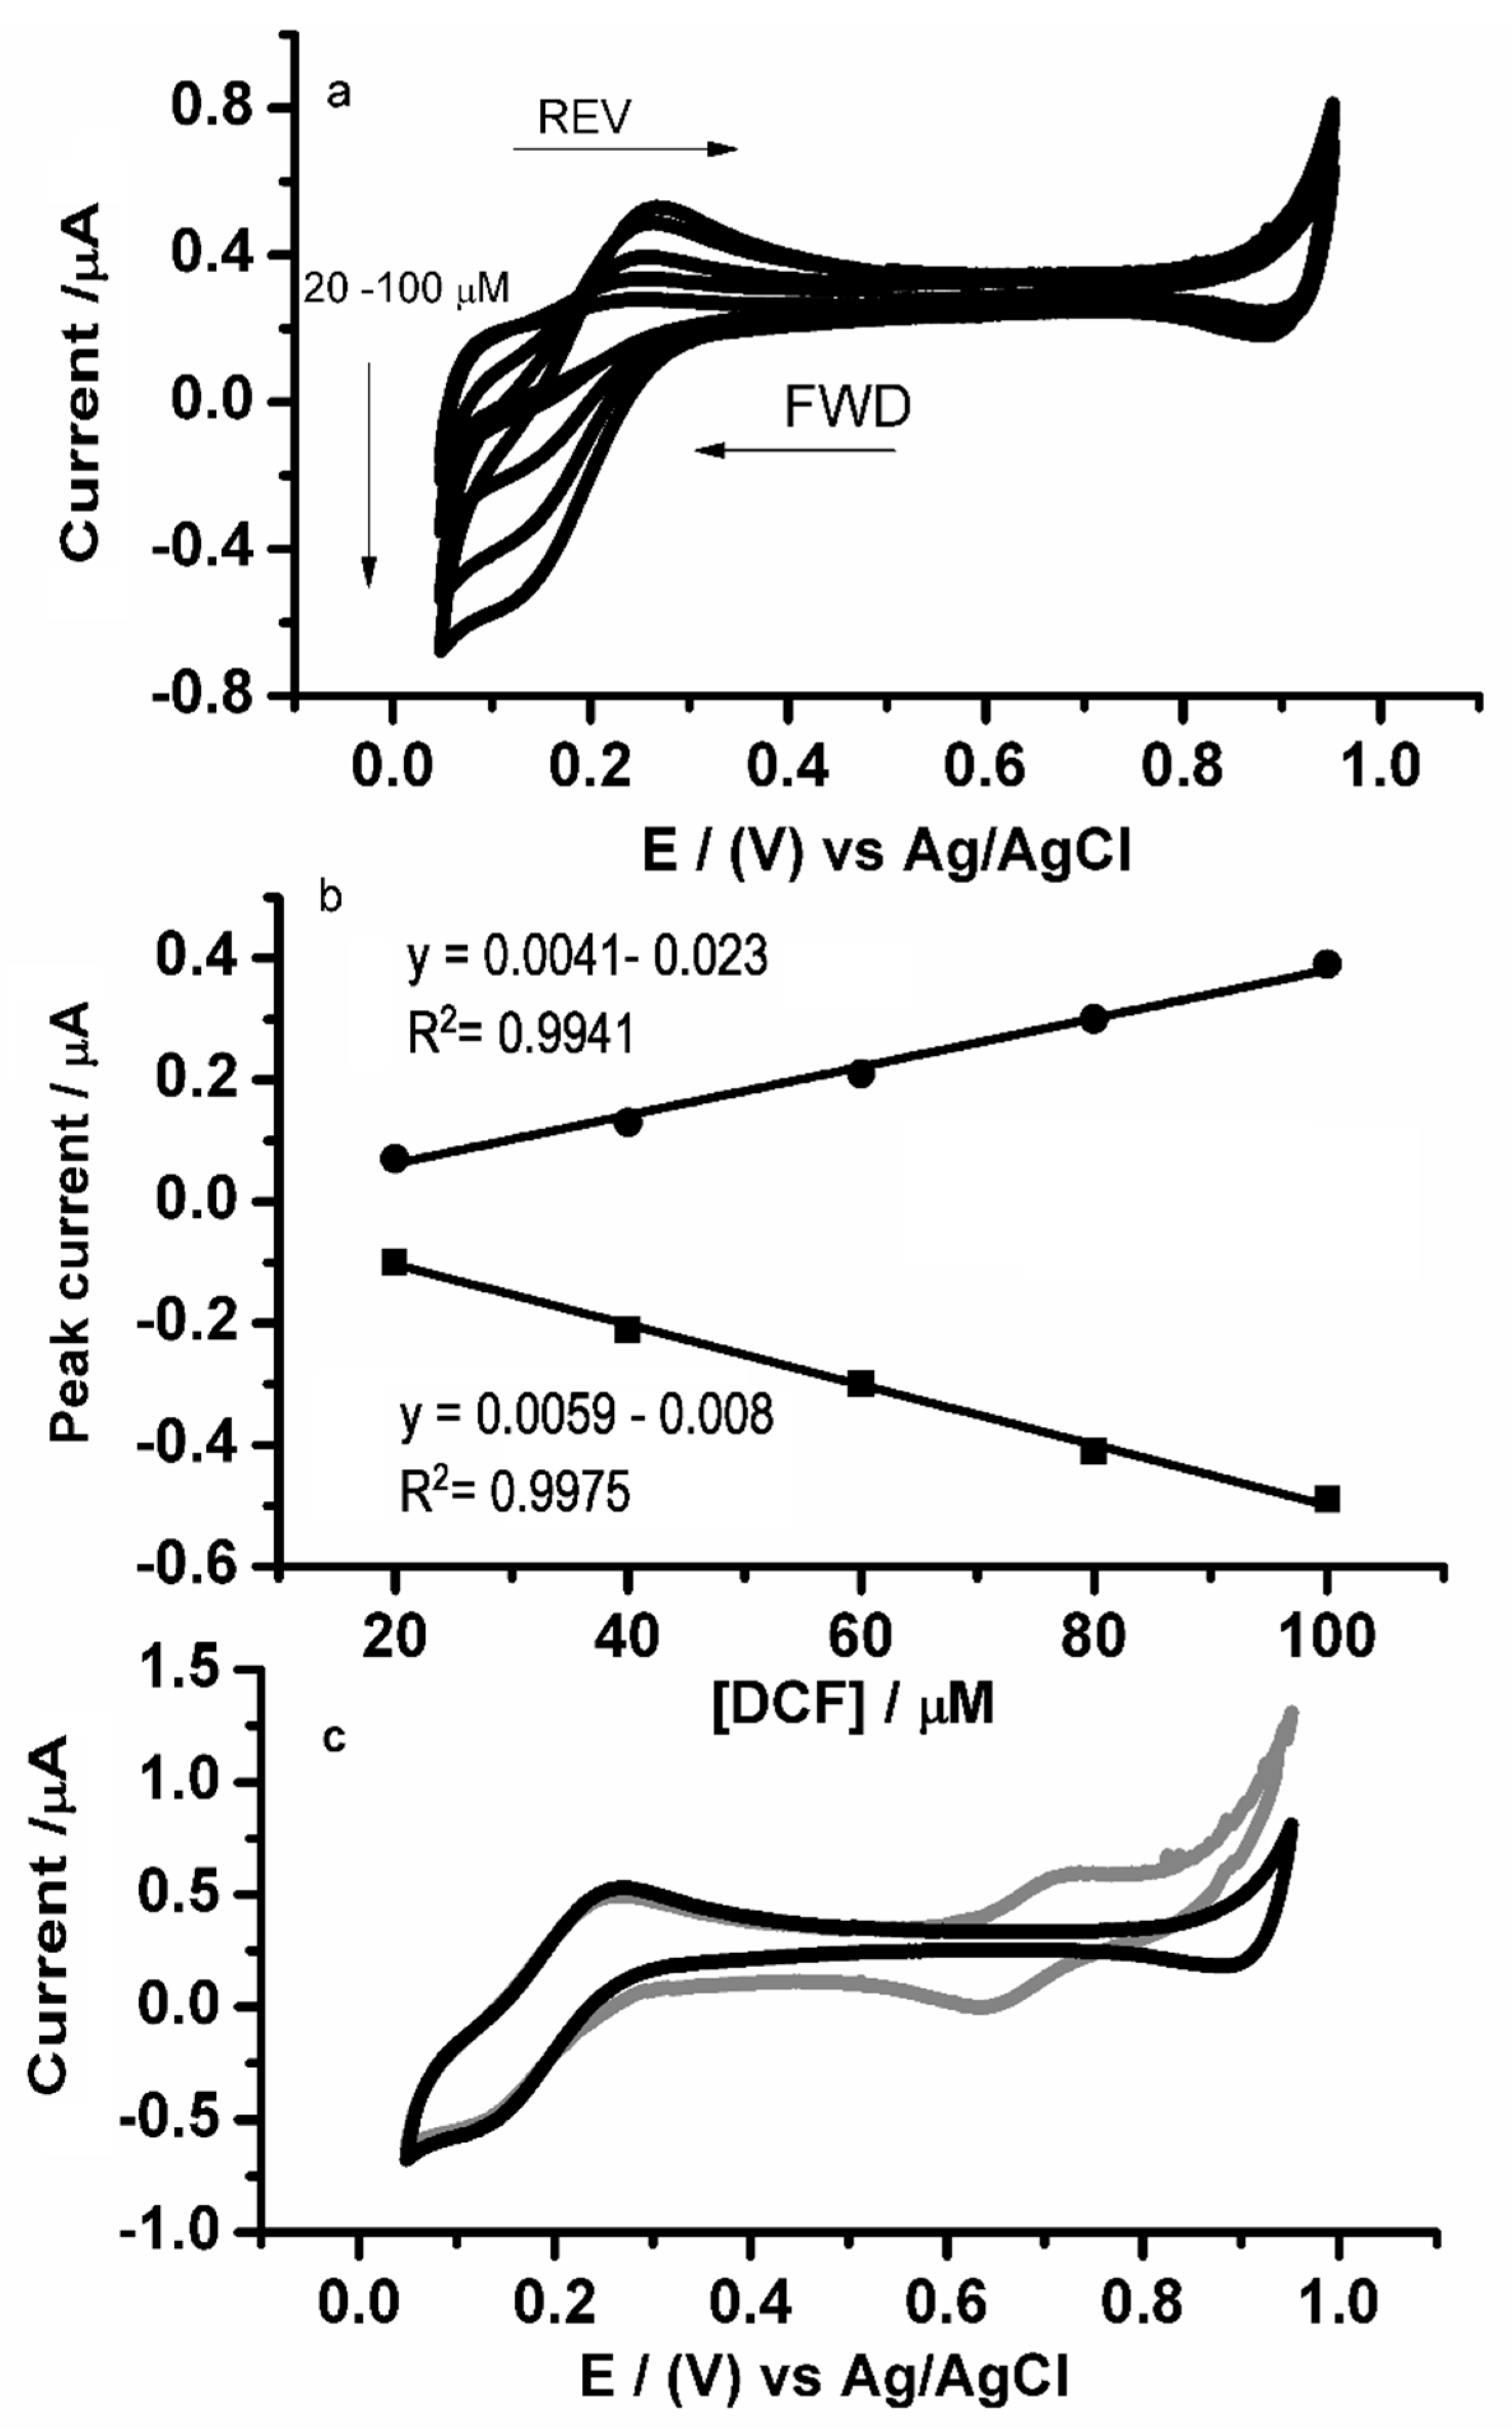
3.3. Electrochemical Characterization of Diclofenac at the Microscale-ITIES Array

Ion transfer process of diclofenac anion ( DCF ) was characterized using CV at the microporous membrane-supported water/1,2-DCE interface system. Figure 4a shows the background-subtracted voltammograms of DCF ions transfer at concentrations range of 20 to 100 µM increment of 20 µM. The positive and negative limits represent background electrolytes transfer from the aqueous phase to 1,6-DCH, and vice versa, were determined in the range from 0.05 to 0.95 V (see the Figure 4a). Diclofenac sodium is a salt of a weak acid in which the pKa of the phenylacetate group is 4.0 ± 0.02 [56]. In the aqueous phase of 10 mM LiCl (pH 7.4), the pH was maintained using 0.1 M LiOH solution to ensure that the drug is fully ionized. The potential scan was started at 0.5 V in a positive direction of the potential window edge. The voltammograms of the forward scan demonstrate that the limiting current of transfer wave was at 0.17 V, close to the background electrolytes transfer to limit the potential window (Figure 4a), while, a peak-shaped feature was observed at ca. 0.24 V for the reverse scan. The steady-state and peak currents increased linearly with DCF concentrations in the aqueous phase to construct the calibration graphs of the forward and reverse scans, respectively (Figure 4b). Figure 4c shows CV of 100 µM DCF with 60 µM TMA+, as a potential axis reference ion and a model ion [5], was added to the aqueous phase to define a potential scale. The voltammogram resulting demonstrated a steady-state behavior and a peak shape on the forward and reverse scan, respectively, in agreement with experiments in the previous section. Measuring the peak current at different concentration allows determination of the diffusion coefficient in the respective phase. Equation (2) was used to calculate the aqueous diffusion coefficient from the slope of the linearity of the limiting currents (forward scan) and peak currents (reverse scan) versus DCF concentrations (Figure 4b). The aqueous diffusion coefficient of DCF was determined to be 5.75 × 10⁻⁶ cm2 s−1, which is in agreement with literature value of (5.9 × 10⁻⁶ cm2 s−1) [57] and about double-fold higher than the published value, (2.67 × 10⁻⁶ cm2 s−1) [37] for from the chronoamperometric response via solid–liquid electrode. These results reflect the low value of experimental limiting current of the membrane used as discussed in the previous section. The literature data on the diclofenac diffusion coefficient is somewhat rare. Different values were previously reported including (2.67 × 10⁻⁶ cm2 s−1) [37], 5.9 × 10⁻⁶ cm2 s−1) [57], (4.32 × 10⁻⁵ cm2 s−1) [58], and (3.7 × 10⁻⁴ cm2 s−1) [59] depending on the aqueous pH used in a membrane diffusion system. These varied findings suggest the need for an accurate diffusion coefficient value.

3.4. Thermodynamic Data of D C F Transfer at Micro-Interface

Thermodynamic parameters of DCF ions transfer were deduced from the voltammograms and listed in Table 1. Using standard thermodynamic values of well-known reference ions such as TMA+ to determine the thermodynamic properties of an unknown ion transfer is one of the classical methods via liquid–liquid interface [60]. By converting the obtained experimental value to the Galvani potential scale, the value of the formal transfer potential of an ionized drug is obtained as given by the following expression [56,61].
E 1 2 ( d r u g )   Δ o w ° ( d r u g ) =   E 1 / 2 ( T M A + )   Δ o w ° ( T M A + )
where Δ o w ° (TMA+) represents the standard transfer potential of the TMA + ion, E 1 / 2 ( d r u g )   and   E 1 / 2 ( T M A + ) are the experimental half-wave potentials of the drug and TMA + transfer, respectively. Because of practical reasons (the absolute potential cannot be measured), the tetraphenylarsonium tetraphenylborate standard potential (TATB) scale has been used at the liquid–liquid interface, the value of Δ o w ° ( TMA + ) was taken as 0.16 V [61]. The TMA+ ion was chosen as a reference ion where the transfer potential varies from that of DCF and there is no mutual intervention. The Galvani transfer potential of DCF ( Δ o w ° ( D C F ) obtained by Equation (2) was 0.32 V, while the published literature value in water–1,2-dichloroethan via macro-ITIES was −0.124 mV [56]. The Gibbs energy of transfer ( Δ G t r , D r u g 0 ,   w o ) is directly associated to the standard transfer potential of the ion transfer [22,62]. The ( Δ G t r , D C F 0 ,   w o ) of DCF from the aqueous to 1,6-DCH phase is expressed as,
Δ 0 w D C F ° =   ( Δ G t r , D C F 0 ,   w o ) z F
The value calculated of ( Δ G t r , D C F 0 ,   w o ) across a water|/1,6-DCH from Equation (3) was 30.8 kJ mol−1.
The partition coefficient ( l o g P ° ) of a specific solute containing two immiscible solvents constitutes lipophilicity’s important parameter. This measures of the relative affinity of two phases and has correlation with the standard transfer energy of the solute in both solvents [20,22]. Here, the DCF’s partition coefficient ( l o g P D C F ) between1,6-DCH and water and 1, is denoted by
l o g P D C F ° =   ( Δ G t r , D C F 0 ,   w o ) 2.3 R T
where (R) the gas constant is 8.314 J mol−1 K−1 and (T) the absolute temperature 298 K°. The calculated value of l o g P D F C ° is 5.4, while in previously the published value was 2.10 [56]. In the case, the comparison between the partition coefficient of the neutral form of DCF l o g P n o c t ° (3.25) [56] in n-octanol–water systems and the l o g P D F C ° for ionizable form, the diclofenac exists under physiological conditions as a moderately lipophilic anion and highly lipophilic neutral form.

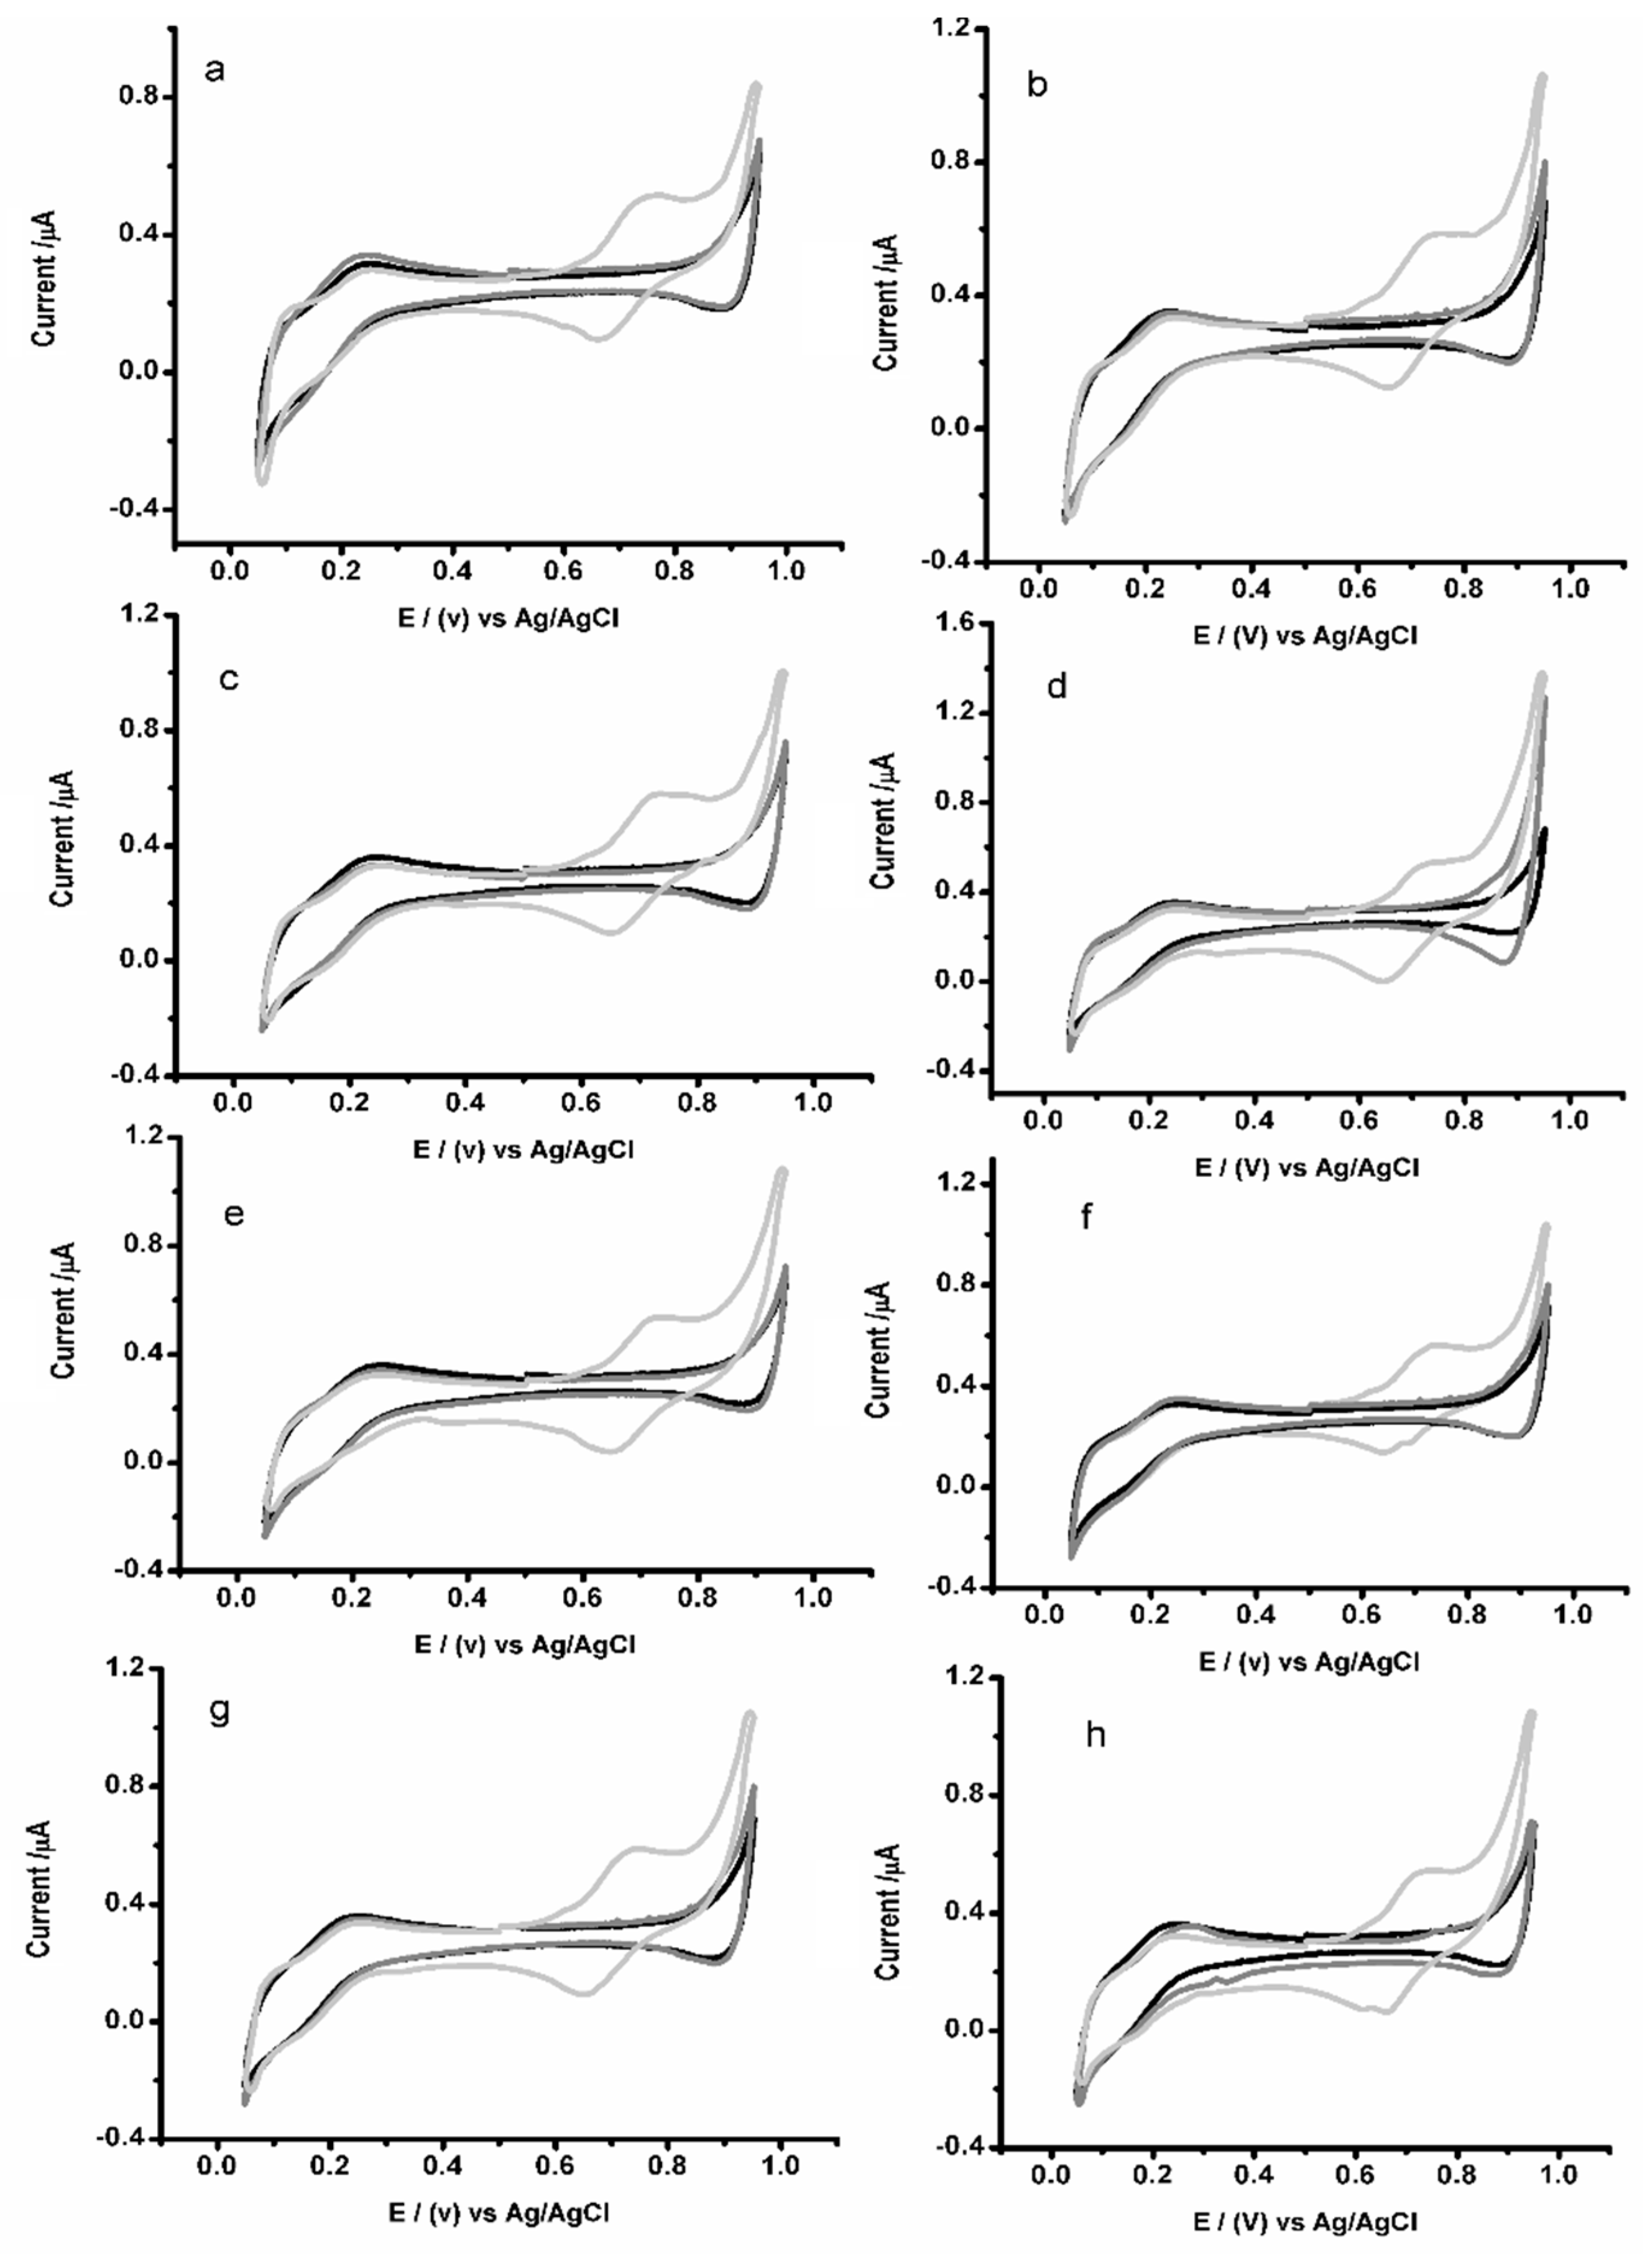
3.5. Impact of Potential Interfering Materials

The substances investigated, including ascorbic acid, sugar, amino acid, urea, and metal ions, are all models of substances possible in the biological samples [23,36,45]. The aqueous phase containing the DCF (40 µM) (as set up in Cell2) was spiked with individual interference substances at the concentration of 5.0 mM. The current signal for 40 µM individual DCF was determined in the absence and then in the presence of the interfering substances. In addition, TMA+ was added to every experiment as a potential axis reference ion. Figure 5 and Table 2 summarize the results obtained.
The possible interference of ascorbic acid was examined, and although ascorbic acid (pKa of 4.17) [23] was de-protonated in the aqueous solution containing DCF , no transfer of ascorbic acid was seen (Figure 5a). Glucose was also selected as sugar interference, and due to its an uncharged nature, it was not predicted to change the detection of DCF , since no ion transfer signal was observed (Figure 5b). The evaluation of the possible interference of metal ions such as Na+ and K+ were also undertaken (Figure 5c,d). Na+ and K+ ions are expected to reduce the potential window, because of their transfer at the positive limit of the potential window [23]. Addition also of Na2SO4 (Figure 5e) to the aqueous phase did alter the DCF ion transfer signal. The interference of urea (Figure 5f) and glycine (Figure 5g) were also examined and no transfer signal at the interface was observed. At physiological pH, urea and glycine are net neutral molecules; thus, no ion transfer signal behavior should be observed [23,63]. Since the stock solutions of the interfering substances were prepared in PBS solution, a control experiment to assess the influence of PBS on the CVs of the interfering substance was undertaken (Figure 5h). There was no effect on the CVs of interfering substances from the addition of PBS.
On the basis of DCF reverse and forward scan currents, the changes in current for the interfering substances present (% Relative difference, Table 2) ranged between 0.09 to 12.0% and 0.94 to 16.3%, respectively. Unlike the reverse scan, the forward scan was characterized by more sensitivity to substances with interfering potential. NaCl (Figure 5c) and urea (Figure 5e) appeared the highest current change for forward and reverse scans, respectively. Additionally, the overall variation within the DCF signal without interfering substances (%RSD percentage of 7.5 and 4.4% for reverse and forward scans, respectively), reflecting the experimental daily reproducibility for the experiments.

3.6. Analytical Characteristics

To assess parameters linearity, the limit of detection and performance of the proposed membrane, differential pulse voltammetry was employed to obtain the sharper and better peaks defined at a lower concentration than cyclic voltammetry with a lower charging current and improved resolution. In the beginning, a blank experiment (absent DCF) was recorded of the calibration procedure, then the background subtraction procedure was applied to further increase the sensitivity of the technique. Figure 6 shows the voltammograms and calibration curve obtained for the DCF concentrations ranging from 8 to 56 μM. Voltammograms exhibited that the peak current increased linearly as the DCF concentration increased. The scanning was in the negative direction and the peak for the ion transfer of DCF from the aqueous phase to the organic phase was found to be 0.23 ± 0.06 V.
Good linearity in the studied concentration range can be seen in Figure 6b for the peak currents obtained as a function of the diclofenac anion concentration. The limit of detection was calculated based on 3 times the standard deviation of the blank [64]. The limit of detection calculated from the fit line was found to be 1.5 µM. The method proposed for the indirect detection of diclofenac was compared with the traditional methods using the oxidation peak of the drug. LODs of 2.45 (DPV at a bare graphite electrode potentiodynamic pretreatment) [65], 9.1 μM (ion-selective electrode using chronopotentiometric methods) [66], 2.0 µm (vinylferrocene/multiwall carbon nanotubes using square wave voltammetry (SWV)) [67], 1.1 µm (based on batch injection analysis with amperometric detection) [68], 1.6 μM (based on electrooxidation at platinum electrode using (SWV)) [69], and 3.28 µm (DPV using tyrosine-modified carbon paste electrode) [46] have been reported for diclofenac. In addition to the comparison with the other developed membranes as sensing platforms previously reported [16], the analytical performances of type of membrane supported micro-interface were summarized in Table 3. The microporous membrane proposed demonstrated good performance in modifying a liquid–liquid interface and promising analysis to detect diclofenac as representative of nonsteroidal anti-inflammatory drugs. Nevertheless, the achieved limit of detection 1.5 μM DCF can be improved by using differential pulse stripping voltammetry (DPSV) as detection method, which has proven to offer improved detection capability [69,70].

4. Conclusions

The modification of interfaces between two immiscible electrolyte solutions by microporous silicon nitride membrane has been carried out and electrochemically characterized via ion transfer of TMA+. The resulting voltammograms appeared asymmetric behavior, which resulted steady state and peak-shaped due to a combination between the peak and steady-state behavior. The voltammetry of ion transfer of de-protonated diclofenac at microscale liquid–liquid interface was examined. Although ion transfer of DCF was close to the negative edge of the potential window, it is still possible to determine the half-wave potential, that allowed determination of some thermodynamic parameters for DCF, such as the partition coefficient and the Gibbs energy of transfer. The results obtained demonstrated also that no effect on the response signal of DCF transfer was observed. In addition, differential pulse voltammetry method was used successfully to detect lower concentrations of the diclofenac and the LOD was calculated to be 1.5 µM. The results presented here provide the basis for a simple and fast method with good selectivity and reproducibility.

Author Contributions

E.M.A.: investigation, formal analysis, writing—original draft preparation, methodology and data curation. N.A.Y. and J.A.: resources, visualization and supervision. R.M.Z.: conceptualization, writing—review and editing, project administration, funding acquisition and supervision. All authors have read and agreed to the published version of the manuscript.

Funding

This research was funded by Putra Grant, Universiti Putra Malaysia (GP-IPS/2018/9618600) and Libyan Ministry of Education for scholarship (MOE-LY).

Acknowledgments

Authors are grateful to the Deputy Dean of Universiti Putra Malaysia and Putra Grant, Universiti Putra Malaysia (GP-IPS) for the support. Eissa as one of authors would like to thank Libyan Ministry of Education for scholarship and Arrigan, D.W. for many helpful suggestions.

Conflicts of Interest

The authors declare no conflict of interest.

References

  1. Malkia, A.; Liljeroth, P.; Kontturi, K. Membrane activity of ionisable drugs—A task for liquid–liquid electrochemistry? Electrochem. Commun. 2003, 5, 473–479. [Google Scholar] [CrossRef]
  2. Arrigan, D.W.M. Bioanalytical detection based on electrochemistry at interfaces between immiscible liquids. Anal. Lett. 2008, 41, 3233–3252. [Google Scholar] [CrossRef]
  3. Liu, S.; Li, Q.; Shao, Y. Electrochemistry at micro-and nanoscopic liquid–liquid interfaces. Chem. Soc. Rev. 2011, 5, 2236–2253. [Google Scholar] [CrossRef] [PubMed]
  4. Liu, B.; Mirkin, M.V. Electrochemistry at microscopic liquid–liquid interfaces. Electroanalysis 2000, 18, 1433–1446. [Google Scholar] [CrossRef]
  5. Zazpe, R.; Hibert, C.; O’Brien, J.; Lanyon, Y.H.; Arrigan, D.W.M. Ion-transfer voltammetry at silicon membrane-based arrays of micro-liquid–liquid interfaces. Lab Chip 2007, 12, 1732–1737. [Google Scholar] [CrossRef] [PubMed]
  6. Strutwolf, J.; Scanlon, M.D.; Arrigan, D.W.M. Electrochemical ion transfer across liquid–liquid interfaces confined within solid-state micropore arrays–simulations and experiments. Analyst 2009, 1, 148–158. [Google Scholar] [CrossRef] [PubMed]
  7. Tong, Y.; Sun, P.; Zhang, Z.; Shao, Y. Fabrication of agar-gel microelectrodes and their application in the study of ion transfer across the agar–water|1,2-dichloroethane interface. J. Electroanal. Chem. 2001, 1, 52–58. [Google Scholar] [CrossRef]
  8. Shao, Y.; Mirkin, M.V. Voltammetry at micropipet electrodes. Anal. Chem. 1998, 15, 3155–3161. [Google Scholar] [CrossRef] [PubMed]
  9. Arrigan, D.; Herzog, G.; Scanlon, M.; Strutwolf, J. Bioanalytical applications of electrochemistry at liquid-liquid microinterfaces. Electroanal. Chem. Ser. Adv. 2013, 25, 105–178. [Google Scholar]
  10. Lee, H.J.; Beattie, P.D.; Seddon, B.J.; Osborne, M.D.; Girault, H.H. Amperometric ion sensors based on laser-patterned composite polymer membranes. J. Electroanal. Chem. 1997, 440, 73–82. [Google Scholar]
  11. Kralj, B.; Dryfe, R.A.W. Membrane voltammetry: The interface between two immiscible electrolyte solutions. Phys. Chem. Chem. Phys. 2001, 3, 5274–5282. [Google Scholar] [CrossRef]
  12. Peulon, S.; Guillou, V.; L’Her, M. Liquid|liquid microinterface. Localization of the phase boundary by voltammetry and chronoamperometry; influence of the microchannel dimensions on diffusion. J. Electroanal. Chem. 2001, 514, 94–102. [Google Scholar] [CrossRef]
  13. Sladkov, V.; Guillou, V.; Peulon, S.; L’Her, M. Voltammetry of tetraalkylammonium picrates at water|nitrobenzene and water|dichloroethane microinterfaces; influence of partition phenomena. J. Electroanal. Chem. 2004, 573, 129–138. [Google Scholar]
  14. Scanlon, M.D.; Herzog, G.; Arrigan, D.W.M. Electrochemical Detection of Oligopeptides at Silicon-Fabricated Micro-Liquid|Liquid Interfaces. Anal. Chem. 2008, 80, 5743–5749. [Google Scholar] [CrossRef] [PubMed]
  15. Arrigan, D.W.M. (Ed.) Electrochemical Strategies in Detection Science; Royal Society of Chemistry: London, UK, 2015. [Google Scholar]
  16. Goh, E.; Lee, H.J. Applications of electrochemistry at liquid–liquid interfaces for ionizable drug molecule sensing. Rev. Polarogr. 2016, 62, 77–84. [Google Scholar] [CrossRef] [Green Version]
  17. Herzog, G. Recent developments in electrochemistry at the interface between two immiscible electrolyte solutions for ion sensing. Analyst 2015, 140, 3888–3896. [Google Scholar] [CrossRef] [PubMed] [Green Version]
  18. Gulaboski, R.; Borges, F.; Pereira, C.M.; Cordeiro, M.N.D.S.; Garrido, J.; Silva, A.F. Voltammetric insights in the transfer of ionizable drugs across biomimetic membranes-Recent achievements. Comb. Chem. High Throughput Screen. 2007, 10, 514–526. [Google Scholar] [CrossRef]
  19. Alemu, H. Voltammetry of drugs at the interface between two immiscible electrolyte solutions. Pure Appl. Chem. 2004, 76, 697–705. [Google Scholar] [CrossRef]
  20. Bouchard, G.; Carrupt, P.A.; Testa, B.; Gobry, V.; Girault, H.H. Lipophilicity and solvation of anionic drugs. Chem. Eur. J. 2002, 8, 3478–3484. [Google Scholar] [CrossRef]
  21. Gulaboski, R.; Cordeiro, M.N.D.S.; Milhazes, N.; Garrido, J.; Borges, F.; Jorge, M.; Pereira, C.M.; Bogeski, I.; Morales, A.H.; Naumoski, B.; et al. Evaluation of the lipophilic properties of opioids, amphetamine-like drugs, and metabolites through electrochemical studies at the interface between two immiscible solutions. Anal. Biochem. 2007, 361, 236–243. [Google Scholar] [CrossRef] [Green Version]
  22. Sairi, M.; Arrigan, D.W.M. Electrochemical detection of ractopamine at arrays of micro-liquid|liquid interfaces. Talanta 2015, 132, 205–214. [Google Scholar] [CrossRef] [PubMed] [Green Version]
  23. Ribeiro, J.A.; Silva, F.; Pereira, C.M. Electrochemical study of the anticancer drug daunorubicin at a water/oil interface: Drug lipophilicity and quantification. Anal. Chem. 2013, 85, 1582–1590. [Google Scholar] [CrossRef] [PubMed]
  24. Lopes, P.; Kataky, R. Chiral interactions of the drug propranolol and α1-acid-glycoprotein at a micro liquid–liquid interface. Anal. Chem. 2012, 84, 299–2304. [Google Scholar] [CrossRef] [PubMed]
  25. Vazquez, P.; Herzog, G.; O’Mahony, C.; O’Brien, J.; Scully, J.; Blake, A.; O’Mathuna, C.; Galvin, P. Microscopic gel–liquid interfaces supported by hollow microneedle array for voltammetric drug detection. Sens. Actuators B Chem. 2014, 201, 572–578. [Google Scholar] [CrossRef] [Green Version]
  26. Elkady, E.F. Simultaneous determination of diclofenac potassium and methocarbamol in ternary mixture with guaifenesin by reversed phase liquid chromatography. Talanta 2010, 82, 604–1607. [Google Scholar] [CrossRef]
  27. Kaphalia, L.; Kaphalia, B.S.; Kumar, S.; Kanz, M.F.; Treinen-Moslen, M. Efficient high performance liquid chromatograph/ultraviolet method for determination of diclofenac and 4′-hydroxydiclofenac in rat serum. J. Chromatogr. B 2006, 830, 231–237. [Google Scholar] [CrossRef]
  28. Lee, H.S.; Jeong, C.K.; Choi, S.J.; Kim, S.B.; Lee, M.H.; Ko, G.; Sohn, D.H. Simultaneous determination of aceclofenac and diclofenac in human plasma by narrowbore HPLC using column-switching. J. Pharm. Biomed. Anal. 2000, 23, 775–781. [Google Scholar] [CrossRef]
  29. Yilmaz, B. GC–MS determination of diclofenac in human plasma. Chromatographia 2010, 71, 549–551. [Google Scholar] [CrossRef]
  30. Borenstein, M.R.; Xue, Y.; Cooper, S.; Tzeng, T.B. Sensitive capillary gas chromatographic-mass spectrometric-selected-ion monitoring method for the determination of diclofenac concentrations in human plasma. J. Chromatogr. B Biomed. Sci. Appl. 1996, 685, 59–66. [Google Scholar] [CrossRef]
  31. Matin, A.A.; Farajzadeh, M.A.; Jouyban, A. A simple spectrophotometric method for determination of sodium diclofenac in pharmaceutical formulations. Il Farm. 2005, 60, 855–858. [Google Scholar] [CrossRef]
  32. Souza, R.L.; Tubino, M. Spectrophotometric determination of diclofenac in pharmaceutical preparations. J. Braz. Chem. Soc. 2005, 16, 1068–1073. [Google Scholar] [CrossRef] [Green Version]
  33. Arancibia, J.A.; Boldrini, M.A.; Escandar, G.M. Spectrofluorimetric determination of diclofenac in the presence of α-cyclodextrin. Talanta 2000, 52, 261–268. [Google Scholar] [CrossRef]
  34. Sparidans, R.W.; Lagas, J.S.; Schinkel, A.H.; Schellens, J.H.M.; Beijnen, J.H. Liquid chromatography–tandem mass spectrometric assay for diclofenac and three primary metabolites in mouse plasma. J. Chromatogr. B 2008, 872, 77–82. [Google Scholar] [CrossRef] [PubMed]
  35. Chadha, R.; Kashid, N.; Jain, D.V.S. Kinetics of degradation of diclofenac sodium in aqueous solution determined by a calorimetric method. Die Pharm. Int. J. Pharm. Sci. 2003, 58, 631–635. [Google Scholar]
  36. Mofidi, Z.; Norouzi, P.; Seidi, S.; Ganjali, M.R. Determination of diclofenac using electromembrane extraction coupled with stripping FFT continuous cyclic voltammetry. Anal. Chim. Acta 2017, 972, 38–45. [Google Scholar] [CrossRef] [PubMed]
  37. Parvizi-Fard, G.; Alipour, E.; Sefidi, P.Y.; Sabzi, R.E. Pretreated Pencil Graphite Electrode as a Versatile Platform for Easy Measurement of Diclofenac Sodium in a Number of Biological and Pharmaceutical Samples. J. Chin. Chem. Soc. 2018, 65, 472–484. [Google Scholar] [CrossRef]
  38. Goyal, R.N.; Gupta, V.K.; Chatterjee, S. Electrochemical oxidation of 2′,3′-dideoxyadenosine at pyrolytic graphite electrode. Electrochim. Acta 2008, 53, 5354–5360. [Google Scholar] [CrossRef]
  39. Gupta, V.K.; Jain, A.K.; Maheshwari, G.; Lang, H.; Ishtaiwi, Z. Copper(II)-selective potentiometric sensors based on porphyrins in PVC matrix. Sens. Actuators B Chem. 2006, 117, 99–106. [Google Scholar] [CrossRef]
  40. Raoof, J.B.; Ojani, R.; Chekin, F.; Hossienzadeh, R. Carbon paste electrode incorporating 1-[4-(ferrocenyl ethynyl) phenyl]-1-ethanone for voltammetric determination of D-penicillamine. Int. J. Electrochem. Sci 2007, 2, 848–860. [Google Scholar]
  41. Karimi-Maleh, H.; Biparva, P.; Hatami, M. A novel modified carbon paste electrode based on NiO/CNTs nanocomposite and (9,10-dihydro-9,10-ethanoanthracene-11,12-dicarboximido)-4-ethylbenzene-1,2-diol as a mediator for simultaneous determination of cysteamine, nicotinamide adenine dinucleotide and folic acid. Biosens. Bioelectron. 2013, 48, 270–275. [Google Scholar]
  42. Hajjizadeh, M.; Jabbari, A.; Heli, H.; Moosavi-Movahedi, A.A.; Haghgoo, S. Electrocatalytic oxidation of some anti-inflammatory drugs on a nickel hydroxide-modified nickel electrode. Electrochim. Acta 2007, 53, 1766–1774. [Google Scholar] [CrossRef]
  43. Sarhangzadeh, K.; Khatami, A.A.; Jabbari, M.; Bahari, S. Simultaneous determination of diclofenac and indomethacin using a sensitive electrochemical sensor based on multiwalled carbon nanotube and ionic liquid nanocomposite. J. Appl. Electrochem. 2013, 43, 1217–1224. [Google Scholar] [CrossRef]
  44. Goyal, R.N.; Chatterjee, S.; Rana, A.R.S. The effect of modifying an edge-plane pyrolytic graphite electrode with single-wall carbon nanotubes on its use for sensing diclofenac. Carbon 2010, 48, 4136–4144. [Google Scholar] [CrossRef]
  45. Arvand, M.; Hassannezhad, M. Square wave voltammetric determination of uric acid and diclofenac on multi-walled carbon nanotubes decorated with magnetic core-shell Fe3O4@SiO2 nanoparticles as an enhanced sensing interface. Ionics 2015, 21, 3245–3256. [Google Scholar] [CrossRef]
  46. Chethana, B.K.; Basavanna, S.; Naik, Y.A. Voltammetric determination of diclofenac sodium using tyrosine-modified carbon paste electrode. Ind. Eng. Chem. Res. 2012, 51, 10287–10295. [Google Scholar] [CrossRef]
  47. Guzmán, M.F.; Álvarez-Romero, G.A.; Mendoza-Huizar, L.H.; Galán-Vidal, C.A.; Morales, G.R.; Ramírez-Silva, M.T.; Oca-Yemha, M.G.M. Optimization of a differential pulse voltammetric methodology for the quantification of diclofenac using paste electrodes and carbon nanotubes. ECS Trans. 2017, 76, 9–18. [Google Scholar] [CrossRef]
  48. Katano, H.; Tatsumi, H.; Senda, M. Ion-transfer voltammetry at 1,6-dichlorohexane|water and 1,4-dichlorobutane|water interfaces. Talanta 2004, 63, 185–193. [Google Scholar] [CrossRef]
  49. Godino, N.; Borrise, X.; Munoz, F.X.; Campo, F.J.; Compton, R.G. Mass transport to nanoelectrode arrays and limitations of the diffusion domain approach: Theory and experiment. J. Phys. Chem. C 2009, 113, 11119–11125. [Google Scholar] [CrossRef] [Green Version]
  50. Amatore, C.; Saveant, J.M.; Tessier, D. Charge transfer at partially blocked surfaces: A model for the case of microscopic active and inactive sites. J. Electroanal. Chem. Interfacial Electrochem. 1983, 147, 39–51. [Google Scholar] [CrossRef]
  51. Osborne, M.C.; Shao, Y.; Pereira, C.M.; Girault, H.H. Micro-hole interface for the amperometric determination of ionic species in aqueous solutions. J. Electroanal. Chem. 1994, 364, 155–161. [Google Scholar] [CrossRef]
  52. Bond, A.M.; Luscombe, D.; Oldham, K.B.; Zoski, C.G. A comparison of the chronoamperometric response at inlaid and recessed disc microelectrodes. J. Electroanal. Chem. Interfacial Electrochem. 1988, 249, 1–14. [Google Scholar] [CrossRef]
  53. Barhoumi, L.; Baraket, A.; Nooredeen, N.M.; Ali, M.B.; Abbas, M.N.; Bausells, J.; Errachid, A. Silicon Nitride Capacitive Chemical Sensor for Phosphate Ion Detection Based on Copper Phthalocyanine–Acrylate-polymer. Electroanalysis 2017, 29, 1586–1595. [Google Scholar] [CrossRef] [Green Version]
  54. Masuda, Y.; Inami, W.; Miyakawa, A.; Kawata, Y. Cell culture on hydrophilicity-controlled silicon nitride surfaces. World J. Microbiol. Biotechnol. 2015, 31, 1977–1982. [Google Scholar] [CrossRef] [PubMed]
  55. Barhoumi, H.; Maaref, A.; Jaffrezic-Renault, N. Experimental study of thermodynamic surface characteristics and pH sensitivity of silicon dioxide and silicon nitride. Langmuir 2010, 26, 7165–7173. [Google Scholar] [CrossRef] [PubMed]
  56. Reymond, F.; Chopineaux-Courtois, V.; Steyaert, G.; Bouchard, G.; Carrupt, P.A.; Testa, B.; Girault, H.H. Ionic partition diagrams of ionisable drugs: pH-lipophilicity profiles, transfer mechanisms and charge effects on solvation. J. Electroanal. Chem. 1999, 462, 235–250. [Google Scholar] [CrossRef]
  57. Goodarzian, M.; Khalilzade, M.A.; Karimi, F.; Gupta, V.K.; Keyvanfard, M.; Bagheri, H.; Fouladgar, M. Square wave voltammetric determination of diclofenac in liquid phase using a novel ionic liquid multiwall carbon nanotubes paste electrode. J. Mol. Liq. 2014, 197, 114–119. [Google Scholar] [CrossRef]
  58. Avdeef, A. The rise of PAMPA. Expert Opin. Drug Metab. Toxicol. 2005, 1, 325–342. [Google Scholar] [CrossRef]
  59. Ensafi, A.A.; Izadi, M.; Karimi-Maleh, H. Sensitive voltammetric determination of diclofenac using room-temperature ionic liquid-modified carbon nanotubes paste electrode. Ionics 2013, 19, 137–144. [Google Scholar] [CrossRef]
  60. Samec, Z. Electrochemistry at the interface between two immiscible electrolyte solutions (IUPAC Technical Report). Pure Appl. Chem. 2004, 76, 2147–2180. [Google Scholar] [CrossRef]
  61. Osborne, M.D.; Girault, H.H. Amperometric detection of the ammonium ion by facilitated ion transfer across the interface between two immiscible electrolyte solutions. Electroanalysis 1995, 7, 425–434. [Google Scholar] [CrossRef]
  62. Lam, H.T.; Pereira, C.M.; Roussel, C.; Carrupt, P.A.; Girault, H.H. Immobilized pH gradient gel cell to study the pH dependence of drug lipophilicity. Anal. Chem. 2006, 78, 1503–1508. [Google Scholar] [CrossRef] [PubMed] [Green Version]
  63. Chen, Y.; Yuan, Y.; Zhang, M.; Li, F.; Sun, P.; Gao, Z.; Shao, Y. Systematic study of the transfer of amino acids across the water/l,2-dichloroethane interface facilitated by dibenzo-18-crown-6. Sci. China Ser. B Chem. 2004, 47, 24–33. [Google Scholar] [CrossRef]
  64. Miller, J.C.; Miller, J.N. Statistics for analytical chemistry. Anal. Chim. Acta 1985, 177, 291–292. [Google Scholar] [CrossRef]
  65. Aguilar-Lira, G.Y.; Álvarez-Romero, G.A.; Zamora-Suárez, A.; Palomar-Pardavé, M.; Rojas-Hernández, A.; Rodríguez-Ávila, J.A.; Páez-Hernández, M.E. New insights on diclofenac electrochemistry using graphite as working electrode. J. Electroanal. Chem. 2017, 794, 182–188. [Google Scholar] [CrossRef]
  66. Brennan, E.; Futvoie, P.; Cassidy, J.; Schazmann, B. An ionic liquid-based sensor for diclofenac determination in water. Int. J. Environ. Anal. Chem. 2017, 97, 588–596. [Google Scholar] [CrossRef]
  67. Mokhtari, A.; Karimi-Maleh, H.; Ensafi, A.A.; Beitollahi, H. Application of modified multiwall carbon nanotubes paste electrode for simultaneous voltammetric determination of morphine and diclofenac in biological and pharmaceutical samples. Sens. Actuators B Chem. 2012, 169, 96–105. [Google Scholar] [CrossRef]
  68. Gimenes, D.T.; Cunha, R.R.; Carvalho Ribeiro, M.M.A.; Pereira, P.F.; Muñoz, R.A.A.; Richter, E.M. Two new electrochemical methods for fast and simultaneous determination of codeine and diclofenac. Talanta 2013, 116, 1026–1032. [Google Scholar] [CrossRef]
  69. Ciltas, U.; Yilmaz, B.; Kaban, S.; Akcay, B.K.; Nazik, G. Square wave voltammetric determination of diclofenac in pharmaceutical preparations and human serum. Iran. J. Pharm. Res. IJPR 2015, 14, 715. [Google Scholar]
  70. Collins, C.J.; Arrigan, D.W.M. Ion-transfer voltammetric determination of the β-blocker propranolol in a physiological matrix at silicon membrane-based liquid| liquid microinterface arrays. Anal. Chem. 2009, 81, 2344–2349. [Google Scholar] [CrossRef]
  71. Collins, C.J.; Lyons, C.; Strutwolf, J.; Arrigan, D.W.M. Serum-protein effects on the detection of the β-blocker propranolol by ion-transfer voltammetry at a micro-ITIES array. Talanta 2010, 80, 1993–1998. [Google Scholar] [CrossRef]
  72. Kim, H.R.; Pereira, C.M.; Han, H.Y.; Lee, H.J. Voltammetric studies of topotecan transfer across liquid–liquid interfaces and sensing applications. Anal. Chem. 2015, 87, 5356–5362. [Google Scholar] [CrossRef] [PubMed]
  73. Ortuno, J.A.; Sanchez-Pedreno, C.; Gil, A. Flow-injection pulse amperometric detection based on ion transfer across a water-plasticized polymeric membrane interface for the determination of verapamil. Anal. Chim. Acta 2005, 554, 172–176. [Google Scholar] [CrossRef]
  74. Ortuno, J.A.; Gil, A.; Sanchez-Pedreno, C. Flow-injection pulse amperometric detection based on ion transfer across a water-plasticized polymeric membrane interface for the determination of imipramine. Sens. Actuators B Chem. 2007, 122, 369–374. [Google Scholar] [CrossRef]
Figure 1. Chemical structure of diclofenac sodium.
Chemosensors 08 00011 g001
Figure 2. SEM image of the center to center separation of micro-pore array silicon nitride membrane (a), and SEM of a single micropore (b).
Chemosensors 08 00011 g002
Figure 3. Voltammograms of TMA+ transfer at various concentrations 20, 40, 60, 80, and 100 µM (as an arrow indicated) at scan rate 10 mV/s (a). The calibration curve of the limiting and peak current for the forward (positive) and reverse (negative) scans, respectively, versus TMA+ concentrations (b).
Chemosensors 08 00011 g003
Figure 4. (a) Background-subtracted CVs of 20 to 100 μM (as indicated arrow) DCF transfer, in increments of 20 μM, at scan rate 10 mVs−1. (b) The calibration curve of the limiting currents (forward scan) and peak currents (reverse scan) versus DCF concentrations(c) voltammograms of 100 μM (black line) DCF and 60 μM (gray line) TMA+.
Chemosensors 08 00011 g004
Figure 5. Influence of the individual interfering substances at micro-ITIES arrays, background-subtracted CVs of 40 µM DCF (black line), 40 µM DCF with the interfering substances (dark grey line), and 40 µM DCF with the interfering substance (5.0 mM) and 120 µM TMA+ (light grey line). The interfering substances selected: (a) L-ascorbic acid, (b) D-glucose, (c) NaCl, (d) KCl, (e) urea, (f) Na2SO4, (g) glycine, and (h) PBS solution without the interfering substance (control). The concentration of interfering substance in all experiments was 5.0 mM and at scan rate 10 mVs−1.
Chemosensors 08 00011 g005
Figure 6. (a) DPV of different concentrations of DCF (as arrow indicated) (8, 16, 24, 32, 40, 48, and 56 µM) at the water/1,6-DCH micro-interface. (b) Calibration curve for DCF ion transfer.
Chemosensors 08 00011 g006
Table 1. Formal transfer potential, the standard Gibbs energy of transfer and the partition coefficient of ionized diclofenac drug in the water/1,6-DCH system.
Parameter DCF
p K a 4.0 ± 0.02 a
Δ D C E w ° (V) 0.32 ± 0.06
( Δ G t r , D C F 0 ,   w o ) (kJ mol−1)30.8 ± 0.09
l o g P D C F °   (ionised) 5.4 ± 0.12
l o g P n o c t °   ( neutral ) 3.24 ± 0.05 a
a Data obtained from [56].
Table 2. Effect of the potential interfering substances on the determination of diclofenac ( DCF ) at the microscale ITIES array a.
Interfering SubstanceForward ScanReverse Scan
I D C F / μ A
(±s; n = 3)
I D C F + I n t e r f e r i n g / μ A
(±s; n = 3)
Relative Difference (%) b I D C F / μ A
(±s; n = 3)
I D C F + I n t e r f e r i n g / μ A
(±s; n = 3)
Relative Difference (%)
Ascorbic acid0.200 ± 0.0110.233 ± 0.01811.50.174 ± 0.220.161 ± 0.014.6
Glucose0.189 ± 0.0150.194 ± 0.0232.50.135 ±0.430.133 ± 0.041.5
NaCl0.217 ± 0.0260.214 ± 0.01216.30.162 ± 0.150.154 ± 0.044.9
KCl0.204 ± 0.0170.215 ± 0.0115.40.172 ±0. 120.155 ± 0.029.9
Na2SO40.205 ± 0.0160.211 ± 0.0132.90.156 ±0.340.150 ± 0.0170.09
Urea0.213 ± 0.0210.211 ± 0.0150.940.166 ±0. 190.146 ± 0.01812.0
Glycine0.212 ± 0.0170.191 ± 0.029.40.152 ± 0. 110.134 ± 0.01611.8
PBS0.211 ± 0.0270.213 ± 0.050.950.160 ± 0. 230.158 ± 0.0131.25
Mean (±s; n = 8)0.206 ± 0.009--0.160 ± 0.012--
a The concentration of DCF and the interfering substance selected in all experiments were 40 µM and 5.0 mM, respectively. s = standard deviation; b Relative difference (%) = I ( D C F + i n t e r f e r e n c e ) I D C F I D C F × 100.
Table 3. Comparison of the micro-porous Si3N4 membrane with other reported membranes as ion detection platforms for different drug molecules.
DrugType InterfaceDetection MethodLOD (µM)Ref.
RactopamineMicro-hole array supported silicon membrane with PVC-1,6-DCH gelLSSV0.1[22]
DaunorubicinMicro-hole array supported PET film with 1,6-DCHDPV0.8[23]
PropranololHollow silicon microneedle array with PVC-1,6-DCH gelDPSV0.05[25]
Micro-porous array modified silicon membrane with PVC-NPOE gelDPV0.1[70]
Micro-porous array modified silicon membrane with PVC-1,6-DCH gelDPV4[71]
TopotecanA micro-hole supported PET film with PVC-NPOE gelDPSV0.1[72]
ImipraminePVC plasticized membrane with NPOEFlow-injection pulse1[73]
VerapamilPVC plasticized membrane with NPOEFlow-injection pulse5[74]
DiclofenacMicro-porous array Supported silicon nitride membrane with 1,6-DCHDPV1.5This work
PVC: poly(vinyl chloride); NPOE: 2-nitrophenyl octyl ether; PET: polyethylene terephthalate; DPSV: differential pulse stripping voltammetry; LSSV: linear sweep stripping voltammetry.

