Article

Microwave-Assisted Synthesis of Amikacin Modified N,S co-Doped Carbon Dots for Escherichia coli Detection

by
Fajar Amelia Rachmawati Putri
1,
Mudasir Mudasir
1,
Kinichi Morita
2 and
Suherman Suherman
1,*
1
Department of Chemistry, Faculty of Mathematics and Natural Sciences, Universitas Gadjah Mada, Sekip Utara Kotak Pos 21, Yogyakarta 55281, Indonesia
2
New Business Development Office, Corporate R&D Division, Ushio INC. 1-6-5 Marunouchi, Chiyoda-ku, Tokyo 100-8150, Japan
*
Author to whom correspondence should be addressed.
Chemosensors 2019, 7(4), 61; https://doi.org/10.3390/chemosensors7040061
Submission received: 1 October 2019 / Revised: 18 November 2019 / Accepted: 25 November 2019 / Published: 28 November 2019

Abstract

:
Fluorescent amikacin modified nitrogen, sulfur co-doped carbon dots (amikacin modified N,S-CDs) were synthesized by a facile and low-cost one-step microwave-assisted specifically for selective detection of Gram-negative bacteria Escherichia coli (E. coli). Amikacin is a semi-synthetic amino glycoside antibiotic and it was employed in this study to increase the fluorescence response of N,S-CDs by providing binding ligand towards E. coli. The effect of thiourea content as the source of nitrogen and sulfur dopants was investigated prior to the preparation of amikacin modified N,S-CDs. The formation of amikacin modified N,S-CDs were characterized by using Fourier transform infrared (FTIR), X-ray diffraction (XRD), Transmission electron microscope (TEM), UV-Vis spectrophotometer, and spectrofluorometer. Amikacin modified N,S-CDs was identified to be successfully synthesized from the wavenumber shift of the C=O stretching mode. Amikacin modified N,S-CDs were amorphous with an average size of 7 nm. Fluorescence spectra showed that the highest intensity was obtained at thiourea content of 50% and amikacin mass of 25 mg. By comparing fluorescence responses of all the investigated amikacin modified N,S-CDs, the limit of detection (LOD) was attained by 25 mg amikacin modified N,S-CDs at 1.526 cfu mL−1.

1. Introduction

The contamination of Escherichia coli (E. coli) in water resources remains a serious environmental problem. 844 million people still lacked a basic drinking water service either utilize developed sources with a period of water collection more than 30 min. (limited services), employ exposed wells and springs (unimproved sources), or by using water straight from surface water sources, based on WHO and UNICEF data in 2015 [1]. Recently, the fluorescence-based method is used for bacterial detection. This method has drawn considerable concern, since it offers good selectivity, high sensitivity, and affordable means [2]. The fluorescence-based technique has been developed to overcome the constraints of conventional methods, namely sensitivity and time. Carbon dots (CDs) is one of the materials used based on fluorescence method.
The CDs particularly size less than 10 nm and possess recognizable benefits, such as excellent water solubility and convenient functionalization, with diverse organic, polymeric, as well as inorganic compounds. Furthermore, CDs possess low toxicity and favorable compatibility, and therefore can be used as an eco-friendly alternative for biological purposes [3,4]. In addition, CDs offer cost-effective and rapid synthetic routes for the preparation and application [3]. Many techniques have been conducted to synthesize CDs, such as on hydrothermal, solvothermal, and microwave synthesis [4]. In terms of the simple fabrication method, a novel one-pot hydrothermal was introduced to synthesize graphene quantum dots (GQDs) with two functional groups (-OH and -NH2) while using a polycyclic aromatic hydrocarbon as the precursor [5]. Applying the pyrolysis method is another way of preparing CDs in a facile synthetic route. The nitrogen-doped CDs (N-CDs) with excellent stability were directly synthesized within seven min. by pyrolyzing ethanolamine under air environment [6]. One application of CDs as a bacterial detector is utilizing amphiphilic CDs to perform detection and imaging of bacteria based on the attachment of synthesized material to bacterial cell surfaces. The study showed that amphiphilic CDs could bind to bacterial cells after incubation for 3 h and allowed for bacterial detection through both fluorescence spectroscopy and microscopy [7]. The modification of CDs can be done by using mannose and folic acids, which further to label E. coli bacteria within 1-h incubation [2]. The short period of incubation was also used for pathogenic bacteria detection utilizing magnetic CDs that were synthesized from magnetic nanoparticles and chitosan [8]. When considering these previous studies, fluorescent CDs are capable of greatly reducing the incubation period as a means to attain short to real-time detection.
Despite having various outstanding performances, CDs still show relatively low intensity of fluorescence emission and offer a challenge for improving it. Modification of functional groups on the CDs surface is necessary for enhancing the intensity, and many researchers have performed doping with different atoms. The increment of intensity by heteroatom doping into CDs is caused by the changing of their electronic and chemical properties from the atoms [9].
Although the short duration of incubation has been discovered, selectivity as another main feature of bacterial detection is still a major flaw that constricts their practical application. Therefore, in this research, amikacin was introduced for improving the selectivity of synthesized CDs. Amikacin belongs to the aminoglycoside group of antibiotics and is well-known to be active against key Gram-negative bacteria. Amikacin is used to medicate urinary tract infections caused by E. coli and Klebsiella pneumoniae. Treatment with amikacin is also considered to be a safe alternative treatment option with high efficiency [10]. Previous research has reported a strategy to detect E. coli by modifying CDs while using colistin and found a linear relationship between concentrations of E. coli and fluorescent intensity of CDs colistin [11].
In this work, CDs were synthesized while using citric acid as the carbon source. Citric acid was chosen, since it is environmentally benign and contains hydroxyl groups that give CDs high water solubility. For the purpose of intensifying fluorescence emission, doping with different atoms was conducted by employing thiourea that served as N and S-containing precursors. Heteroatom doping into CDs has become an effective strategy for elevating the intensity of fluorescence emission. Amikacin was introduced through the microwave-assisted solid-phase synthesis in order to enhance the affinity and selectivity of N,S-CDs towards E. coli.

2. Materials and Methods

2.1. Materials

Citric acid monohydrate (C6H8O7·H2O) and thiourea (CH4N2S) were purchased from Wako Pure Chemical Corporation-Japan, while amikacin (C22H43N5O13) was obtained from Sigma-Aldrich (Massachussets, USA). NaCl, CH3COOH, CH3COONa, H3PO4, NaH2PO4, Na2HPO4, NaOH, phosphate buffer saline (PBS) pH 7.4, and 0.1 μm filter membrane were provided by Merck (Darmstadt, Germany). All of the chemicals were used as received without further purification. The E. coli and Staphylococcus aureus (S. aureus) in concentration of 1 × 10⁵ cfu mL−1 in PBS (pH 7.4) were purchased from Microbiology Laboratory of Veterinary Medicine, Universitas Gadjah Mada (UGM). The E. coli bacteria were cultured in sterile Luria Bertani media that consisted of bacto-yeast extract, tryptone, and NaCl in deionized water. Commercially bottled mineral water was used for the detection of E. coli bacteria in real sample.

2.2. Characterization

All of the fluorescence measurements were carried out while using Shimadzu RF-6000 (Kyoto, Japan) with xenon lamp as the source of excitation. UV-vis spectrophotometer JASCO V-670 (Tokyo, Japan) was employed to record the UV-vis absorption spectra. Fourier transform infrared (FTIR) spectra were measured on a Shimadzu IR Prestige-21, Fourier transform infrared spectrometer (Kyoto, Japan) with potassium bromide pellet technique that ranged from 400 to 4000 cm−1. The transmission electron microscope (TEM) image was recorded while using JEOL-JEM 1400 (Tokyo, Japan). The sample for TEM characterization was prepared by placing a drop of amikacin modified N,S-CDs solution on carbon-coated copper grid, followed by drying in air. X-ray diffraction (XRD) patterns were collected on a Miniflex Rigaku (Tokyo, Japan) that was equipped with Cu Kα radiation (λ = 0.154 nm). Proton nuclear magnetic resonance (1H-NMR) spectra were recorded on a JNM-ECZ500R (Tokyo, Japan), 500 Mhz Super Conductive Magnets.

2.3. Synthesis of N,S-CDs

The N,S-CDs were synthesized by microwave-assisted treatment of citric acid and thiourea as the source of C and N-S, respectively. The effect of thiourea concentration was investigated by mixing 0.3 g of citric acid with various ratios of thiourea to citric acid mass, which were 0, 10, 25, 50, 75, and 100%. The solution was then heated in a microwave reactor of 180 °C for 30 min. The obtained products were dissolved in 25 mL. The purification products were conducted by centrifugation at 10000 rpm for 30 min. to remove the large solids, followed by filtration via a 0.1 μm filter membrane (Table S1 in Supplementary Material illustrates detailed variations).

2.4. Synthesis of Amikacin Modified N,S-CDs

Amikacin modified N,S-CDs were synthesized by the same method while using the optimized percentage of thiourea that was obtained from previous means. The optimized ratio of thiourea to citric acid was separately mixed with various masses of amikacin, which were 12.5, 25, 50, and 75 mg (the information about the parameters used are designated in Table S1 in Supplementary Material).

2.5. Detection E. coli Bacteria

E. coli concentration of 1 × 10⁵ cfu mL−1 was dissolved for the range of 3.75 × 10² to 1.2 × 10⁴ cfu mL−1 in PBS solution pH 7.4 with a total volume of 10 mL. Each concentration of bacteria in 3 mL, 0.1 mL of all varied amikacin modified N,S-CDs were added separately and continued by vortexing for 5 min. Gentle shaking with orbital shaker was then performed at 200 rpm for 60 min. at room temperature. The same steps of the procedure were also carried out to compare the fluorescence response of amikacin modified N,S-CDs and N,S-CDs for sensing E. coli in a concentration of 1.2 × 10⁴ cfu mL−1. The fluorescence spectra were eventually collected at 360 nm with the dilution of the samples up to 50 times. The selectivity of amikacin modified N,S-CDs was also examined towards E. coli and S.aureus in a concentration of 1.2 × 10⁴ cfu mL−1, respectively.

2.6. Detection of E. coli Bacteria in Real Samples

The E. coli concentration of 1 × 10⁵ cfu mL−1 was diluted for the range of 3.75 × 10² to 1.2 × 10⁴ cfu mL−1 in commercially bottled mineral water with a total volume of 10 mL. Amikacin modified N,S-CDs with highest labeling efficiency was then added to 3 mL of each concentration of bacteria. The fluorescence spectra were recorded at optimum excitation wavelength by spectrofluorometer by applying the same procedure of detection of E. coli in PBS.

3. Results and Discussion

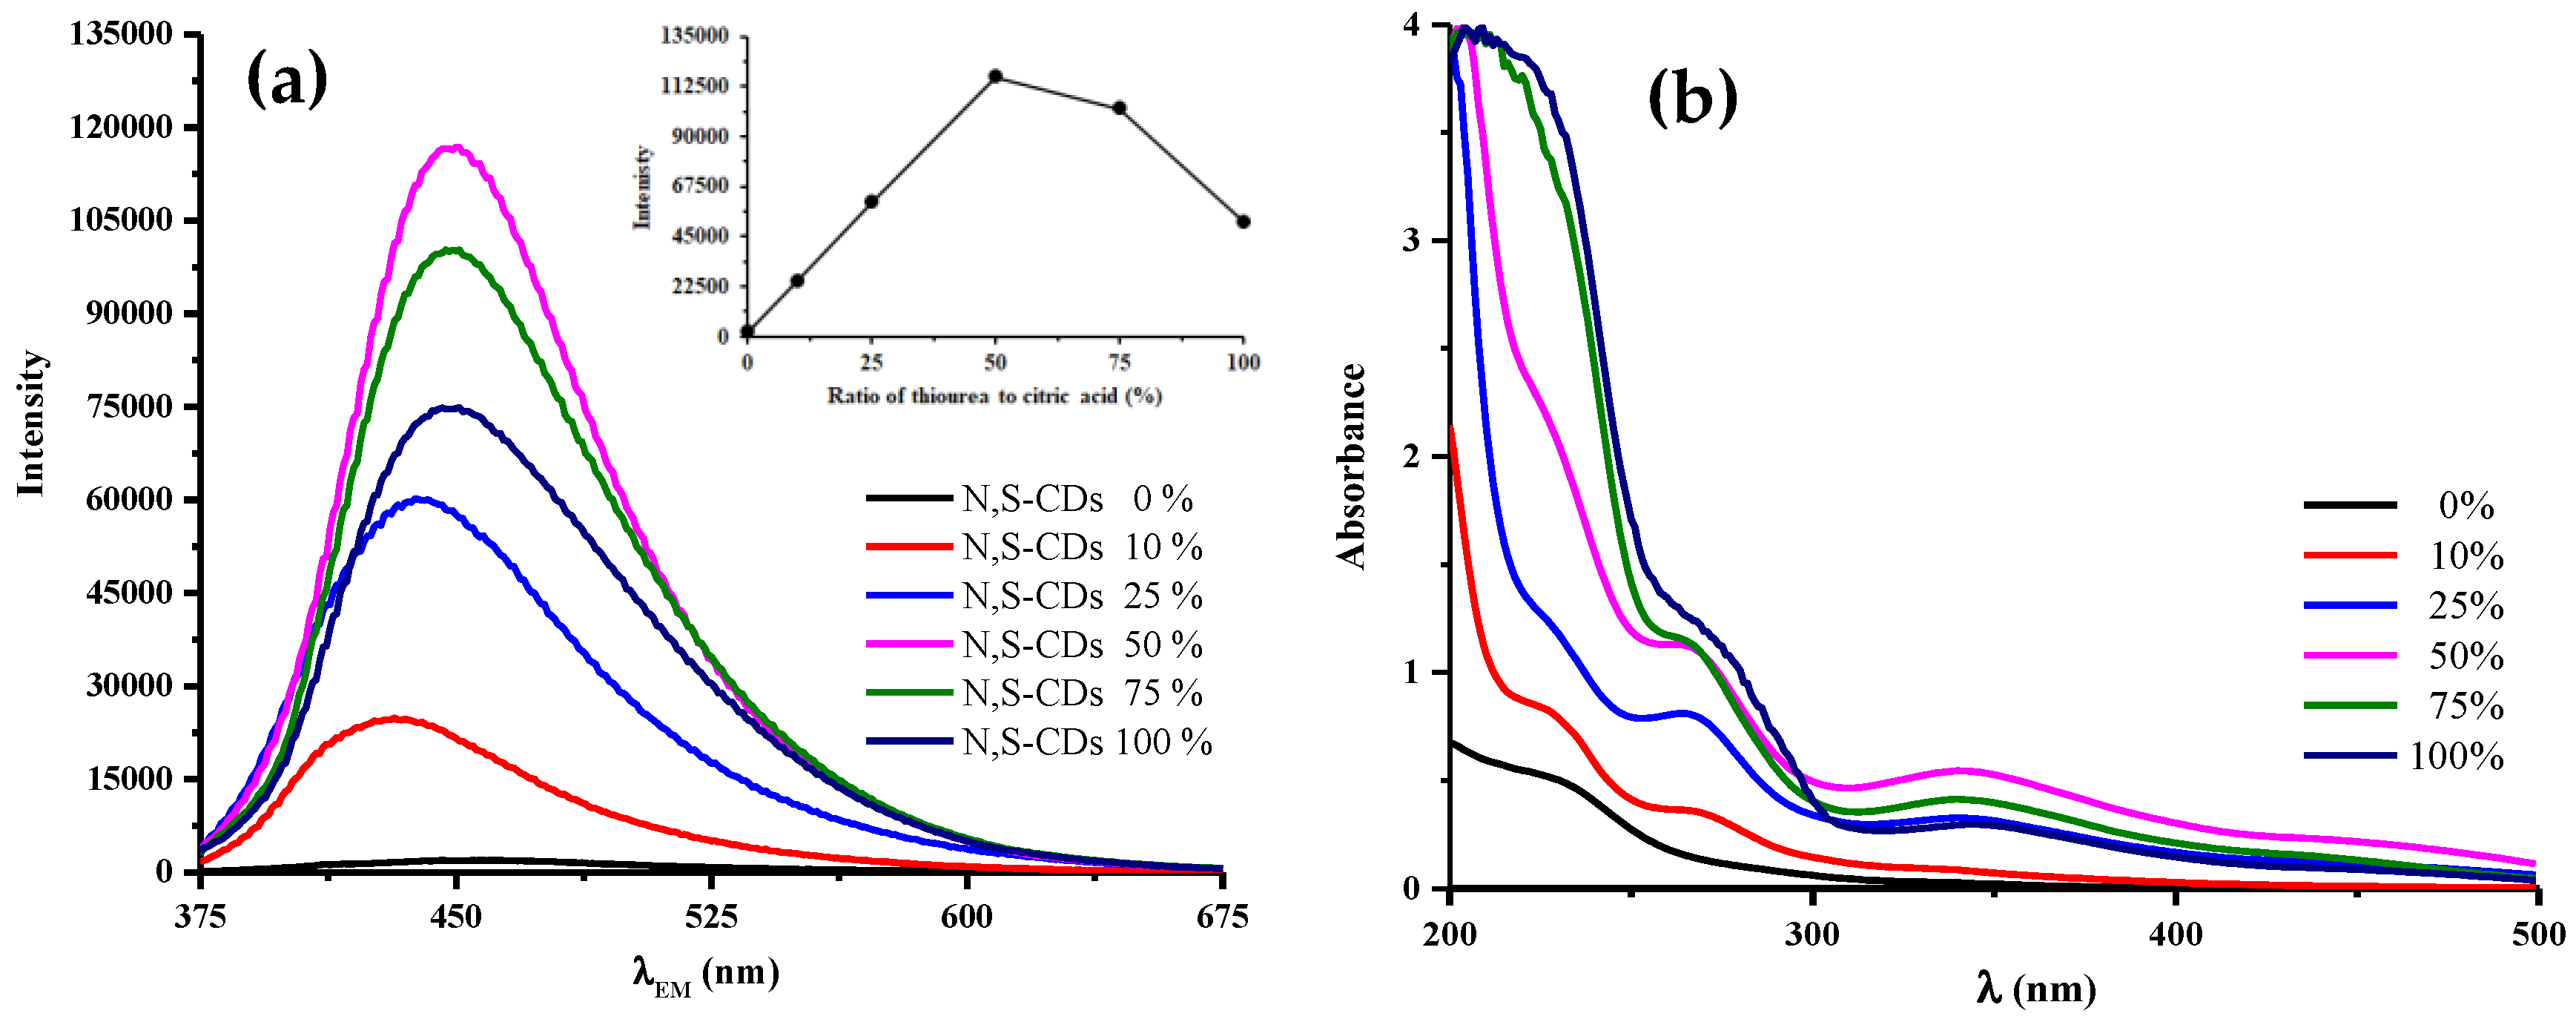
3.1. Optimization of Thiourea Content in N,S-CDs

The effect of N and S atoms incorporation into CDs was carried out by varying contents of thiourea added to citric acid. Figure 1a depicts the fluorescence intensities at excitation wavelength of 360 nm was steadily enhanced along with higher thiourea content and it reached a maximum at 50%. The elevation of N,S-CDs fluorescence intensities could be attributed to the doping of N and S atoms, as they give extra electron for n-type doping. This type of doping favors the radiative relaxation pathway which affects the fluorescence intensity [12]. The abundant functional groups containing heteroatom were able to give new excitation energy traps, leading to the enhancement of fluorescence intensity [13]. The introduction of N and S atoms into CDs provided a new kind of surface states (labeled as the N- and S-state), where the excited electrons were trapped. This process brought the consequence of the high intensity of radiative recombination [14].
The decrement of fluorescence intensities appears to be due to the higher ratios of thiourea leading to a further carbonization stage that is indicated by UV-Vis absorption spectra, as shown in Figure 1b. The higher absorbance at ca. 260 nm represents π-π* transitions of the aromatic C=C [15] and signifies an abundant sp2 domain. This carbonic core had no contribution to intensify fluorescence intensity, which suggests that the generation of fluorescence was not from electronic conjugate structures [14]. This phenomenon was emphasized by the lower absorbance peak that was centred at 340 nm attributed to n-π* transitions originated from excited state energy traps of the surface states [16]. It asserts the origin of fluorescence emission, stating that the higher fluorescence intensity has resulted from the introduction of N and S atoms.

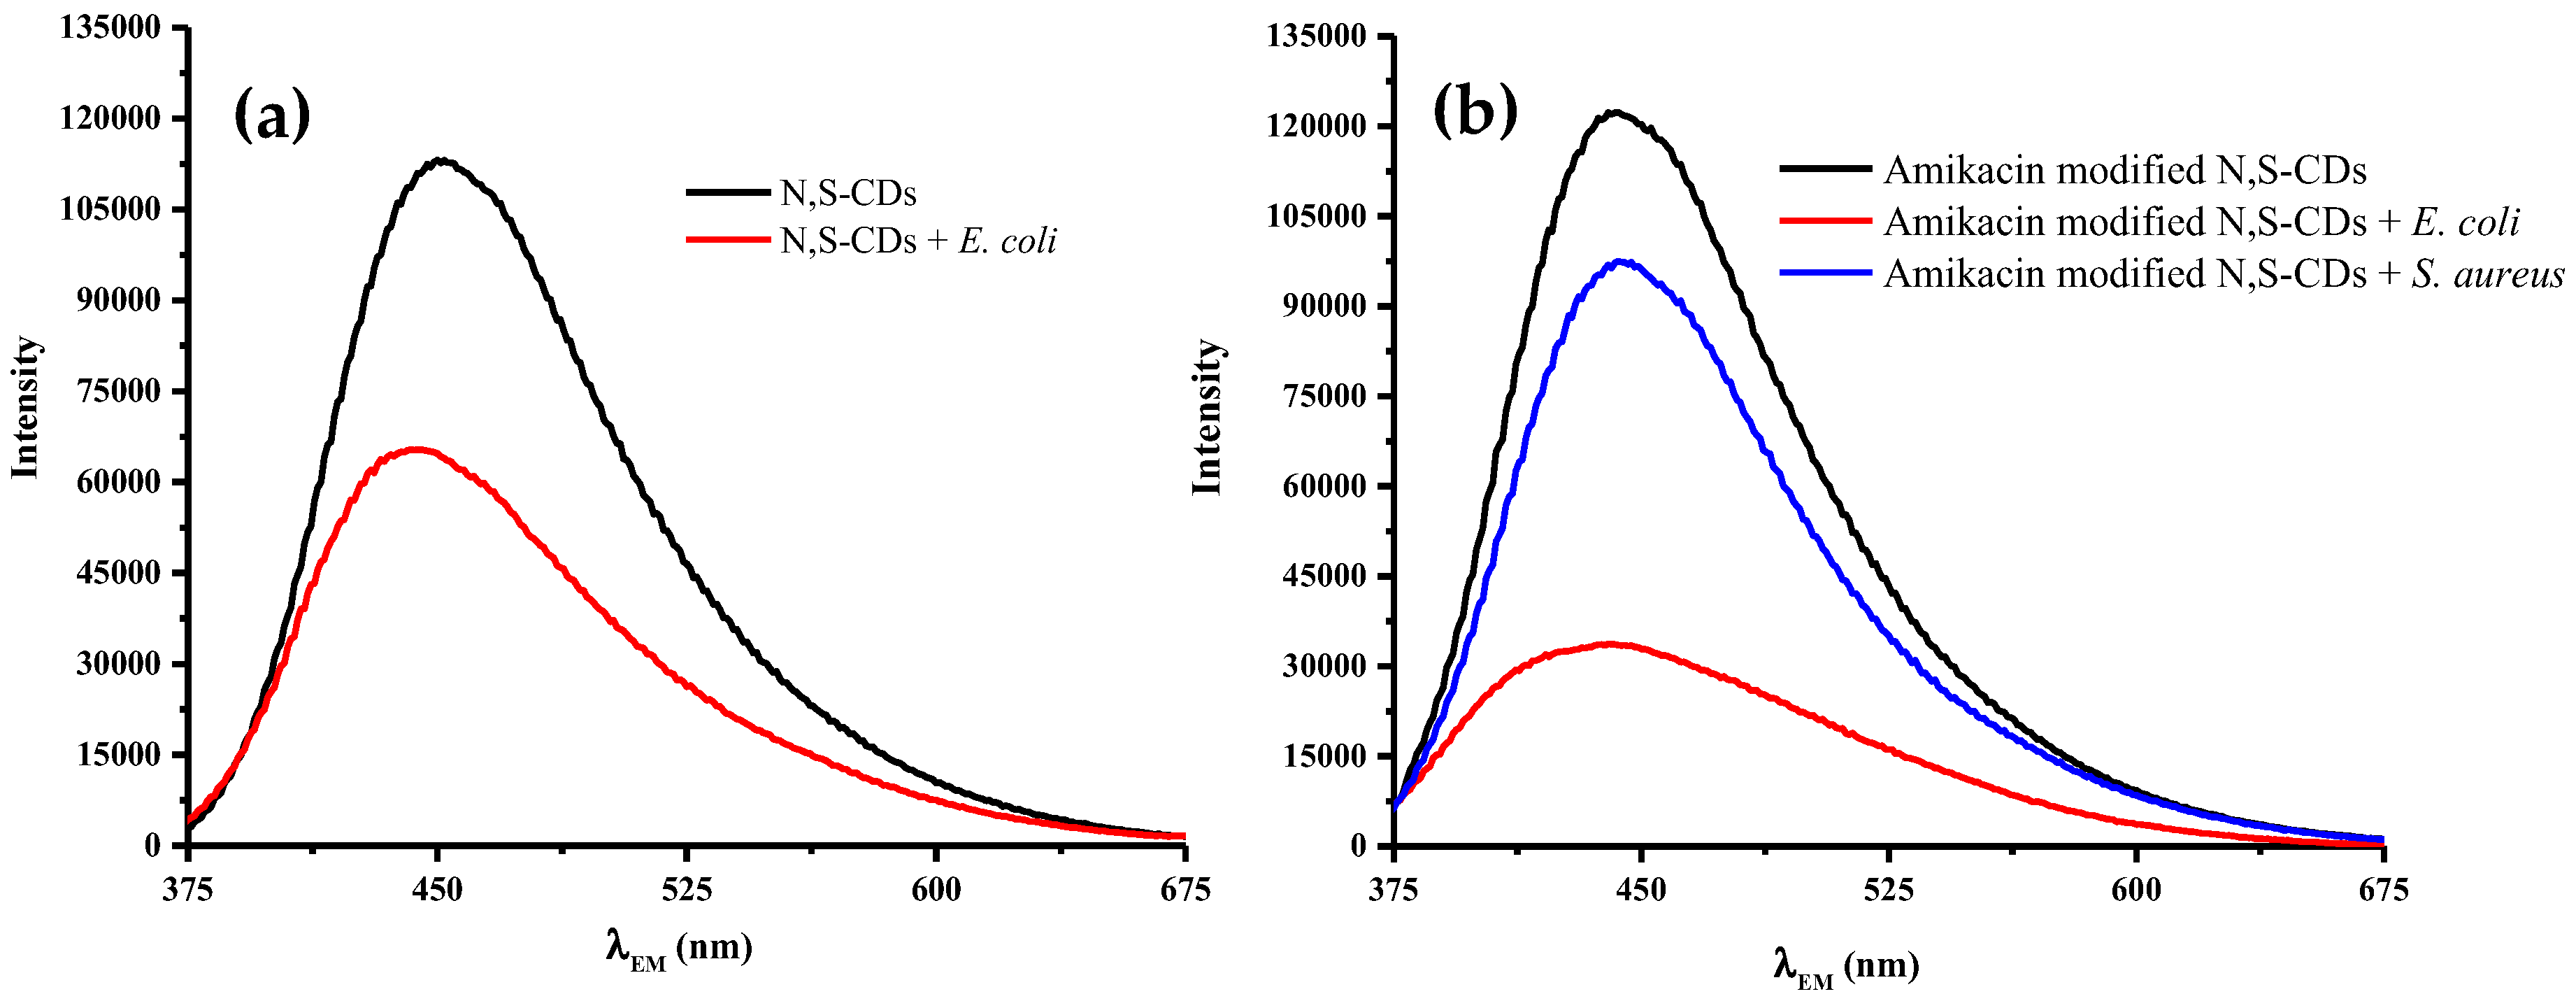
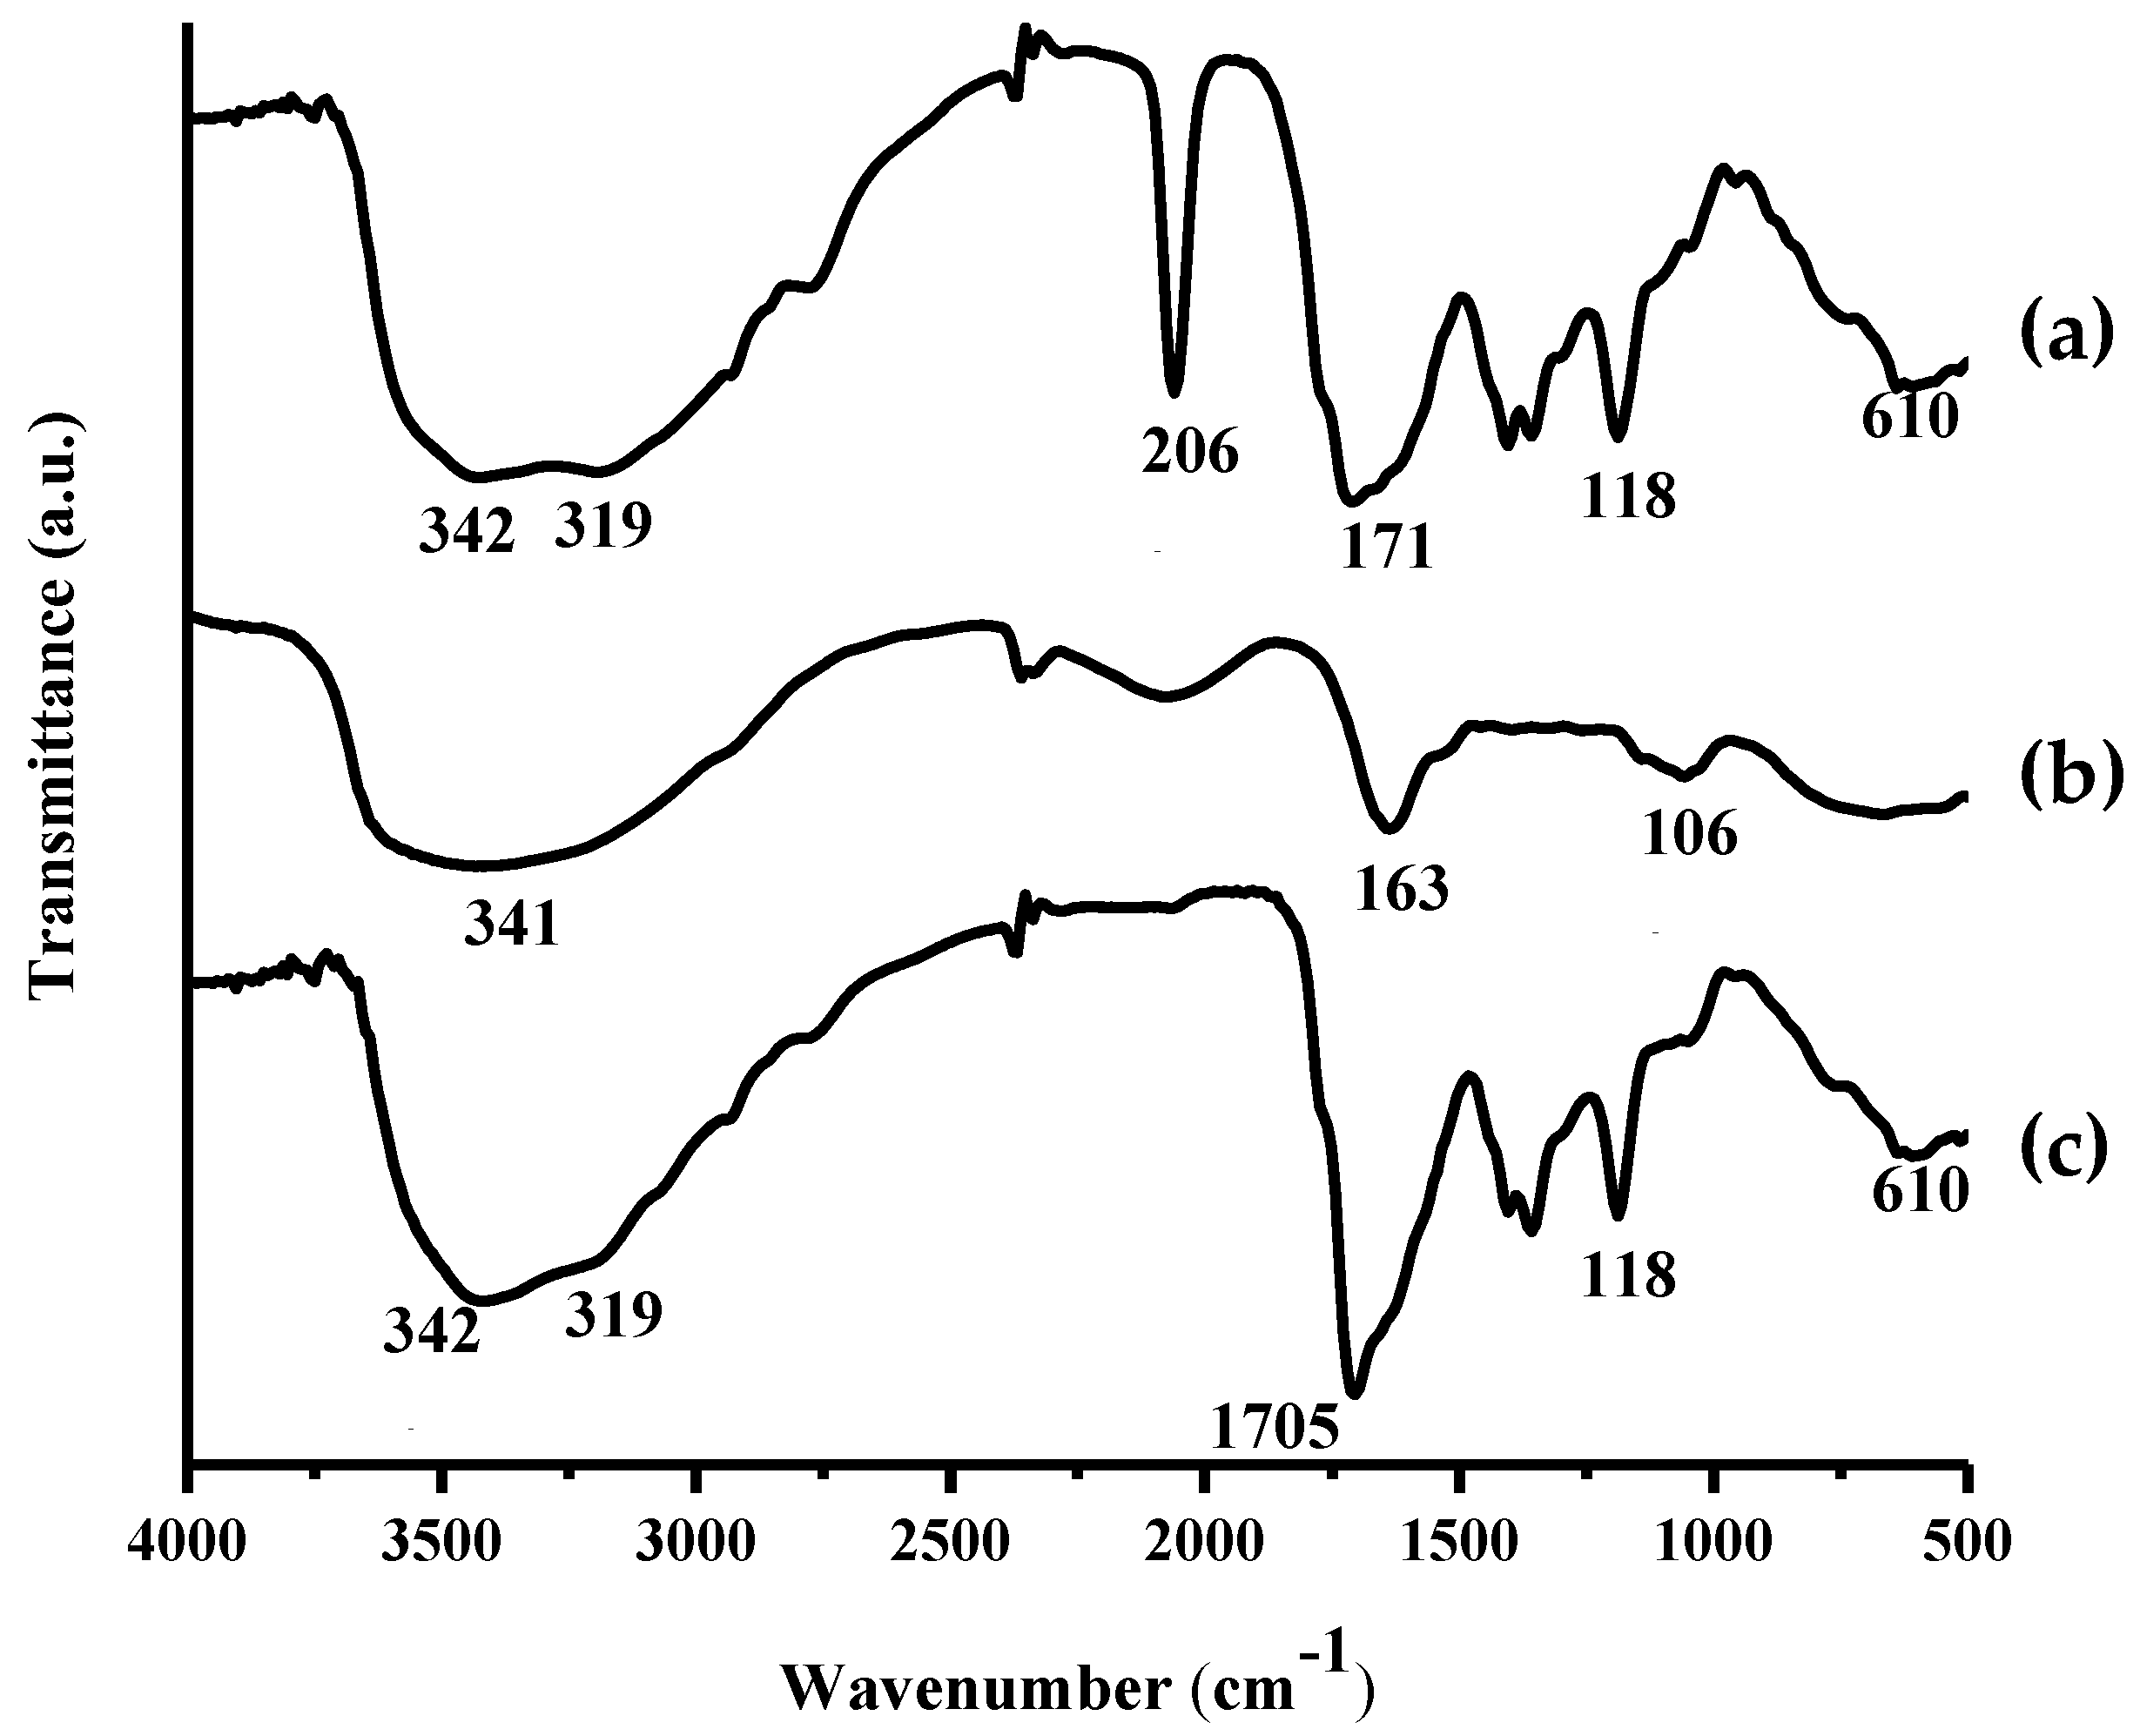
3.2. Synthesis of Amikacin Modified N,S-CDs

Based on the spectra depicted in Figure 2, N,S-CDs and amikacin modified N,S-CDs showed similar bands almost at entire wavenumbers, however two distinctive bands were observed. The similar wavenumbers meant that the surface of amikacin modified N,S-CDs had the same functional groups as N,S-CDs. However, the first discrepancy that can be observed is the vibrational band at 2060 cm−1 of amikacin modified N,S-CDs that indicates that the addition of amikacin prevents the formation of –SCN bond. Secondly, the shifting of C=O stretching vibration at around 1713 cm−1 of N,S-CDs to 1705 cm−1 of amikacin modified N,S-CDs exhibited amide bond formation at the surface of N,S-CDs. It signifies that the interaction between N,S-CDs and amikacin was a covalent bond that was induced by the heating process in the microwave and followed by the formation of the amide bond. The functional groups taking part to set up the amide bonds were –OH groups of N,S-CDs and –NH2 groups of amikacin by releasing some water molecules. The attachment of the amikacin to the surface of the N,S-CDs was further confirmed by 1HNMR spectroscopy (Figures S1–S3 in Supplementary Materials).
The 1HNMR spectrum of amikacin modified N,S-CDs in Figure S3 shows the attachment of H to sp3 C in the region of 1–3 ppm. The major peak that was observed was ascribed to the binding of H to cyclic π-system of N,S-CDs, which was also noticed in Figure S2 (supplementary data). The region of ca. 4 ppm in Figure S3 was attributed to the proton that was bonded to amide bond that formed between amikacin and N,S-CDs.
To understand the further insight of amikacin modified N,S-CDs, the XRD pattern was investigated. Figure 3a displays single broad diffraction peak that is centred at around 26.64° with a Miller index of (002) in the absence of sharp peak, implying a highly disordered carbon structure. The obtained interlayer spacing is 3.34 Å and nearly suits with graphite. Analysis by the TEM technique was conducted to examine the size and shape of amikacin modified N,S-CDs. Figure 3b shows that amikacin modified N,S-CDs were spherical and well dispersed without noticeable aggregationm with an average size of 7 nm.
Fluorescence emission spectra of amikacin modified N,S-CDs within different excitation wavelengths, as shown in Figure 4, could be divided into two sections. Firstly, excitation-independent emission lies at excitation wavelengths of 300–360 nm. In this range, the emission intensities steadily increased until reached a maximum at 360 nm. The peaks of emission showed no shift and they were constantly centered at 443 nm. This excitation-independent emission under 300–360 nm represents a relatively uniform surface state for emissive traps [15]. On the contrary, the emission peaks were red-shifted from 447 to 469 nm at excitation wavelengths above 360 nm with gradually decreasing intensities. The excitation-dependent fluorescence emission phenomenon is ascribed to different surface states of amikacin modified N,S-CDs. The existence of multiple O-, N-, and C-containing functional groups on the surface of amikacin modified N,S-CDs generated a series of emissive traps due to diverse surface states with contrastive energy levels. The corresponding surface state emissive trap is controlling and delivering excitation-dependent emissions at different excitation wavelengths [17].
As illustrated in Figure 5a, there was an increment of fluorescence intensities until the maximum one was obtained at 25 mg of amikacin and then followed by a sharp decrement. It could be possibly happen due to the introduced N atoms still offered a positive effect by providing excited energy traps through N- and S-states. This tendency was confirmed by UV-Vis spectra pointed lower absorbance peak than three other amikacin modified N,S-CDs at ca. 234 nm, which could be ascribed to 𝜋-𝜋* transitions of the aromatic C=C [15]. The contrary was noticed, where higher absorbance was achieved at ca. 337 nm (Figure 5b).
A dramatic decrement occurred, since the higher mass of amikacin induced a further process of carbonization and denoted by elevated absorbance at ca. 234 nm, as displayed in UV-Vis absorption spectra (Figure 5b). It implied that electronic conjugate structures brought no notable effect to deliver the high intensity of fluorescence [14]. Lower absorbance peak centred at ca. 337 nm favoured this process to occur by preventing the arrangement of N- and S-surface states for the trapping of excited electrons.

3.3. Stability of Amikacin Modified N,S-CDs

Based on Figure 6a, the fluorescence intensities of the amikacin modified N,S-CDs were susceptive to pH due to the presence of some functional groups, such as –COOH, –OH, and –NH2, on their surfaces. Fluorescence intensities were greatly weaken under highly acidic condition, but gradually decreased in a strong alkaline environment. The optimum fluorescence intensity was achieved at pH 7.
The steep decrease in the fluorescence intensities at highly acidic condition due to the formation of hydrogen bonding between –COOH, –OH, and –NH2 moieties on the surface of 25 mg amikacin modified N,S-CDs, leading particle aggregation, and resulting in the quenching of fluorescence emission. In strong alkaline condition, decreased fluorescence intensities have occurred as the result of the deprotonation of carboxylic acid moieties, which led to the build up of negative charge on the surface of amikacin modified N,S-CDs. The presence of a large quantity of negatively charged surface functional groups would decrease the fluorescence emissions due to its strong electron-withdrawing ability reducing the radiative recombination between electrons and holes, thus quenching some emission signals [18].
However, as the pH value lower than 6, the emission spectra were blue-shifted along with the decrease in pH values. Obvious blue-shifted wavelength occurred due to sp2 to sp3 hybridization change within the π-conjugated system of carbon generated loss of the C-ring aromaticity, thus altering the optical properties. This defective conjugation system resulted in an increment of HOMO and LUMO band gap [19]. Consequently, the fluorescence emission of the protonated N,S-CDs-amikacin should fall at a higher energy.
The influence of ionic strength was also determined in various concentrations of NaCl. Based on Figure 6b, the increment in ionic strength of NaCl medium resulted in a slight reduction in fluorescence intensity, which suggested the good potential of 25 mg amikacin modified N,S-CDs for sensing applications under physiological condition [20].

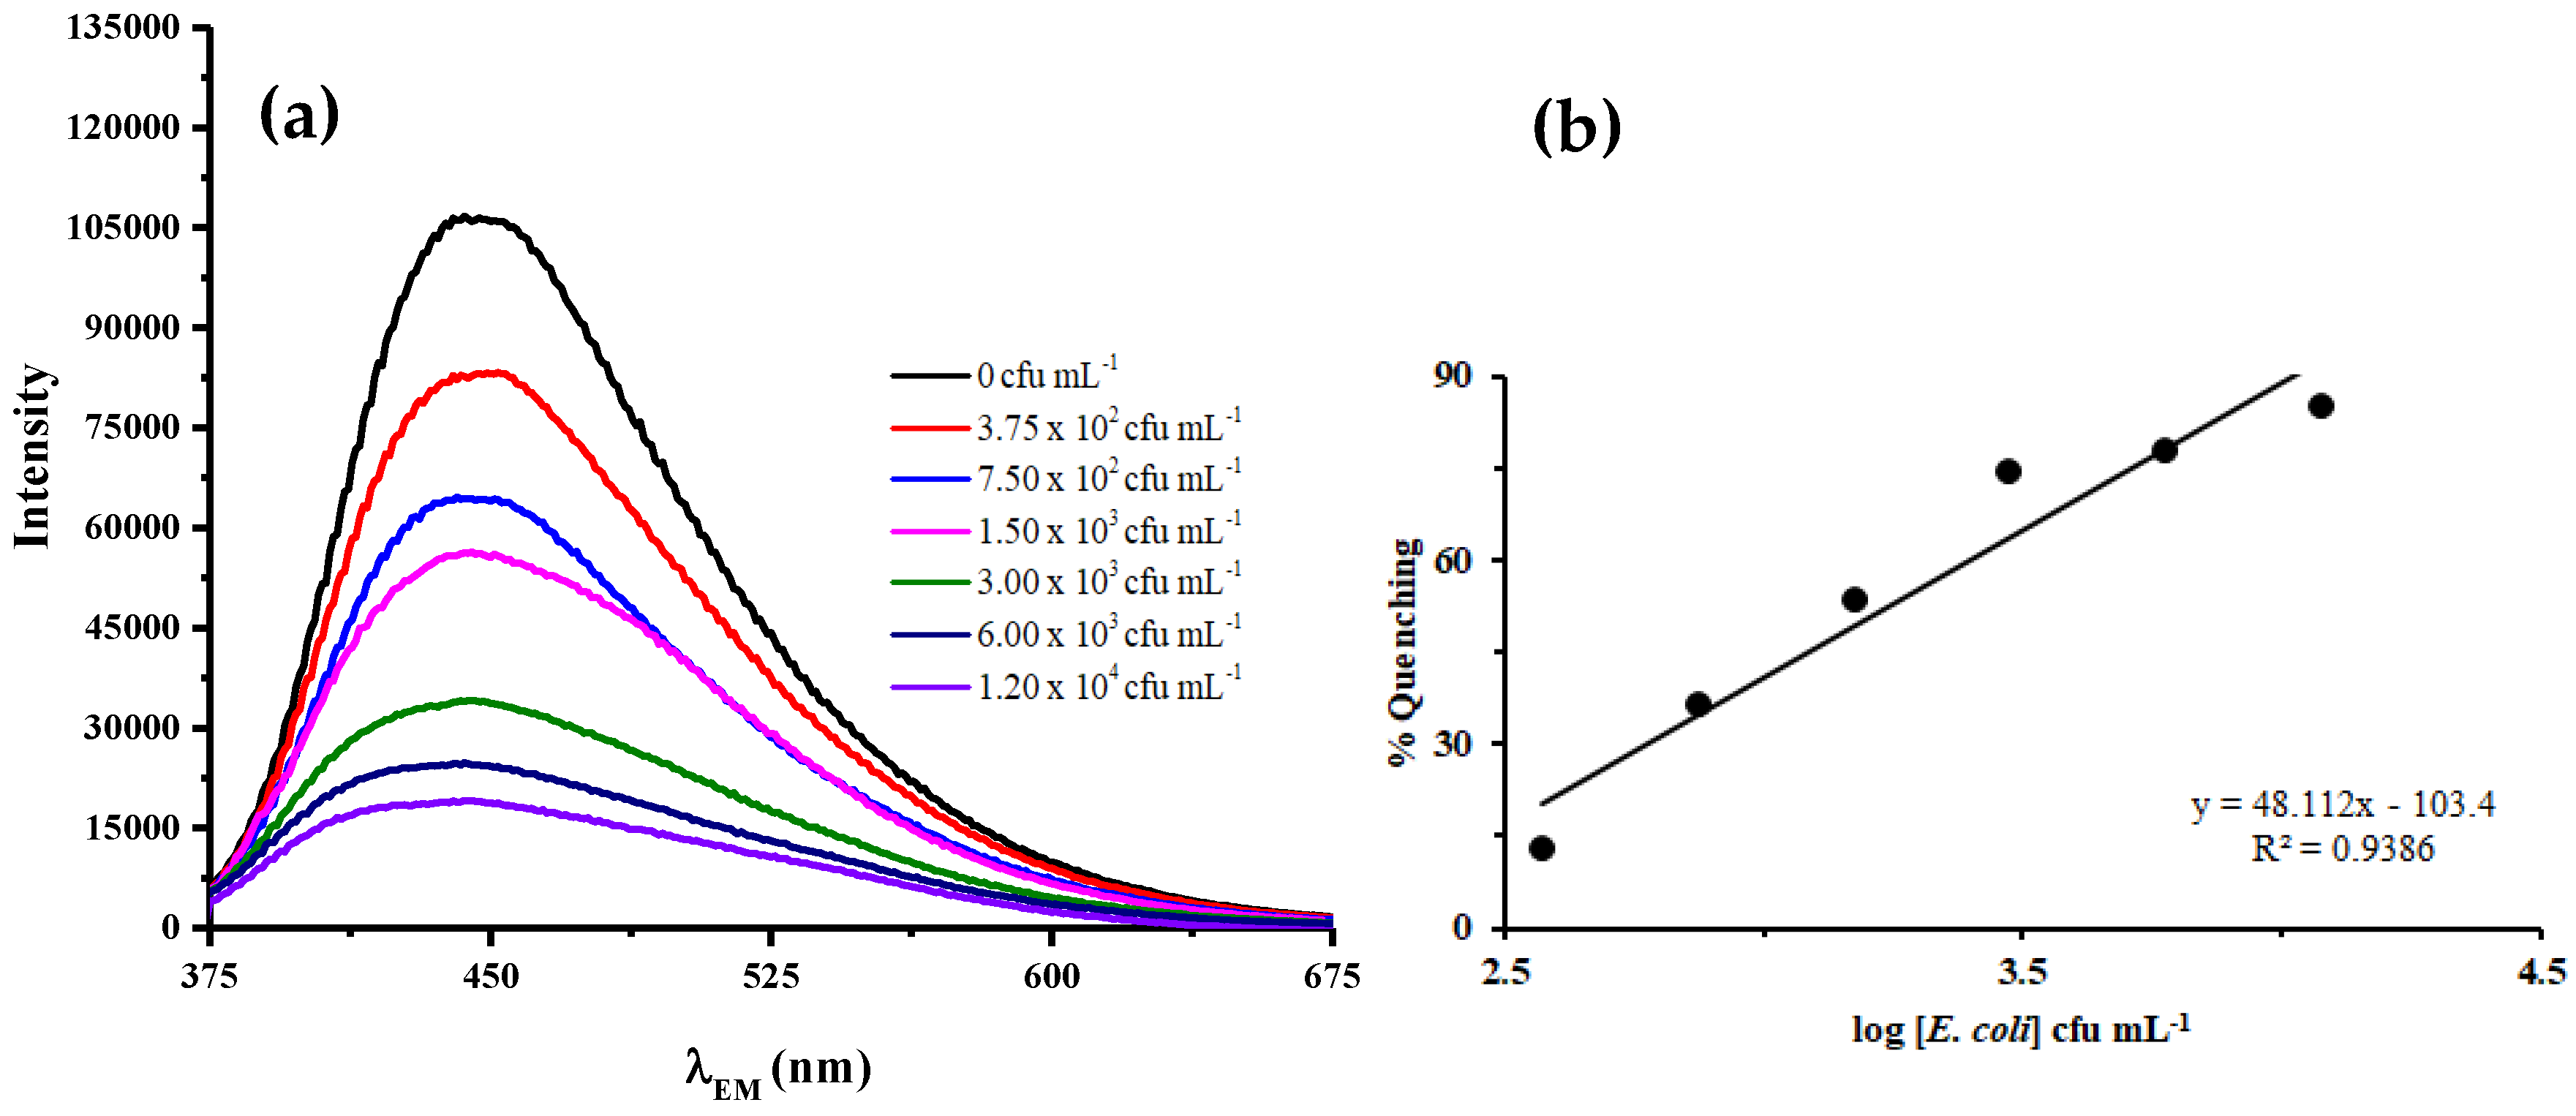
3.4. Fluorescence Detection of E. coli

Interaction between amikacin modified N,S-CDs and E. coli was proposed based on the electrostatic interaction between the positive charge of amikacin and negative charge of LPS. Amikacin modified N,S-CDs contain positive charge as a consequence of amino groups existence, whereas LPS, as the target, is negatively charged because of the phosphate groups in lipid A. When comparing to amikacin modified N,S-CDs, an insignificant quenching effect due to the existence of E. coli was portrayed by N,S-CDs in Figure 7a. It could be ascribed to the lack of their capability to effectively attach the outer membrane E. coli due to the dissociation of S-containing functional groups making the surfaces of N,S-CDs negatively charged.
The specificity of amikacin modified N,S-CDs for Gram-negative bacteria (E. coli) detection was examined by performing a similar procedure to Gram-positive bacteria cell (S. aureus). As revealed by Figure 7, the fluorescence intensity of S. aureus after treatment with amikacin modified N,S-CDs was still high when compared to E. coli. It signified that amikacin modified N,S-CDs was only selective towards Gram-negative bacteria. This selectivity could be related to the compositional discrepancy in the cell walls of the two bacteria, thus creating different ways to interact with amikacin modified N,S-CDs.
The detection efficiency of each amikacin modified N,S-CDs was determined by employing a series of various concentrated E. coli with a constant quantity of the synthesized materials. As described in Figure 7, fluorescence intensity gradually decreased as bacterial concentration increased. This linear relationship implies that amikacin modified N,S-CDs creates more intense interaction with a higher amount of E. coli. It also signifies that the strong quenching effect was developed due to the abundance of E. coli. The highest detection efficiency was exhibited by 25 mg amikacin modified N,S-CDs, with a coefficient of determination (R2) of 0.9906. The limit of detection (LOD) for E. coli after treatment with all amikacin modified N,S-CDs was examined from the linear regression curve of quenching percentage vs log of E. coli concentration. The percentage of quenching was calculated from [(S0 − S)/S0] × 100%, where S0 and S are the intensities of the before and after the bacteria addition, respectively. The 25 mg amikacin modified N,S-CDs exhibited the lowest LOD of 1.526 cfu mL−1, which indicated that the synthesized material had the highest sensitivity towards such low concentration of E. coli bacteria. The detection of E. coli by using 12.5, 50, and 75 mg amikacin modified N,S-CDs resulted LODs of 1.836, 2.020, and 2.838 cfu mL−1 (Table 1). It signified that 75 mg amikacin modified with N,S-CDs had the least sensitivity in application to detect E. coli bacteria.

3.5. Detection of E. coli in Real Sample

The applicability of amikacin modified N,S-CDs was analyzed in commercially bottled mineral water. Based on Figure 8, it was also found that increasing E. coli concentrations were followed by a decrement of fluorescence intensity. The detection limit for E. coli that was attained from the mineral water was 3.04 cfu mL−1. The result implied that amikacin modified N,S-CDs have potential practise in detecting target bacteria in real samples. Table 2 presents the comparison of LOD with some other previously reported papers based on optical bacterial sensors.

4. Conclusions

In summary, fluorescent amikacin modified N,S-CDs have been successfully fabricated by applying the microwave-assisted solid phase method. It was concluded that the ratio of thiourea content plays an important role in altering the fluorescence intensity of N,S-CDs. The incorporation of amikacin into N,S-CDs exhibits higher affinity and selectivity toward E. coli. Moreover, the synthesized amikacin modified N,S-CDs are applicable in detecting E. coli in commercially bottled mineral water with a limit of detection at 3.04 cfu mL−1. The recent approach can be considered as a background for future detection of pathogenic bacteria by employing fluorescence-based material.

Supplementary Materials

The following are available online at https://www.mdpi.com/2227-9040/7/4/61/s1, Table S1: Synthesis of N,S-CDs; Table S2: Synthesis of amikacin modified N,S-CDs, Figure S1: 1HNMR of Amikacin; Figure S2: 1HNMR of N,S-CDs; Figure S3: 1HNMR of amikacin modified N,S-CDs.

Author Contributions

F.A.R.P. synthesized and characterized CDs as well as data acquisition. M.M. contributed to the data analysis. K.M. reviewed and edited the manuscript. S.S. designed the experimental and wrote the initial manuscript.

Funding

This research was funded by The Ministry of Research, Technology, and Higher Education of Republic Indonesia under the name of PTM Project grant number 2860/UN1.DITLIT/DIT-LIT/LT/2019.

Acknowledgments

The authors are also thankful to Department of Chemistry, Universitas Gadjah Mada for providing facilities during the research and activities.

Conflicts of Interest

The authors declare no conflict of interest.

References

  1. Progress on Drinking Water. In Sanitation and Hygiene: 2017 Update and SDG Baselines; World Health Organization (WHO), The United Nations Children’s Fund (UNICEF): Geneva, Switzerland, 2017; pp. 1–60.
  2. Lai, I.-J.; Harroun, S.G.; Chen, S.-Y.; Unnikrishnan, B.; Li, Y.-J.; Huang, C.-C. Solid-State Synthesis of Self-Functional Carbon Quantum Dots for Detection of Bacteria and Tumor Cells. Sens. Actuators B Chem. 2016, 228, 465–470. [Google Scholar] [CrossRef]
  3. Baker, S.N.; Baker, G.A. Luminescent Carbon Nanodots: Emergent Nanolights. Angew. Chem. Int. Ed. 2010, 49, 6726–6744. [Google Scholar] [CrossRef] [PubMed]
  4. Yang, Z.; Li, Z.; Xu, M.; Ma, Y.; Zhang, J.; Su, Y.; Gao, F.; Wei, H.; Zhang, L. Controllable Synthesis of Fluorescent Carbon Dots and Their Detection Application as Nanoprobes. Nano-Micro Lett. 2013, 5, 247–259. [Google Scholar] [CrossRef]
  5. Guo, Z.; Cai, B.; Cao, Q.; Su, Y.; Li, M.; Hu, J.; Yang, Z.; Zhang, Y. Facile Synthesis of Amine-Functionalized Graphene Quantum Dots with Highly pH-Sensitive Photoluminescence. Fuller. Nanotub. Carbon Nanostruct. 2017, 25, 704–709. [Google Scholar] [CrossRef]
  6. Dong, X.; Su, Y.; Geng, H.; Li, Z.; Yang, C.; Li, X.; Zhang, Y. Fast one-step synthesis of N-doped carbon dots by Pyrolyzing Ethanolamine. J. Mater. Chem. C 2014, 2, 7477–7481. [Google Scholar] [CrossRef]
  7. Nandi, S.; Ritenberg, M.; Jelinek, R. Bacterial Detection with Amphiphilic Carbon Dots. Analyst 2015, 140, 4232–4237. [Google Scholar] [CrossRef]
  8. Bhaisare, M.L.; Gedda, G.; Khan, M.S.; Wu, H.F. Fluorimetric Detection of Pathogenic Bacteria using Magnetic Carbon Dots. Anal. Chim. Acta 2016, 920, 63–71. [Google Scholar] [CrossRef]
  9. Zhang, J.; Wang, J.; Fu, J.; Fu, X.; Gan, W.; Hao, H. Rapid Synthesis of N, S co-Doped Carbon Dots and Their Application for Fe3+ Ion Detection. J. Nanopart. Res. 2018, 20, 41–49. [Google Scholar] [CrossRef]
  10. Ipekci, T.; Seyman, D.; Berk, H.; Celik, O. Clinical and Bacteriological Efficacy of Amikacin in the Treatment of Lower Urinary Tract Infection caused by Extended-Spectrum Beta-Lactamase-Producing Escherichia coli or Klebsiella pneumoniae. J. Infect. Chemother. 2014, 20, 762–767. [Google Scholar] [CrossRef]
  11. Suherman, S.; Haryanto, N.A.; Wahyuni, E.T.; Ilmi, M.; Morita, K.; Oki, Y. Carbon Dots Modification for Escherichia coli Detection: Variation of Colistin Sulphate Concentration. Orient. J. Chem. 2019, 35, 49–55. [Google Scholar] [CrossRef]
  12. Barman, M.K.; Jana, B.; Bhattacharyya, S.; Patra, A. Photophysical Properties of Doped Carbon Dots (N, P, and B) and Their Influence on Electron/Hole Transfer in Carbon Dots-Nickel (II) Phthalocyanine Conjugates. J. Phys. Chem. C 2014, 118, 20034–20041. [Google Scholar] [CrossRef]
  13. Lu, W.; Gong, X.; Nan, M.; Liu, Y.; Shuang, S.; Dong, C. Comparative Study for N and S Doped Carbon Dots: Synthesis, Characterization and Applications for Fe3+ Probe and Cellular Imaging. Anal. Chim. Acta 2015, 898, 116–127. [Google Scholar] [CrossRef] [PubMed]
  14. Dong, Y.Q.; Pang, H.C.; Yang, H.B.; Guo, C.X.; Shao, J.W.; Chi, Y.W.; Li, C.M.; Yu, T. Carbon-Based Dots co-Doped with Nitrogen and Sulfur for High Quantum Yield and Excitation-Independent Emission. Angew. Chem. Int. Ed. 2013, 52, 7800–7804. [Google Scholar] [CrossRef] [PubMed]
  15. Zhang, Y.; He, Y.H.; Cui, P.P.; Feng, X.T.; Chen, L.; Yang, Y.Z.; Liu, X.G. Water-Soluble, Nitrogen-Doped Fluorescent Carbon Dots for Highly Sensitive and Selective Detection of Hg2+ in Aqueous Solution. RSC Adv. 2015, 5, 40393–40401. [Google Scholar] [CrossRef]
  16. Zhang, Y.; Cui, P.; Zhang, F.; Feng, X.T.; Wang, Y.; Yang, Y.Z.; Liu, X.G. Fluorescent Probes for “off–on” Highly Sensitive Detection of Hg2+ and L-Cysteine based on Nitrogen-Doped Carbon Dots. Talanta 2016, 152, 288–300. [Google Scholar] [CrossRef]
  17. Zhang, R.; Chen, W. Nitrogen-Doped Carbon Quantum Dots: Facile Synthesis and Application as a “turn-off” Fluorescent Probe for Detection of Hg2+ Ions. Biosens. Bioelectron. 2014, 55, 83–90. [Google Scholar] [CrossRef]
  18. Liu, L.Q.; Li, Y.F.; Zhan, L.; Liu, Y.; Huang, C.Z. One-step Synthesis of Fluorescent Hydroxyls-Coated Carbon Dots with Hydrothermal Reaction and Its Application to Optical Sensing. Sci. China Chem. 2011, 54, 1342–1347. [Google Scholar] [CrossRef]
  19. Outlaw, V.K.; Zhou, J.; Bragg, A.E.; Townsend, C.A. Unusual Blue-Shifted Acid-Responsive Photoluminescence Behavior in 6-Amino-8-cyanobenzo[1,2-b]indolizines. RSC Adv. 2016, 6, 61249–61253. [Google Scholar] [CrossRef]
  20. Zhu, S.; Meng, Q.; Wang, L.; Zhang, J.; Song, Y.; Jin, H.; Zhang, K.; Sun, H.; Wang, H.; Yang, B. Highly Photoluminescent Carbon Dots for Multicolor Patterning Sensors, and Bioimaging. Angew. Chem. Int. Ed. 2013, 52, 3953–3957. [Google Scholar] [CrossRef]
  21. Chandra, S.; Mahto, T.K.; Chowdhuri, A.R.; Das, B.; Sahu, S.K. One Step Synthesis of Functionalized Carbon Dots for the Ultrasensitive Detection of Escherichia coli and Iron (III). Sens. Actuators B Chem. 2017, 245, 835–844. [Google Scholar] [CrossRef]
  22. Chandra, S.; Chowdhuri, A.R.; Mahto, T.K.; Samui, A.; Sahu, S.K. One-Step Synthesis of Amikacin Modified Fluorescent Carbon Dots for the Detection of Gram-negative Bacteria like Escherichia coli. RSC Adv. 2016, 6, 72471–72478. [Google Scholar] [CrossRef]
  23. Yu, J.; Su, J.; Zhang, J.; Wei, X.; Guo, A. CdTe/CdS Quantum Dot-Labeled Fluorescent Immunochromatography Test Strips for Rapid Detection of Escherichia coli O157:H7. RSC Adv. 2017, 7, 17819–17823. [Google Scholar] [CrossRef]
  24. Weng, C.-I.; Chang, H.-T.; Lin, C.-H.; Shen, Y.-W.; Unnikrishnan, B.; Li, Y.-J.; Huang, C.-C. One-Step Synthesis of Biofunctional Carbon Quantum Dots for Bacterial Labeling. Biosens. Bioelectron. 2015, 68, 1–6. [Google Scholar] [CrossRef] [PubMed]
Figure 1. (a) Fluorescence (diluted samples up to 50x) and (b) UV-vis absorption spectra of varied N,S-CDs synthesized. Inset in (a) shows the fluorescence intensity at 360 nm of excitation wavelength.
Chemosensors 07 00061 g001
Figure 2. Fourier transform infrared (FTIR) spectra of (a) N,S-CDs, (b) amikacin, and (c) amikacin modified nitrogen, sulfur co-doped carbon dots (N,S-CDs).
Chemosensors 07 00061 g002
Figure 3. Characterization results of amikacin modified N,S-CDs (a) X-ray diffraction (XRD) pattern and (b) transmission electron microscope (TEM) images with magnification of 40,000×.
Chemosensors 07 00061 g003
Figure 4. Fluorescence spectra of 25 mg amikacin modified N,S-CDs at different excitation wavelengths. Inset presents the fluorescence intensity at each excitation wavelength.
Chemosensors 07 00061 g004
Figure 5. (a) Fluorescence and (b) UV-vis absorption spectra of all amikacin modified N,S-CDs at 360 nm of emission wavelength. Inset in (a) shows the fluorescence intensity at 360 nm of excitation wavelength.
Chemosensors 07 00061 g005
Figure 6. Fluorescence spectra of amikacin modified N, S-CDs at (a) various pH values and (b) different concentration of NaCl. Insets display the fluorescence intensity of N,S-CDs-amikacin (a) at varied pH values and (b) under each concentration of NaCl.
Chemosensors 07 00061 g006
Figure 7. Fluorescence emission spectra of (a) E. coli labeled N,S-CDs, (b) E. coli and S. aureus of 1.2x10⁴ cfu mL−1 each labelled with 25 mg amikacin modified N,S-CDs 360 nm excitation wavelength.
Chemosensors 07 00061 g007
Figure 8. (a) Fluorescence spectra and (b) linear plot of E. coli after labelling with 25 mg amikacin modified N,S-CDs at 360 nm excitation wavelength.
Chemosensors 07 00061 g008
Table 1. Limit of detection (LOD) values at 360 nm excitation labelled with various amikacin modified N,S-CDs.
MaterialsR2LOD (cfu mL−1)
12.5 mg amikacin modified N,S-CDs0.98081.836
25.0 mg amikacin modified N,S-CDs0.99061.526
50.0 mg amikacin modified N,S-CDs0.97452.020
75.0 mg amikacin modified N,S-CDs0.96662.838
Table 2. The comparative list of LOD and linear range of this work and previously reported work for detection of E. coli.
MaterialLinear Range (cfu mL−1)LOD (cfu mL−1)MethodReference
Carbon dots@colistin (CDs@colistin) 3.81 × 10²–2.44 × 10⁴ 460 Fluorescent sensing[21]
Amine-functionalized Magnetic-CDs3.50 × 102–2.90 × 10³ 3.5 × 10²Fluorescent sensing[8]
CDs@amikacin 7.625 × 10²–3.904 × 10⁵ 552 Fluorescent sensing[22]
CdTe/CdS quantum dots (CdTe/CdS QDs)102–109104Immunochromatogra-phy test strips[23]
Mannose-modified fluorescent carbon quantum dots (Man-CQDs)102–108450Fluorescent labelling[24]
Amikacin modified N,S-CDs0–1.20 × 1043.04Fluorescent sensingThis work

