1. Introduction
In any living organism, messenger ribonucleic acid is a vital and functional constituent in the DNA present in cells. Messenger RNA (mRNA) serves as a sensitive biomarker in the prognosis and diagnosis for diseases as it holds a key connection between genome and proteome as it carries the information from the DNA to initiate the protein synthesis [
1]. Some of the cell regulatory pathways are controlled by mRNA such as cell cycles, chromatin modifications and cell adhesions, [
2] and these regulation pathways can be affected by different mRNA expression caused by activation mRNA degradation, point mutation, among others, leading to cause several diseases including cancer [
1,
3,
4].
Some of the examples of mRNA correlated with diseases are Cyclin D1 and TS mRNA’s correlated with breast cancer, altered levels of Telomerase reverse transcriptase (TERT) and epidermal growth factor receptor (EGFR) mRNA [
5,
6], correlated with lung cancer and FAM134B mRNA expression correlated with colon adenocarcinoma and esophageal squamous cell carcinoma [
7]. mRNA expression profiling can be used as a potential disease biomarker [
8]. Previous studies have shown that the prognosis and drug response to cancer can be achieved by screening and quantifying the mRNA levels [
8,
9].
Gene expression profiling determines what genes are expressed in a cell at any given time and its level of expression (number of corresponding mRNA copies) [
10,
11,
12]. Transcription is the first step of gene expression, in which a segment of DNA is copied into RNA by the enzyme RNA polymerase [
13]. Gene expression, up regulation of genes, or down regulation of genes is used to diagnose cancer and other diseases [
14]. There are a number of methods such as polymerase chain reaction (PCR), sequencing and microarrays available for gene expression profiling. These methods typically transcribe the RNA into complementary DNA by reverse transcriptase reaction. Since in these methods each mRNA molecule produces one DNA molecule to initiate the PCR process, any degradation of mRNA prior to the PCR process causes large errors in the calculation of the gene expression levels using these methods. To produce higher complementary DNA yields pure RNA extraction is important. Thus, there is a need for a technique that can detect mRNA without any RNase activity that degrades the mRNA strands.
The commonly used methods to detect mRNA is the same as the nucleic acid detection techniques such as quantitative reverse transcription PCR (qRT-PCR), the RNA sequencing method and microarrays [
15,
16]. Although these methods are reliable it comes with a drawback of enzymatic amplification and high cost equipment. These methods demand the reverse transcription of the mRNA into complementary DNA (cDNA), leading to decrease in the accuracy due to partial amplification and template switching of the sample sequence. Gel electrophoresis and fluorescence intensity are used as external readouts, which contribute to the high cost and complexity of this method. Due to these limitations, the nucleic acid detection methods are non-suitable for point of care applications [
17].
Other popular methods to detect mRNA are electrochemical and optical readouts [
18,
19]. These methods had shown potential due to its high sensitivity and cost effectiveness [
20,
21,
22,
23,
24]. These sensors require complex fabrication techniques and they also use electroactive ligands that require modifications with the target sample that can interfere with the sensor effectiveness. Therefore, there is a need of amplification-free, label-free, high-sensitive, high throughput and cost-effective method to detect mRNA from cells.
We recently demonstrated a label-free biosensing method for the detection of the pancreatic cancer biomarker CA 19-9 based on dielectrophoresis spectroscopy [
25]. We demonstrated earlier that this method can detect a concentration of as little as 13 aM per polystyrene microsphere [
26]. In this study, we show that dielectrophoresis (DEP) spectroscopy is a rapid, low-cost and label free-transduction mechanism for biosensors to measure mRNA expression levels in living cells.
2. Materials and Methods
2.1. Sample Preparation
Cell culturing: CRL 1764 (rat fetus fibroblast) adherent cells were purchased from American Type Culture Collection (ATCC) and cultured in at 37 °C in a 5% CO
2 incubator. This cell line was selected as a model to verify the effectiveness of the gene expression biosensor that we developed. The cells were subcultured in a timely manner, so that the cells are in the log phase by the time they were being taken to experiments. Cells were taken in to the experiment when they are 75% confluent (approximately 1 × 10
6 cells). First, the cell culture media was removed and the cells were washed thrice with ice cold RNAse free phosphate-buffered saline (PBS). Then, PBS was removed from the culture flask and 1 mL of RNAse free ice-cold lysis buffer was added. Then the lysate was carefully removed from the flask and centrifuged at 14,000 rpm at 4 °C for 10 min. After carefully removing the supernatant from the pellet, the supernatant was kept in ice prior to the hybridization procedure. Based on data available in the Human Protein Atlas database (
https://www.proteinatlas.org/), each CRL 1764 cell contains an average of 105–228 β-actin mRNAs, 149–265 GAPDH mRNAs and 17–37 HPRT mRNAs.
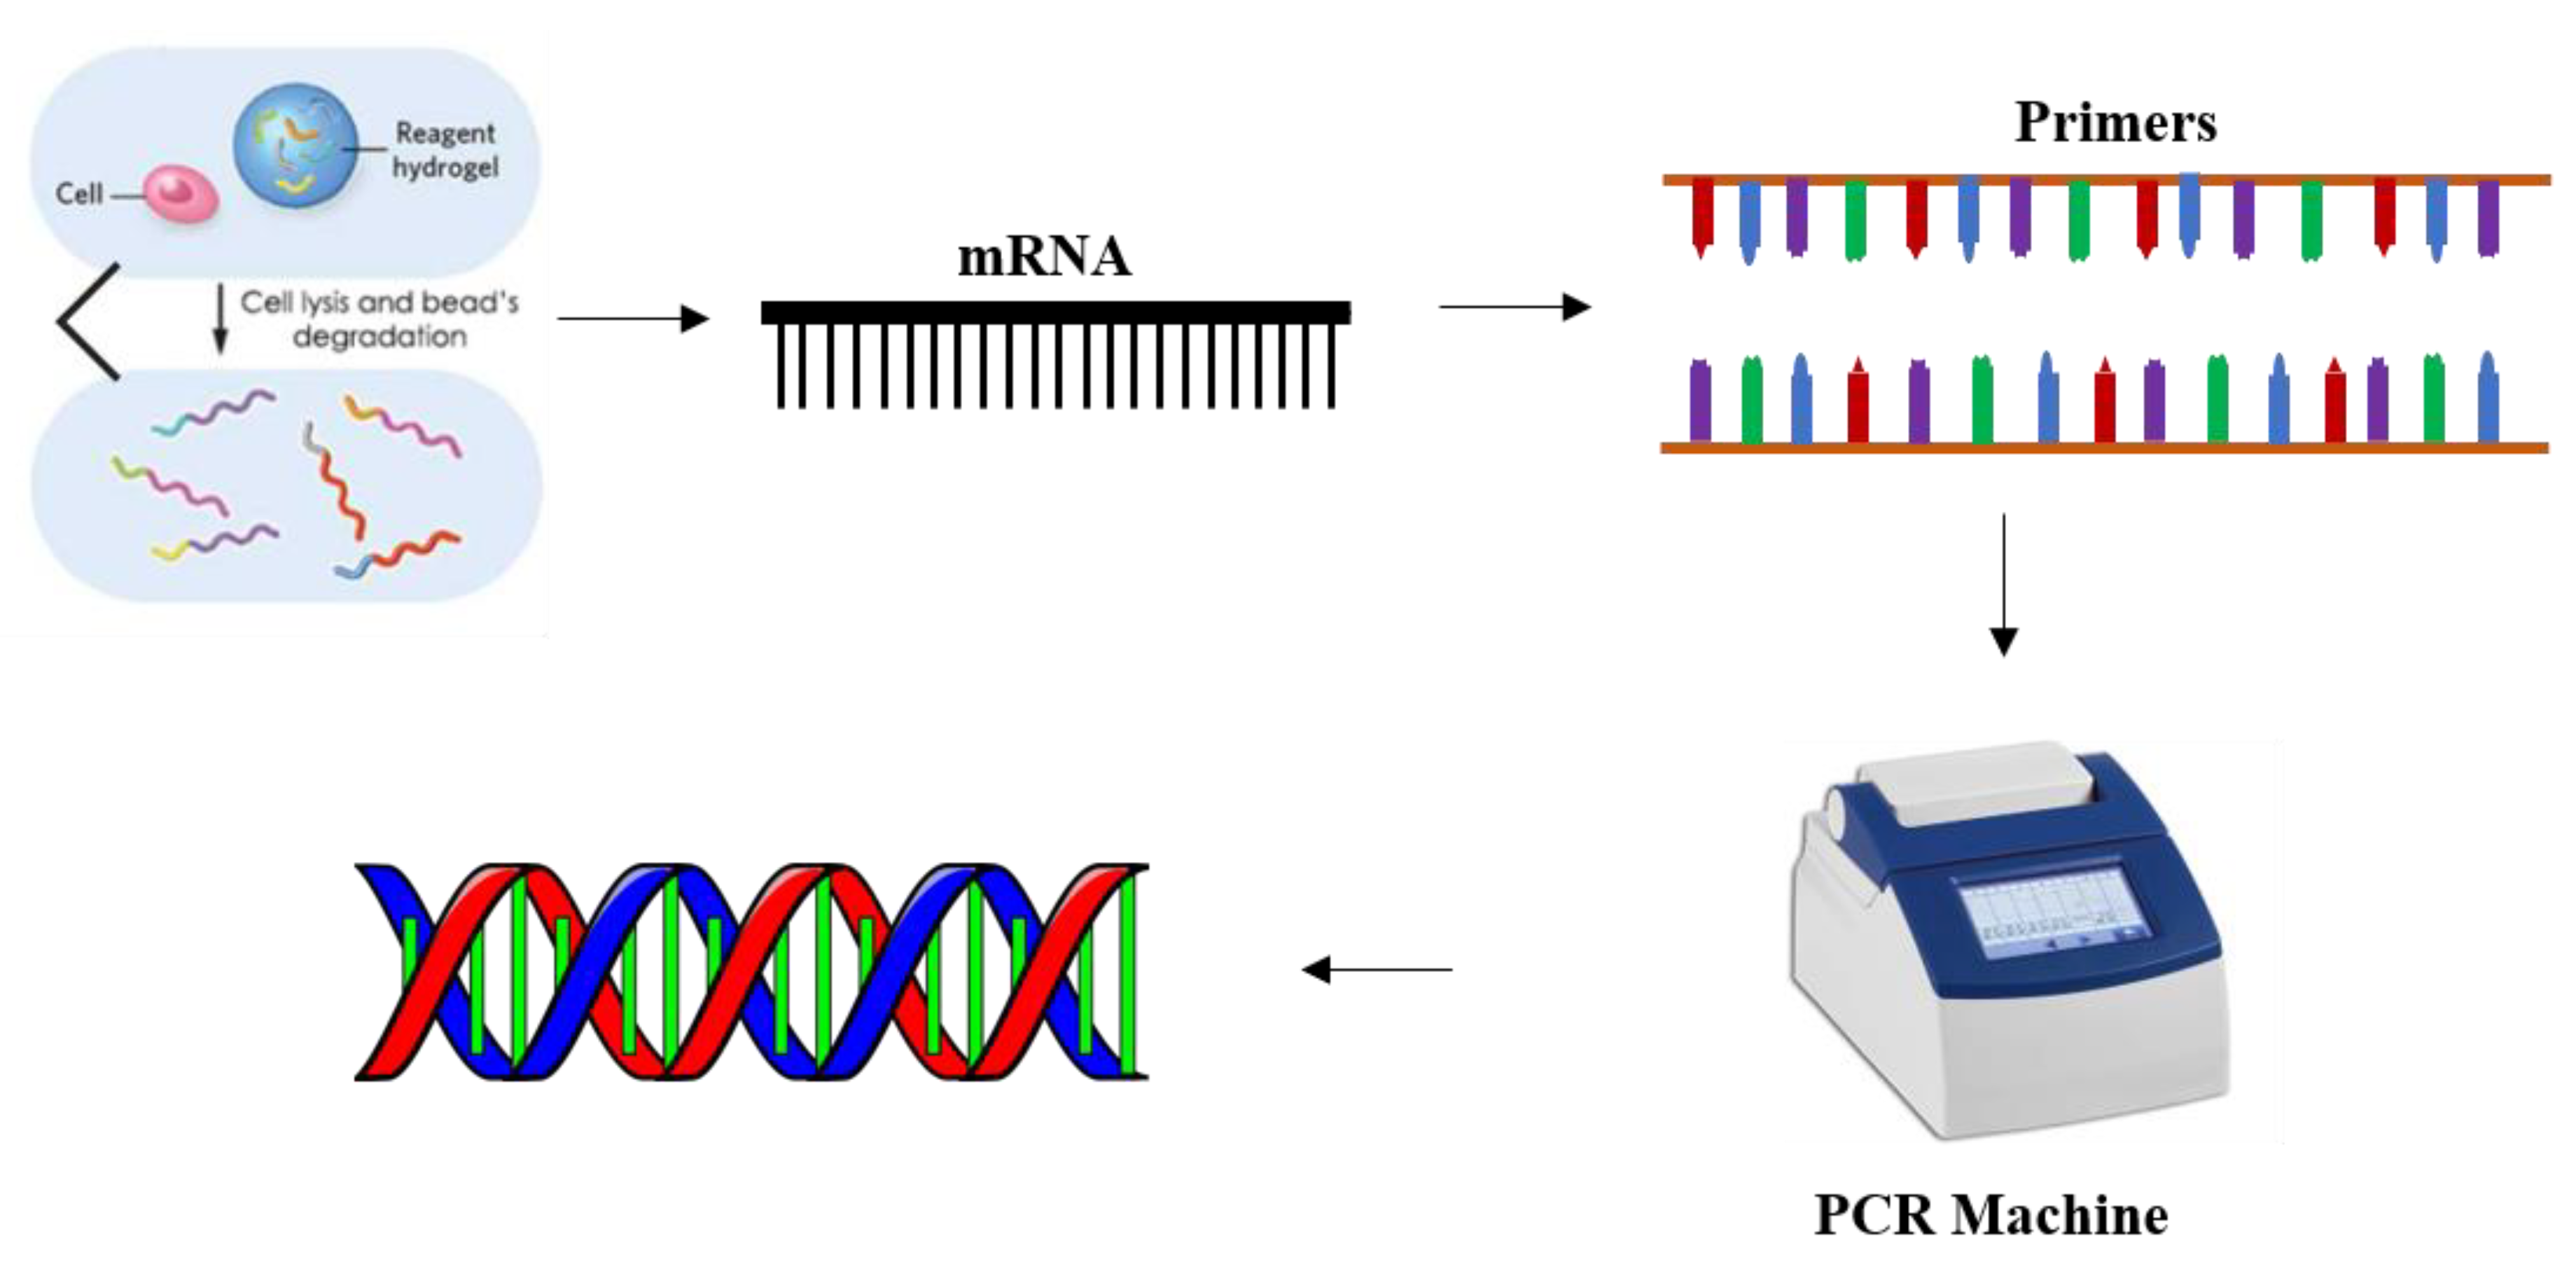
Hybridization: For detecting β-Actin, GAPDH and HPRT, mRNA Biotinylated 5′-∕5Biosg∕ACC GCT CAT TGC CGA TAG TGA TGA-3′, Biotinylated 5′-∕5 Biosg∕TGA CTC TAC CCA CGG CAA GTT CAA-3′ and Biotinylated 5′-∕5Biosg∕CTG CCT ACA GGC TCA TAG TGC AAA-3′ were used, respectively, as the complementary DNA primers. In the experiment, 25 µL of 100 µM mRNA binding primer was added to a 25 µL of the cell lysate and hybridized using PCR with the following cycle protocol: 5 min at 95 °C, 2 min at 68 °C and cool down in room temperature for 1 h. This protocol was obtained with a series of control experiments with reference to the standard procedure [
27]. For detecting the mRNA levels in varying cell concentrations, the cell lysate was diluted prior to the hybridization, as shown in
Figure 1.
Prior to the experiments, SYBR green was used to verify the hybridization. The presence of hybridized mRNA was confirmed by bright green fluorescence compared to its prior dark background. After completing the mRNA hybridization with the biotinylated mRNA binding primers, the sample was mixed with avidin functionalized polystyrene microspheres (APMs) to the ratio of 1:25 (Biotin:APM) by volume, according to the specifications by the supplier. Then the sample was washed three times to remove the unhybridized biotinylated mRNA primers, the lysis buffer and other unwanted molecules.
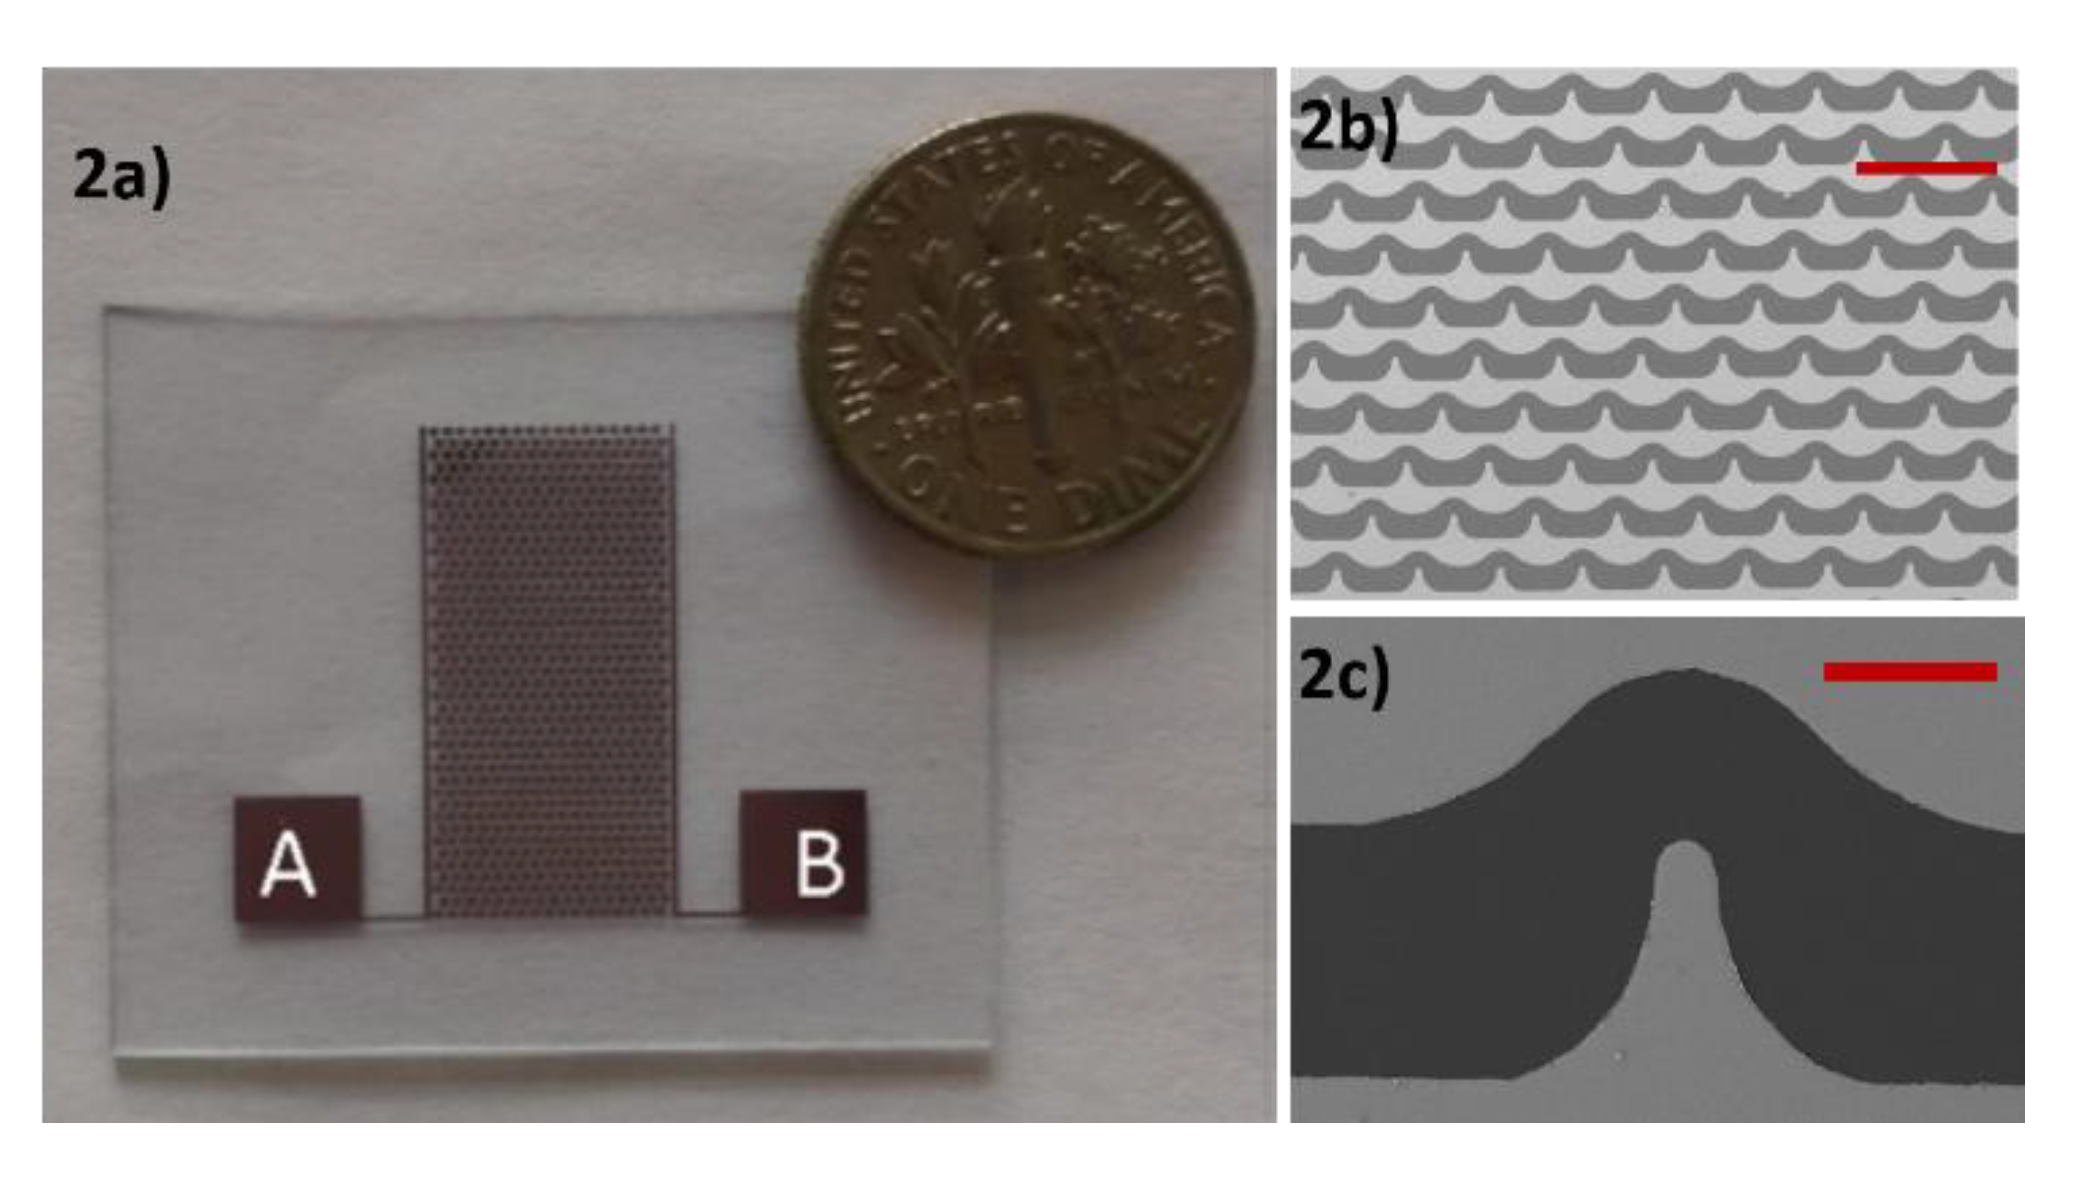
2.2. Microstucted Interdigitated Electrodes
In the experiments, we used a custom-made interdigitated electrode. The initial design of the electrode was drawn to scale using AutoCAD and then validated its electric field gradient using COMSOL Multiphysics. The electrode was fabricated on a commercially available glass wafer with standard fabrication procedures involving photolithography, metal sputtering and lift-off procedures using 1000 Å thick gold film in the microfabrication facilities at North Dakota State University. Using COMSOL we verified that this electrode produces electric field intensities as high as 10
4 V/m and gradient of the electric field intensity as high 10
16 V
2/m
3, which is enough to produce strong DEP forces to dielectric particles with a few hundred nanometers of diameter. It was observed that the root mean square of the electric field and the electric field gradient produced by this electrode do not vary with the frequency from tens of kHz to several MHz. This ensures the sample is subjected to the same electric field gradient in all frequencies of interest, which makes DEP behavior depend only on the value of real part of the Clausius–Mossotti factor [
28]. The image of the electrode is as shown in
Figure 2.
In a previous study with DEP that we carried out using a different electrode array [
26], we observed a variation in the number of polystyrene microspheres (PMs) adjacent to the electrodes at the end of every cycle of positive and negative DEP. That variation occurs because the electrode array used in that study had a peak gradient of the electric field intensity on both sides of the electrodes. Therefore, the PM that experiences negative DEP may not be attracted due to positive DEP to the region with high electric field gradient in which image processing is carried out. The new electrode is designed in such a way that there is always a concave electrode edge, which produces low electric field gradient near the electrode edge, on the opposite side of the convex electrode edge, which produces high electric field gradient. Therefore, most of the PM exposed to the electric field gradient will be concentrated near the same convex edge of the electrode in every cycle in which positive DEP is applied. The use of the electrode array shown in
Figure 2 reduced the processing time, enhanced the accuracy of the measurements and facilitated the experimental procedure as compared to the previous electrode array that we used in a previous study [
26].
2.3. DEP Spectroscopy Application
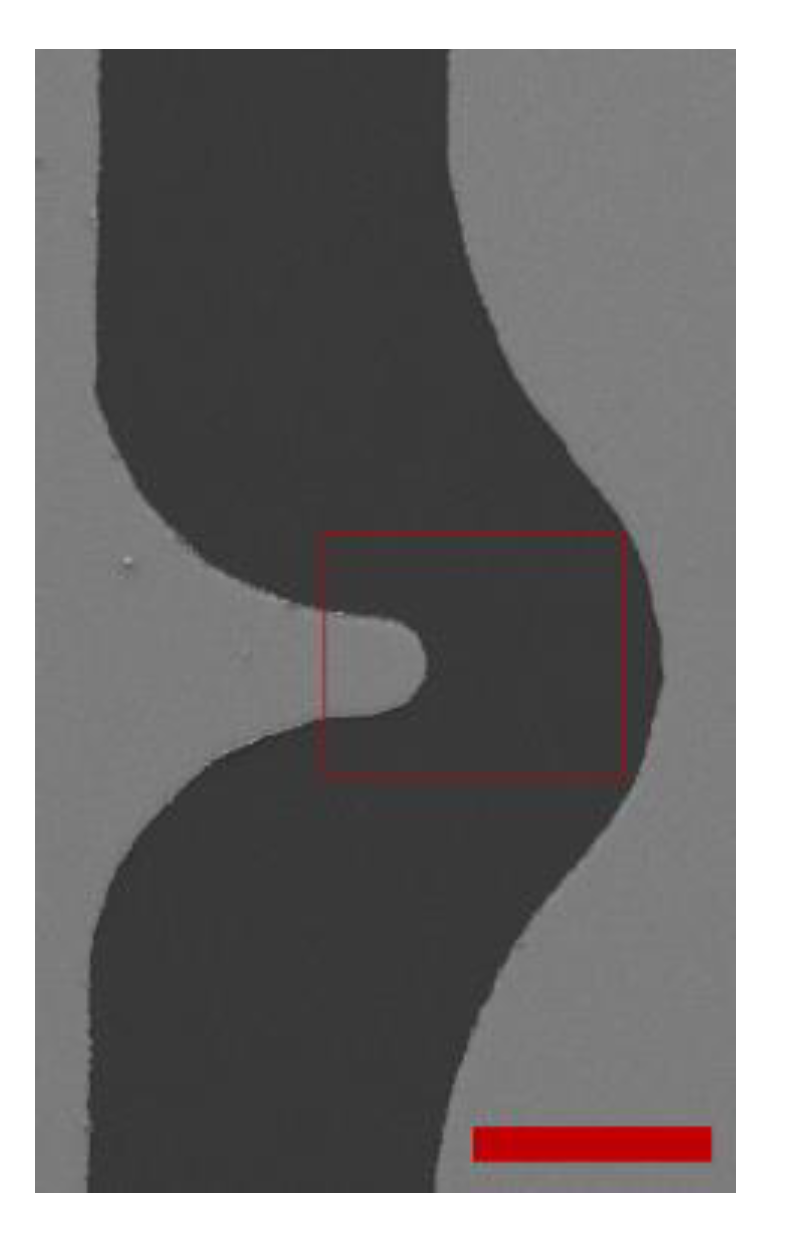
To carry out the DEP measurement, use used an image processing software that we developed. The software is integrated with a Tektronix AFG series function generator and a USB video class (UVC) standard compliant microscope camera mounted on an OMFL600 low power microscope. The application controls the function generator to produce DEP force and the software tracks the center of mass of the PM band whose position varies with the strength and type of DEP force. The field of view processed by the software is as shown in
Figure 3. The software calculates the DEP spectrum by tracking the drift velocity of the center of mass of the PM as a function of the applied frequency.
The software application was designed to extract the pixel and color information from the live images captured. Since the goal is to determine the effect of DEP force on the PM in the solution, the system monitors the region of interest in the video where strong DEP effect is observed. The region of interest is the area in which the electric field gradient and, consequently, the DEP force is the strongest, which consists of the region included in the red rectangle shown in
Figure 3, which form the areas in the field of view of the camera that are processed to calculate the drift velocity due to the DEP force as a function of the frequency of the electric field. The drift velocity is proportional to the friction force and, consequently, is proportional to the DEP force. A desired time interval is set to capture time lapse images for the drift velocity calculation. The minimum time interval to capture an image or to record a new data value is in the order of 40 ms, which is determined by the frame rate of the video stream and processing speed of the hardware.
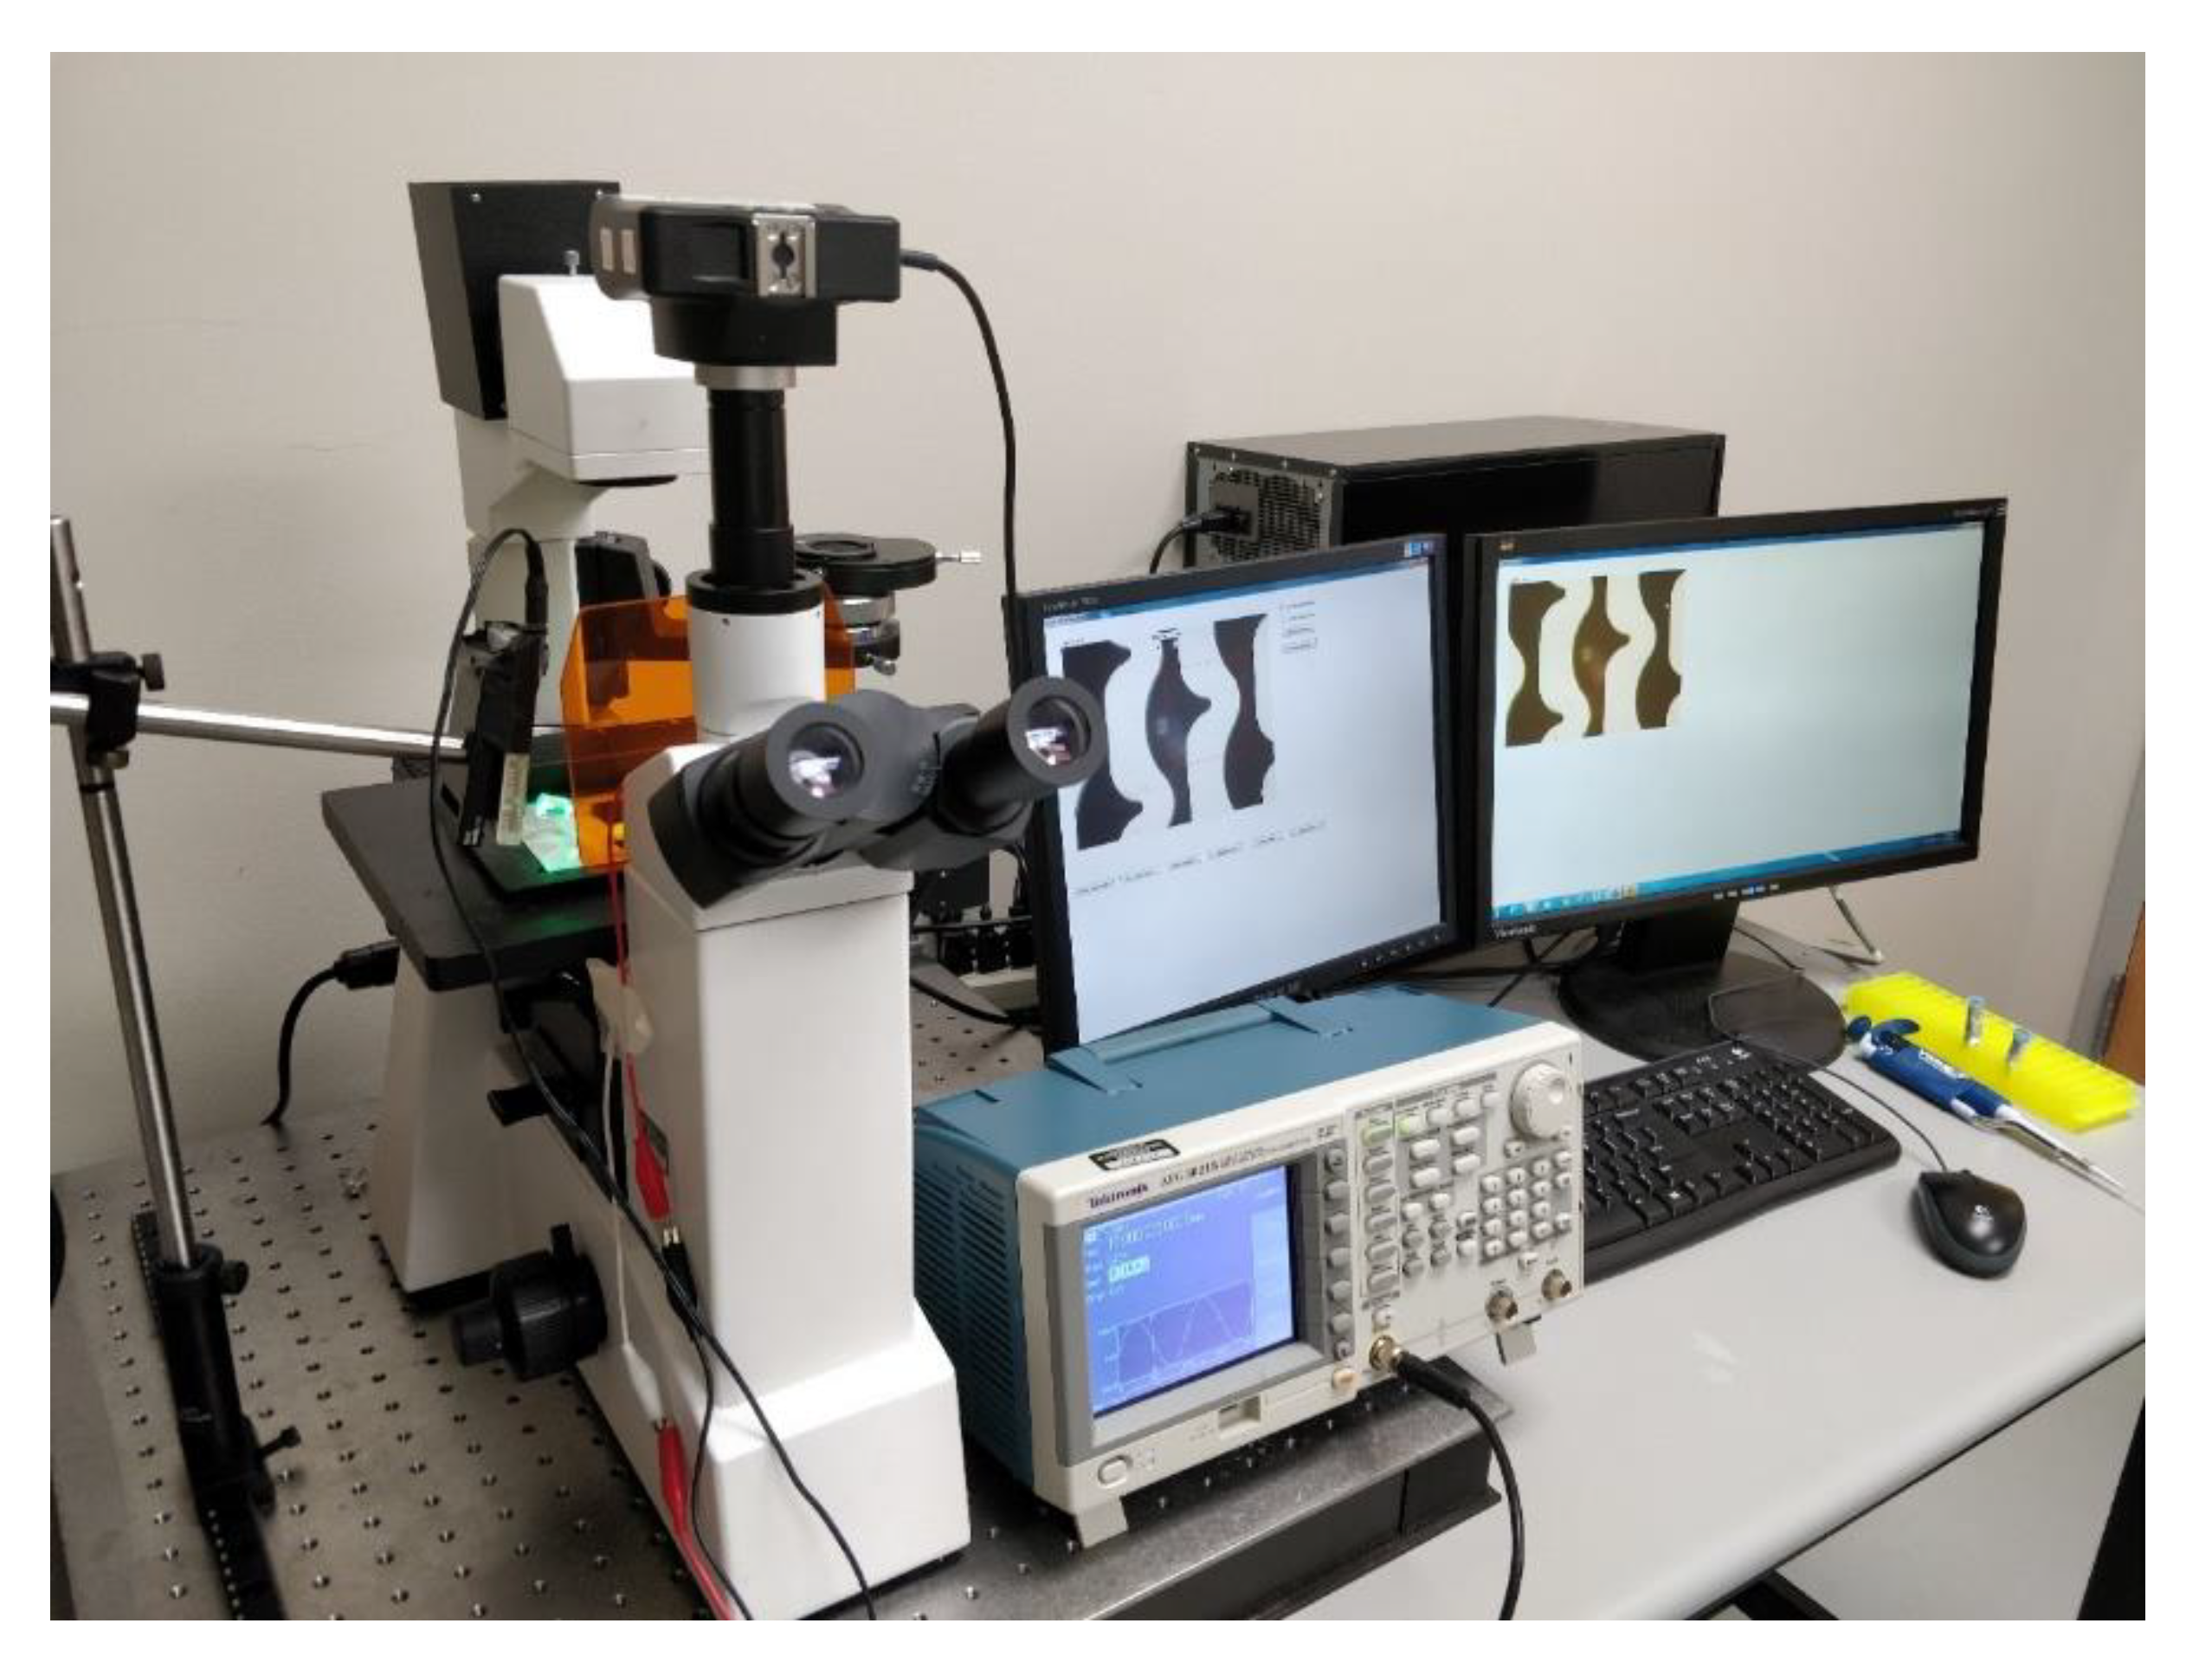
2.4. Green LED Illumination Set Up
The experimental set up is as shown in
Figure 4. It comprises of OMFL600 low power microscope, a Tektronix AFG series function generator, a clean interdigitated electrode and a custom-built green LED lamp set up illuminating at a low angle of 30° of incidence were used for the experiments. The low angle of incidence is used to reduce the amount of light that is collected by the microscope camera that does result from light scattering from the PM in the target sample. 10 µL of the assay solution is pipetted onto the surface of the interdigitated electrode. A fraction of the scattered light from the mRNA bound PM due to Mie scattering is collected by the objective of the microscope. This imaging process is label free, since no fluorescence markers on the sample target molecules are needed for the transduction. This eliminates the procedure of washing any unbound fluorescent markers or labels that are needed in labeled biosensing methods.
2.5. Frequency Sweep
To measure the negative DEP force on the target molecule for each frequency, we first applied the positive DEP force to attract the target bound PM onto the edge of the electrodes within the region of interest. The positive DEP for this experiment was determined by a series of experiments and was set to 10 kHz. Then, the negative DEP is applied for a range of frequency in the experiment. The function generator is controlled by the software application, which switches the frequency to apply positive and negative DEP throughout the experiments. The negative frequency was set from 0.5 to 2 MHz, which was determined from the previous sets of experiments. The applied peak-to-peak voltage was set to 10 V based on the calculations made using the COMSOL Multiphysics simulator.
The time intervals for positive and negative DEP were determined and optimized using a series of controlled experiments. The time interval for the positive DEP was set to 400 ms and the negative DEP was set to 80 ms per frequency measurement. In case of positive DEP, the experiment starts with a certain start frequency fpDEP that induces positive DEP effect for the specified time interval (400 ms) to collect the PM to a region near the electrode. Then, the frequency is automatically changed to the frequency fnDEP,1 that induces negative DEP effect for the specified time interval (80 ms) and two images are obtained to measure the center of mass of the PM as they are being repelled from the electrode. Then the frequency is switched to the next frequency that produces negative DEP, fnDEP,2. This cycle continues until fnDEP reaches the stop frequency. The frequency switching by the function generator is automatically controlled by our application.
Our application is designed for Tektronix AFG series function generators. The function generator is connected to the computer via USB port. We modified an Interchangeable Virtual Instruments Foundation (IVI) compliant device driver from LabWindows™/CVI environment to Microsoft Visual C++. This modified device driver along with TekVISA (Virtual Instrument Software Architecture) connectivity software was used to access and control the function generator from Microsoft Visual C++ program.
3. Results and Discussion
We validated our method by carrying out experiments using mRNA bound PMs with our custom-made real-time image processing software for recording and analyzing the results. Once the electrode was imaged by the low power microscope and placed in the region in the field of view monitored by the image-processing software, the frequency-sweep process for the DEP spectrum measurement was initiated. Once the application applied 10 kHz at 10 V peak-to-peak using the function generator to establish the positive DEP force, an mRNA bound PM band was formed near the edge of the electrode as shown in
Figure 5. The software applied this frequency for 400 ms after witching to 0.5 MHz, which produced negative DEP, while maintaining the same peak-to-peak voltage. This led to a repulsion of the mRNA bound PM from the edge of the electrode. The software captured the images at 25 frames per second from the live capturing of the video. The repulsion of the mRNA bound PM was tracked along the axis of the electrode within the region of interest. With known positions of the PM at two different times in which negative DEP was applied, we calculated the drift velocity of the mRNA bound PM layer, which was proportional to the DEP force. This was repeated for five additional electrical frequency ranging from 0.8 to 2 MHz, which also produced negative DEP. Low frequency electric fields (<50 kHz) produce positive DEP whereas high frequency electric fields (>250 kHz) produce negative DEP force to the mRNA bound PM that we used in this study.
Once the images were extracted at the beginning and at 40 ms after a frequency that produced negative DEP was applied, we analyzed the light intensity along the axis from the edge of the convex electrode. Both the images were processed to determine the difference between the center of mass of the PM bands, so that the drift velocity of the PM band due to negative DEP could be calculated for the applied frequency.
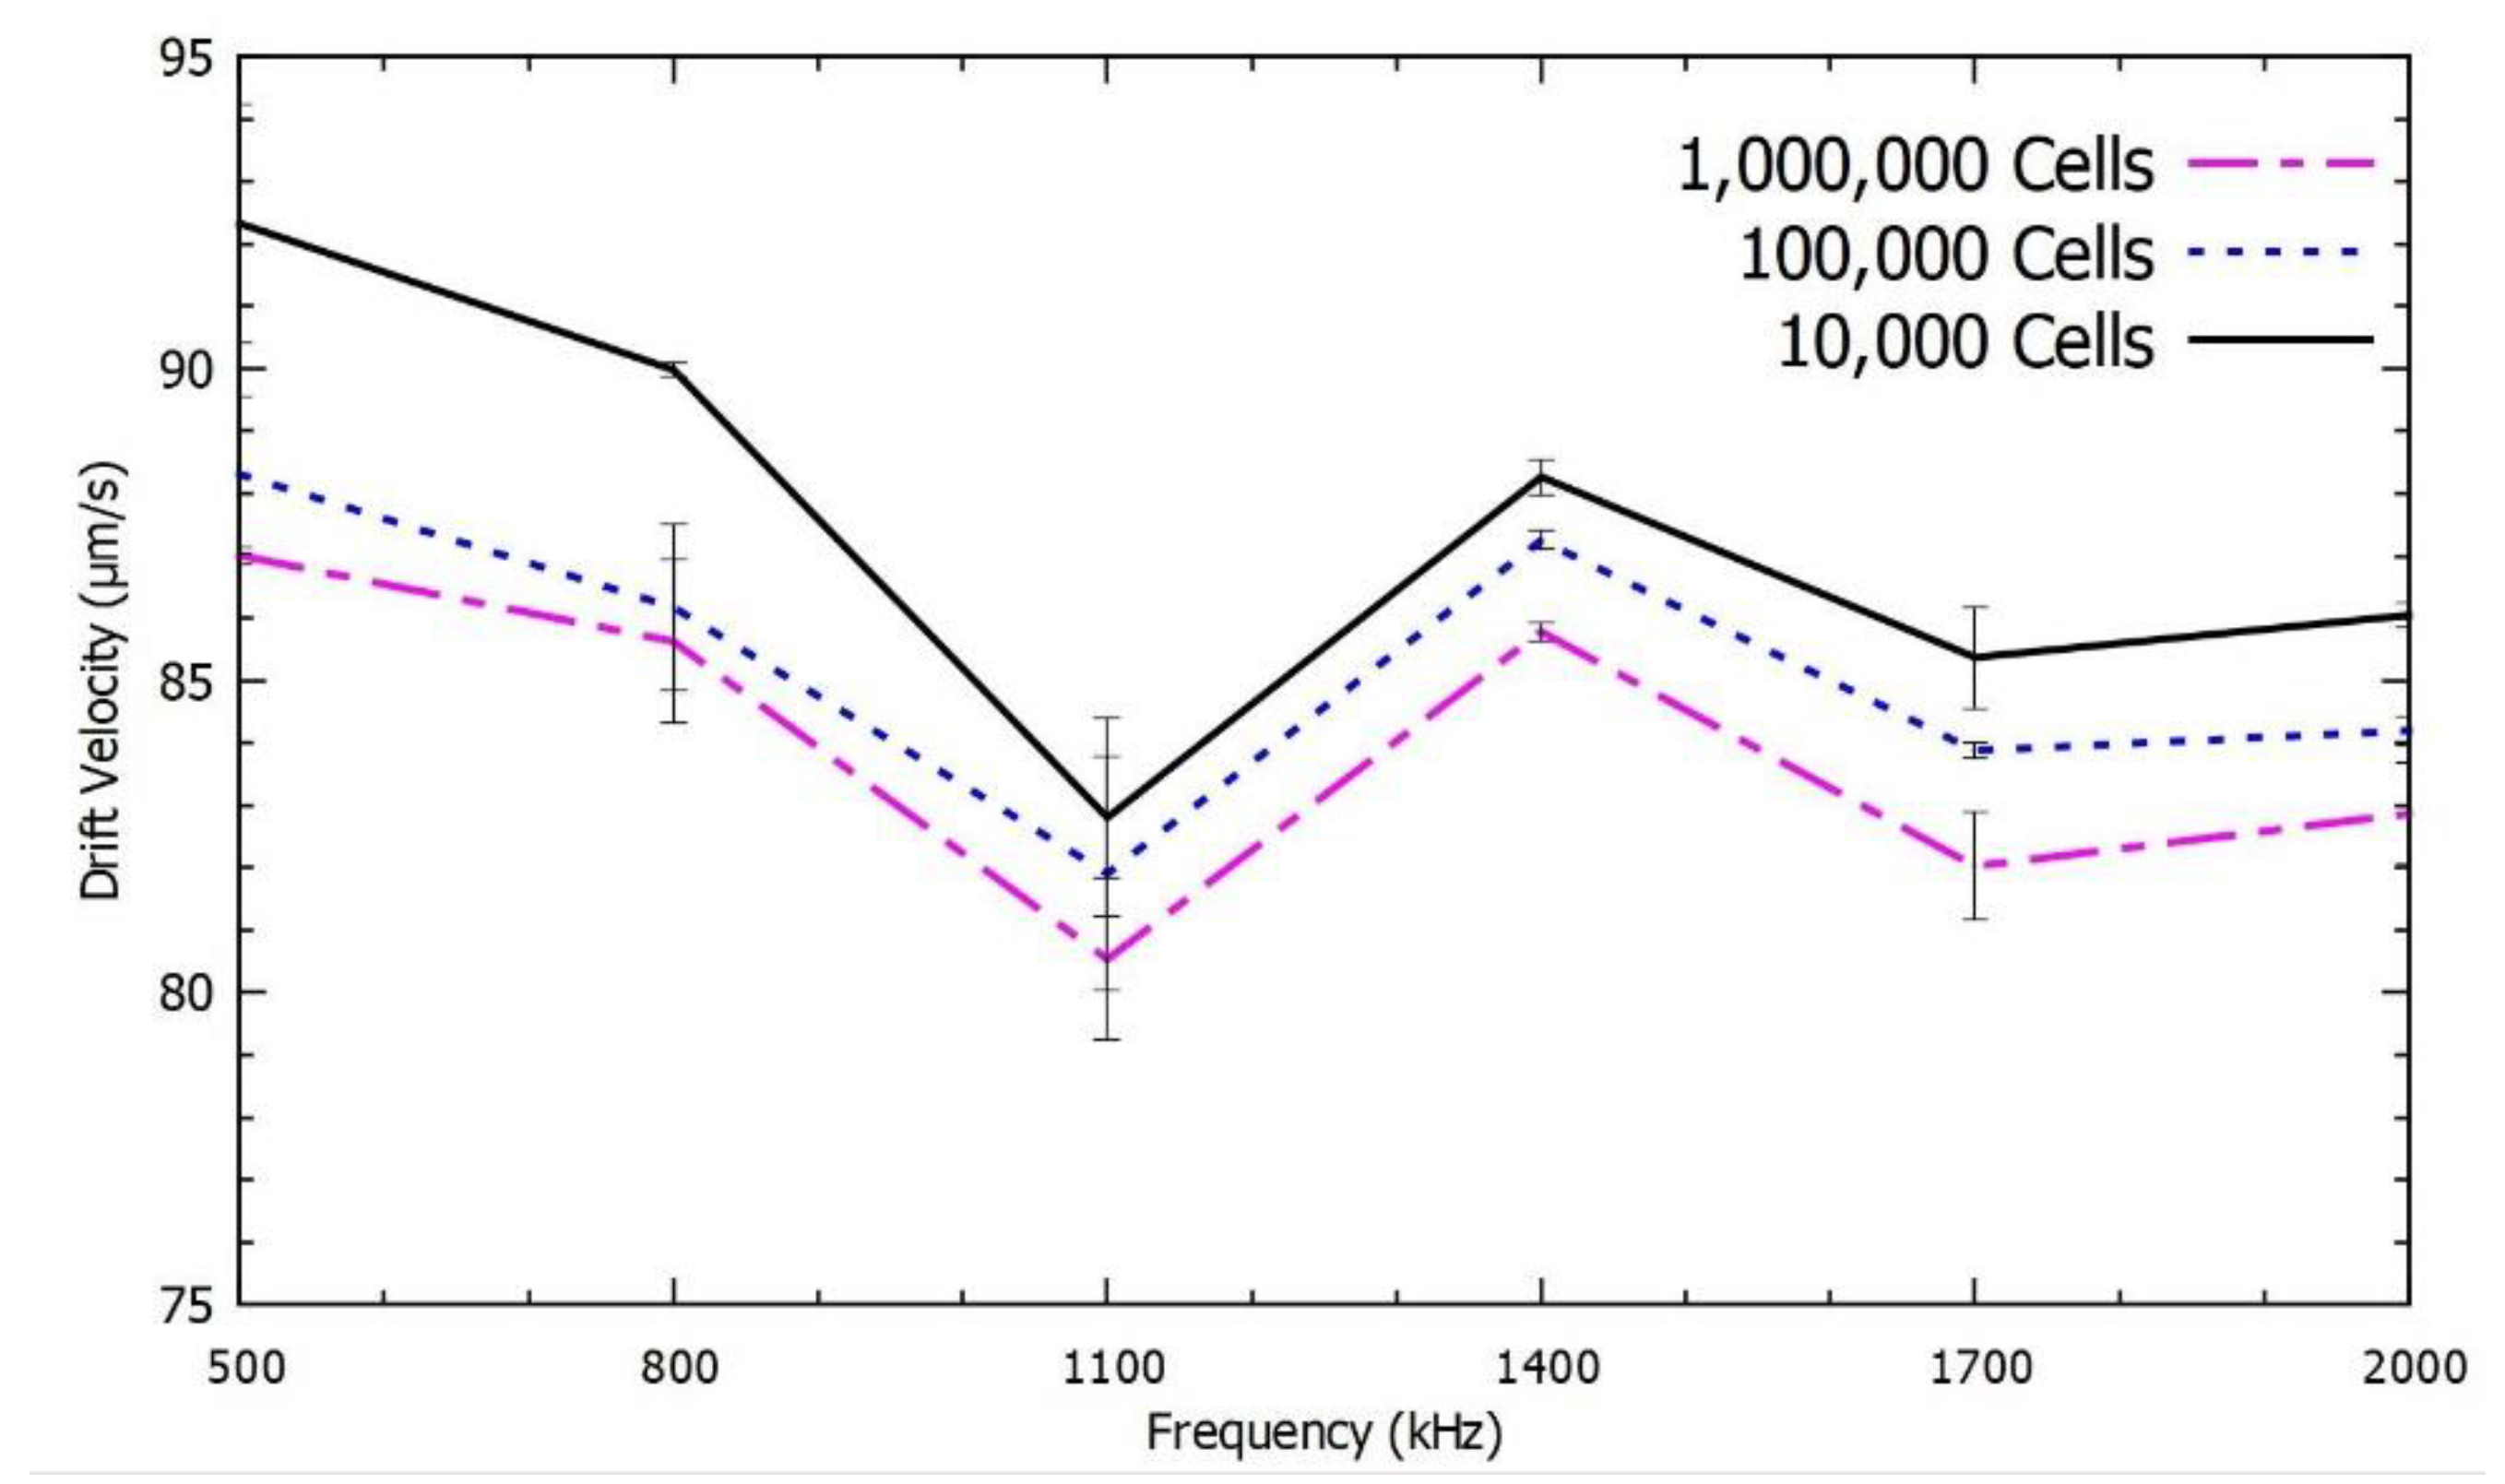
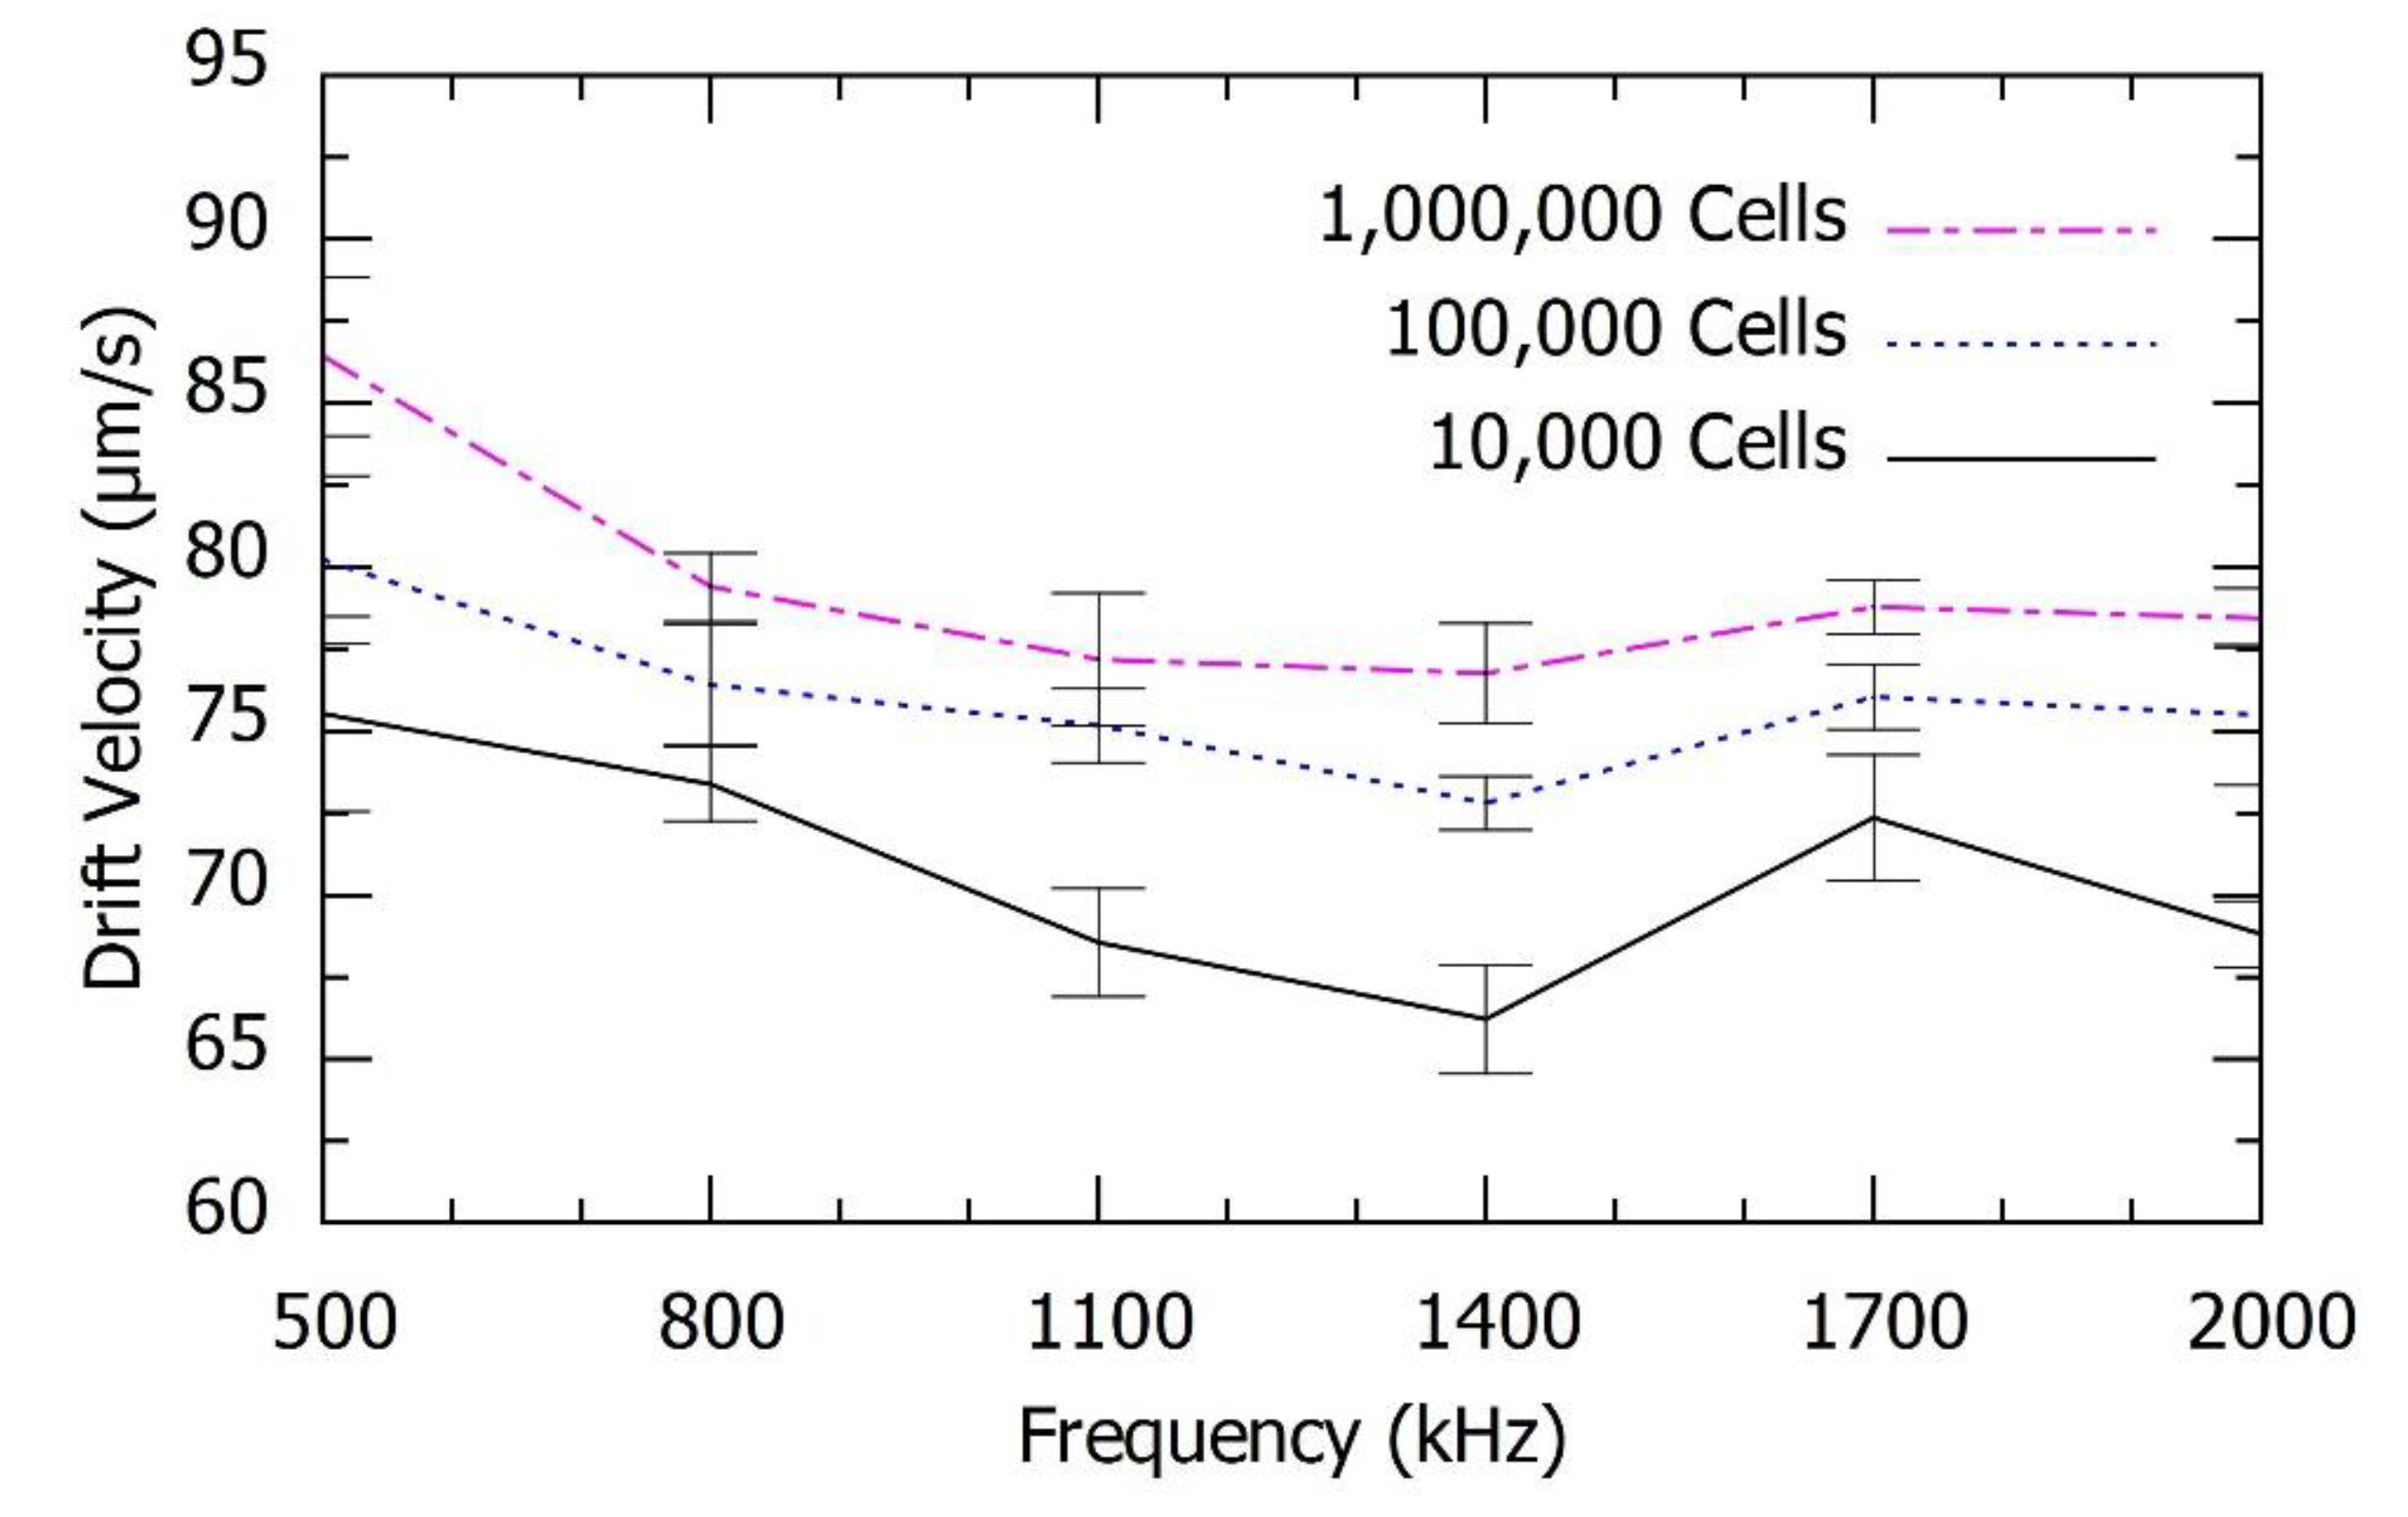
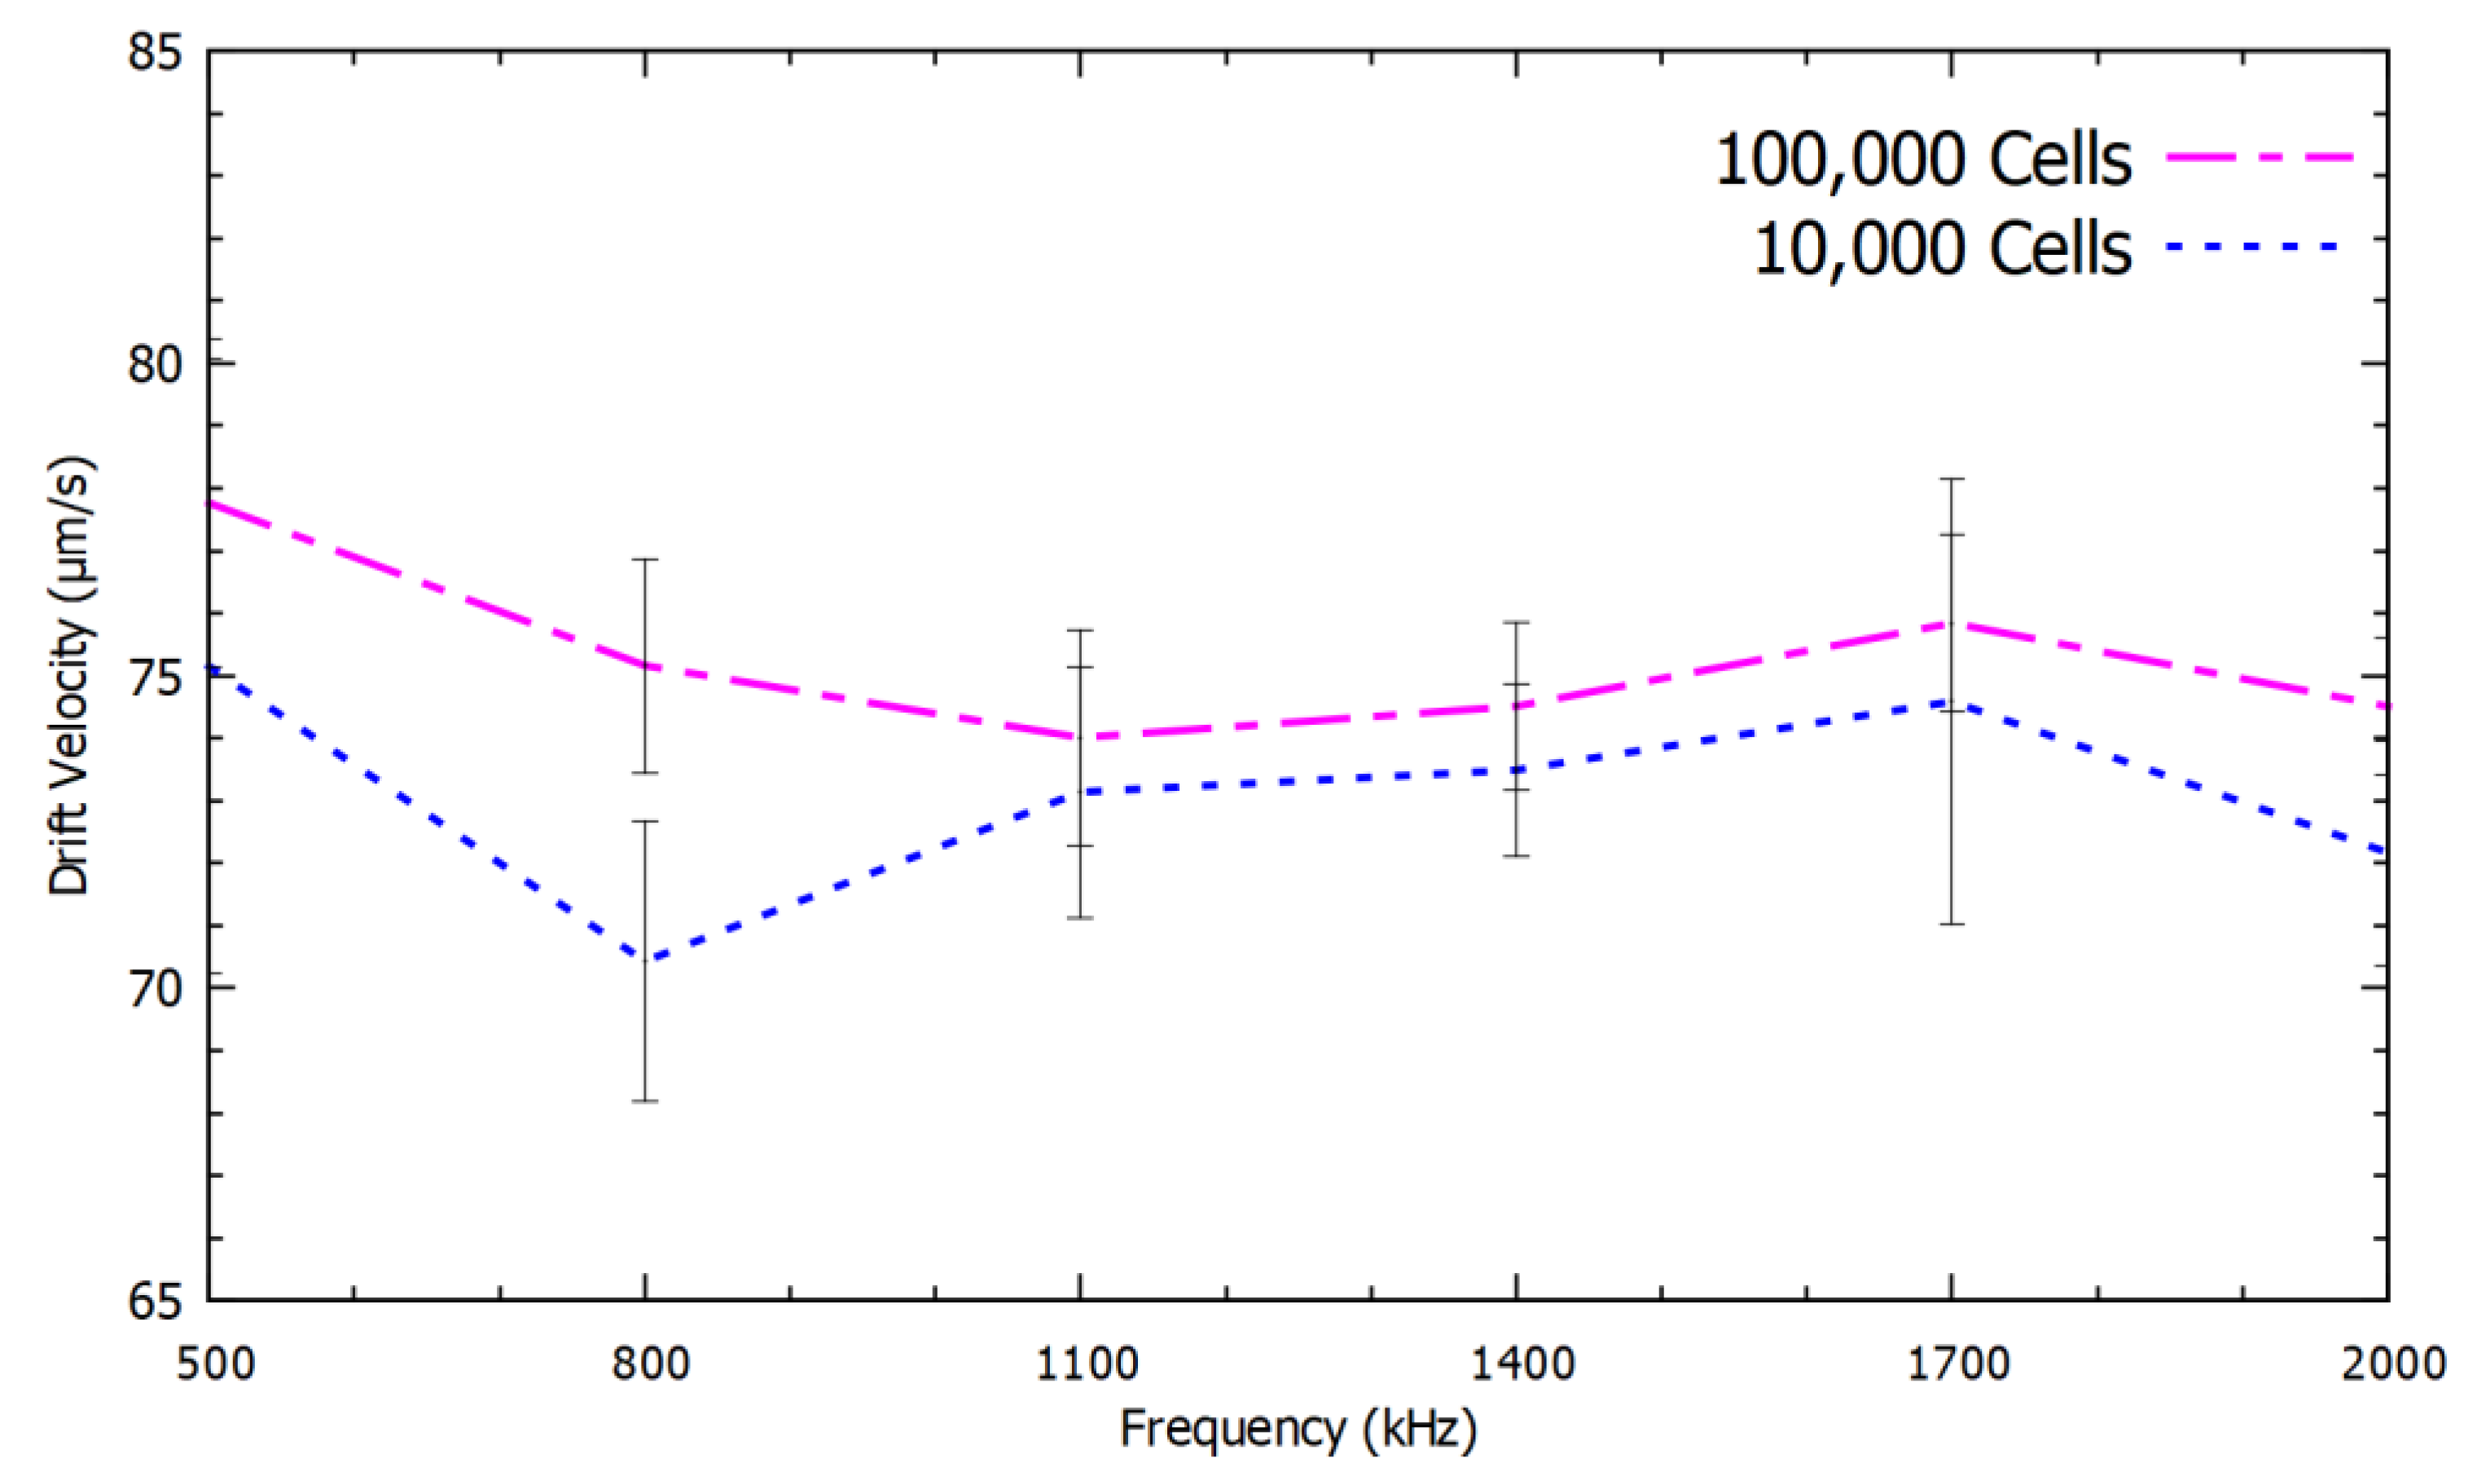
We validated this study to determine the mRNA levels of β-actin, GAPDH and HPRT from 1,000,000 cells, 100,000 cells and 10,000 cells. We observed a relationship between the speed of repulsion of the PM functionalized with different mRNA as a function of both the frequency and the number of cells, which is proportional to the number of mRNA molecules. All the parameters for the experiment were maintained constant to optimize the accuracy. The obtained DEP spectroscopy results are shown in
Figure 6,
Figure 7 and
Figure 8, each experiment was repeated six times to check the precision of the measurements.
Figure 6,
Figure 7 and
Figure 8 show the average of six measurements for each frequency. We plotted the standard deviation of the average measurement calculated with these results using error bars in the
Figure 6,
Figure 7 and
Figure 8 as the indicator of the confidence levels in each individual measurement.
There was no overlap between the confidence intervals in several of the frequencies used to describe the spectrum especially for the mRNA levels of β-actin and GAPDH. However, in the quantification of HPRT, which is rare, an increase in the number of spectral measurements is required to achieve the same accuracy level. Even though there was a significant overlap in the DEP spectrum for HPRT mRNA, the results with 10,000 and 100,000 cells were different by more than one standard deviation with applied frequency at 800 kHz. Therefore, the use of this method with six measurements was sufficient to resolve the number of HPRT mRNA in these two cases.
Since the DEP spectrum could accurately determine each of the mRNA concentration levels of β-actin, GAPDH and HPRT shown in
Figure 6,
Figure 7 and
Figure 8, this label-free method had the potential to be used as the transduction mechanism for the measurement of different varieties of mRNA at different expression levels. This method, which does not require the use of mRNA amplification of fluorescence markers, has the potential to be used in the sensing of protein mRNA biomarkers of diseases.
4. Conclusions
We demonstrated that DEP spectroscopy was an effective transduction mechanism for the extraction and analysis of the genetic expression of β-actin, GAPDH and HPRT from cells that has the potential to be applied in the genetic expression of proteins that could be used as indicators of cancer or the patient response to drugs during treatment. However, the effectiveness of this method to sense the concentration levels of the protein mRNA biomarkers of those diseases has to be investigated for each case. We carried out a demonstration of this biosensor using three different types of mRNA from as little as 10,000 living cells. This technique is rapid and has high specificity when targeting a given mRNA with the use of proper RNA primers. This technique does not require the use of fluorescent labels, which eliminates the washing step of unbound fluorescent molecules in the preparation process and it does not require a careful calibration of the light source and the photodetector sensitivity. The measurement of the negative DEP spectrum does not depend on the light intensity, the number of PM or the sensitivity of the microscope camera. This technique is fast, simple, repeatable and reliable when compared with existing methods for mRNA profiling. We are currently verifying the effectiveness of this method when applied to a significantly smaller number of cells and to mRNA of proteins relevant to the diagnosis of diseases. We planned to investigate the practical application of this method to detect the concentration level of mRNA that is associated with diseases such as cancer.

 ,
, 
