Abstract
In this article, it is shown that the efficiency of an electrochemical aptasensing device is influenced by the use of different nanoparticles (NPs) such as gold nanoparticles (Au), silver nanoparticles (Ag), hollow gold nanospheres (HGN), hollow silver nanospheres (HSN), silver–gold core shell (Ag@Au), gold–silver core shell (Au@Ag), and silver–gold alloy nanoparticles (Ag/Au). Among these nanomaterials, Ag@Au core shell NPs are advantageous for aptasensing applications because the core improves the physical properties and the shell provides chemical stability and biocompatibility for the immobilization of aptamers. Self-assembly of the NPs on a cysteamine film at the surface of a carbon paste electrode is followed by the immobilization of thiolated aptamers at these nanoframes. The nanostructured (Ag@Au) aptadevice for Escherichia coli as a target shows four times better performance in comparison to the response obtained at an aptamer modified planar gold electrode. A comparison with other (core shell) NPs is performed by cyclic voltammetry and differential pulse voltammetry. Also, the selectivity of the aptasensor is investigated using other kinds of bacteria. The synthesized NPs and the morphology of the modified electrode are characterized by UV-Vis absorption spectroscopy, scanning electron microscopy, energy dispersive X-ray analysis, and electrochemical impedance spectroscopy.
1. Introduction
It is well known that the properties of detection systems composed of nano-dimensional elements are different from those of common bulky ones [1]. Among the various nanoparticles (NPs), noble metal nanomaterials such as Ag, Au, Pt, and Pd have attracted a lot of attention for their unique physical and chemical properties like tunable surface plasmonics, high-efficiency electrochemical sensing, enhanced fluorescence, and quantum conductance [2]. Of particular interest are binary metallic nanostructures showing multiple characteristics [3]. In this case, core/shell nanoparticle architectures, in which a layer of metal surrounds another NP core, have shown specific properties different from those of their monometallic counterparts and even alloys [4]. In this structure, the stability and surface chemistry of the shell nanoparticles can be improved along with accessing the physicochemical nature of the core layer. This synergy between two metals can be coordinated by shape, size, and composition. The core/shell nanostructures might exhibit favorable electrocatalytic activity, taking place on the shell of the NPs while the core metal dramatically affects the performance of the whole NPs [5]. Due to their particular electronic and catalytic impacts as well as their good stability, convenience of electron transfer, and biocompatibility [6], gold and silver are ideal choices for the construction of core/shell nanostructures in biosensors. Tang et al. reported a silver–gold core shell (Ag@Au) label-free amperometric immune biosensor [7]. Li et al. introduced a hydrogen peroxide sensor based on Au@Ag@C core-double shell nanocomposites [8]. Eksi et al. developed an electrochemical immunosensor for the determination of E. coli using Ag@Au bioconjugates and anti-E. coli modified PS-microwells [9]. Here we report, for the first time, on the effect of using Ag@Au core shell NPs for the electrochemical aptasensing of gram-negative bacterium E. coli.
E. coli is commonly found in the intestinal track of humans and other warm-blooded animals. It can be transmitted to humans through the consumption of contaminated food or water and is often used as a biomarker to identify fecal contamination [10]. During recent years, a lot of attention has been given to the design of biosensors for the recognition of single cells, viruses, and bacteria [11]. Different techniques have been developed and improved for the monitoring of live targets and their viability such as super resolution fluorescence microscopy, [12] scanning electrochemical microscopy, [13] capillary electrophoresis electrospray ionization mass spectrometry [14], laser ablation inductively coupled plasma mass spectroscopy [15], and chemical patterning-based single cell trapping [16,17]. Among them, electrochemical biosensors are of particular interest due to their remarkable advantages such as low cost, good sensitivity, and fast response. Some examples include a graphene-based potentiometric biosensor for the immediate detection of Staphylococcus aureus [18], the detection of Salmonella Typhimurium using a carbon nanotubes based aptasensor [19] and the real-time detection of cytokines released from immune cells after mitogenic activation [20].
The immobilization of a biorecognition element on the working electrode is a key factor in the development of a biosensor. Artificial oligo nucleotides (aptamers) are potentially well suited for targeting motile objects through the binding of different components on the cell surface such as proteins, polysaccharides, or flagella [21], given the examples in literature such as an aptamer-based Au NP biosensor for the detection of flu viruses [22], aptamer-conjugated NPs for the delivery of paclitaxel to MUC1-positive tumor cells [23] and targeting prostate cancer cells within PLA-PEG-COOH NPs aptamer bioconjugates [24].
This work reports on the joint action of aptamers and Ag@Au core shell NPs on a carbon paste electrode (CPE) for the detection of E. coli. Up to now, only a mixture of nanomaterials instead of core shell NPs have been used for the immobilization of aptamers [25,26,27]. Our electrochemical aptasensor is based on CPE modified with different NPs such as gold nanoparticles (Au), silver nanoparticles (Ag), hollow gold nanospheres (HGN), hollow silver nanospheres (HSN), a silver–gold core shell (Ag@Au), a gold–silver core shell (Au@Ag), and silver/gold alloy nanoparticles (Ag/Au). A comparison of the responses of these different NP-based aptasensors is provided. On the other hand, we report on the development of a label-free aptasensor via direct monitoring of the electrochemical signal of E. coli bacteria.
2. Experimental Section
Experimental details can be found in the supporting information including materials, sequence of aptamers, bacterial strains, culture conditions, procedure for the synthesis of nanoparticles, and preparation of the aptasensor. For the sensing of E. coli, we used an aptamer mixture (aptamer cocktail) composed of three different DNA aptamers, as reported by Kim et al. [28,29].
3. Results and Discussion
3.1. Electrochemical Response of E. coli at Bare Electrode
Figure 1A shows the cyclic voltammograms of a bare CPE in different concentrations of E. coli cells (CFU/mL). In microbiology, CFU (colony forming units) designates the number of viable bacteria in a sample. No oxidation process is observed for cell concentrations lower than 107 CFU/mL. A weak peak appears at ca +0.80 V (vs. Ag/AgCl) from a concentration of 5 × 10⁷ CFU/mL (curve d), increasing with increasing concentrations of E. coli (curve e and f). This irreversible oxidation peak can possibly be attributed to the oxidation of guanine in the bacterial cell cytoplasm to 8-oxo-guanine [30,31]. To obtain more sensitive signals, differential pulse voltammograms (DPV) were recorded (see inset of Figure 1A).
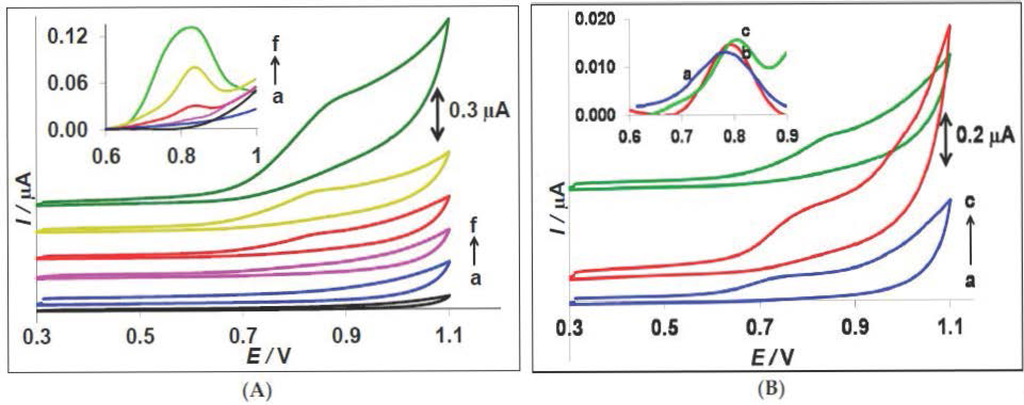
Figure 1.
(A) Cyclic voltammograms of bare CPE in (a) 0.0, (b) 106, (c) 107, (d) 5 × 10⁷, (e) 108, and (f) 109 CFU/mL E. coli in PBS 0.1 M pH 7.0, scan rate 100 mV·s−1; Inset: Differential pulse voltammograms of bare CPE in different concentrations of E. coli, pulse height: 0.05 V, scan rate: 20 mV·s−1. (B) Cyclic voltammograms of bare CPE in 5 × 10⁷ CFU/mL of different bacteria in PBS 0.1 M pH 7.0: (a) Pseudomonas aeruginosa, (b) Staphylococcus aureus, and (c) Escherichia coli. Inset: Differential pulse voltammograms of bare CPE in different bacteria.
Figure 1B illustrates the cyclic voltammograms of bare CPE in 5 × 10⁷ CFU/mL of different bacteria: (a) Pseudomonas aeruginosa; (b) Staphylococcus aureus; and (c) Escherichia coli. A similar process for both other types of bacteria is observed, approximately at the same potential [31,32]. The inset of this figure shows the DPV of a bare CPE in different bacteria solution. Accordingly, the peak around +0.80 V in DPV was selected as a characteristic signal for monitoring of E. coli and other bacteria.
3.2. Characterization of the Nanoparticles
Figure S1 provides the overview of the different synthesized nanoparticles. They are red, deep yellow, pale pink or yellowish red, dark reddish pink, pale yellow, blue, and dark orange for gold, silver, a silver/gold alloy, the silver–gold core shell, the gold-silver core shell, hollow gold nanospheres, and hollow silver nanospheres, respectively. The corresponding UV-Vis absorption spectroscopic data are shown in Figure S2. Generally, the absorption peaks of the metallic nanoparticles are linked to the surface plasmon resonances (SPR) absorption. The SPR effect in metallic compounds is of interest for a variety of applications because of the large electromagnetic field enhancement that occurs in the vicinity of the metal surface and the resonance wavelength depends on the size, shape, and local dielectric environment of nanoparticles [33]. The absorbance wavelengths are as follows: λmax = 406, 420, 450, 525, 535, 565, and 640 nm for Ag, Au@Ag, HSN, Ag/Au, Ag@Au, Au, and HGN, respectively. This is in agreement with the reported colors and wavelengths [6]. Usually, checking the color and λmax is the most straightforward way to confirm the quality of the synthesized nanoparticles [34]. Figures S3 and S4 represent the SEM images and EDX analyses for all synthesized nanoparticles. As can be seen in Figure S3, the size distribution of nanoparticles ranges from 30 to 100 nm. In the solutions containing silver NPs, there is a higher tendency for agglomeration compared to solutions containing gold NPs [35,36], clearly illustrated in Figure S3B, C, and E; hollow silver nanospheres, especially, form clusters (Figure S3G). The energy dispersive X-ray analysis is used to provide elemental identification (Figure S4) [37]. The indicative peaks for both Au and Ag elements in Figures S4C–E prove the existence of binary nanostructures at the surface of the working electrode [8].
3.3. Characterization of the Modified CPE
A cysteamine film is formed at the surface of CPE to capture the nanoparticles in a next step. During successive CV scanning, the cysteamine is chemically adsorbed at the CPE via amine oxidation, while the thiol end group is free to interact with neighboring molecules [38]. After immersing the cysteamine-modified CPE in the nanoparticles solution, a strong interaction between either Au or Ag nanoparticles and the thiol group present at the electrode will appear because of the inherent affinity between sulfur and some metals like gold, silver, palladium, and copper [39].
Cyclic voltammetry was selected to determine the surface coverage of the working electrode. The cysteamine-modified CPE, after overnight immersing in a nanoparticle solution, was washed and CV was performed in a phosphate buffer solution (PBS) 0.1 M pH 7.0. Five successive cyclic voltammograms were recorded without a change in the current potential readout, confirming the stability of fixed nanoparticles at the cysteamine film during potential cycling. Hence, it acts as a strong template for the immobilization of aptamers. The amperometric responses of a bare CPE and a cysteamine modified CPE are shown in Figure S5.
Figure 2A illustrates the current potential behavior of a gold nanoparticles modified CPE in PBS solution. An oxidation and reduction peak for gold can be observed at 0.96 V and 0.53 V, respectively [40]. Also, both the CV of a bare CPE (red CV) and Cys-CPE (green CV) are shown in this figure, acting as background curves. Figure 2B represents the current potential behavior of a silver nanoparticles modified CPE, showing a characteristic peak for the oxidation and reduction of silver [41]. The cyclic voltammogram of an Ag/Au alloy nanoparticles modified CPE indicates, in Figure 2C, both the existence of Ag and Au at the surface. However, the oxidation of Ag in the alloy starts at a less positive potential in comparison with pure Ag. Indeed, silver alloys are more active than pure Ag and they act as an intermediate bridge to accelerate the electron transport [42].
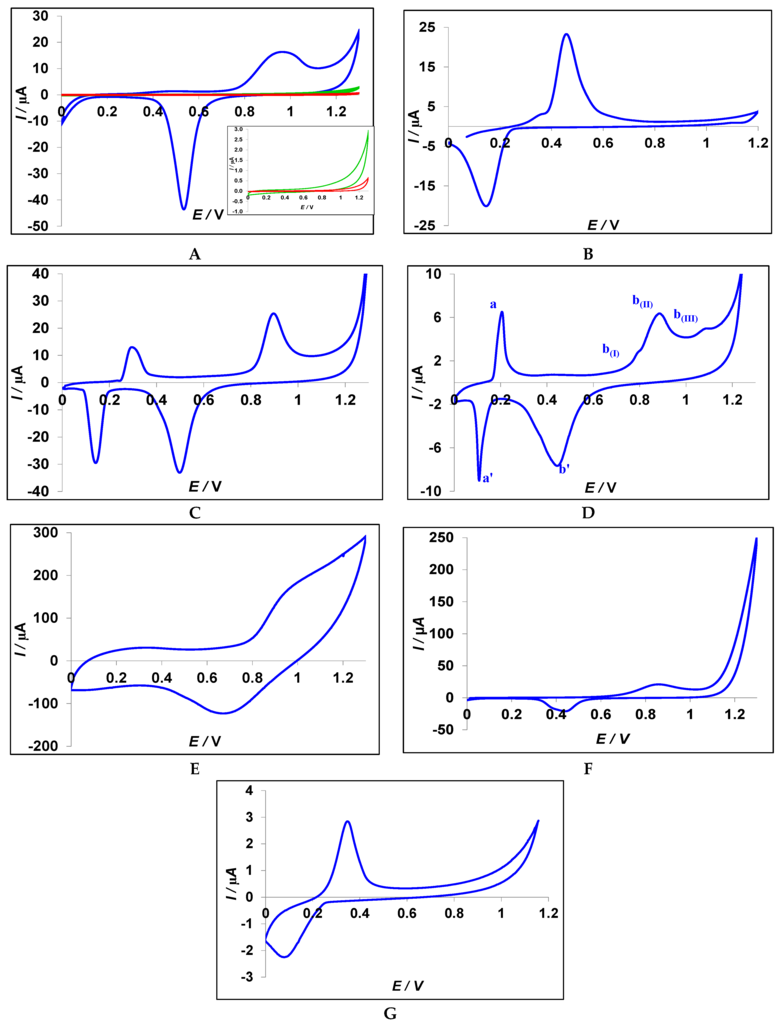
Figure 2.
Cyclic voltammograms of modified CPE with different synthesized nanoparticles in PBS 0.1 M pH 7.0, scan rate 100 mV·s−1. In Figure 2A, both the CV of a bare CPE and Cys-CPE are plotted in red and green, respectively (inset: zoom of the curves). (A) Gold nanoparticles (Au); (B) silver nanoparticles (Ag); (C) silver–gold alloy (Ag/Au); (D) silver–gold core shell (Ag@Au); (E) gold–silver core shell (Au@Ag); (F) hollow gold nanospheres (HGN); (G) hollow silver nanospheres (HSN).
The current potential behavior of Ag@Au-coated CPE is shown in Figure 2D. In this cyclic voltammogram, a quasi-reversible peak (aa′) and irreversible peak (bb′) appear for silver and gold. The peaks a (Epa = 0.2 V) and a′ (Epc = 0.1V) belong to the oxidation and reduction of silver nanoparticles (ΔEp = 90 mV), respectively [41,43]. This sharp characteristic peak proves the existence of silver at the surface of the working electrode. The oxidation and reduction of Au (bb′) takes place at more positive potentials. A series of anodic peaks (b(I), b(II), and b(III)) correspond to intermediate steps leading to the formation of an AuO/OH layer [44]. The cathodic peak at 0.45 V on the return scan (b) represents the reduction of the AuO/OH layer [45]. The comparison between Ag/Au and Ag@Au-modified CPE leads to two key observations: first, there is almost no difference in the peak potentials for the oxidation and the reduction of gold and silver; secondly, the peak currents of the alloy modified CPE are higher than the silver–gold core shell modified CPE. This can be explained by the position of Ag in these two binary nanostructures. In the core shell structure, Ag is surrounded by Au as a shell, while in the alloy structure the metal of Ag is as accessible as Au. Additionally, there is a higher tendency for aggregation of the nanoparticles whenever silver is accessible [36]. Therefore, the amount of stabilized particles would be increased due to silver agglomeration. The higher peak current somehow indicates the bigger portion of these metals at the surface of the working electrode. The SEM images are in good agreement with these observations.
Figure 2E shows the cyclic voltammogram of an Au@Ag-modified CPE. In this structure, Au particles are covered by an Ag shell. Therefore, Ag is the outer element. As can be seen, there is no clear peak, except the huge charging current that belongs to poly(vinylpyrrolidinone) (PVP) [46], which is necessary to synthesize this type of core shell. Therefore, this nanostructure is not useful for our purposes, i.e., the immobilization of aptamers. Figure 2F,G depict the CV of HGN and HSN, respectively. The positions of the oxidation and reduction peaks are similar to Au and Ag in Figure 2A,B.
3.4. Electrochemical Detection of E. coli and the Role of Ag@Au Nanoparticles
The whole procedure to fabricate the aptasensor is presented in Figure 3 and explained in the experimental section of the supporting information. Briefly, after preparation of CPE, a film of cysteamine was formed at the surface of CPE by performing cyclic voltammetry [38]. Then, it was immersed in the nanoparticles solution overnight to form a nanotemplate at the surface of the working electrode. For the immobilization of the aptamer, a modified CPE was soaked in the aptamer solution (2.5 μM, overnight). Next, the aptasensor was transferred to suspensions with different concentrations of living bacteria (30 min) to allow binding to E. coli. Subsequently, it was gently washed and moved to 0.1 M PBS pH 7.0 for voltammetric measurements.
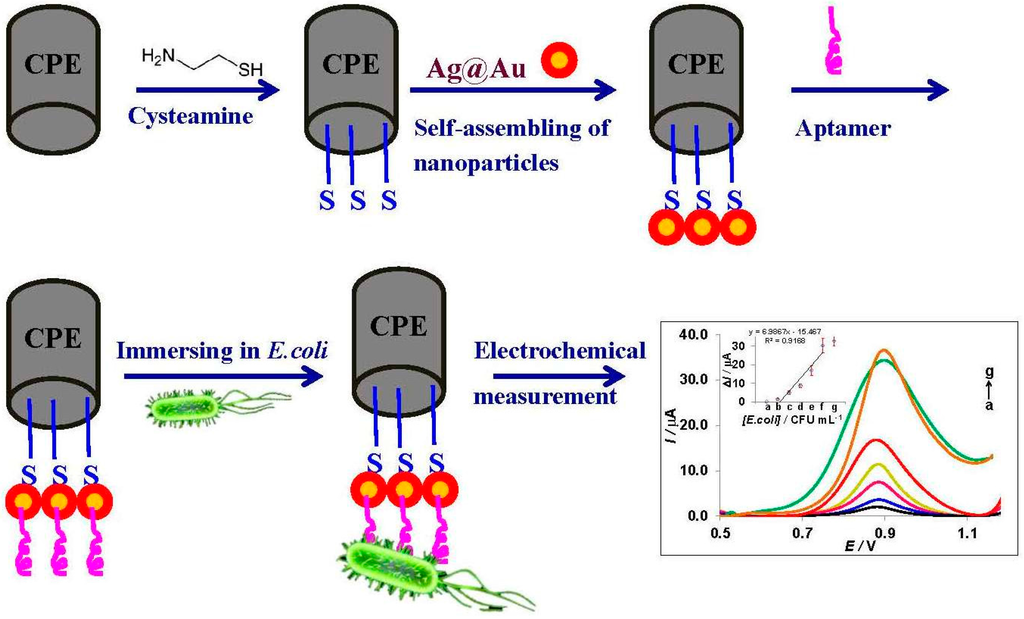
Figure 3.
Schematic diagram of the procedure.
As observed in the inset of Figure 1B, the oxidation of the bacteria solution shows a representative signal around 0.80 V, using DPV at the surface of a bare CPE. Figure 4A shows the DPVs of the Ag@Au aptasensor in different concentrations of E. coli. There is an enhanced signal around 0.88 V when increasing the bacteria concentration from 0.0 to 105 CFU/mL. The oxidation signal of E. coli at the surface of a bare CPE could only be observed at concentrations higher than 5 × 10⁵ CFU/mL (see Figure 1A). However, the bacteria oxidation process at bare CPE occurs at less positive potential in comparison to the aptamer-modified CPE. This small shift in the position of the potential can be attributed to the coverage of CPE. On the other hand, the oxidation of gold happens approximately at this potential (see Figure 2A,C,D). Therefore, we assume an overlap between these two oxidation signals, guanine oxidation in E. coli, and gold oxidation of the nanostructures, playing a synergetic effect in its detection. The stability of gold at the surface of the working electrode is confirmed by successive CV scanning, as shown in Figure 2.
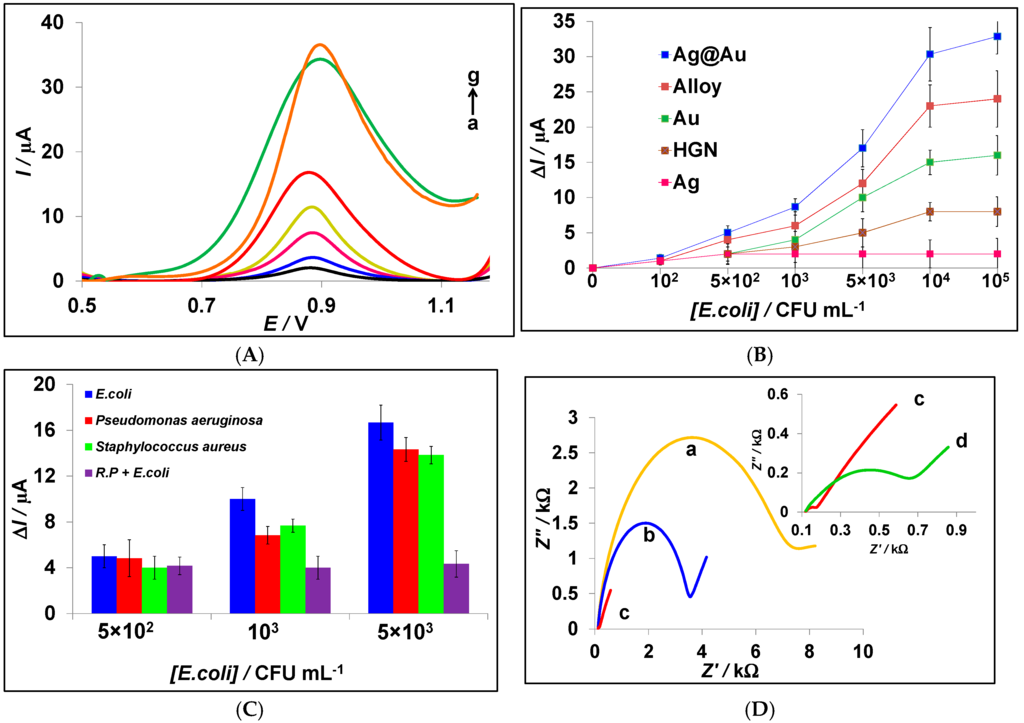
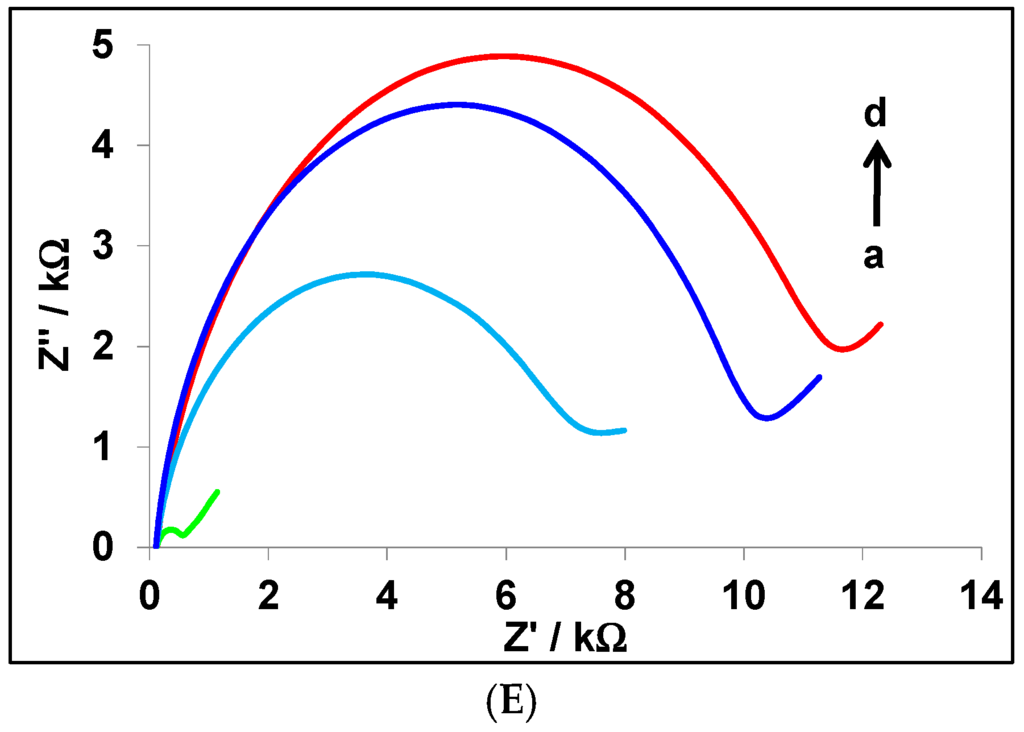
Figure 4.
(A) Differential pulse voltammograms of Ag@Au aptasensor in (a) 0.0, (b) 102, (c) 5 × 10², (d) 103, (e) 5 × 10³, (f) 104, and (g) 105 CFU/mL E. coli in PBS 0.1 M pH 7.0; (B) calibration curve for variation of ΔI (µA) vs. concentration of E. coli using modified CPE with different synthesized nanoparticles. (C) Histogram of selectivity study for different bacteria: Escherichia coli, Pseudomonas aeruginosa, Staphylococcus aureus, and random primer (R.P.); (D) electrochemical impedance spectra for (a) bare CPE, (b) Cys-CPE, (c) Ag@Au-Cys-CPE, and (d) Apt-Ag@Au-Cys-CPE; (E) electrochemical impedance spectra at Apt-Ag@Au-Cys-CPE in different concentrations of E. coli (a) 0.0, (b) 103, (c) 104, and (d) 105 CFU/mL in the presence of 5 mM [Fe(CN)6]3−/4−, 0.1 M NaCl, 0.1 M PBS pH 7.0; the concentration of aptamer is 2.5 μM.
Figure 4B illustrates the calibration curve expressing the variation of ΔI (I1–I0)/μA vs. the concentration of E. coli. I0 and I1 belong to the DPV current of the aptasensor in PBS and E. coli, respectively. The best performance is attributed to the Ag@Au-aptasensor and there is a linear relationship between peak current and the concentration of E. coli to 104 CFU/mL. For higher concentrations, the current no longer changes significantly because of the saturation of the surface [29]. The calculated LOD for this aptasensor is around 90 CFU/mL, while the reported LOD in the literature for this aptamer cocktail is 370 CFU/mL at the surface of a gold electrode [28]. Hence, the silver–gold core shell binary nanoparticles improve the efficiency of the aptasensor by four times.
The obtained LOD values for the alloy and the Au NPs modified aptasensor are 245 and 300 CFU/mL, respectively. So, the silver/gold alloy leads to a higher sensitivity than obtained at the Au NPs modified electrode. A better performance for Ag@Au in comparison with the Ag/Au alloy can be explained by the position of silver in these binary nanostructures. In the first one, silver is covered by the gold nanoparticles, so that agglomeration of the Ag NPs cannot be initiated. In contrast, in the alloy structure, the silver particles are easily accessible and tend to aggregate. This phenomenon, observed in the SEM images, limits the performance of the nanoframes. In comparison with other nanoparticles, hollow gold nanospheres showed less effect on the efficiency of this electrochemical aptasensor, probably due to their narrow wall [6].
In general, a better diagnostic performance of the core shell nanoparticles modified sensor can be explained by the high surface-to-volume ratio of the assembled nanoparticles enhancing the density of the immobilized aptamers [24]. Also, the layer of nanoparticles may work as an intervening “spacer” matrix to keep the immobilized aptamers away from the substrate matrix in the mobile phase, resulting in more accessible binding sites for the target [47,48]. Therefore, these nanomaterials can significantly affect the aptasensing of E. coli.
Silver nanoparticles did not show any promising response in the aptasensor. A lower tendency of Ag to interact with thiols, compared to Au-thiol, might cause this difference [49,50]. For this reason, a lower amount of Ag NPs can self-assemble on the cysteamine-modified CPE and consequently fewer aptamers are immobilized at this nanoframe. Also, Ag NPs did not oxidize in the potential range of the bacteria. Therefore, these nanoparticles alone could not have any added value in the detection strategy. The experiments with HSN and Au@Ag, with the silver as a cover for gold NPs, were performed and similar results as with Ag NPs were observed. The difficulty with Au@Ag was the presence of the surfactant in the solution of these nanoparticles. The addition of PVP and CTAB was necessary for its synthesis, but problematic for electrochemical detection as a self-assembly monolayer is formed at the surface of the working electrode which disturbs the signals. As shown in Figure 2E, it was not possible to obtain a sharp signal similar to that observed for the other nanoparticles.
As a conclusion of Figure 4B, an increment in the efficiency of aptasensing is observed in the following order: Ag < HGN < Au < Ag/Au < Ag@Au. The excellent performance of the core shells in the series can be explained by the fact that Au NPs and Ag NPs have a different surface plasmon band [51] and the extinction coefficient of the surface plasmon band for the Ag NPs is nearly four times larger than for Au NPs of the same size [52]. Therefore, in the composition of Ag@Au core shells, the physical properties of Ag nanoparticles combined with the surface chemistry of Au allows for functionalization with an aptamer. Additionally, Ag NPs in the core decrease the resistance of electron transfer, enhancing the sensitivity [7].
The specificity of the aptasensor was examined for other bacterial species. Figure 4C shows the histogram of a selectivity study for Escherichia coli, Pseudomonas aeruginosa, and Staphylococcus aureus in three concentrations using the Ag@Au aptasensor. Also, in another set of experiments, a random primer (RP) was used instead of the specific aptamer cocktail for E. coli. As seen in lower concentration ranges (5 × 10² CFU/mL), there was no recognition between different species. However, the detection ability improved when increasing the concentration of bacteria. The random primer could not detect any kind of targets, indicating the good performance of the aptamer cocktail.
Electrochemical impedance spectroscopy was selected to characterize the electrode surface in each step of the preparation of the Ag@Au aptasensor and the detection of E. coli (Figure 4D). The EIS measurements were performed in the presence of [Fe(CN)6]3−/4−, as electroactive marker ions. As EIS is a method of measuring the impedance value of the electrode surface, it can recognize the events happening at the surface of the working electrode. The diameter of the semicircle in EIS represents the electron transfer resistance, Ret; therefore, the further impeding in the electron transfer, the higher the Ret. The values of Ret for bare CPE and cysteamine-modified CPE are 7.07 kΩ (curve a) and 3.54 kΩ (curve b), respectively. The decrease in Ret after modification of CPE by cysteamine is due to the oxidation of CPE surface during pre-treatment. Consequently, there are some positive sites at CPE that can accelerate the negative marker ions at the surface of working electrode. After immersing the modified CPE in the core shell solution, the Ret changes (curve c = 0.10 kΩ), indicating that Ag@Au nanoparticles are chemically fixed to the cysteamine film at the surface of CPE. The Ret has decreased due to the enhancement of the conductivity of the surface of the working electrode [38]. After immobilization of the aptamer at this nanostructure template, the Ret has increased (curve d = 0.75 kΩ) because of the electrostatic repulsion between negatively charged DNA in the aptamer structure and the marker ions. When E. coli bacteria (103 CFU/mL) are captured by the aptamer, the Ret dramatically increased (Figure 4E, curve b = 8.85 kΩ) because of the bulky size of the bacteria in comparison to the aptamer, which prevents the marker ions from reaching the surface of the working electrode [53]. Curves c and d in Figure 4E show the EIS data for different concentrations of E. coli. As can be seen, the diameter of the semicircles increases with higher concentrations of the target.
4. Conclusions
A qualitative investigation of NPs with different structures on the efficiency of an aptasensor for E. coli was performed. Various NPs were synthesized and their performances were compared. In this study, for the first time, NPs were used as a template for the immobilization of an aptamer cocktail at the surface of a carbon paste electrode to produce an electrochemical aptasensor for E. coli. The results showed that silver–gold core shell NPs improved the efficiency of the aptasensing of E. coli. In these binary NPs, the silver is positioned inside the nanostructure, and surrounded by gold particles as a shell. Therefore, the outside layer of the NPs provides a support for the covalent attachment of aptamers, functionalized with a thiol group. The conductive silver metal as a core increases the efficiency of the transduction of the signals. The label-free aptasensing strategy uses the intrinsic oxidation peak of bacterial cells with an increased sensitivity for the detection of E. coli compared to the sensitivity of the aptasensors constructed with other nanomaterials.
Supplementary Materials
Supplementary materials are available online at http://www.mdpi.com/2227-9040/4/3/16/s1.
Acknowledgments
Ezat Hamidi-Asl was financially supported by Belspo (University of Antwerp). The authors are thankful to Femke De Croock for her technical support and to Stanislav Trashin for his worthwhile comments on the manuscript.
Author Contributions
E.H.-A. and S.P. performed the measurements and wrote the manuscript. F.D., R.B. and K.D.W. coordinated the project and commented on the manuscript.
Conflicts of Interest
The authors declare no conflict of interest.
References
- Yin, Y.; Rioux, R.M.; Erdonmez, C.K.; Hughes, S.; Somorjai, G.A.; Alivisatos, A.P. Formation of hollow nanocrystals through the nanoscale kirkendall effect. Science 2004, 304, 711–714. [Google Scholar] [CrossRef] [PubMed]
- Campion, A.; Kambhampati, P. Surface-enhanced raman scattering. Chem. Soc. Rev. 1998, 27, 241–250. [Google Scholar] [CrossRef]
- Milliron, D.J.; Hughes, S.M.; Cui, Y.; Manna, L.; Li, J.; Wang, L.-W.; Paul Alivisatos, A. Colloidal nanocrystal heterostructures with linear and branched topology. Nature 2004, 430, 190–195. [Google Scholar] [CrossRef] [PubMed]
- Toshima, N.; Harada, M.; Yonezawa, T.; Kushihashi, K.; Asakura, K. Structural analysis of polymer-protected palladium/platinum bimetallic clusters as dispersed catalysts by using extended X-ray absorption fine structure spectroscopy. J. Phys. Chem. 1991, 95, 7448–7453. [Google Scholar] [CrossRef]
- Ferrando, R.; Jellinek, J.; Johnston, R.L. Nanoalloys: From theory to applications of alloy clusters and nanoparticles. Chem. Rev. 2008, 108, 845–910. [Google Scholar] [CrossRef] [PubMed]
- Khlebtsov, N.G.; Dykman, L.A. Optical properties and biomedical applications of plasmonic nanoparticles. J. Quant. Spectrosc. Radiat. Transf. 2010, 111, 1–35. [Google Scholar] [CrossRef]
- Tang, D.; Yuan, R.; Chai, Y. Ligand-functionalized core/shell Ag@Au nanoparticles label-free amperometric immun-biosensor. Biotechnol. Bioeng. 2006, 94, 996–1004. [Google Scholar] [CrossRef] [PubMed]
- Li, Y.; Zhang, Y.; Zhong, Y.; Li, S. Enzyme-free hydrogen peroxide sensor based on Au@Ag@C core-double shell nanocomposites. Appl. Surf. Sci. 2015, 347, 428–434. [Google Scholar] [CrossRef]
- Eksi, H.; Güzel, R.; Güven, B.; Boyaci, I.H.; Solak, A.O. Fabrication of an electrochemical E. coli biosensor in biowells using bimetallic nanoparticle-labelled antibodies. Electroanalysis 2015, 27, 343–352. [Google Scholar] [CrossRef]
- Belluco, S.; Barco, L.; Roccato, A.; Ricci, A. Escherichia coli and enterobacteriaceae counts on poultry carcasses along the slaughterline: A systematic review and meta-analysis. Food Control 2016, 60, 269–280. [Google Scholar] [CrossRef]
- Søndergaard, R.V.; Christensen, N.M.; Henriksen, J.R.; Kumar, E.K.P.; Almdal, K.; Andresen, T.L. Facing the design challenges of particle-based nanosensors for metabolite quantification in living cells. Chem. Rev. 2015, 115, 8344–8378. [Google Scholar] [CrossRef] [PubMed]
- Jones, S.A.; Shim, S.-H.; He, J.; Zhuang, X. Fast, three-dimensional super-resolution imaging of live cells. Nat. Methods 2011, 8, 499–505. [Google Scholar] [CrossRef] [PubMed]
- Bergner, S.; Wegener, J.; Matysik, F.-M. Monitoring passive transport of redox mediators across a confluent cell monolayer with single-cell resolution by means of scanning electrochemical microscopy. Anal. Methods 2012, 4, 623–629. [Google Scholar] [CrossRef]
- Nemes, P.; Knolhoff, A.M.; Rubakhin, S.S.; Sweedler, J.V. Metabolic differentiation of neuronal phenotypes by single-cell capillary electrophoresis–electrospray ionization-mass spectrometry. Anal. Chem. 2011, 83, 6810–6817. [Google Scholar] [CrossRef] [PubMed]
- Drescher, D.; Giesen, C.; Traub, H.; Panne, U.; Kneipp, J.; Jakubowski, N. Quantitative imaging of gold and silver nanoparticles in single eukaryotic cells by laser ablation icp-ms. Anal. Chem. 2012, 84, 9684–9688. [Google Scholar] [CrossRef] [PubMed]
- Collins, J.M.; Lam, R.T.S.; Yang, Z.; Semsarieh, B.; Smetana, A.B.; Nettikadan, S. Targeted delivery to single cells in precisely controlled microenvironments. Lab Chip 2012, 12, 2643–2648. [Google Scholar] [CrossRef] [PubMed]
- Trouillon, R.; Passarelli, M.K.; Wang, J.; Kurczy, M.E.; Ewing, A.G. Chemical analysis of single cells. Anal. Chem. 2012, 85, 522–542. [Google Scholar] [CrossRef] [PubMed]
- Hernández, R.; Vallés, C.; Benito, A.M.; Maser, W.K.; Xavier Rius, F.; Riu, J. Graphene-based potentiometric biosensor for the immediate detection of living bacteria. Biosens. Bioelectron. 2014, 54, 553–557. [Google Scholar] [CrossRef] [PubMed]
- Zelada-Guillén, G.A.; Riu, J.; Düzgün, A.; Rius, F.X. Immediate detection of living bacteria at ultralow concentrations using a carbon nanotube based potentiometric aptasensor. Angew. Chem. Int. Ed. 2009, 48, 7334–7337. [Google Scholar] [CrossRef] [PubMed]
- Liu, Y.; Kwa, T.; Revzin, A. Simultaneous detection of cell-secreted tnf-α and ifn-γ using micropatterned aptamer-modified electrodes. Biomaterials 2012, 33, 7347–7355. [Google Scholar] [CrossRef] [PubMed]
- Liu, J.; Morris, M.D.; Macazo, F.C.; Schoukroun-Barnes, L.R.; White, R.J. The current and future role of aptamers in electroanalysis. J. Electrochem. Soc. 2014, 161, H301–H313. [Google Scholar] [CrossRef]
- Le, T.T.; Adamiak, B.; Benton, D.J.; Johnson, C.J.; Sharma, S.; Fenton, R.; McCauley, J.W.; Iqbal, M.; Cass, A.E.G. Aptamer-based biosensors for the rapid visual detection of flu viruses. Chem. Commun. 2014, 50, 15533–15536. [Google Scholar] [CrossRef] [PubMed]
- Yu, C.; Hu, Y.; Duan, J.; Yuan, W.; Wang, C.; Xu, H.; Yang, X.-D. Novel aptamer-nanoparticle bioconjugates enhances delivery of anticancer drug to muc1-positive cancer cells in vitro. PLoS ONE 2011, 6, e24077. [Google Scholar] [CrossRef] [PubMed]
- Farokhzad, O.C.; Jon, S.; Khademhosseini, A.; Tran, T.-N.T.; LaVan, D.A.; Langer, R. Nanoparticle-aptamer bioconjugates: A new approach for targeting prostate cancer cells. Cancer Res. 2004, 64, 7668–7672. [Google Scholar] [CrossRef] [PubMed]
- Wang, A.Z.; Bagalkot, V.; Vasilliou, C.C.; Gu, F.; Alexis, F.; Zhang, L.; Shaikh, M.; Yuet, K.; Cima, M.J.; Langer, R.; et al. Superparamagnetic iron oxide nanoparticle–aptamer bioconjugates for combined prostate cancer imaging and therapy. ChemMedChem 2008, 3, 1311–1315. [Google Scholar] [CrossRef] [PubMed]
- Medley, C.D.; Bamrungsap, S.; Tan, W.; Smith, J.E. Aptamer-conjugated nanoparticles for cancer cell detection. Anal. Chem. 2011, 83, 727–734. [Google Scholar] [CrossRef] [PubMed]
- Kashefi-Kheyrabadi, L.; Mehrgardi, M.A. Aptamer-conjugated silver nanoparticles for electrochemical detection of adenosine triphosphate. Biosens. Bioelectron. 2012, 37, 94–98. [Google Scholar] [CrossRef] [PubMed]
- Kim, Y.S.; Chung, J.; Song, M.Y.; Jurng, J.; Kim, B.C. Aptamer cocktails: Enhancement of sensing signals compared to single use of aptamers for detection of bacteria. Biosens. Bioelectron. 2014, 54, 195–198. [Google Scholar] [CrossRef] [PubMed]
- Kim, Y.S.; Song, M.Y.; Jurng, J.; Kim, B.C. Isolation and characterization of DNA aptamers against Escherichia coli using a bacterial cell-systematic evolution of ligands by exponential enrichment approach. Anal. Biochem. 2013, 436, 22–28. [Google Scholar] [CrossRef] [PubMed]
- Zhang, J.-J.; Gu, M.-M.; Zheng, T.-T.; Zhu, J.-J. Synthesis of gelatin-stabilized gold nanoparticles and assembly of carboxylic single-walled carbon nanotubes/Au composites for cytosensing and drug uptake. Anal. Chem. 2009, 81, 6641–6648. [Google Scholar] [CrossRef] [PubMed]
- Feng, J.; Ci, Y.-X.; Lou, J.-L.; Zhang, X.-Q. Voltammetric behavior of mammalian tumor cells and bioanalytical applications in cell metabolism. Bioelectrochem. Bioenerg. 1999, 48, 217–222. [Google Scholar] [CrossRef]
- Nonner, W.; Eisenberg, B. Electrodiffusion in ionic channels of biological membranes. J. Mol. Liq. 2000, 87, 149–162. [Google Scholar] [CrossRef]
- Schaadt, D.M.; Feng, B.; Yu, E.T. Enhanced semiconductor optical absorption via surface plasmon excitation in metal nanoparticles. Appl. Phys. Lett. 2005, 86, 063106. [Google Scholar] [CrossRef]
- Liu, M.; Guyot-Sionnest, P. Synthesis and optical characterization of Au/Ag core/shell nanorods. J. Phys. Chem. B 2004, 108, 5882–5888. [Google Scholar] [CrossRef]
- Shen, X.S.; Wang, G.Z.; Hong, X.; Zhu, W. Nanospheres of silver nanoparticles: Agglomeration, surface morphology control and application as sers substrates. Phys. Chem. Chem. Phys. 2009, 11, 7450–7454. [Google Scholar] [CrossRef] [PubMed]
- Li, J.; Lin, Y.; Zhao, B. Spontaneous agglomeration of silver nanoparticles deposited on carbon film surface. J. Nanopart. Res. 2002, 4, 345–349. [Google Scholar] [CrossRef]
- Danscher, G.; Hansen, H.J.; Møller-Madsen, B. Energy dispersive x-ray analysis of tissue gold after silver amplification by physical development. Histochemistry 1984, 81, 283–285. [Google Scholar] [CrossRef] [PubMed]
- Hu, G.-Z.; Zhang, D.-P.; Wu, W.-L.; Yang, Z.-S. Selective determination of dopamine in the presence of high concentration of ascorbic acid using nano-au self-assembly glassy carbon electrode. Colloids Surf. B 2008, 62, 199–205. [Google Scholar] [CrossRef] [PubMed]
- Love, J.C.; Estroff, L.A.; Kriebel, J.K.; Nuzzo, R.G.; Whitesides, G.M. Self-assembled monolayers of thiolates on metals as a form of nanotechnology. Chem. Rev. 2005, 105, 1103–1170. [Google Scholar] [CrossRef] [PubMed]
- Zhang, L.; Jiang, X.; Wang, E.; Dong, S. Attachment of gold nanoparticles to glassy carbon electrode and its application for the direct electrochemistry and electrocatalytic behavior of hemoglobin. Biosens. Bioelectron. 2005, 21, 337–345. [Google Scholar] [CrossRef] [PubMed]
- Choi, Y.-J.; Luo, T.-J.M. Electrochemical properties of silver nanoparticle doped aminosilica nanocomposite. Int. J. Electrochem. 2011, 2011. [Google Scholar] [CrossRef]
- Tang, M.H.; Hahn, C.; Klobuchar, A.J.; Ng, J.W.D.; Wellendorff, J.; Bligaard, T.; Jaramillo, T.F. Nickel-silver alloy electrocatalysts for hydrogen evolution and oxidation in an alkaline electrolyte. Phys. Chem. Chem. Phys. 2014, 16, 19250–19257. [Google Scholar] [CrossRef] [PubMed]
- Zhang, W.; Tu, C.Q.; Chen, Y.F.; Li, W.Y.; Houlachi, G. Cyclic voltammetric studies of the behavior of lead-silver anodes in zinc electrolytes. J. Mater. Eng. Perform. 2013, 22, 1672–1679. [Google Scholar] [CrossRef]
- Rouya, E.; Cattarin, S.; Reed, M.L.; Kelly, R.G.; Zangari, G. Electrochemical characterization of the surface area of nanoporous gold films. J. Electrochem. Soc. 2012, 159, K97–K102. [Google Scholar] [CrossRef]
- Tremiliosi-Filho, G.; Dall’Antonia, L.H.; Jerkiewicz, G. Growth of surface oxides on gold electrodes under well-defined potential, time and temperature conditions. J. Electroanal. Chem. 2005, 578, 1–8. [Google Scholar] [CrossRef]
- Gasparotto, L.H.S.; Gomes, J.F.; Tremiliosi-Filho, G. Cyclic-voltammetry characteristics of poly(vinyl pyrrolidone) (pvp) on single-crystal pt surfaces in aqueous h2so4. J. Electroanal. Chem. 2011, 663, 48–51. [Google Scholar] [CrossRef]
- Ebato, H.; Gentry, C.A.; Herron, J.N.; Mueller, W.; Okahata, Y.; Ringsdorf, H.; Suci, P.A. Investigation of specific binding of antifluorescyl antibody and fab to fluorescein lipids in langmuir-blodgett deposited films using quartz crystal microbalance methodology. Anal. Chem. 1994, 66, 1683–1689. [Google Scholar] [CrossRef] [PubMed]
- Okahata, Y.; Kawase, M.; Niikura, K.; Ohtake, F.; Furusawa, H.; Ebara, Y. Kinetic measurements of DNA hybridization on an oligonucleotide-immobilized 27-mhz quartz crystal microbalance. Anal. Chem. 1998, 70, 1288–1296. [Google Scholar] [CrossRef] [PubMed]
- Lavrich, D.J.; Wetterer, S.M.; Bernasek, S.L.; Scoles, G. Physisorption and chemisorption of alkanethiols and alkyl sulfides on Au(111). J. Phys. Chem. B 1998, 102, 3456–3465. [Google Scholar] [CrossRef]
- Fischer, D.; Curioni, A.; Andreoni, W. Decanethiols on gold: The structure of self-assembled monolayers unraveled with computer simulations. Langmuir 2003, 19, 3567–3571. [Google Scholar] [CrossRef]
- Mulvaney, P. Surface plasmon spectroscopy of nanosized metal particles. Langmuir 1996, 12, 788–800. [Google Scholar] [CrossRef]
- Link, S.; Wang, Z.L.; El-Sayed, M.A. Alloy formation of gold−silver nanoparticles and the dependence of the plasmon absorption on their composition. J. Phys. Chem. B 1999, 103, 3529–3533. [Google Scholar] [CrossRef]
- Queirós, R.B.; de-los-Santos-Álvarez, N.; Noronha, J.P.; Sales, M.G.F. A label-free DNA aptamer-based impedance biosensor for the detection of E. coli outer membrane proteins. Sens. Actuators B Chem. 2013, 181, 766–772. [Google Scholar] [CrossRef]
© 2016 by the authors; licensee MDPI, Basel, Switzerland. This article is an open access article distributed under the terms and conditions of the Creative Commons Attribution (CC-BY) license (http://creativecommons.org/licenses/by/4.0/).