Abstract
A chemical sensor (chemiresistor) was constructed from a xenon light bulb by coating it with a 3-D zinc oxide coated silica nanospring mat, where the xenon light bulb serves as the sensor heater. The sensor response to toluene as a function of xenon light bulb sensor temperature (TLB) and vapor temperature (TV) was observed and analyzed. The optimum operational parameters in terms of TLB and TV were determined to be 435 °C and 250 °C, respectively. The activation energy of toluene oxidation (Ed) on the ZnO surface was determined to be 87 kJ·mol−1, while the activation energy of oxidation (Ea) of the depleted ZnO surface was determined to be 83 kJ·mol−1. This study serves as proof of principle for integrating nanomaterials into an inexpensive sensor platform, which can also be used to characterize gas-solid, or vapor-solid, redox processes.
1. Introduction
It is of the utmost interest to develop conductometric gas sensors, which are electronic devices for converting chemical information about the analyte into an analytically useful electrical, or optical, signal. There are a number of reasons for this interest. On the one hand, they can be used for monitoring the concentrations of components in industrial processes, for environmental applications, for detection of hazardous materials (e.g., explosive vapors). On the other hand, these devices are necessary for acquiring a fundamental understanding of corresponding physical and chemical processes triggered by surface-molecule interactions (chemisorption), as well as for interpreting the electrical transport properties of gas sensitive materials. The use of metal oxide nanocrystalline thin films, as well as other more complex nano-morphologies, as the gas sensitive layers in chemiresistors is well documented [1,2,3,4,5,6,7,8,9,10,11]. These studies demonstrated that if the dimensions of the nanostructures are comparable to the characteristic length scales of surface interactions, the sensor will be more responsive to changes in surface stoichiometry. In chemiresistors the catalytic oxidation of analyte at the metal oxide surface depletes the surface of oxygen, which leads to a change in the surface depletion layer. If the depletion layer is comparable to the dimensions of the nanostructured metal oxide, small changes in the depth of the surface depletion layer can produce large swings in the resistivity of the chemiresistor [1,2,3,4,5,6,7,8,9,10,11].
In this paper we demonstrate a method for constructing an inexpensive chemiresistor using ZnO coated silica nanosprings. The chemiresistor consists of a conventional xenon light bulb, readily purchased at a hardware store, coated with nanosprings, which in turn, are coated with ZnO. The xenon bulb is the source of thermal energy needed to activate redox process and to oxidize analyte on the ZnO surface. The mat of ZnO coated silica nanosprings is an ultra-high surface area material ideally suited for detecting gas-surface and vapor-surface interactions. In addition to being a sensor, it can be used for qualitative and quantitative characterization of gas-solid and vapor-solid interactions, as well as redox processes.
2. Experimental Section
2.1. Material Synthesis
An insulating mat of silicon dioxide nanosprings (Figure 1a) was grown directly onto the quartz surface of a conventional xenon light bulb via a modified vapor-liquid-solid (VLS) mechanism. A detailed description of the silica nanospring growth process can be found in references by McIlroy et al. [12] and Wang et al. [13]. Briefly, the nanospring synthesis was conducted at atmospheric pressure in a simple tube furnace. A thin gold layer on the order of nanometers to tens of nanometers sputtered onto the surface of the light bulb served as the catalyst for the VLS process. The light bulb was then placed in the tube furnace held at ~350 °C under a constant flow of O2 and a proprietary silicon precursor [US patent application 11/993452, filed 2010]. The growth time of 30 min produces a 80 μm thick nanospring mat. The surface area enhancement of a planar surface with a 80 μm mat of silica nanosprings layers is 1200:1. This is based on a typical surface area of 400 m2/g, as determined by the Brunauer-Emmett-Teller (BET) gas adsorption method. BET measurements of ZnO of silica nanosprings showed a drop in the surface area of the nanospring to 200 cm2/g.
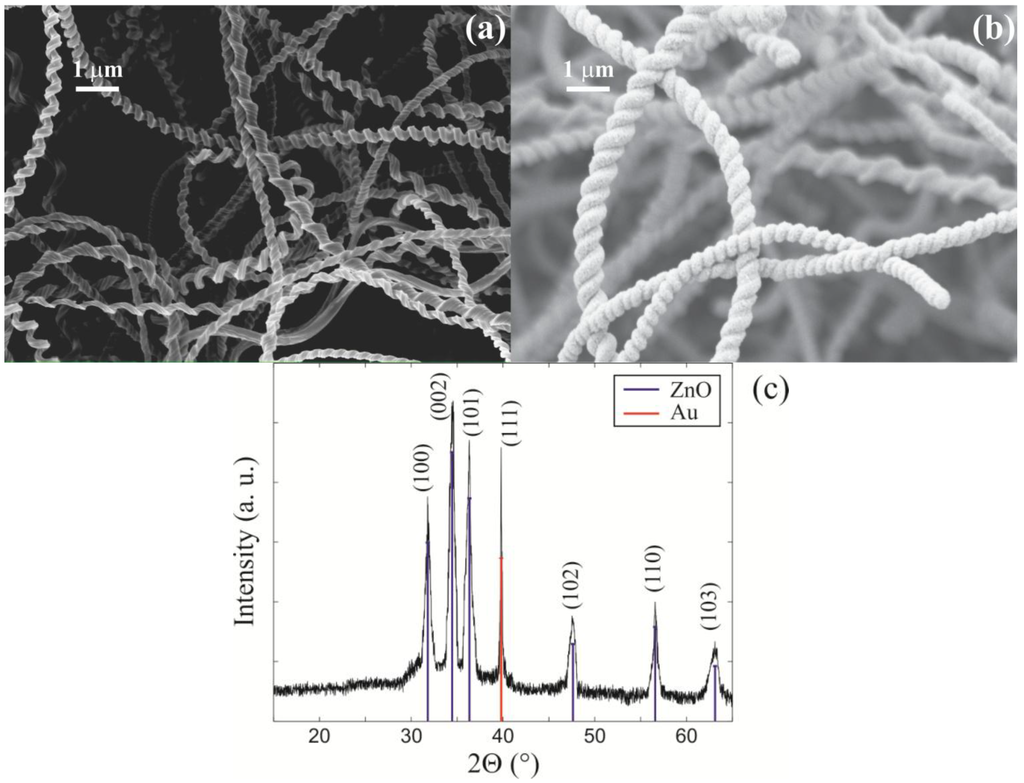
Figure 1.
SEM micrographs of (a) a silica nanospring mat; (b) of ZnO coated nanosprings; (c) An XRD spectrum of ZnO coated nanosprings.
The nanosprings were coated with ZnO by atomic layer deposition (ALD) [15,16,17,18]. A SEM micrograph of the ZnO covered nanosprings is shown in Figure 1b. ALD coating of silica nanosprings with ZnO proved to have a number of advantages over other deposition techniques (e.g., chemical vapor deposition) and over self-assembled ZnO nanowire mat [8,9], such as ability to precisely control coating thickness of the gas sensitive layer, the size of nanocrystals, and ability to uniformly coat complex three-dimensional structures (like nanospring mats). ALD of ZnO on the silicon dioxide nanosprings was performed in a tube furnace at 175 °C using deionized water (H2O) and diethylzinc (DEZn) as oxygen and zinc sources, respectively [16]. During the deposition the reaction chamber was maintained at approximately 1 Torr with a constant flow rate of 6 sccm of Ar. An ALD cycle consisted of 150 ms DEZn pulse, followed by pressurization to 2.5 Torr of Ar for 10 s, an 8 s Ar pump/purge, a 300 ms water pulse, followed by another 20 s Ar pump/purge. A typical 70 nm ZnO coating required 150 ALD cycles. A representative XRD pattern for ZnO coated nanosprings is displayed in Figure 1c. The primary ZnO peaks are marked delineated with blue lines, where peak delineated with a red line is the diffraction line of the (111) plane of Au. The finished ZnO coated nanospring xenon light bulb chemiresistor is displayed in Figure 2b.
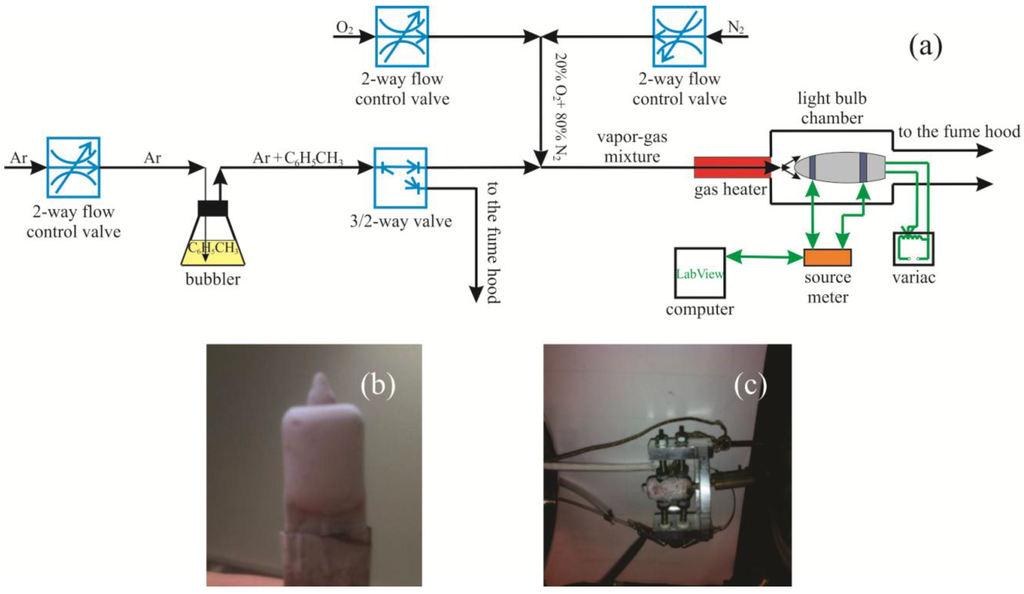
Figure 2.
(a) A schematic of the experimental setup used to acquire electrical response of the xenon light bulb chemiresistor; (b) the xenon light bulb sensor; and (c) the light bulb sensor mounted in the jig.
2.2. Electrical Characterization
A schematic of the gas sensor test station is presented in Figure 2a. A standard two-electrode test geometry was used to measure the electrical response of the xenon light bulb chemiresistor. The light bulb chemiresistor was mounted in a jig with spring loaded electrodes and a spring loaded thermocouple contacting the mat of ZnO coated silica nanosprings (see Figure 2a,c). The xenon light bulb was powered using a variac. The resistance of the chemiresistor was measured using a Kiethley 2400 source-sense meter interfaced to a computer via Labview-operated data acquisition software for real time acquisition. The xenon light bulb sensor was placed in a tubular chamber. A continuous gas stream of synthetic air (20% O2 and 80% N2) into the chamber was maintained at all times. Toluene vapor was produced by bubbling Ar through a flask filled with toluene. Sequential pulses of toluene vapor were introduced into the gas stream with a solenoid valve placed downstream of the bubbler. Temperature regulation of the vapor-gas mixture (toluene vapor and synthetic air) was achieved by passing it through a heated coil of a quarter inch diameter stainless steel tubing. The calculated partial vapor pressure of the analyte in the ambient atmosphere was 1,000 ppm.
3. Results
The electrical sensor response to toluene, as a function of xenon light bulb sensor surface temperature (TLB) and vapor-gas mixture temperature (TV), was observed and analyzed. The first set of experiments was aimed at determining the electrical response of a sensor to toluene vapor as a function of the xenon light bulb sensor surface temperature (TLB). The experiment was conducted without any heating of the vapor-gas mixture (TV = 22 °C). The procedure for experimental data acquisition was to allow the sensor to reach steady state resistance in the synthetic air at a given temperature TLB, at which time it was exposed to room temperature pulses of the vapor-gas mixture. Note, pulses of Ar sans toluene did not produce a significant sensor response. The results for TLB = 280 °C, 370 °C, and 435 °C are summarized in Figure 3a–c, respectively. The effect of temperature on the electronic properties of a thin ZnO layer deposited on the silica nanosprings is significantly different relatively to bulk ZnO. Heating bulk ZnO increases the number of carriers in the conduction band, which in its turn, leads to a drop in resistance. However, for a thin ZnO layer on silica nanosprings, where the length scale of surface interactions is comparable to the thickness of the layer, there are two competing processes. Namely, the generation of “free carriers” (decreasing resistance) and oxidation of the ZnO surface (increasing resistance). In the oxidation process, the adsorbed oxygen species can trap “free electrons” from the near-surface ZnO region (redox process) due to thermal activation [4,5]. Thermalizing of the electron carriers is needed to overcome the surface potential barrier and to reach the oxygen species on the ZnO surface. As a result of this process, a negative surface charge is formed, which depletes the n-type ZnO semiconductor layer.
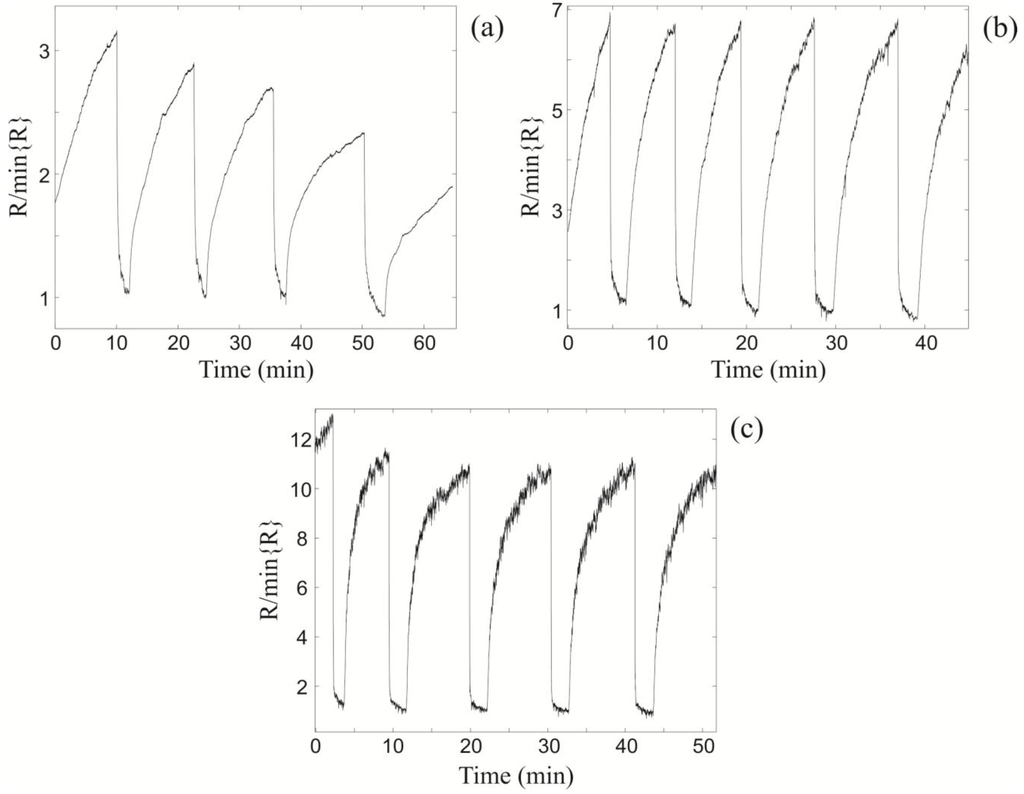
Figure 3.
The relative changes in resistance of the light bulb ZnO nanospring sensor at (a) TLB = 280 °C; (b) TLB = 370 °C; and (c) TLB = 435 °C upon exposure to sequential 1000 ppm toluene pulses at fixed vapor-gas temperature TV = 22 °C.
Upon exposure to toluene vapor, the resistance changes by a factor of 3 at TLB = 280 °C (Figure 3a), 7 at TLB = 370 °C (Figure 3b), and 11 at TLB = 435 °C (Figure 3c). Note, the xenon light bulb chemiresistor is not self-refreshing in the synthetic air at TLB = 280 °C (Figure 3a), as apparent from systematic decrease in its baseline with sequential exposures. However, at higher temperatures it is self-refreshing. The optimal (maximum) sensor response to room temperature pulses of toluene is at TLB = 435 °C (Figure 3c). For TLB > 435 °C the sensor response begins to decrease (not shown), which is attributed to surface phonon enhanced desorption of oxygen from the ZnO surface.
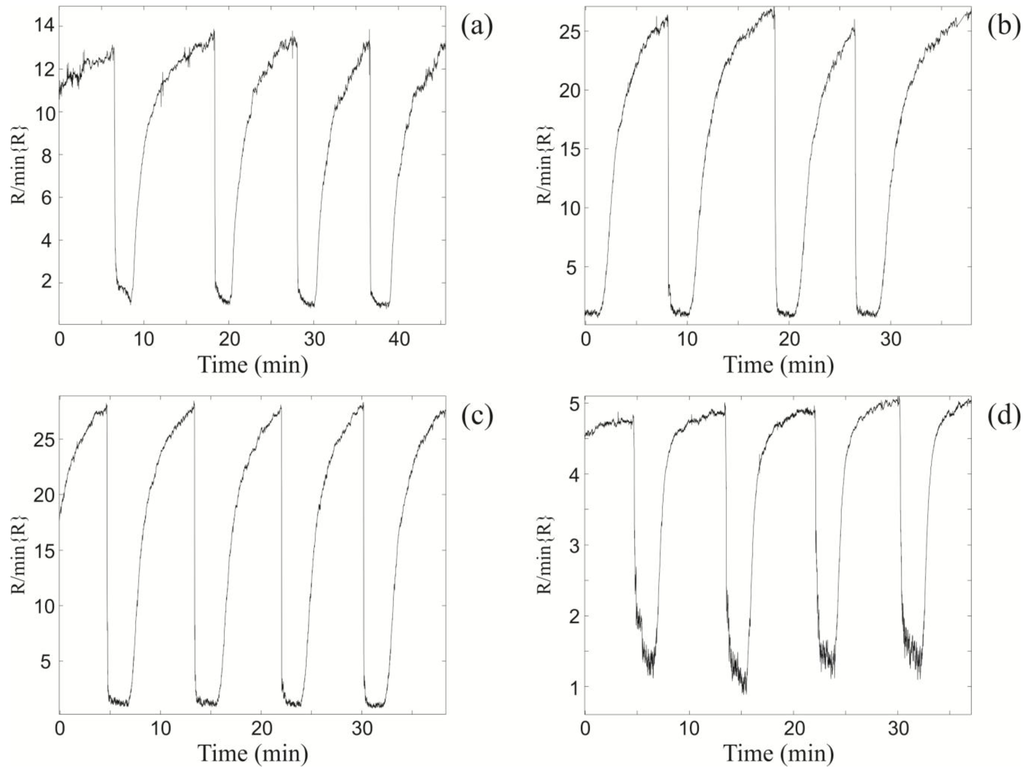
Figure 4.
The relative changes in resistance of the xenon light bulb ZnO nanospring sensor upon exposure to 1,000 ppm consequent toluene pulses at different vapor gas mixture temperatures TV and the optimal light bulb temperature TLB = 435 °C. (a) TV = 100 °C; (b) TV = 200 °C; (c) TV = 250 °C; and (d) TV = 300 °C.
The second set of experiments was aimed at determining the chemiresistor response at TLB = 435 °C to toluene vapor as a function of the vapor-gas mixture temperature (TV) (Figure 4). The sensor resistance characteristics were obtained at vapor-gas mixture temperatures of 100 °C, 200 °C, 250 °C, and 300 °C, which correspond to Figure 4a–d, respectively. From examination of Figure 4, it is apparent that the electrical response increases with increasing TV until the maximum at TV = 250 °C, at which point the response begins to decrease at subsequently higher temperatures. The maximum relative change in the sensor resistance at TV = 250 °C and at TLB = 435 °C is a factor of 27 (Figure 4c). The drop in sensor response at TV = 300 °C (Figure 4d) is due to the atmospheric oxidation of the toluene vapor prior to reaching the light bulb surface. As a consequence, the concentration of unoxidized toluene reaching the ZnO surface is significantly reduced relative to lower gas-vapor temperatures.
4. Discussion
The effects of chemisorption on the electrical transport properties of metal oxides is well documented [1,2,3,4,5,6,7,8,9,10,11,19,20,21,22]. In the case of ZnO1-δ, where the surface is oxygen deficient, the surface readily oxidized in ambient air to obtain the ideal surface stoichiometry of ZnO. The oxidation process involves either chemisorption (O2 + e− = O2−) or dissociative chemisorption (O2 + 2e− = 2O−), where these act as traps of conduction electrons in the near-surface region of the ZnO layer. It has been reported in the literature [5,7] that below 150 °C the molecular adsorption of oxygen dominates, while above 150 °C dissociative chemisorption of oxygen prevails. On the other hand, at relatively high temperatures (T > 435 °C) the excitation of surface phonons leads to enhancement of oxygen desorption from the ZnO surface. The net effect is a decrease of sensor response (sensitivity) when the oxygen desorption rate exceeds the oxygen chemisorption rate.
The result of oxygen chemisorption process is the formation of a surface charge (QS) depleting the n-type ZnO semiconductor. The width of the depletion layer L, the Debye screening length LD, and the height of the surface potential barrier ∆V are related by the following equation [11,21]:
 where e is the electron charge, k is the Boltzmann constant, and T is the absolute temperature. The Debye screening length is given by the relationship,
 where ɛ is the dielectric constant of the material and N is the carrier density. The surface barrier height ∆V is determined by the surface charge QS


A schematic representation of the effects of surface charge depletion on the sensor response is illustrated in Figure 5. The response to toluene is attributed to the toluene oxidation at the ZnO surface and the corresponding reduction of the negative surface charge. This, in turn, decreases the depletion width producing a drop in the sensor resistance. Self-refreshing re-oxidation of the ZnO surface (redox process) returns the chemiresistor characteristics to their baselines.
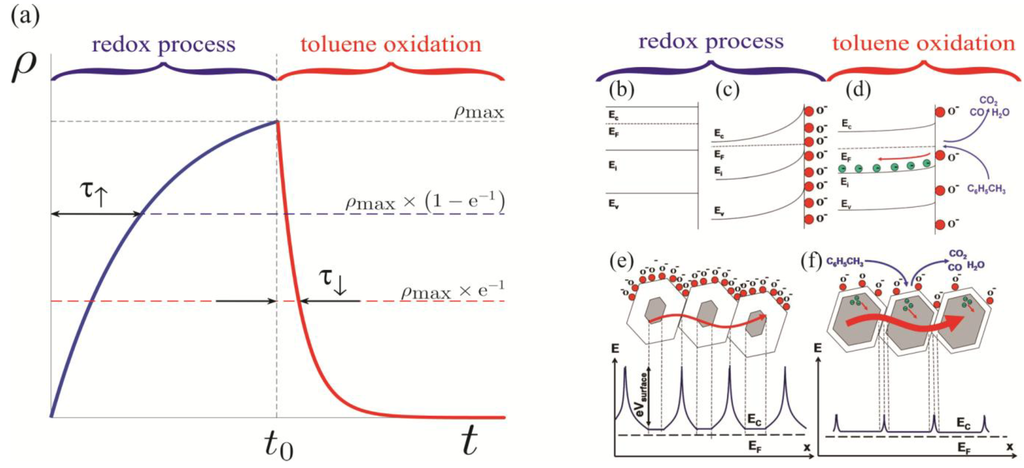
Figure 5.
(a) Exponential “RC-circuit” approximation of the sensor response. Energy level schematics (b) of the bulk ZnO; (c) at the depleted surface of ZnO; and (d) upon toluene oxidation on the ZnO surface (arbitrary intrinsic Ei levels correspond to defect states in n-type ZnO). Schematic energy-level diagrams of the polycrystalline ZnO layer (e) prior to toluene exposure and (f) after exposure and subsequent toluene oxidation [1,2,3].
In the case of heating the vapor-gas mixture with a fixed sensor surface temperature TLB = 435 °C, two processes take place on the surface. The first is simply the filling of unoccupied oxygen sites, while the second is increase of dissociative chemisorption of oxygen that results in ionic oxygen (O−) species on the ZnO surface. On the one hand, the heating of the synthetic air enables oxygen to activate additional surface sites, thus, increasing the concentration of adsorbed oxygen species. In addition, the gas heating enhances the rate of dissociative chemisorption of oxygen, thus, increasing the concentration of ionic oxygen (O−) species on the ZnO surface. These changes in the concentration and chemical forms of surface oxygen lead to the increment of the baseline resistance (Figure 6a) and an enhancement of the sensor sensitivity. On the other hand, the gas heating intensifies the toluene oxidation process in the ambient air prior to reaching the surface. This, in turn, decreases the toluene oxidation rate at the ZnO surface, thereby reducing the sensitivity. The cumulative effect of the three processes on the chemiresistor response is illustrated by Figure 6b. Namely, the graph demonstrates that the sensor response grows until the temperature of flowing gases reaches 200 °C. Between 200 °C–250 °C the aforementioned effects counterbalance one another such that the sensor response plateaus. Above 250 °C, the pre-oxidation of toluene in the synthetic air prevails, leading to a decline in sensitivity of the sensor. More simply stated, the activation of additional oxygen sites at the ZnO surface enhances the oxidation rate of the analyte, but this is countered by gas phase oxidation of analyte, thereby reducing the number of unoxidized species impinging on the ZnO surface.
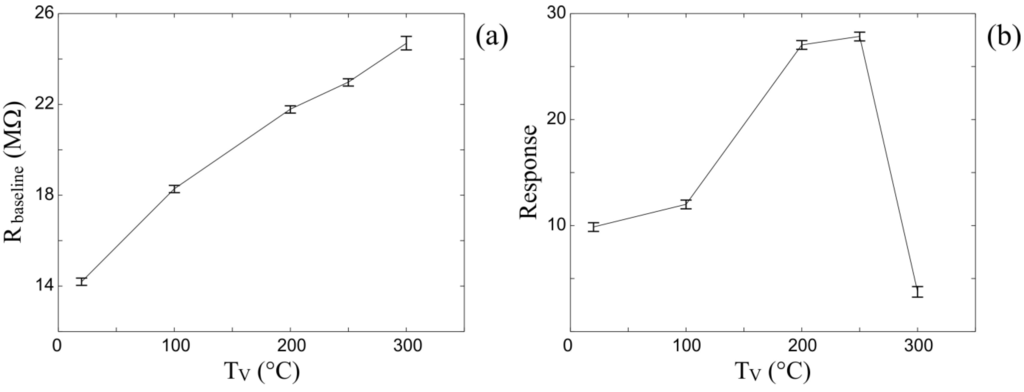
Figure 6.
(a) The average baseline resistance of the xenon light bulb ZnO nanospring sensor (TLB = 435 °C) at different vapor gas mixture temperatures TV; (b) The average change in the chemiresistor response to 1,000 ppm toluene vapor at different vapor gas mixture temperatures TV (TLB = 435 °C).
The self-refreshing re-oxidation (redox process) of the ZnO surface and toluene surface oxidation processes can be described with relatively high precision by the exponential functions ρ↑ and ρ↓, respectively.
ρ↑ = ρο (1 − exp(− t / T ↑)), t ˂ tο; ρ ǀ = ρο(1 − exp(− tο / T ↑))exp ((tο− t)/T ǀ), t ˃ tο

The rate of the oxygen adsorption on the ZnO surface, Ra, can be expressed in the same way as any kinetic process, i.e., as a product of the incident flux F of O2 molecules and the sticking coefficient, or sticking probability, s:
Ra = F ∙ s
The molecular flux, F, is given by the Hertz-Knudsen equation,
 where P is the gas pressure, m is the mass of one oxygen molecule, TGS is the gas temperature near the surface, which is usually taken as equal to the surface temperature (TLB). The sticking coefficient s is usually expressed in an Arrhenius form [19]
where A is the pre-exponential factor, Ea is the activation energy of oxygen adsorption on the ZnO surface, and R is the universal gas constant. Hence, the oxygen adsorption rate Ra can be written as


s = A exp(− Ea/RTLB),

The catalytic surface oxidation of toluene causes the corresponding desorption (depletion) of oxygen from the ZnO surface. The desorption rate Rd of an adsorbate from the surface can be described in an Arrhenius form [20],
where D is the pre-exponential factor and Ed is the activation energy of oxygen desorption due to the catalytic oxidation of toluene vapor on the ZnO surface.
Rd = D exp (− Ed/RTLB)
From relation (5) and Equations (9) and (10) the activation energies Ea and Ed can be expressed in terms of the characteristic time constants and temperature TLB of the xenon light bulb chemiresistor as follows:


In Equations (11) the superscripts (1) and (2) refer to the different sensor temperatures TLB. The average values of the activation energies Ea and Ed, based on the above analysis, have been determined to be 83 kJ/mol and 87 kJ/mol, respectively.
The graphically determined values of characteristic recovery (τ↑) and response (τ↓) time constants as functions of temperatures TLB and TV from Figure 3 and Figure 4 are summarized in Table 1. The decrease of both the time constants with increasing xenon light bulb temperature (TLB) at a fixed vapor temperature of TV = 22 °C is in good agreement with Arrhenius relationships in Equations (9) and (10) for the oxygen adsorption and desorption rates, respectively. The characteristic response time τ↑ remains constant for 22 °C < TV < 250 °C, while the increase of the characteristic recovery time τ↓ with increasing TV from 22 °C to 250 °C (at the fixed sensor temperature TLB = 435 °C) also correlates with Equation (9), under the assumption that the gas temperature TGS (see Equation (9)) near the ZnO surface rises with the increment of TV. Heating the vapor-gas mixture reduces the interaction time between oxygen molecules and the ZnO surface and, hence, decreases the oxygen adsorption rate at the ZnO surface. The significant rise of both the time constants τ↑ and τ↓ at TLB = 435 °C and TV = 300 °C is attributed to the increase in the gas phase oxidation rate of toluene prior to reaching the ZnO surface.

Table 1.
Characteristic recovery (τ↑) and response (τ↓) time constants at different xenon light bulb temperatures (TLB) and vapor gas mixture temperatures (TV).
| TLB=280 °C | TLB=370 °C | TLB=435 °C | TLB=435 °C | TLB=435 °C | TLB=435 °C | TLB=435 °C | |
|---|---|---|---|---|---|---|---|
| TV=22 °C | TV=22 °C | TV=22 °C | TV=100 °C | TV=200 °C | TV=250 °C | TV=300 °C | |
| τ↑ (s) | 540 | 42.2 | 11.3 | 12 | 16 | 18 | 73 |
| τ↓ (s) | 80 | 3 | 1.2 | 1.2 | 1.2 | 1.2 | 10 |
5. Conclusions
A new approach to fabricating an ultra-high surface area gas sensor (chemiresistor) has been demonstrated. The chemiresistor was constructed directly onto the surface of a conventional xenon light bulb (used as a sensor heater) by coating it with a 3-D ZnO coated silica nanospring mat. The sensor response to the analyte (toluene vapor) is attributed to its oxidation on the ZnO surface, thereby creating an oxygen deficient surface of ZnO, and self-refreshing to chemisorption of atmospheric oxygen (redox process). The activation energy of ZnO surface oxidation and the activation energy of toluene oxidation on the ZnO surface were determined to be 83 kJ·mol−1 and 87 kJ·mol−1, respectively. It was shown that the relative chemiresistor response is not only highly dependent on the temperature of the ZnO surface, but also on the temperature of the vapor-gas mixture. This can be explained by the fact that both the temperatures influence the density and chemical forms (molecular or ionic) of oxygen species on the ZnO surface and the gas phase toluene oxidation rate in the ambient atmosphere. The maximum sensitivity was achieved at the xenon light bulb temperature of 435 °C and at the vapor-gas mixture temperature of 250 °C, but at the expense of the sensor recovery time τ↑, which is optimal at a vapor-gas temperature of room temperature (22 °C).
Acknowledgments
Authors would like to thank the Office of Naval Research (grant # N00014-10-1-0282) for supporting this work. David McIlroy would like to acknowledge the USDA and the Dyess Faculty Fellowship for its support.
Conflict of Interest
The authors declare no conflict of interest.
References and Notes
- Dobrokhotov, V.; Oakes, L.; Sowell, D.; Larin, A.; Hall, J.; Barzilov, A.; Kengne, A.; Bakharev, P.; Corti, G.; Cantrell, T.; et al. Thermal and optical activation mechanisms of nanospring-based chemiresistors. Sensors 2012, 12, 5608–5622. [Google Scholar] [CrossRef]
- Dobrokhotov, V.; Oakes, L.; Sowell, D.; Larin, A.; Hall, J.; Kengne, A.; Bakharev, P.; Corti, G.; Cantrell, T.; Prakash, T.; et al. Toward the nanospring-based artificial olfactory system for trace-detection of flammable and explosive vapors. Sens. Actuators B: Chem. 2012, 168, 138–148. [Google Scholar] [CrossRef]
- Dobrokhotov, V.; Oakes, L.; Sowell, D.; Larin, A.; Hall, J.; Kengne, A.; Bakharev, P.; Corti, G.; Cantrell, T.; Prakash, T.; et al. ZnO coated nanospring-based chemiresistor. J. Appl. Phys. 2012, 111, 044311:1–044311:8. [Google Scholar]
- Bochenkov, V.; Sergeev, G. Sensitivity, Selectivity, and Stability of Gas-sensitive Metal-oxide Nanostructures. In Metal Oxide Nanostructures and Their Applications, 2nd ed.; Umar, H., Ed.; American Scientific Publishers: Stevnson Ranch, CA, USA, 2010; Volume 3, pp. 31–52. [Google Scholar]
- Barsan, N.; Weimar, U. Conduction model of metal oxide gas sensors. J. Electroceramics 2001, 7, 143–167. [Google Scholar] [CrossRef]
- Barsan, N.; Weimar, U. Understanding the fundamental principles of metal oxide based gas sensors: The example of CO sensing with SnO2 sensors in the presence of humidity. J. Phys. Condens. Matter 2003, 15, R813–R839. [Google Scholar] [CrossRef]
- Gurlo, A.; Bârsan, N.; Oprea, A.; Sahm, M.; Sahm, T.; Weimar, U. An n- to p-type conductivity transition induced by oxygen adsorption on a-Fe2O3. Appl. Phys. Lett. 2004, 85. [Google Scholar] [CrossRef]
- Ra, H.W.; Khan, R.; Kim, J.T.; Kang, B.R.; Im, Y.H. The effect of grain boundaries inside the individual ZnO nanowires in gas sensing. Nanotechnology 2010, 21. [Google Scholar] [CrossRef]
- Li, Q.H.; Gao, T.; Wang, Y.G.; Wang, T.H. Adsorption and desorption of oxygen probed from ZnO nanowire films by photocurrent measurements. Appl. Phys. Lett. 2005, 86, 123117:1–123117:3. [Google Scholar]
- Gas’kov, A.M.; Rumyantseva, M.N. Nature of gas sensitivity in nanocrystalline metal oxides. J. Appl. Chem. 2001, 74, 440–444. [Google Scholar]
- Gas’kov, A.M.; Rumyantseva, M.N. Materials for solid-state gas sensors. Inorg. Mater. 2000, 36, 293–301. [Google Scholar] [CrossRef]
- McIlroy, D.N.; Alkhateeb, A.; Zhang, D.; Aston, D.E.; Marcy, A.C.; Norton, M.G. Nanospring formation—Unexpected catalyst mediated growth. J. Phys. Condens. Matter 2004, 16, R415–R440. [Google Scholar] [CrossRef]
- Wang, L.; Major, D.; Paga, P.; Zhang, D.; Norton, M.G.; McIlroy, D.N. High yield synthesis and lithography of silica-based nanospring mats. Nanotechnology 2006, 17, S298–S303. [Google Scholar] [CrossRef]
- McIlroy, D.N.; Corti, G.; Cantrell, T.; Prakash, T. Method for Manufacture and Coating of Nonostructured Components. U.S. patent No. 11/993,452, 20 December 2009. [Google Scholar]
- George, S.M.; Ott, A.W.; Klaus, J.W. Surface chemistry for atomic layer growth. J. Phys. Chem. 1996, 100, 13121–13131. [Google Scholar] [CrossRef]
- Elam, J.W.; George, S.M. Growth of ZnO/Al2O3 alloy films using atomic layer deposition techniques. Chem. Mater. 2003, 15, 1020–1028. [Google Scholar] [CrossRef]
- Przeździecka, E. Characterization of ZnO films grown at low temperature. Acta Phys. Pol. A 2008, 114, 1303–1310. [Google Scholar]
- Guziewicz, E. ZnO by ALD-advantages of the material grown at low temperature. Acta Phys. Pol. A 2009, 116, 814–817. [Google Scholar]
- Lagowski, J.; Sproles, E.; Gatos, H. Quantitative study of the charge transfer in chemisorptions: Oxygen chemisorption on ZnO. J. Appl. Phys. 1977, 48. [Google Scholar] [CrossRef]
- Watanabe, H.; Wada, M.; Takahashi, T. The activation energy for oxygen desoprtion from zinc oxide surfaces. Jpn. J. Appl. Phys. 1965, 4, 945–947. [Google Scholar] [CrossRef]
- Moseley, P.; Crocker, A. Sensor Materials; Institute of Physics Publisher: Bristol, UK; Philadelphia, PA, USA, 1996; pp. 72–73. [Google Scholar]
- Redondo, A.; Zeri, Y. Rates of desorption from solid surfaces: Coverage dependence. Surf. Sci. 1984, 136, 41–58. [Google Scholar] [CrossRef]
- Dobrokhotov, V.V.; McIlroy, D.N.; Norton, G.M.; Abdelrahaman, R.; Safir, A.; Berven, C.A. Interaction of hybrid nanowire-nanoparticle structures with carbon monoxide. Nanotechnology 2009, 20. [Google Scholar] [CrossRef]
- Berven, C.A.; Dobrokhotov, V.V. Towards practicable sensors using one-dimensional nanostructures. Int. J. Nanotechnol. 2007, 5, 402–449. [Google Scholar] [CrossRef]
- Dobrokhotov, V.V.; McIlroy, D.N.; Norton, M.G.; Berven, C.A. Transport properties of hybrid nanoparticle-nanowire systems and their application to gas sensing. Nanotechnology 2006, 17, 4135–4142. [Google Scholar] [CrossRef]
© 2014 by the authors; licensee MDPI, Basel, Switzerland. This article is an open access article distributed under the terms and conditions of the Creative Commons Attribution license (http://creativecommons.org/licenses/by/3.0/).