Article

One-Step Controlled Electrodeposition Fabrication of Ternary PtNiCo Nanosheets for Electrocatalytic Ammonia–Nitrogen Sensing

1
College of Chemistry and Materials Engineering, Bohai University, Jinzhou 121013, China
2
State Key Laboratory of Integrated Optoelectronics, College of Electronic Science and Engineering, Jilin University, Changchun 130012, China
*
Authors to whom correspondence should be addressed.
Chemosensors 2025, 13(9), 335; https://doi.org/10.3390/chemosensors13090335
Submission received: 30 July 2025 / Revised: 30 August 2025 / Accepted: 1 September 2025 / Published: 4 September 2025
(This article belongs to the Section Nanostructures for Chemical Sensing)

Abstract

The development of high-performance electrochemical sensors is crucial for ammonia–nitrogen detection. Therefore, in this study, we successfully prepared one ternary PtNiCo nanosheet via the one-step electrodeposition technique. The ratio of H2PtCl6·6H2O, Ni(NO3)2·6H2O and Co(NO3)2·6H2O and electrodeposition time were controlled. Under optimal conditions, Pt6Ni2Co2-2000 demonstrated outstanding electrocatalytic performance, exhibiting a high oxidation peak current of 45.27 mA and excellent long-term stability, retaining 88.09% of its activity after 12 h. Furthermore, the sensing performance of Pt6Ni2Co2-2000 was evaluated, revealing high sensitivity (10.01 μA μM−1), a low detection limit (0.688 µM), strong anti-interference capability, great reusability, great reproducibility, and remarkable long-term stability. Additionally, recovery tests conducted in tap water, lake water, and seawater yielded highly favorable results. This study demonstrated that designing Pt-based alloys can not only enhance the electrochemical performance of Pt but also serve as an effective strategy for improving electrocatalytic ammonia oxidation and ammonia–nitrogen detection.

1. Introduction

Ammonia–nitrogen acts as one of the concerning pollutants within aquatic ecosystems [1]. It is primarily composed of two forms, namely an ammonium ion (NH4+) and molecular ammonia (NH3) [2]. In addition, ammonium ions exist in dynamic equilibrium with molecular ammonia, and their ratio is influenced by pH values and temperature [3]. When the concentration of NH4+ reaches elevated levels, it can lead to the rapid and excessive growth of algae. This water eutrophication can initiate a series of detrimental ecological changes [4]. Molecular ammonia (NH3) poses a direct threat to aquatic life [5]. Unlike the ammonium ion, NH3 is highly toxic to a wide range of aquatic organisms. At relatively low concentrations, it can penetrate the cell membranes of fish, invertebrates, and other aquatic species, interfering with their physiological processes. It can damage the gills of fish, impairing their ability to extract oxygen from the water, and disrupt the normal functioning of their nervous systems, leading to behavioral abnormalities and reduced growth rates [6]. Therefore, timely and precise detection can help restore and protect the quality of water bodies, safeguarding both the aquatic environment and public health.
Pt has shown significant electrocatalytic activity in ammonia oxidation reactions [7]. In order to further enhance its electrocatalytic performances, many Pt-based nanomaterials have been reported, including Pt-conductive polymers [8,9,10], Pt–metal oxides [11,12], and Pt-based alloys [13,14,15]. Among them, Pt-based alloys can not only reduce the ratio of Pt but can also control the electron structure of Pt, further regulating active centers and adsorption energy [14]. Pt-based alloys including PtNi [16], PtAu [17], and PtZn [18] have been reported, and these Pt-based alloys exhibit excellent electrochemical catalytic performance in ammonia oxidation reactions. However, there are less studies about ternary Pt-based alloys for ammonia oxidation reactions and ammonia–nitrogen sensing. In addition, the sample synthesis methods of Pt-based ternary alloys should also be developed, such as electrochemical deposition [19,20] and replacement reactions [21].
Herein, one PtNiCo alloy nanosheet has been designed and fabricated via the one-step electrodeposition technique on the surface of a carbon cloth and has been used as an electrocatalyst for electrocatalytic ammonia oxidation reactions and the electrochemical detection of ammonia–nitrogen. To obtain the best sample, the ratio of H2PtCl6·6H2O, Ni(NO3)2·6H2O and Co(NO3)2·6H2O and the deposition time have been controlled. To prove the formation of a PtNiCo alloy, SEM, TEM/HRTEM, XRD, and XPS have been used to understand the morphology, structure, and composition of the result. The electrocatalytic and detection performance have been measured via the cyclic voltammetry (CV) and differential pulse voltammetry (DPV) techniques.

2. Synthesis and Measurements

2.1. The Synthesis of PtxNiyCoz Ternary Alloys

A carbon cloth with a size of 1.0 cm × 2.0 cm was soaked and washed via HCl (6 M) and deionized water before use. The three-electrode system was used and the carbon cloth was the working electrode, a Pt sheet was the counter electrode, and the saturated calomel electrode (SCE) was the reference electrode. A mixed solution (30 mL) containing 0.5 M HCl, x mmol H2PtCl6·6H2O, y mmol Ni(NO3)2·6H2O, and z mmol Co(NO3)2·6H2O (x + y + z = 2 mmol) was used as the electrolyte. The deposition voltage was −1.2 V and deposition time was 1000 s. The ternary alloys (z:x:y = 8:1:1, 6:2:2, 4:3:3 2:4:4, y:x:z = 8:1:1, 6:2:2, 4:3:3, 2:4:4, x:y:z = 8:1:1, 6:2:2, 4:3:3, 2:4:4) were named Co8Pt1Ni1-1000, Co6Pt2Ni2-1000, Co4Pt3Ni3-1000, Co2Pt4Ni4-1000, Ni8Pt1Co1-1000, Ni6Pt2Co2-1000, Ni4Pt3Co3-1000, Ni2Pt4Co4-1000, Pt8Ni1Co1-1000, Pt6Ni2Co2-1000, Pt4Ni3Co3-1000, and Pt2Ni4Co4-1000. The above ratios are provided in Table S1.
In addition, when the ratio of H2PtCl6·6H2O/Ni(NO3)2·6H2O/Co(NO3)2·6H2O was 6:2:2, the deposition potential was −1.2 V, and the deposition times were 500 s, 1500 s, 2000 s, 2500 s, and 3000 s, the obtained samples were named Pt6Ni2Co2-500, Pt6Ni2Co2-1500, Pt6Ni2Co2-2000, Pt6Ni2Co2-2500, and Pt6Ni2Co2-3000.
Finally, when the ratios of H2PtCl6·6H2O/Ni(NO3)2·6H2O/Co(NO3)2·6H2O were 0:0:1, 0:1:0, 1:0:0, 6:2:0, 6:0:2, and 0:2:2 and the deposition potential was −1.2V for 2000 s, the samples were named Pt0Ni0Co1-2000, Pt0Ni1Co0-2000, Pt1Ni0Co0-2000, Pt6Ni2Co0-2000, Pt6Ni0Co2-2000, and Pt0Ni2Co2-2000.

2.2. Electrochemical Measurements

All electrochemical measurements were conducted based on the three-electrode system. Specifically, PtxNiyCoz, the platinum sheet (1 × 1 cm), and the Hg/HgO electrode acted as the working electrode, counter electrode, and reference electrode. NH4Cl and 1 M KOH were used as the ammonia source and electrolyte. Cyclic voltammetry (CV) measurements were measured at the potential from −1 V to 0.4 V with a scan rate of 0.05 V/s. Differential pulse voltammetry (DPV) measurements were measured from −0.8 V to 0.2 V.

3. Results and Discussion

3.1. The Morphology and Structure of Pt6Ni2Co2-2000

The surface morphology of Pt6Ni2Co2-2000 has been detected via SEM and TEM. Figure 1a shows the SEM image of Pt6Ni2Co2-2000. The Pt6Ni2Co2-2000 nanosheets could be found, and these Pt6Ni2Co2-2000 nanosheets covered the carbon cloth surface. Figure S1a shows the SEM images of Co6Pt2Ni2-2000 and Ni6Pt2Co2-2000. Co6Pt2Ni2-2000 showed sphere-like morphology and Ni6Pt2Co2-2000 had no obvious morphology, indicating that the morphology of Pt6Ni2Co2-2000 was controlled by the ratio of Pt.
The mapping images of the Pt element, Co element, and Ni element in Figure 1b–d show the elements fully dispersed on the surface of the carbon cloth. Compared to Ni and Co elements, the density of the Pt element was higher, indicating that the ratio of H2PtCl6·6H2O, Ni(NO3)2·6H2O, and Co(NO3)2·6H2O was important for the ratio of Pt, Ni, and Co elements in the PtNiCo alloy.
Furthermore, the TEM image of Pt6Ni2Co2-2000 is given in Figure 1e. Its sheet-like morphology can also be found similar to the SEM image of Pt6Ni2Co2-2000. The HRTEM image of Pt6Ni2Co2-2000 is shown in Figure 1f. The lattice fringe (111) of Pt6Ni2Co2-2000 was obvious, and the distance of the lattice fringe was calculated as 0.217 nm. In contrast, the distance of the lattice fringe of pure Pt was 0.226 nm [22]. The Ni (111) was 0.203 nm [23] and the Co (111) was 0.204 nm [24]. The above results indicated that the lattice fringe distance (111) of Pt6Ni2Co2-2000 was higher than that of Ni (111) and Co (111) but lower than that of Pt (111), proving the formation of the PtNiCo alloy.
The XRD and XPS measurements have also been used to prove the formation of the PtNiCo alloy. Three strong peaks could be found based on the XRD pattern of Pt6Ni2Co2-2000 and Pt1Ni0Co0-2000, and the peaks at 39.76°, 46.24°, and 67.45° could be attributed to Pt with the crystal planes of (111), (200), and (220) in the XRD pattern (JCPDS no. 04-0802) [25]. Compared to the XRD pattern of Pt1Ni0Co0-2000, the peak position showed a slight shift based on the XRD pattern of Pt6Ni2Co2-2000, as shown in Figure 1g. Figure 1h shows the XPS pattern of the Pt element in Pt6Ni2Co2-2000 and Pt1Ni0Co0-2000. An obvious shift in binding energy could be detected compared to Pt1Ni0Co0-2000, indicating that the electron structure of Pt in Pt6Ni2Co2-2000 has been controlled, owing to the Ni and Co element. The above results further prove the formation of the PtNiCo alloy. The XPS pattern of Ni and Co elements in Pt6Ni2Co2-2000 is given in Figure S2a,b. However, no clear signals of Ni and Co elements could be detected. The low ratio of Ni and Co elements in Pt6Ni2Co2-2000 may be the main factor attributed to the above results. This viewpoint could be verified by the results of ICP analysis, and the molar ratio of Pt, Ni, and Co elements was 122:3:1.

3.2. Electrochemical Catalytic Ammonia Oxidation Reaction of PtxNiyCoz

In order to obtain significant electrocatalytic activity, the synthesis process of PtxNiyCoz electrodes include the molar ratios of H2PtCl6·6H2O, Ni(NO3)2·6H2O, and Co(NO3)2·6H2O, deposition times have been controlled, and the electrocatalytic performance of different PtxNiyCoz electrodes have been measured.

3.2.1. The Effect of the Molar Ratio (H2PtCl6·6H2O, Ni(NO3)2·6H2O and Co(NO3)2·6H2O) for Electrocatalytic Ammonia Oxidation Reactions

A systematic investigation was conducted to optimize the composition of PtxNiyCoz. The ratios of H2PtCl6·6H2O, Ni(NO3)2·6H2O and Co(NO3)2·6H2O during the synthesis process have been controlled when the deposition time was 1000 s. The electrocatalytic activities of the above PtxNiyCoz catalysts for ammonia oxidation reactions were measured in 1 M KOH and 1 M KOH in the presence of 0.1 M NH4Cl. Figure 2a–c and Figures S3–S5 show the CV curves of all PtxNiyCoz catalysts in 1 M KOH with and without 0.1 M NH4Cl. As shown in Figure 3a, the oxidation peak currents increased with the decreasing Co(NO3)2·6H2O ratio and increasing H2PtCl6·6H2O/Ni(NO3)2·6H2O ratios. Similarly, Figure 2b demonstrates that the reduction of Ni(NO3)2·6H2O and increasing H2PtCl6·6H2O and Co(NO3)2·6H2O led to a gradual enhancement in oxidation peak currents. However, the oxidation peak currents displayed divergent trends with decreasing H2PtCl6·6H2O and the increasing ratios of Ni(NO3)2·6H2O/Co(NO3)2·6H2O. Electrocatalytic measurements revealed that the Pt6Ni2Co2-1000 catalyst, synthesized at a precursor ratio of 6:2:2 (H2PtCl6·6H2O:Ni(NO3)2·6H2O:Co(NO3)2·6H2O), exhibited the highest peak current with a value of 28.46 mA, confirming this composition as the optimal formulation.

3.2.2. The Effect of Electrodeposition Time on Electrocatalytic Ammonia Oxidation Reactions

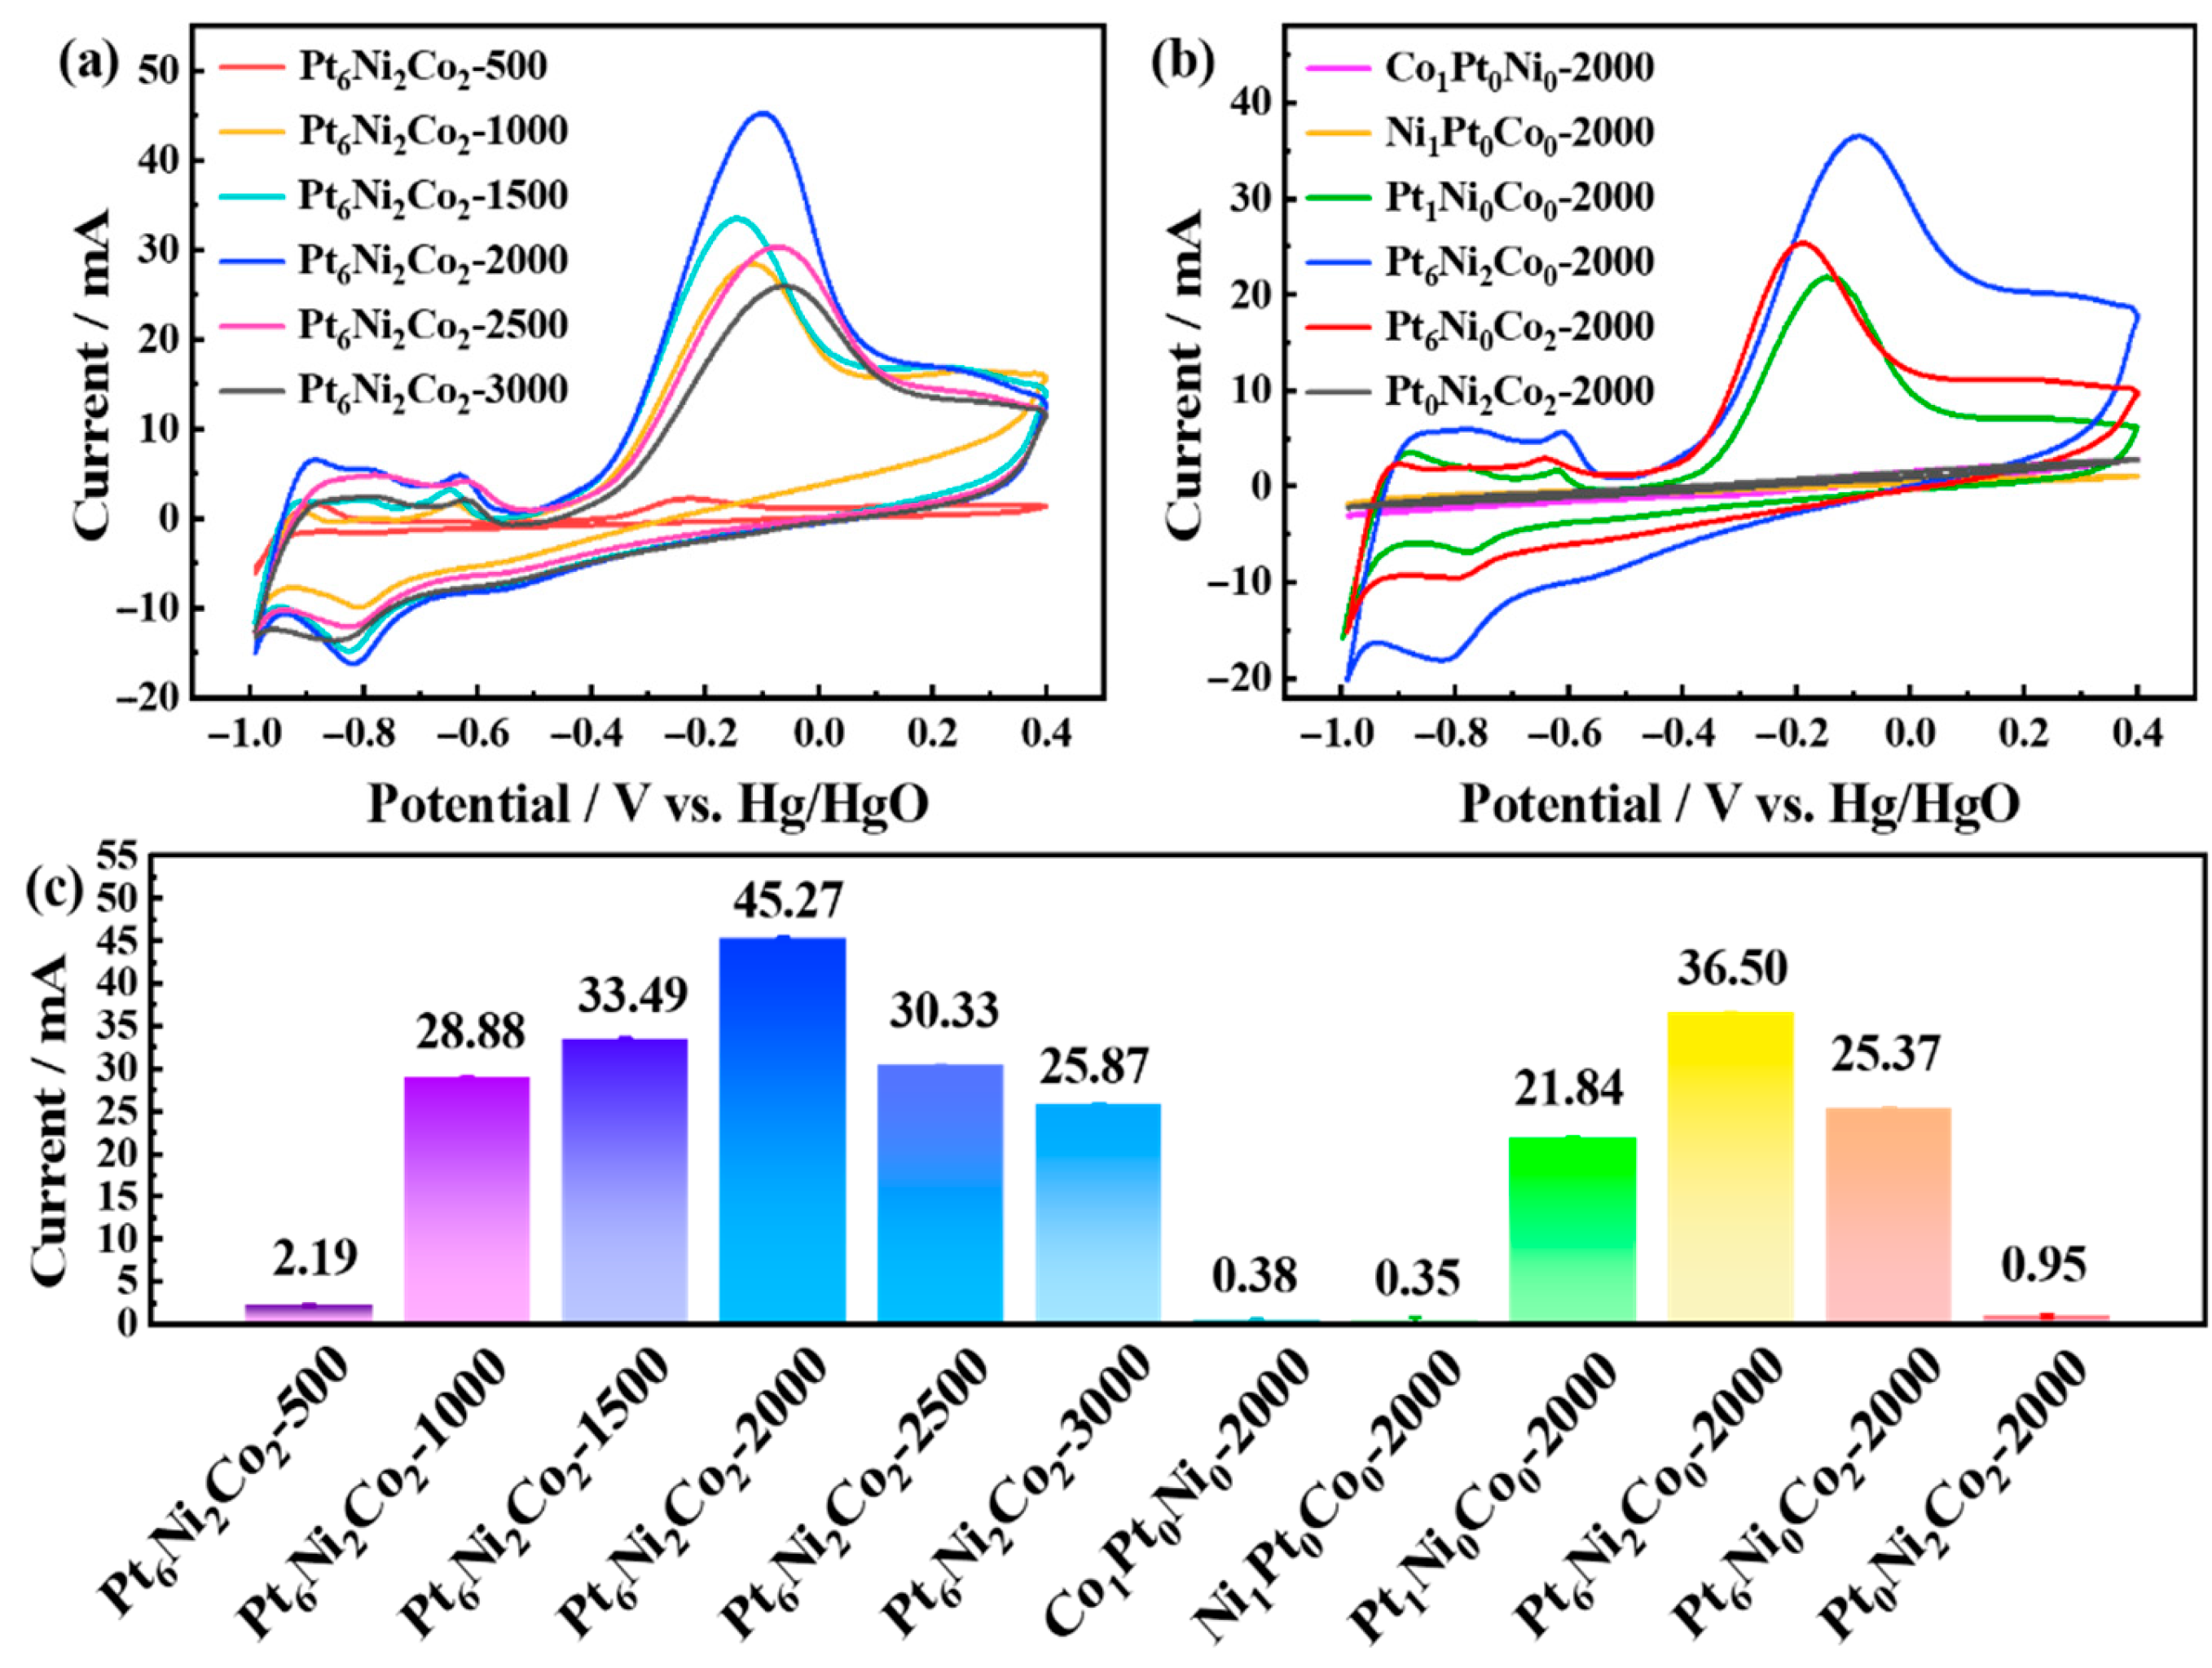
Based on the ratio of 6:2:2 (H2PtCl6·6H2O:Ni(NO3)2·6H2O:Co(NO3)2·6H2O), the effects of deposition time on electrocatalytic performance have also been researched. The electrocatalysts obtained with the deposition times of 500 s, 1500 s, 2000 s, 2500 s, and 3000 s have been prepared. As shown in Figure 3a,c and Figure S6, the electrocatalytic activities of the above catalysts have been measured via the CV technique. When the deposition time increased from 500 s to 2000 s, the oxidation peak currents increased gradually from 2.19 mA to 45.27 mA, indicating that with the increasing deposition time, more Pt6Ni2Co2 grew on the surface of the carbon cloth and further provided more active sites. However, when the deposition time reached 2500 s and 3000 s, the oxidation peak currents exhibited a decreased trend with values of 30.33 mA and 25.87 mA, indicating that some active sites were destroyed during the electrodeposition process. Therefore, Pt6Ni2Co2-2000 obtained with the deposition time of 2000 s exhibited the largest oxidation peak current, proving that 2000 s was the optimal deposition time.
In order to prove that the formed ternary alloy of Pt, Ni, and Co elements showed better electrocatalytic performance than that of the PtNi alloy, PtCo alloy, NiCo alloy, and pure Pt, Ni, and Co catalysts, Pt6Ni2Co0-2000, Pt6Ni0Co2-2000, and Pt0Ni2Co2-2000 have been prepared, and the electrocatalytic activities have been measured, as shown in Figure 3b,c and Figure S7. Pt0Ni2Co2-2000 has no obvious oxidation peak current. Similarly, no obvious peak currents could be found based on the CV curves of Co1Ni0Pt0-2000 and Ni1Pt0Co0-2000, indicating pure Ni and Co have no catalytic activities under this measurement system. In contrast, a clear oxidation peak current could be found based on the CV curves of Pt1Ni0Co0-2000 as 21.84 mA, proving that significant electrocatalytic activity could be attributed to the Pt element in the ternary Pt6Ni2Co2-2000 alloy. Compared to Pt6Ni2Co0-2000, Pt6Ni0Co2-2000 showed a higher oxidation peak current, indicating that the introduction of the Co element was positive. It was worth noting that Pt6Ni2Co0-2000 and Pt6Ni0Co2-2000 showed larger oxidation peak currents than that of Pt1Ni0Co0-2000, indicating that formed Pt-based alloys could improve electrocatalytic performance compared to the pure Pt catalyst.

3.3. Electrochemical Active Surface Areas (ECSAs) and Stability of Pt6Ni2Co2-2000 Electrode

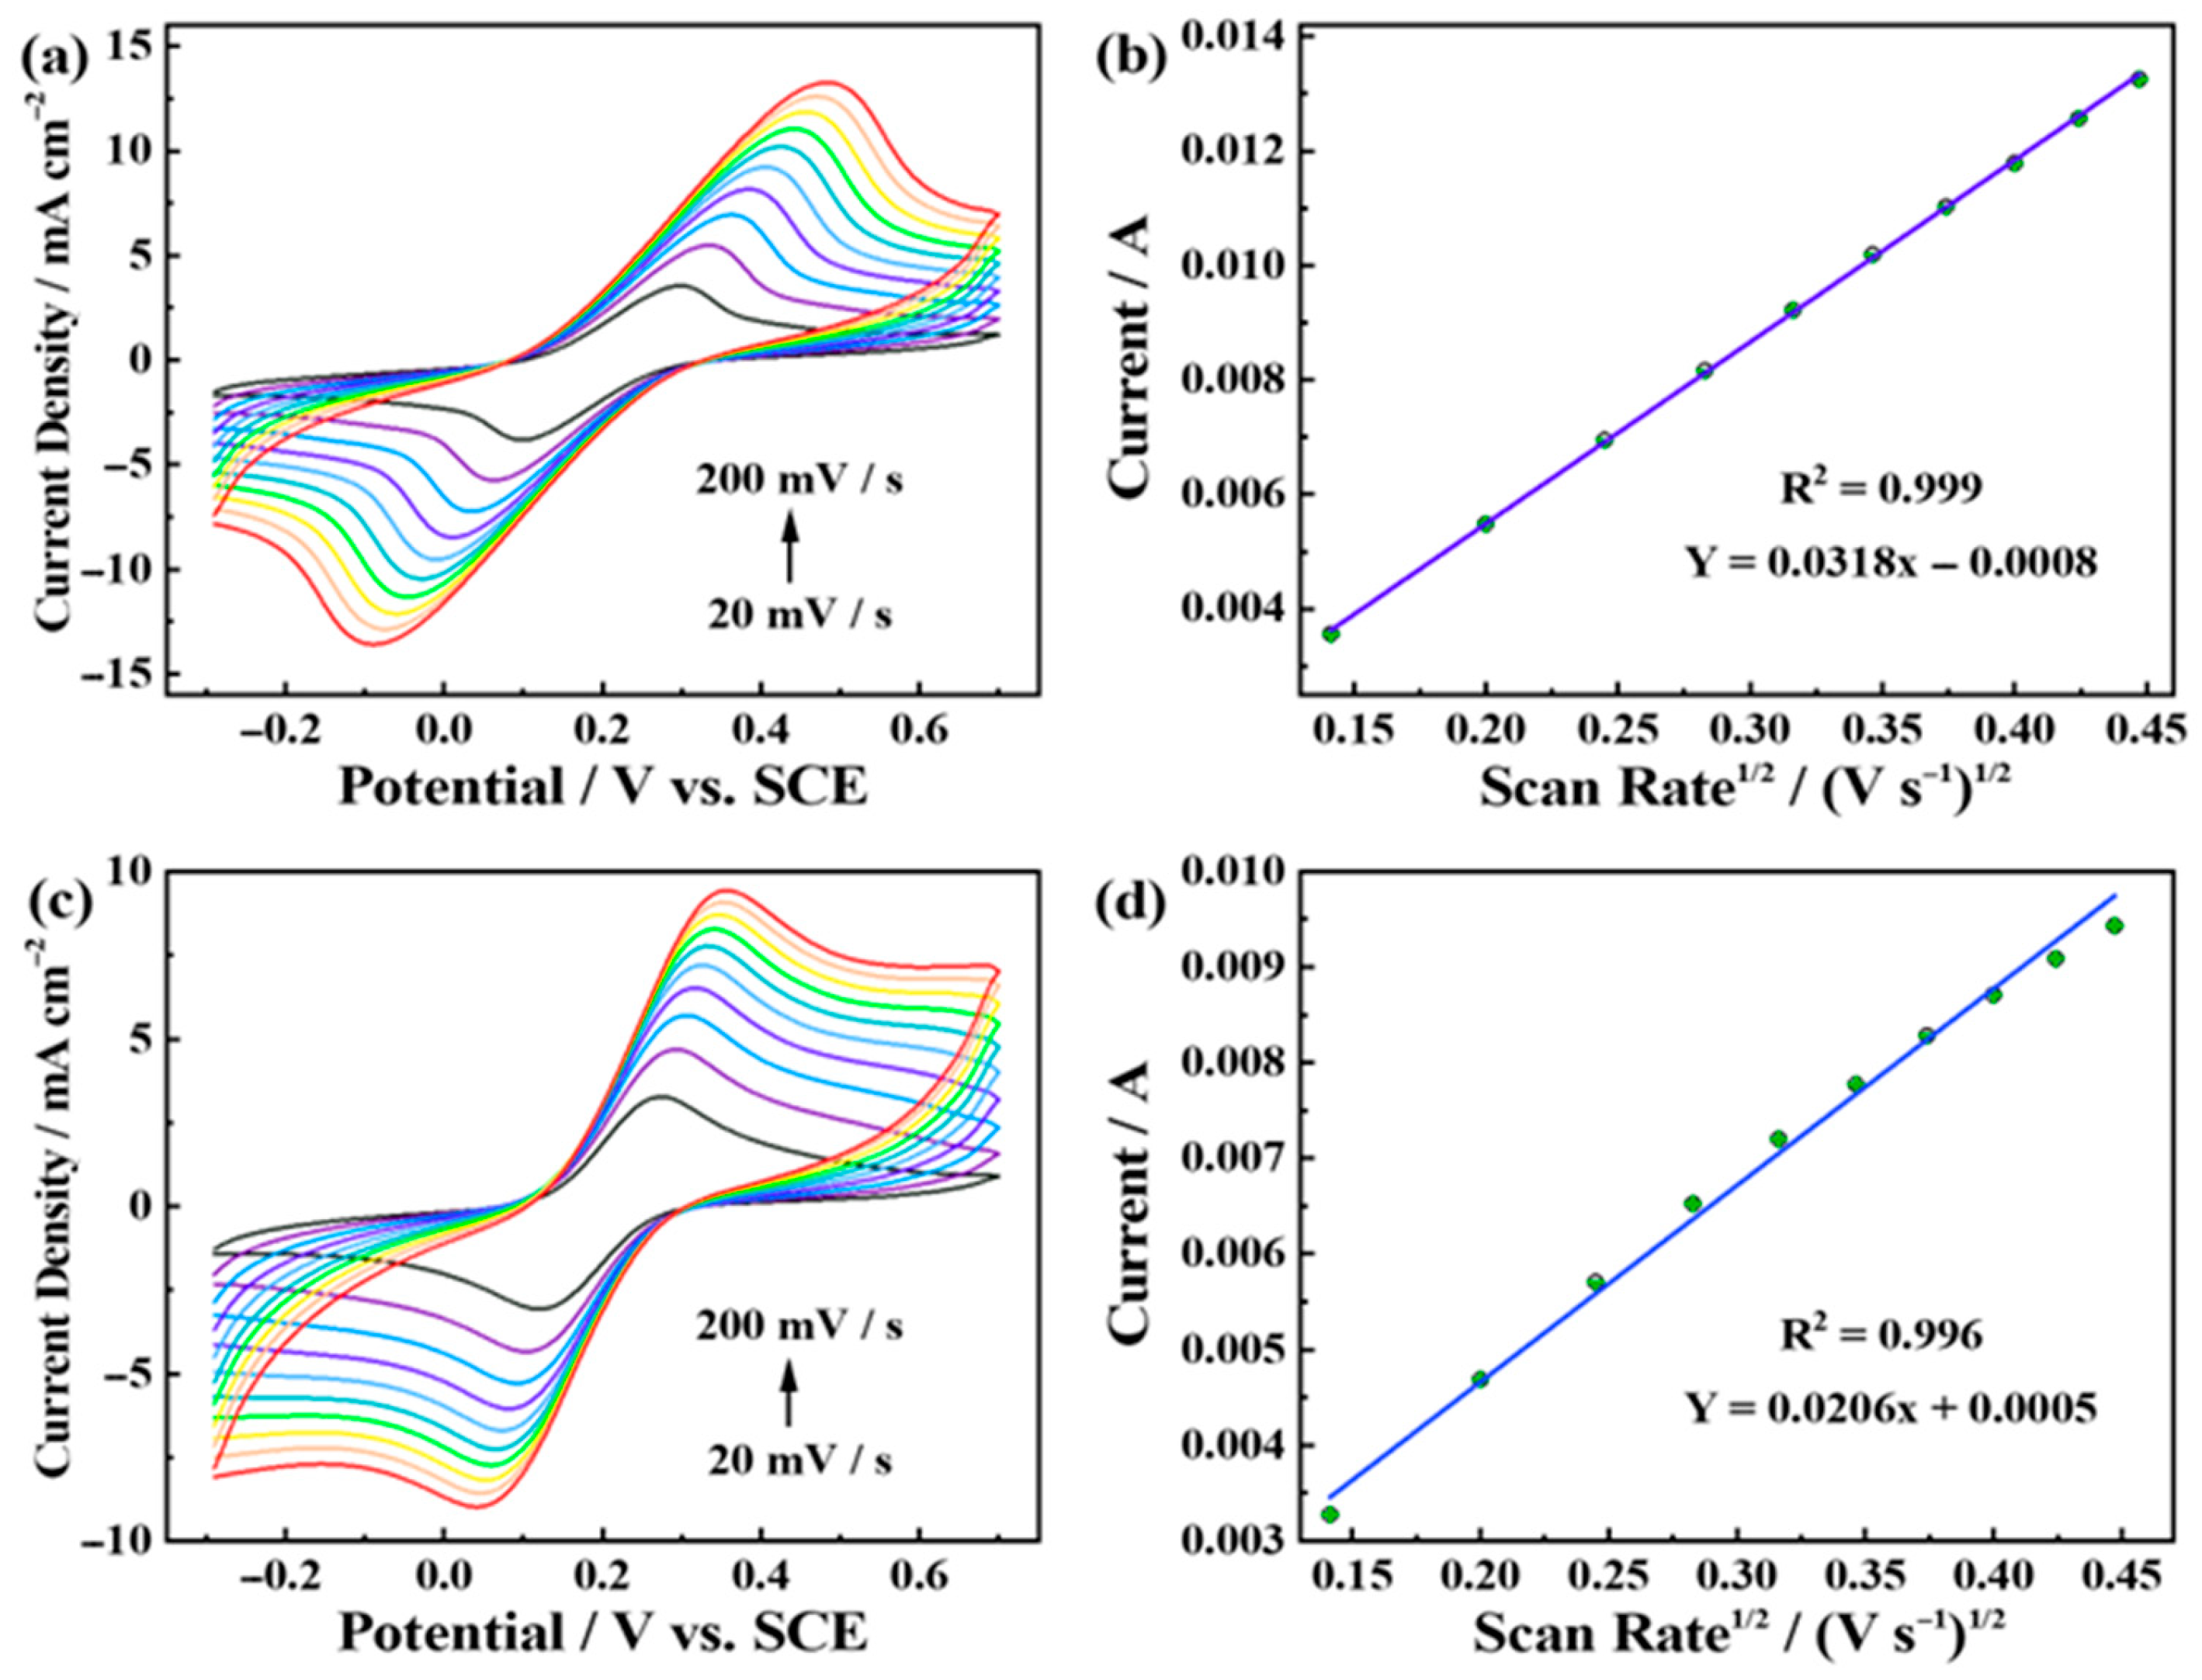
The electrochemical active surface areas (ECSAs) of the Pt6Ni2Co2-2000 electrode have been evaluated via CV in a mixed solution of 0.1 M KCl and 5.0 mM [Fe (CN)6]3− with a scan rate from 20 mV/s to 200 mV/s, and the CV curves are shown in Figure 4a. A significant linear relationship between oxidation peak currents and the square root of scan rates could be found with the linear regression equations Y = 0.0318 x − 0.0008 (R2 = 0.999). Based on the above results and the Randles–Sevcik equation in Equation (1), where Ipa is the oxidation peak current (A), n is the number of transferred electrons, A is the electrochemical active surface area of the electrode (cm2), C is the concentration of probe molecules (mol cm−3), D is the diffusion coefficient (7.60 × 10⁻⁶ cm2 s−1), and ν is the scan rate (V s−1), the ECSA of the Pt6Ni2Co2-2000 electrode could be calculated as 8.55 cm2. In addition, the ECSA of the Pt1Ni0Co0-2000 electrode has also been calculated as 5.54 cm2.
Based on the ECSA, the oxidation peak current densities of the Pt6Ni2Co2-2000 and Pt1Ni0Co0-2000 electrodes have been obtained with values of 5.30 mA cm−2 and 3.94 mA cm−2 (Figure 5a), proving that Pt6Ni2Co2-2000 exhibited the larger ECSA and higher current densities than that of the Pt1Ni0Co0-2000 electrode and further proving that the formation of a Pt-based alloy could improve electrocatalytic performance.
Ipa = (2.69 × 10⁵)n3/2ACD1/2ν1/2
Figure 5a shows the onset potential of the Pt6Ni2Co2-2000 and Pt1Ni0Co0-2000 electrodes. The onset potential of the Pt6Ni2Co2-2000 electrode was −0.54 V and the onset potential of the Pt1Ni0Co0-2000 electrode was −0.43 V, illustrating that the Pt6Ni2Co2-2000 electrode exhibited lower overpotential than that of the Pt1Ni0Co0-2000 electrode and further proving that the Pt6Ni2Co2-2000 electrode showed better electrocatalytic performance for ammonia oxidation reactions. Catalytic stability is another critical factor to evaluate electrocatalysts. Figure 5b shows the stability measurement results for 12 h. It was easy to find that the current of the Pt6Ni2Co2-2000 electrode was retained at 88.09%. In contrast, the Pt1Ni0Co0-2000 electrode suffered significant degradation, retaining only 36.53%, likely due to poisoning by reaction intermediates. Conversely, the Pt6Ni2Co0-2000 electrode showed good stability, achieving 74.85%. However, the stability of the Pt6Ni0Co2-2000 electrode was only 27.69%. These results suggested that the Ni element in the Pt6Ni2Co2-2000 electrode played a crucial role in enhancing poisoning resistance, thereby improving catalytic stability. Figure S10b shows the SEM image of Pt6Ni2Co2-2000 after the stability test. Based on the SEM image, sheet-like morphology could be found and no obvious change could be found compared to the SEM image before the stability test (Figure S10b). The kinetic processes have been measured as shown Figure S11.

3.4. Electrochemical Detection Performance of Pt6Ni2Co2-2000 Electrode

To estimate the electrochemical sensing activities of the Pt6Ni2Co2-2000 electrode, the CV curves have been measured with different concentrations from 100 µM to 1000 µM, as shown in Figure S12a. The oxidation peak currents exhibited an increasing trend with the addition of NH4Cl. Additionally, the NH4Cl concentrations and oxidation peak currents showed a significant linear relationship with the fitted equation Y = 0.0036 x + 1.6342 (R2 = 0.991). The CV curves of the Pt1Ni0Co0-2000 electrode showed a similar trend (Figure S12c), and the NH4Cl concentrations and oxidation peak currents also showed a significant linear relationship (Figure S12d). However, compared to the Pt1Ni0Co0-2000 electrode, the Pt6Ni2Co2-2000 electrode exhibited higher sensitivity at 0.0036 mA/µM, which was more than twice that of the Pt1Ni0Co0-2000 electrode. In addition, the sensing performance of other electrodes have also been measured, as shown in Figures S13–S22. Based on the measurement results and linear relationship between NH4Cl concentrations and oxidation peak currents, the Pt6Ni2Co2-2000 electrode showed the highest sensitivity.
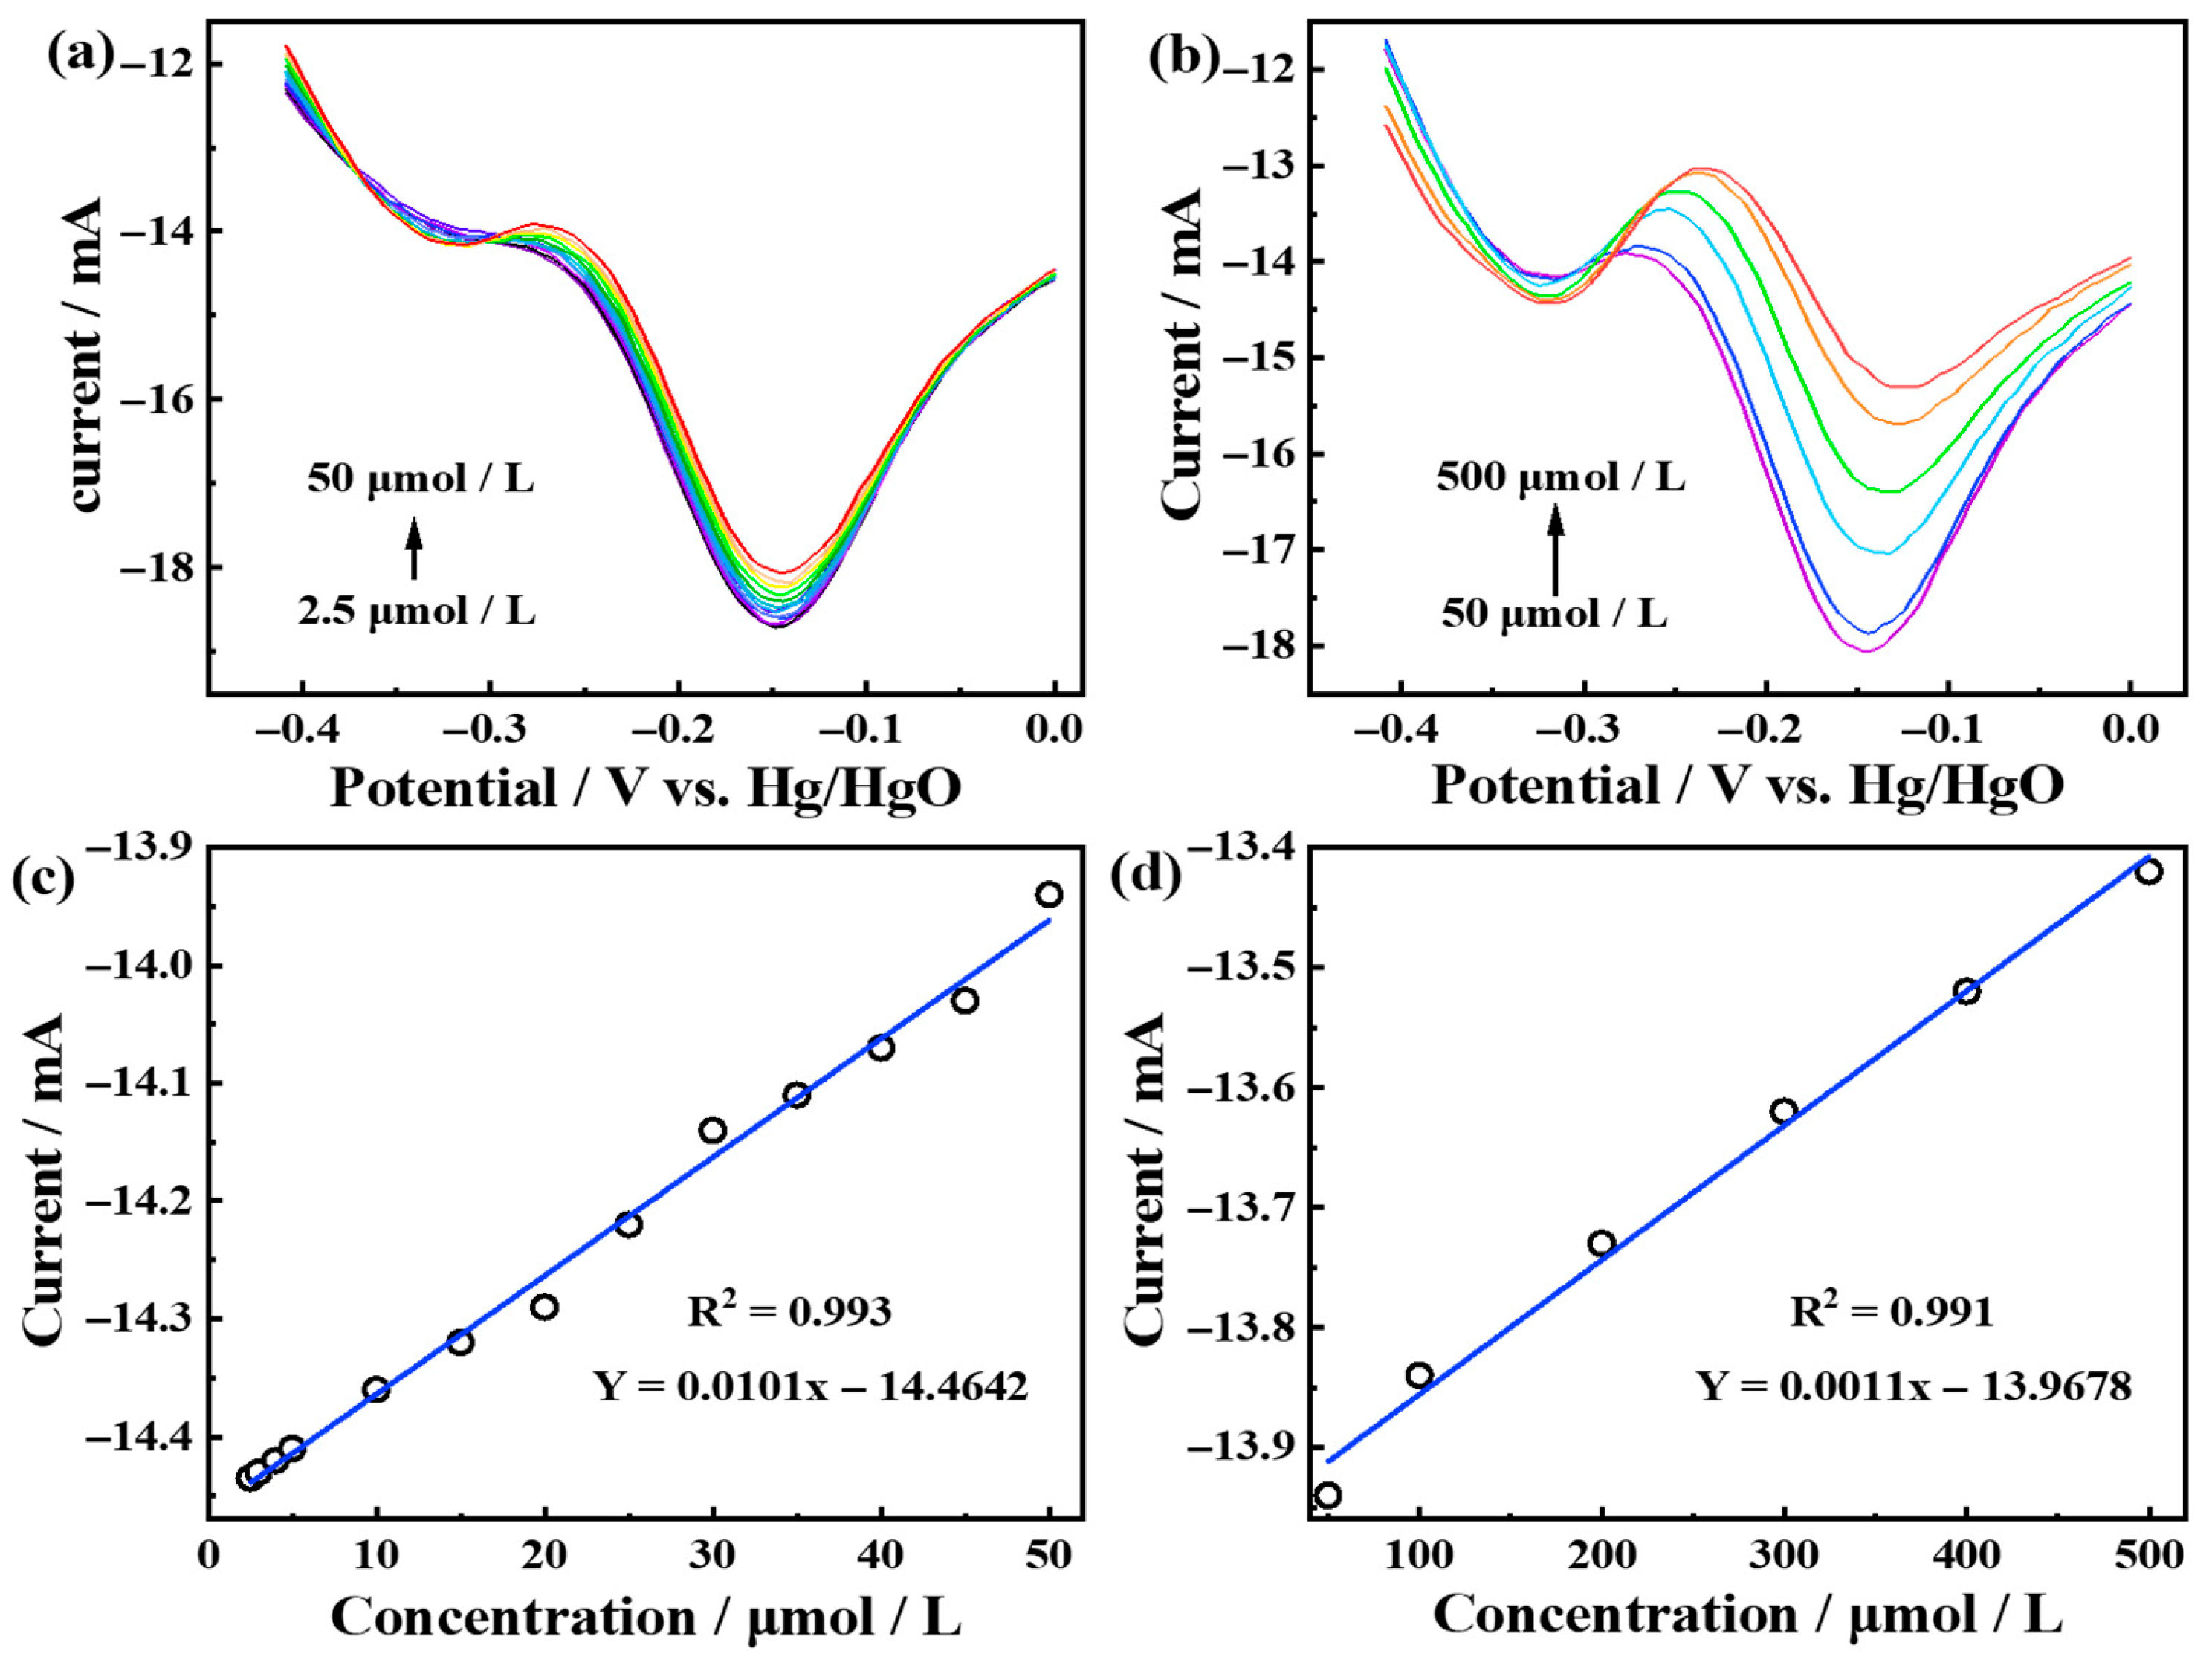
To comprehensively evaluate the sensing capabilities of the Pt6Ni2Co2-2000 electrode, differential pulse voltammetry (DPV) measurements were systematically performed across a broad concentration range of ammonia–nitrogen. As depicted in Figure 6a,b, well-defined oxidation peaks at approximately −0.25 V exhibited a concentration-dependent increase in current response. Quantitative analysis revealed excellent linear correlations between peak current and ammonia–nitrogen concentration in both the low (2.5–50 μM) and high (50–500 μM) concentration ranges, with corresponding regression equations of Y = 0.0101x − 14.4642 (R2 = 0.993) and Y = 0.0011x − 13.9678 (R2 = 0.991) (Figure 6c,d). The sensor demonstrated remarkable sensitivity (10.01 μA μM−1) and achieved a detection limit of 0.688 μM (S/N = 3) [26]. The performance of reported electrochemical ammonia–nitrogen sensors are summarized in Table S2 in the Supplementary Materials, indicating that Pt6Ni2Co2-2000 showed excellent sensing performance.
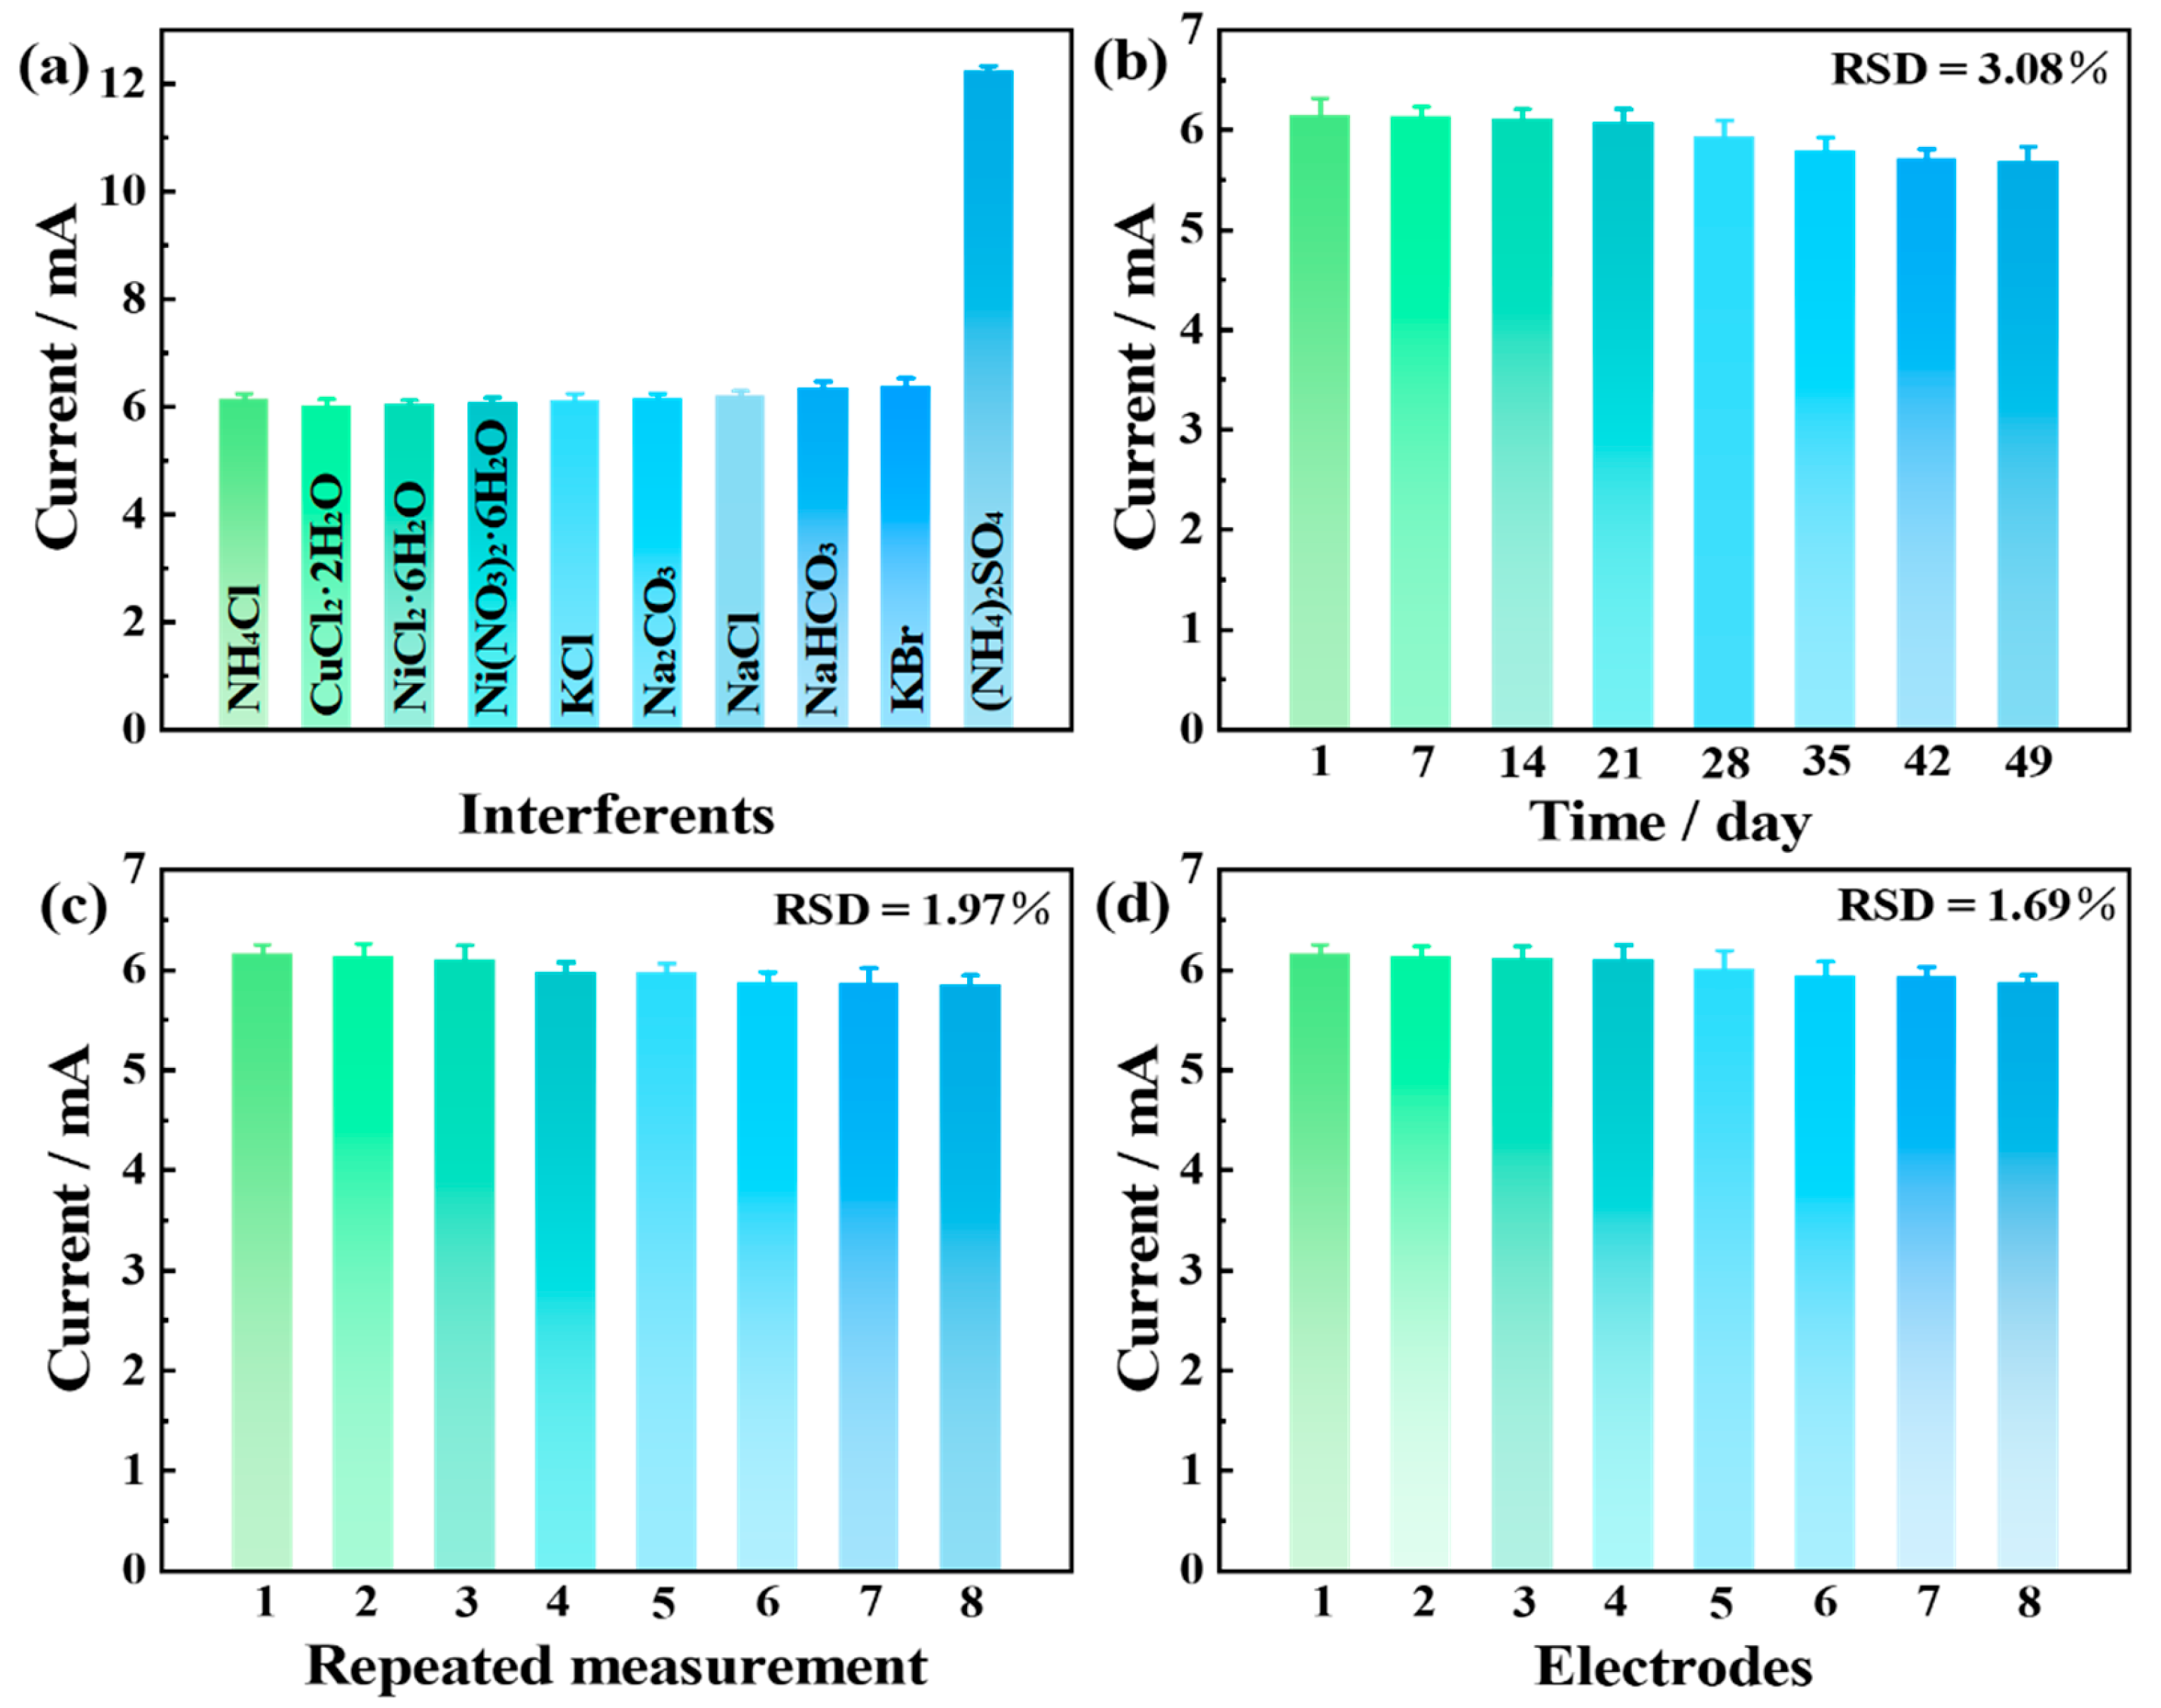
To further evaluate the sensing performance of the Pt6Ni2Co2-2000 electrode, some common salts including NiCl2·6H2O, NiCl2·6H2O, Ni(NO3)2·6H2O, KCl, Na2CO3, NaCl, NaHCO3, and KBr have been added into the measurement system, as shown in Figure 7a. Compared to the NH4Cl system, the peak current charges were not clear, and the peak current charges were less than 4%. Furthermore, (NH4)2SO4 has also been used as an ammonia source, and the measurement result showed that the peak current in the (NH4)2SO4 system was about twice that in the NH4Cl system, indicating that ammonia was the main reactant and SO42− did not show obvious effects. Finally, different measurement systems including DI water, tap water, lake water, and sea water have been used to estimate the performance of the Pt6Ni2Co2-2000 electrode. Figures S23 and S24 show the CV curves, and the oxidation peak currents and oxidation peak potentials have no obvious shift. Therefore, the above measurements prove that the Pt6Ni2Co2-2000 electrode exhibited great selectivity. The stability measurement of the Pt6Ni2Co2-2000 electrode has also been conducted to evaluate the sensing performance. Figure 7b shows the peak currents for 49 days (7 weeks), and the relative standard deviation (RSD) of those peak currents have been calculated as 3.08%. In addition, the peak currents could remain at about 96% after measuring for 7 weeks. The above results indicated that the Pt6Ni2Co2-2000 electrode exhibited excellent stability. The repeatability of the Pt6Ni2Co2-2000 electrode has also been analyzed, as shown in Figure 7c. The RSD of peak currents repeated eight times has been calculated with a value of 1.97%. Significantly, the reproducibility of the Pt6Ni2Co2-2000 electrode has also been measured, and the results were excellent. As shown in Figure 7d, the RSD of peak currents of eight Pt6Ni2Co2-2000 electrodes achieved 1.69%. The above measured results prove that the Pt6Ni2Co2-2000 electrode exhibited great selectivity, stability, repeatability, and reproducibility, showing potential for real-world applications.
To evaluate the practical application potential of the Pt6Ni2Co2-2000 electrode in some common water environments including tap water, lake water, and sea water, recovery measurements have been carried out based on tap water from the laboratory (Bohai University, Jinzhou, China), lake water from Tinglin lake (Bohai University, Jinzhou, China), and sea water from Baisha bay (Jinzhou, China). All water samples were naturally precipitated for over 24 h before being filtered through a 0.22 μm membrane. The water samples were used as a solution for recovery measurements. Different ammonia–nitrogen concentrations of 5 μM, 100 μM, and 500 μM were added into the measured systems. Based on the measurement results, the recoveries and relative standard deviation (RSD) values have been calculated and are presented in Table S3 in the Supplementary Materials.
It was easy to find that the recoveries ranged from 98.97% to 101.18% for tap water samples, from 97.60% to 100.80% for lake water samples, and from 97.26% to 104.41% for sea water samples. Moreover, the RSD values of tap water, lake water, and sea water samples were in the ranges of 1.95–3.11%, 0.49–4.94%, and 0.87–4.30%, respectively. Based on these measurement results, the Pt6Ni2Co2-2000 electrode demonstrated high accuracy.

4. Conclusions

In this study, one sheet-like ternary PtNiCo alloy has been successfully synthesized on a carbon cloth surface via a one-step electrodeposition process. After controlling the ratio of H2PtCl6·6H2O, Ni(NO3)2·6H2O, and Co(NO3)2·6H2O and electrodeposition times, Pt6Ni2Co2-2000 was obtained under the electrodeposition time of 2000 s and under the ratio of 6:2:2. TEM, XRD, and XPS measurements proved the formation of a ternary PtNiCo alloy structure. Electrocatalytic measurements indicated that Pt6Ni2Co2-2000 showed excellent electrochemical performance with low-onset potential, a high oxidation peak current and current density, and long-term catalytic stability compared to other electrodes obtained under different ratios and deposition times. Additionally, Pt6Ni2Co2-2000 exhibited the ability for ammonia–nitrogen detection with a low limit of detection, wide detection range, excellent long-term stability, and remarkable anti-interference capability, reusability, and reproducibility. The above-described excellent electrocatalytic and sensing performance can be ascribed to the introduction of Ni and Co to form the alloy and the controlled electron structure of Pt.

Supplementary Materials

The following supporting information can be downloaded at: https://www.mdpi.com/article/10.3390/chemosensors13090335/s1, Table S1. Sample designation and the molar ratio of the three metal elements of H2PtCl6·6H2O, Ni(NO3)2·6H2O and Co(NO3)2·6H2O. Figure S1. The SEM images of (a) Co6Pt2Ni2-2000 and (b) Ni6Pt2Co2-2000 electrodes. Figure S3. The CV curves of (a) Co8Pt1Ni1-1000, (b) Co6Pt2Ni2-1000, (c) Co4Pt3Ni3-1000, and (d) Co2Pt4Ni4-1000 electrodes in the 1 M KOH and the mixed solution of 1 M KOH and 0.1 M NH4Cl. Figure S4. The CV curves of (a) Ni8Pt1Co1-1000, (b) Ni6Pt2Co2-1000, (c) Ni4Pt3Co3-1000, and (d) Ni2Pt4Co4-1000 electrodes in the 1 M KOH and the mixed solution of 1 M KOH and 0.1 M NH4Cl. Figure S5. The CV curves of (a) Pt8Ni1Co1-1000, (b) Pt6Ni2Co2-1000, (c) Pt4Ni3Co3-1000, and (d) Pt2Ni4Co4-1000 electrodes in the 1 M KOH and the mixed solution of 1 M KOH and 0.1 M NH4Cl. Figure S6. The CV curves of (a) Pt6Ni2Co2-500, (b) Pt6Ni2Co2-1500, (c) Pt6Ni2Co2-2000, (d) Pt6Ni2Co2-2500 and (e) Pt6Ni2Co2-3000 electrodes in the 1 M KOH and the mixed solution of 1 M KOH and 0.1 M NH4Cl. Figure S7. The CV curves of (a) Pt0Ni0Co1-2000, (b) Pt0Ni1Co0-2000, (c) Pt1Ni0Co0-2000, (d) Pt6Ni2Co0-2000, (e) Pt6Ni0Co2-2000 and (f) Pt0Ni2Co2-2000 electrodes in the 1 M KOH and the mixed solution of 1 M KOH and 0.1 M NH4Cl. Figure S8. The CV curves the Pt6Ni2Co2-2000 electrode at different potential ranges (a) in 1 M KOH and (b) 0.1 M NH4Cl 1 M KOH. Figure S9. The CV curves the Pt6Ni2Co2-2000 electrode at (a) -0.8~0.6 V, (b) -0.6~0.8 V, (c) -0.4~1.0 V, and (d) -0.2~1.2 V different voltages in the 1 M KOH and the mixed solution of 1 M KOH and 0.1 M NH4Cl. Figure S10. The SEM image of Pt6Ni2Co2-2000 (a) before and (b) after stability test for 12 h. Figure S11. (a) Pt6Ni2Co2-2000 electrode in 0.1 M KCl containing 5.0 mM [Fe (CN)6]3− at different scan rates from 20 to 200 mV s−1, (b) the linear relationship between oxidation peak current and the square root of scan rate, (c) the linear relationship between oxidation peak potentials and the scan rate and (d) the linear relationship between the oxidation peak potentials and lnv. Figure S12. The CV curves of (a) Pt6Ni2Co2-2000 and (c) Pt1Ni0Co0-2000 electrodes in the different NH4Cl concentration from 100 μM to 1000 μM, the fitted curves of current and NH4Cl concentration of (b) Pt6Ni2Co2-2000 and (d) Pt1Ni0Co0-2000 electrodes. Figure S13. The CV curves of (a) Co8Pt1Ni1-1000, and (c) Co6Pt2Ni2-1000 electrodes in the 1 M KOH and the 1 M KOH with the NH4Cl concentration from 100 µmol/L to 1000 µmol/L. The fitted curves of current and NH4Cl concentration for (b) Co8Pt1Ni1-1000, and (d) Co6Pt2Ni2-1000 electrodes. Figure S14. The CV curves of (a) Co4Pt3Ni3-1000, and (c) Co2Pt4Ni4-1000 electrodes in the 1 M KOH and the 1 M KOH with the NH4Cl concentration from 100 µmol/L to 1000 µmol/L. The fitted curves of current and NH4Cl concentration for (b) Co4Pt3Ni3-1000, and (d) Co2Pt4Ni4-1000 electrodes. Figure S15. The CV curves of (a) Ni8Pt1Co1-1000, and (c) Ni6Pt2Co2-1000 electrodes in the 1 M KOH and the 1 M KOH with the NH4Cl concentration from 100 µmol/L to 1000 µmol/L. The fitted curves of current and NH4Cl concentration for (b) Ni8Pt1Co1-1000, and (d) Ni6Pt2Co2-1000 electrodes. Figure S16. The CV curves of (a) Ni4Pt3Co3-1000, and (c) Ni2Pt4Co4-1000 electrodes in the 1 M KOH and the 1 M KOH with the NH4Cl concentration from 100 µmol/L to 1000 µmol/L. The fitted curves of current and NH4Cl concentration for (b) Ni4Pt3Co3-1000, and (d) Ni2Pt4Co4-1000 electrodes. Figure S17. The CV curves of (a) Pt8Ni1Co1-1000, and (c) Pt6Ni2Co2-1000 electrodes in the 1 M KOH and the 1 M KOH with the NH4Cl concentration from 100 µmol/L to 1000 µmol/L. The fitted curves of current and NH4Cl concentration for (b) Pt8Ni1Co1-1000, and (d) Pt6Ni2Co2-1000 electrodes. Figure S18. The CV curves of (a) Pt4Ni3Co3-1000, and (c) Pt2Ni4Co4-1000 electrodes in the 1 M KOH and the 1 M KOH with the NH4Cl concentration from 100 µmol/L to 1000 µmol/L. The fitted curves of current and NH4Cl concentration for (b) Pt4Ni3Co3-1000, and (d) Pt2Ni4Co4-1000 electrodes. Figure S19. The CV curves of (a) Pt6Ni2Co2-500, and (c) Pt6Ni2Co2-1500 electrodes in the 1 M KOH and the 1 M KOH with the NH4Cl concentration from 100 µmol/L to 1000 µmol/L. The fitted curves of current and NH4Cl concentration for (b) Pt6Ni2Co2-500, and (d) Pt6Ni2Co2-1500 electrodes. Figure S20. The CV curves of (a) Pt6Ni2Co2-2500, and (c) Pt6Ni2Co2-3000 electrodes in the 1 M KOH and the 1 M KOH with the NH4Cl concentration from 100 µmol/L to 1000 µmol/L. The fitted curves of current and NH4Cl concentration for (b) Pt6Ni2Co2-2500, and (d) Pt6Ni2Co2-3000 electrodes. Figure S21. The CV curves of (a) Pt0Ni0Co1-2000, and (c) Pt0Ni1Co0-2000 electrodes in the 1 M KOH and the 1 M KOH with the NH4Cl concentration from 100 µmol/L to 1000 µmol/L. The fitted curves of current and NH4Cl concentration for (b) Pt0Ni0Co1-2000, and (d) Pt0Ni1Co0-2000 electrodes. Figure S22. The CV curves of (a) Pt6Ni2Co0-2000, (c) Pt6Ni0Co2-2000, and (e) Pt0Ni2Co2-2000 electrodes in the 1 M KOH and the 1 M KOH with the NH4Cl concentration from 100 µmol/L to 1000 µmol/L. The fitted curves of current and NH4Cl concentration for (b) Pt6Ni2Co0-2000, (d) Pt6Ni0Co2-2000, and (f) Pt0Ni2Co2-2000 electrodes. Figure S23. (a) The CV curves the Pt6Ni2Co2-2000 electrode at different water sample in 1 M KOH and (b) 1 M KOH and 0.1 M NH4Cl. Figure S24. The CV curves of Pt6Ni2Co2-2000 electrode in (a) DI water, (b) Tap water, (c) lake water and (d) sea water. Table S2. Sensing performance of reported ammonia-nitrogen sensors. Table S3. The recoveries and RSD of tap water (T1–T3), lake water (L1–L3), and sea water (S1–S3) samples (n = 3) [13,21,25,27,28,29,30,31,32,33,34].

Author Contributions

Methodology, L.Z., J.G. and C.Z.; Writing—original draft, L.Z., C.Z. and X.W.; Investigation, Y.H. (Yue Han), J.G. and Y.H. (Yingying Huang); Data curation, Y.H. (Yue Han); Data curation, Y.H. (Yingying Huang); Funding acquisition, X.W. All authors have read and agreed to the published version of the manuscript.

Funding

The PhD Start-up Fund of Bohai University (05013/0522bs010 and 05013/0521bs017).

Institutional Review Board Statement

Not applicable.

Informed Consent Statement

Not applicable.

Data Availability Statement

The data presented in this study are available on request from the corresponding author.

Acknowledgments

This study was supported by the PhD Start-up Fund of Bohai University (05013/0522bs010 and 05013/0521bs017).

Conflicts of Interest

The author declares no conflicts of interest.

References

  1. Yang, J.; Yang, R.; He, C.; Xu, C.; Xu, L.; Hu, Z.H.; Wang, W. Novel insights into ammonia nitrogen removal: TiO2-based photocatalysts and potential of intimate coupling biodegradation. J. Environ. Chem. Eng. 2025, 13, 115962. [Google Scholar] [CrossRef]
  2. Yi, W.; Liu, G.; Wang, M.; Wang, J.; Chen, D.; Shen, J. Increased nitrogen deposition and airborne particulate matter pollution in the vicinity of intensive animal farms caused by ammonia emissions. Agric. Ecosyst. Environ. 2025, 387, 109634. [Google Scholar] [CrossRef]
  3. Luo, Y.; Liu, S.; Shi, J.; Xu, S.; Gao, Y. A new particle material (CTS/ZMS) for removing ammonia and nitrate from groundwater: Performance and regeneration. Environ. Technol. 2025, 46, 1648–1665. [Google Scholar] [CrossRef]
  4. Flores-Zambrano, K.; Tapia, W.; Castillejo, P. Microalgae strains isolated from piggery wastewater in Ecuador: Effective nitrogen compound removal and growth potential in extremophile conditions. Biotechnol. Rep. 2025, 45, e00883. [Google Scholar] [CrossRef]
  5. Bhambri, A.; Karn, S.K.; Kumar, A. Ammonia transformation by potential consortium in the aquatic system. Sci. Rep. 2025, 15, 6066. [Google Scholar] [CrossRef]
  6. Zhang, H.Y.; Zhang, Y.; Lai, D.; Chen, L.Q.; Zhou, L.Q.; Tao, C.L.; Fang, Z.; Zhu, R.R.; Long, W.Q.; Liu, J.W.; et al. Real-time smartphone-based multi-parameter detection of nitrite, ammonia nitrogen, and total phosphorus in water. Anal. Methods 2025, 17, 5683–5696. [Google Scholar] [CrossRef]
  7. Basak, H.K.; Adak, M.K.; Rajput, A.; Chakraborty, B. Low Pt loading on wolframite-type NiWO4 to excel the electrocatalytic water splitting and ammonia oxidation reaction. ACS Appl. Mater. Interfaces 2025, 17, 9391–9406. [Google Scholar] [CrossRef]
  8. Zhang, L.; Zhao, C.; Wang, G.; Suo, H.; He, D.; Yang, S.; Ding, J. In-situ fabrication of carbon cloth-supported polypyrrole-platinum nanosheets for the electrochemical detection of ammonia–nitrogen. Mater. Lett. 2021, 305, 130767. [Google Scholar] [CrossRef]
  9. Zhang, L.; Liu, S.; Liu, X.; Han, Y.; Gu, J.; Wang, X. Two-step electrodeposition of polypyrrole nanospheres and Pt nanostars on Ni foam for electrochemical detection of ammonia–nitrogen. NANO Brief Rep. Rev. 2024, 19, 2450002. [Google Scholar] [CrossRef]
  10. Zhang, L.; Yuan, M.; Wang, X.; Gu, J. Enhanced electrocatalytic oxidation activity of platinum-poly (methylene blue) as a sensitive sensor for ammonia–nitrogen detection. Microchem. J. 2024, 199, 110238. [Google Scholar] [CrossRef]
  11. Wu, M.; Du, J.; Tao, C.; Liu, Z.; Li, Y. A tri-functionalised Pt-SnOx-based electrocatalyst for hydrogen generation via ammonia decomposition under native pH conditions. J. Colloid Interface Sci. 2019, 542, 451–459. [Google Scholar] [CrossRef]
  12. Bai, J.; Wang, C.; Liu, K.; Wang, H.; Liu, Y.; Liu, F.; Suo, H.; Liang, X.; Zhang, C.; Liu, F.; et al. Enhanced gas sensing performance based on the PtCu octahedral alloy nanocrystals decorated SnO2 nanoclusters. Sens. Actuators B Chem. 2021, 330, 129375. [Google Scholar] [CrossRef]
  13. Liu, S.; Jiang, Y.; Wang, M.; Huan, Y.; He, Y.; Cheng, Q.; Cheng, Y.; Liu, J.; Zhou, X.; Qian, T.; et al. Awakening (220) as one more active facet of PtMo alloy via single-atom doping to boost ammonia electrooxidation in direct ammonia fuel cell. Adv. Funct. Mater. 2023, 33, 2306204. [Google Scholar] [CrossRef]
  14. Jiang, J.; Zhang, L. Nanostructured platinum-iridium alloy microelectrode for ammonia determination. Electroanalysis 2017, 29, 2019–2026. [Google Scholar] [CrossRef]
  15. Wang, J.; Zhang, J.; Liu, G.; Ling, C.; Chen, B.; Huang, J.; Liu, X.; Li, B.; Wang, A.-L.; Hu, Z.; et al. Crystal phase-controlled growth of PtCu and PtCo alloys on 4H Au nanoribbons for electrocatalytic ethanol oxidation reaction. Nano Res. 2020, 12, 1970–1975. [Google Scholar] [CrossRef]
  16. Wang, G.; Ma, G.; Gao, J.; He, D.; Zhao, C.; Suo, H. Enhanced sensitivity of electrochemical sensors for ammonia-nitrogen via in-situ synthesis PtNi nanoleaves on carbon cloth. Sensors 2024, 24, 387. [Google Scholar] [CrossRef]
  17. Batgi, S.U.; Yapici, B.; Sahin, O.G. Electrocatalytic activity of carbon nanotube-supported Pt-based bimetallic catalysts for borohydride electro-oxidation. J. Electron. Mater. 2024, 53, 7846–7857. [Google Scholar] [CrossRef]
  18. Xing, Q.; Yan, W.; Wei, C.; Xiao, Z.; Jin, Z.; Liu, X.; Ren, J.; Chen, Y.; Li, X. Controlled preparation and anti-sulfate electrocatalysis of self-assembled multidimensional PtZn quasi-cubic nanodendrites. Adv. Mater. Interfaces 2022, 9, 2101944. [Google Scholar] [CrossRef]
  19. Minakshi, M.; Aughterson, R.; Sharma, P.; Sunda, A.P.; Ariga, K.; Shrestha, L.K. Micelle-Assisted Electrodeposition of γ-MnO2 on Lead Anodes: Structural and Electrochemical Insights. ChemNanoMat 2025, 2500270. [Google Scholar] [CrossRef]
  20. Wang, X.; Huang, Y.; Zhang, Y.; Han, Y.; Zhang, Y.; Gu, J.; Zhang, L. Electrochemical fabrication of polyRhodamine B film and Pt nanosheets on Ni foam for enhancing electrochemical detection activities of ammonia-nitrogen. J. Electroanal. Chem. 2025, 996, 119433. [Google Scholar] [CrossRef]
  21. Zhang, L.; Ma, X.; Liu, J.; Gu, J.; Suo, H.; Zhao, C.; Wang, X. Achieving Ni@(Pt/Ni(OH)2) ternary nanoflowers derived from Ni nanoflowers for electrochemical ammonia–nitrogen detection in the aqueous environment. Microchem. J. 2024, 200, 110401. [Google Scholar] [CrossRef]
  22. Cai, J.; Wei, L.; Liu, J.; Xue, C.; Chen, Z.; Hu, Y.; Zang, Y.; Wang, M.; Shi, W.; Qin, T.; et al. Two-dimensional crystalline platinum oxide. Nat. Mater. 2024, 23, 1654–1663. [Google Scholar] [CrossRef] [PubMed]
  23. Wang, J.; Zhao, W.; Yu, H.; Wang, W.; Xu, Y.; Shen, L.-L.; Zhang, G.-R.; Mei, D. Enhanced electrochemical oxidation of 5-hydroxymethylfurfural over tailored nickel nanoparticle assembly. Appl. Catal. B Environ. Energy 2024, 353, 124086. [Google Scholar] [CrossRef]
  24. Lin, Z.; Yang, Z.; Wang, J.; Wang, J.; Huang, H.; Feng, J.; Yan, H.; Zhao, M.; Liu, X.; Liu, W.; et al. Unlocking the Potential of Oxide-Based Catalysts for CO2 Photo-Hydrogenation: Oxygen Vacancies Promoted C–O Bond Cleavage in Key Intermediates. Adv. Mater. 2025, 37, 2408906. [Google Scholar] [CrossRef]
  25. Zhang, L.; Ding, J.; Cui, G.; Zhao, C.; Suo, H.; He, D. A novel electrochemical ammonia–nitrogen sensor based on carbon cloth-supported hierarchical Pt nanosheets-Ni(OH)2 nanosheets nanocomposites. Chem. Eng. Sci. 2021, 239, 116634. [Google Scholar] [CrossRef]
  26. Dharmalingam, S.T.; Dar, M.A.; Gul, R.; Sundaram, M.M.; Alnaser, I.A.; Sivasubramanian, R. Nano-Octahedron Cobalt Oxide Decorated Graphene Nanocomposites for the Selective/Simultaneous Detection of Dopamine. Adv. Mater. Interfaces 2025, 12, 2400981. [Google Scholar] [CrossRef]
  27. Bari, B.; Tyagi, P.; Udeochu, U. Cyclic voltammetry insights into Ni/Al-carbonate hydrotalcite catalysis for methanol oxidation. Sci. Rep. 2025, 15, 13365. [Google Scholar] [CrossRef]
  28. Zhang, J.W.; Zhang, X.; Gao, J.; Zhao, C.; Suo, H. Electrochemical surface functionalization engineering of carbon cloth for ultrasensitive electrochemical detection of nitrite. Microchem. J. 2024, 197, 109795. [Google Scholar] [CrossRef]
  29. Hu, D.M.; Sun, T.T.; Dong, J.; Xu, Q.M.; Xu, L.B. Engineering platinum–nickel nano-alloys in hierarchically ordered porous cobalt-nitrogen-doped carbon for highly efficient electrocatalytic oxygen reduction. Mater. Lett. 2022, 327, 133052. [Google Scholar] [CrossRef]
  30. Aligholizadeh K, N.A.; Alzate-Carvajal, N.; Nallayagari, A.R.; Monyoncho, E.A.; Zulevi, B.; Serov, A.; Baranova, E.A. In-situ polarization modulation IRRAS investigation of ammonia electrooxidation on Pt-Ir and Pt-Ru nanoparticles prepared on engineered catalyst supports. Electrochim. Acta 2024, 507, 145046. [Google Scholar]
  31. Qin, R.M.; Zhang, Y.H.; Xu, H.G.; Nie, P.C. Gold Nanoparticle-Modified Electrodes for Electrochemical Sensing of Ammonia Nitrogen in Water. ACS Appl. Nano Mater. 2024, 7, 577–593. [Google Scholar] [CrossRef]
  32. Liu, Y.; Zeng, X.; Wu, Y.L.; Khan, H.U.; Xiao, F.; Xia, B.Y.; Sun, Y.M. Functionalized MXene fiber electrode for the electrochemical sensing of urinary ammonia. Adv. Sens. Energy Mater. 2024, 3, 100091. [Google Scholar] [CrossRef]
  33. GZhou, F.; Wang, G.D.; Zhao, X.; He, D.; Zhao, C.; Suo, H. Electrochemical detection of ammonia in water using NiCu carbonate hydroxide-modified carbon cloth electrodes: A simple sensing method. Sensors 2024, 24, 4824. [Google Scholar]
  34. Zhang, L.; Liu, T.Y.; Ren, R.H.; Zhang, J.W.; He, D.; Zhao, C.; Suo, H. In situ synthesis of hierarchical platinum nanosheets-polyaniline array on carbon cloth for electrochemical detection of ammonia. J. Hazard. Mater. 2020, 392, 122. [Google Scholar] [CrossRef] [PubMed]
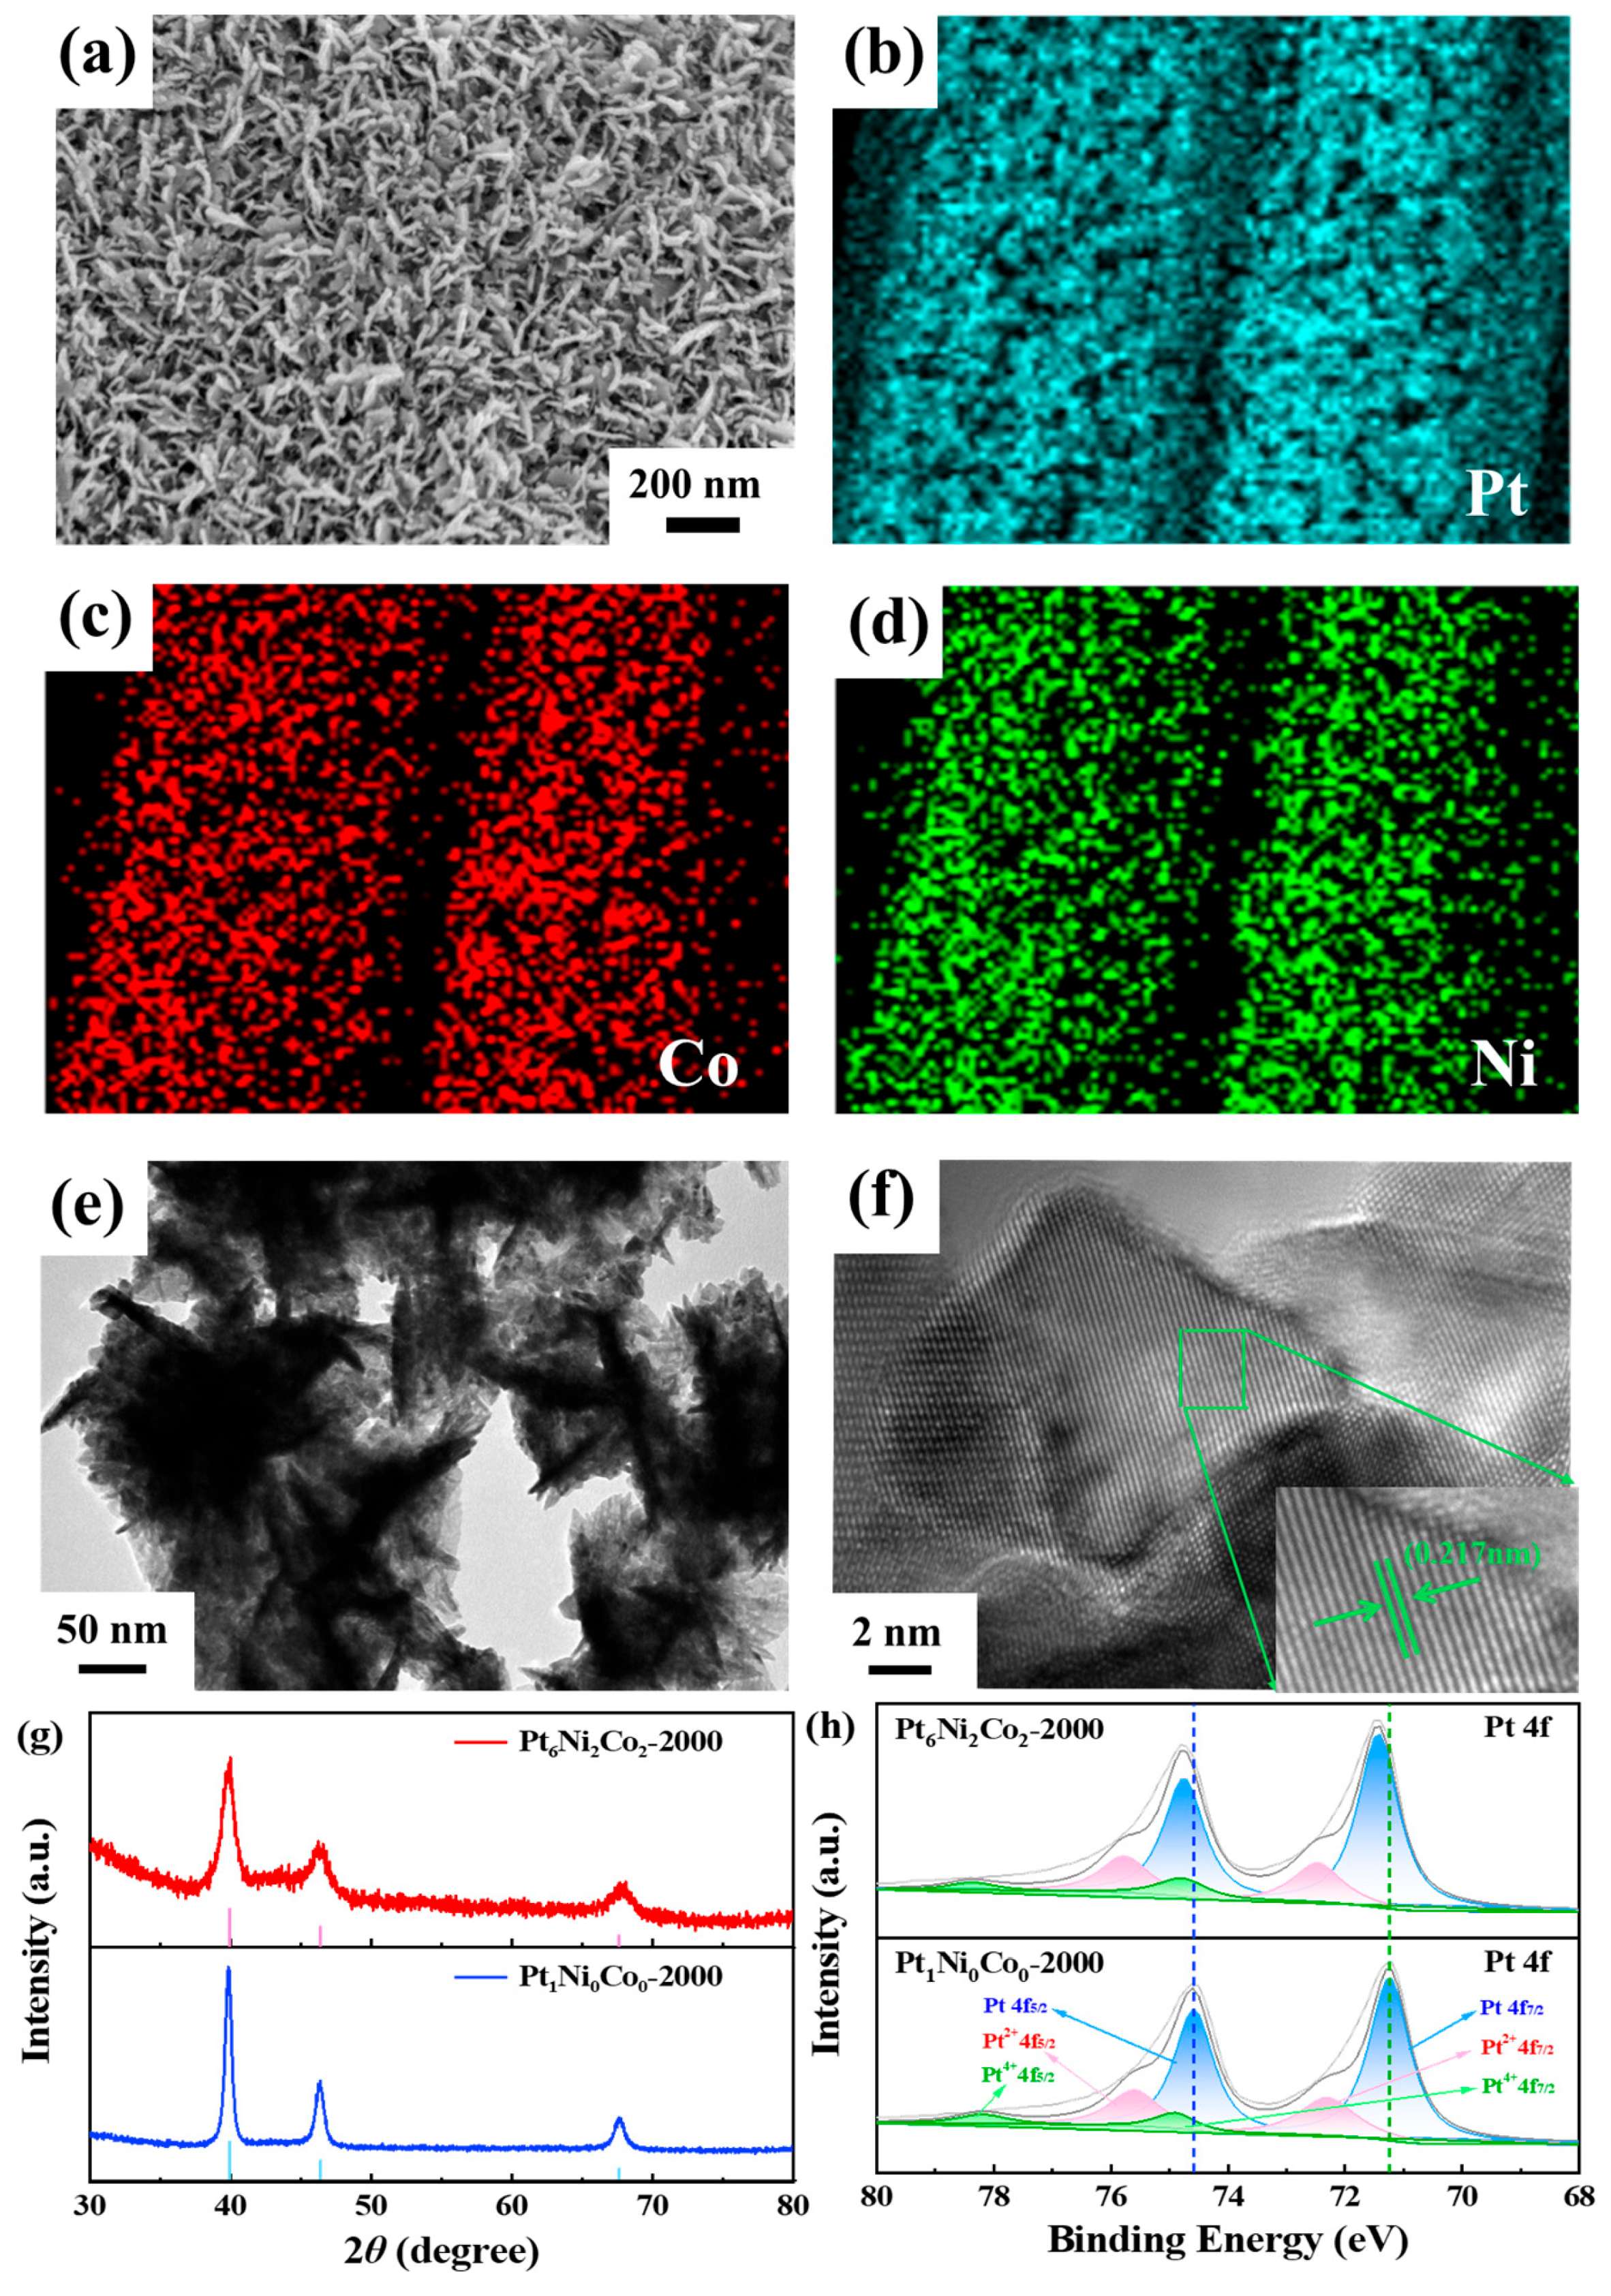
Figure 1. (a) SEM images of Pt6Ni2Co2-2000. (bd) Mapping image of Pt element, Co element, and Ni element; (e) TEM image of Pt6Ni2Co2-2000; and (f) HRTEM image of Pt6Ni2Co2-2000. (g) XRD patterns of Pt6Ni2Co2-2000 and Pt1Ni0 Co0-2000; (h) XPS spectrum of Pt 4f of Pt6Ni2Co2-2000 and Pt1Ni0 Co0-2000.
Chemosensors 13 00335 g001
Figure 2. (a) The CV curves of Co8Pt1Ni1-1000, Co6Pt2Ni2-1000, Co4Pt3Ni3-1000, and Co8Pt1Ni1-1000 electrodes in 1 M KOH in the presence of 0.1 M NH4Cl; (b) the CV curves of Ni8Pt1Co1-1000, Ni6Pt2Co2-1000, Ni8Pt1Co1-1000, and Ni8Pt1Co1-1000 electrodes in 1 M KOH in the presence of 0.1 M NH4Cl; (c) the CV curves of Pt8Ni1Co1-1000, Pt6Ni2Co2-1000, Pt4Ni3Co3-1000, and Pt2Ni4Co4-1000 electrodes in 1 M KOH in the presence of 0.1 M NH4Cl; (d) the current density of different electrodes.
Chemosensors 13 00335 g002
Figure 3. (a) The CV curves of Pt6Ni2Co2-500, Pt6Ni2Co2-1000, Pt6Ni2Co2-1500, Pt6Ni2Co2-2000, Pt6Ni2Co2-2500, and Pt6Ni2Co2-3000 electrodes in 1 M KOH in the presence of 0.1 M NH4Cl; (b) the CV curves of Co1Ni0Pt0-2000, Ni1Pt0Co0-2000, Pt1Ni0Co0-2000, Pt6Ni2Co0-2000, Pt6Ni0Co2-2000, and Pt0Ni2Co2-2000 electrodes in 1 M KOH in the presence of 0.1 M NH4Cl; (c) the current density of different electrodes.
Chemosensors 13 00335 g003
Figure 4. (a) Pt6Ni2Co2-2000 and (c) Pt1Ni0Co0-2000 electrodes in 0.1 M KCl containing 5.0 mM [Fe (CN)6]3− at different scan rates from 20 to 200 mV s−1. The linear relationship between the oxidation peak current and the square root of the scan rate of (b) Pt6Ni2Co2-2000 and (d) Pt1Ni0Co0-2000 electrodes.
Chemosensors 13 00335 g004
Figure 5. (a) Corresponding bar chart of oxidation peak currents and oxidation peak potentials for Pt6Ni2Co2-2000 and Pt1Ni0Co0-2000 and (b) the i-t curves of Pt6Ni2Co2-2000, Pt1Ni0Co0-2000, Pt6Ni0Co2-2000, and Pt6Ni2Co0-2000 for 12 h.
Chemosensors 13 00335 g005
Figure 6. (a,b) DPV curves in 1 M KOH with ammonia–nitrogen concentration from 2.5 µM to 50 µM and from 50 µM to 500 µM; (c,d) fitted curve of currents and ammonia–nitrogen concentrations.
Chemosensors 13 00335 g006
Figure 7. (a) Effects of interferents on the Pt6Ni2Co2-2000 electrode; (b) the stability test for 49 days; (c) the repeatability test for one Pt6Ni2Co2-2000 electrode eight times; and (d) the reproducibility test for eight Pt6Ni2Co2-2000 electrodes.
Chemosensors 13 00335 g007
Disclaimer/Publisher’s Note: The statements, opinions and data contained in all publications are solely those of the individual author(s) and contributor(s) and not of MDPI and/or the editor(s). MDPI and/or the editor(s) disclaim responsibility for any injury to people or property resulting from any ideas, methods, instructions or products referred to in the content.