Abstract
While resistance or tolerance is a highly sought-after trait in new grape varieties, producing such grapes does not guarantee acceptance in the market. The objective of this study was to explore consumers’ appreciation of a novel tolerant table grape variety by integrating chemical, textural, and sensory analyses with near-infrared (NIR) spectroscopy. To achieve this, we developed multivariate prediction models using artificial neural networks (ANNs) that were applied to the spectra of samples subjected to sensory analysis, allowing us to predict their composition. This approach offers a non-destructive way to conduct sensory analysis, as a single NIR spectrum can assess consumer appreciation and identify the chemical and physical characteristics of each berry. For the grape variety tested, we observed a significant favorable consensus among consumers. Therefore, instead of identifying differences, we focused on determining the optimal maturity ranges that enhance consumer appreciation for this variety. Our findings represent a step toward non-destructive sensory analysis; however, further research is still needed to refine this approach.
1. Introduction
Substantial breeding efforts have been undertaken by national breeding institutions and private breeders to develop grape varieties that are disease-resistant or tolerant [1,2]. The goal is to reduce the use of plant protection products in line with national and international efforts toward more sustainable agriculture [3,4]. However, there has been limited research on how these novel varieties are perceived by consumers.Currently, sensory analysis is the primary method used to evaluate taste and other sensory attributes. This method, however, can be influenced by personal biases and is susceptible to random errors, which makes it difficult to interpret results and predict future trends without consistent and reproducible analyses [5]. There are limited options for complementing sensory analysis with other reproducible techniques since the samples used in sensory evaluations are consumed and no longer available for further testing. In this context, non-destructive techniques offer a viable alternative. Techniques like NIR (near-infrared) spectroscopy allow for the collection of spectral data from a sample without altering it [6]. The recorded spectral fingerprints provide both qualitative and quantitative information about the molecules responsible for the sample’s sensory characteristics, such as appearance, texture, taste, and aroma [7]. By applying appropriate chemometric tools to analyze this data, we can gain valuable insights about the sample before it is consumed in a sensory evaluation trial. In this study, we utilized a procedure that integrates the results of sensory analysis with spectroscopic data collected in the NIR region to gain insights into consumer acceptance of a novel table grape. This method enables a comprehensive characterization of each sample prior to ingestion, without altering its composition or appearance. Hundreds of samples were analyzed using conventional analytical techniques, including a texture analyzer [8], a refractometer, an electric conductivity meter, and non-destructive NIR spectroscopy. The spectroscopic data from the large datasets created for each evaluated parameter were then used to build artificial neural network (ANN) prediction models [9,10]. These models were applied to the spectra of the samples that underwent sensory analysis, allowing us to predict their composition. With available data on maturity and texture of each berry used in the sensory analysis step, we were able to identify the textural and flavor combinations preferred by the panel of testers involved in the hedonic analysis performed.
A recent review highlighted that, in studies combining NIR spectroscopy and sensory analysis for quality assessment of food products, the number of samples tested is often quite small, typically fewer than 100. This limited sample size hampers the evaluation of the effectiveness of the procedures described [11]. In contrast, the present research evaluates the applicability of these methods in a real-world scenario, involving hundreds of samples tested through sensory analysis and NIR spectroscopy, in addition to assessing quality parameters using conventional analytical techniques. This approach identifies key quality traits valued by a select panel of consumers; these traits could then be used to establish standards in new grape varieties.
2. Materials and Methods
2.1. Sample Collection
During the 2024 vintage, table grape bunches were collected from companies in the Apulia region (southern Italy) dedicated to the production and supply of table grapes. The new red, seedless variety tested, named “Ursi”, is a late-ripening one (September–October) which was developed in a breeding program carried out at the CREA-VE research center in Turi (southern Italy) [12]. This variety was selected among several varieties produced at the same research center due to its positive reception in a sensory test conducted in 2023, which involved a small group of consumers [13]. According to the harvest time frame of the Ursi variety, large-scale consumer trials were conducted on three different dates: 27 September 2024; 23 October 2024; 19 November 2024. To ensure fresh samples for the tastings, grape bunches were harvested and analyzed using primary methods in the laboratory one or two days prior to the sensory evaluations. Following the analyses, the samples were stored in a controlled atmosphere at 2 °C and 95%relative humidity, which closely resembled conventional storage conditions for table grapes. Even if grapes were harvested at different time points, the dry climate of the 2024 table grape season saw favorable conditions that minimized phytosanitary issues, allowing bunches to remain on the vines for a longer period [14].
2.2. NIR Analysis and Primary Methods
The following procedure was used for the laboratory analyses prior to each of the three testing sessions. Approximately 200 berries were randomly selected from various bunches harvested on the same day. For each berry, both the weight (measured on a digital scale) and the diameter (measured with a caliper) were recorded before conducting the spectrometric analysis. For each berry, a NIR spectrum was acquired using a TANGO FT-NIR spectrophotometer (Bruker, Ettlingen, Germany). The spectra were collected in diffuse reflection mode within a range of 12,000 to 4000 cm−1 (833 to 2500 nm), with a resolution of 8 cm−8 and 64 scans. After acquiring the NIR spectra, approximately 150 berries to be used in the sensory analysis over the next 1 to 2 days were immediately stored in a controlled atmosphere at 2°C and 95% relative humidity. From the remaining berries, a subset (approximately 40) was devoted to destructive primary methods analysis. In particular, on 20 berries, we measured total soluble solids (TSS in °Brix) and titratable acidity (TA as tartaric acid, g/L) in triplicate at 25 °C using a digital refractometer (Pocket Brix-Acidity Meter (Grape and Wine) PAL-BX|ACID2 Master Kit, Atago Co., Ltd., Tokyo, Japan). These berries were then discarded. Another set of around 20 berries was used for the destructive texture analysis, which was conducted with an XforceP texture analyzer (Zwick/Roell GmbH & Co., Ltd., Ulm, Germany) using the testXpert II software package (version 3.31, Zwick/Roell, Ulm, Germany), as previously described [15]. Specifically, a double compression test was performed: berries were placed on a metal base (first probe) and compressed using a 35 mm P/35 flat cylindrical probe (Stable Micro Systems) (second probe), under 20% deformation, with a waiting time between the two compressions of 2 s and a test speed of 1 mm/s. The software automatically calculated the hardness in Newtons (N).
Due to the extensive number of samples to be analyzed in a short timeframe, particularly with hundreds of berries analyzed just days before sensory analysis, we decreased the number of samples allocated to the primary method analyses. Anyway, since a small sample size (around 20 for each parameter investigated) is inadequate to build reliable models, we took advantage of the NIR technique’s ability to utilize just a limited number of samples each year to update a previously developed model [16]. We combined the spectra recorded in 2024 with those collected in the previous year (2023) on the same variety grown in the same fields and used this data as the dataset for the ANN model’s setup.
2.3. Statistical Analysis
The spectra were exported from the OPUS/QUANT software version 2.0 (Bruker Optik GmbH, Ettlingen, Germany) to R Statistical Software (v 4.4.2; R Core Team 2024) [17]. The statistical procedures described in the following paragraphs, including the analysis of variance at a 95% significance level (p-value < 0.05) for the chemical data and pre-treatments of the original NIR spectra were performed using the R packages listed here in alphabetical order: caret [18], chillR [19], corrplot [20], ggplot2 [21], keras [22], mdatools [23], Metrics [24], prospectr [25], randomForest [26], and SimDesign [27]. Excel (Supplementary Materials) spreadsheets containing the raw NIR spectra from the sensory analysis, alongside measured and predicted parameters (TA, TSS, H, diameter and weight) are provided.
2.4. Sensory Analysis
Consumers were recruited during three public events held in Italy in 2024.One dedicated to the public audience (European Researchers’ Night 2024, Demonstration event “Grape tasting and artificial intelligence for non-destructive sensory analysis” 27 September 2024, Bari, Italy; https://www.sharper-night.it/evento/degustazione-di-uva-e-intelligenza-artificiale-per-una-analisi-sensoriale-non-distruttiva/ accessed on 21 April 2025), one focused on table grape producers and vendors but also open to the general public (LUV—Table Grape Fair, 22–24 October 2024, Stand of CREA research center, Bari, Italy; https://luvfiera.com/, accessed on 21 April 2025), and another one on the occasion of CREA Viticulture and Enology open day for students, industry experts, researchers, and stakeholders (CREA-VE, 19 November 2024, Turi, Italy; https://www.crea.gov.it/en/-/open-days-crea-il-centro-di-viticoltura-ed-enologia-incontra-il-territorio, accessed on 21 April 2025). All testers were residents in Apulia region (southern Italy).Recruitment criteria included the following: (1) participants must not have any self-reported allergies or adverse reactions to grapes or grape-derived products; (2) participants should not have any physiological or medical conditions that could affect their performance in the sensory evaluation; (3) participants must report having consumed table grapes. All tests were conducted anonymously. Each taster was given two randomly chosen berries, each labeled with specific numbers for identification purposes. They were then asked to rate each berry on a 9-point hedonic scale, where 1 means “dislike extremely” and 9 means “like extremely”. The 9-point hedonic scale was chosen since it is the most commonly used tool for measuring food acceptability [28]. To help explain the scale, images and labels were provided. For the kids’ sensory evaluation, a simpler scale was used, with each number accompanied by a face depicting the corresponding meaning. Additionally, we obtained signed agreements from parents for each child before administering the grapes. Hedonic scales are commonly utilized in consumer research for preference mapping studies to capture liking scores [29]. Before the test, each panelist was informed about the overall project, and further explanations about the scaling systems were provided upon request.
3. Results
3.1. Primary Analyses
Data concerning texture and main maturity parameters for each testing event are shown in Table 1. Statistical differences were assessed with an ANOVA followed by Tukey’s HSD test.

Table 1.
Maturity parameters for grapes in the three different testing sessions.
The berries collected from the three tests showed maturity levels above the minimum required for grape commercialization (16 °Brix) [30]. Berries from the first set exhibit a smaller diameter and slightly lower sugar content, which aligns with their earlier harvest date. In contrast, the slight increase in diameter of the last set harvested resulted in decreased hardness. The texture of grape berries is the result of several interconnected traits [31]. The main texture-related traits that affect overall quality and consumer perception are crunchiness and firmness. Hardness, defined as the force required to produce a specific deformation, is linked to the perceived crunchiness of grape berries [32,33].
Only minor chemical differences were noted among the berries belonging to each set. Therefore, despite variations in harvesting time, the berry remained consistent, indicating that consumers tasted a uniform product across all three tasting events. These data align with the unique climatic conditions of autumn 2024, characterized by low humidity, which allowed the bunches to remain on the vines for an extended period without encountering phytosanitary issues [14].
3.2. Modeling
For the berries used in the sensory analysis, since it is not possible to directly measure hardness, TSS, and TA on them without compromising their integrity, therefore, the texture and maturity parameters were predicted using models developed from the NIR spectra. Several pre-processing techniques were applied to remove noise and enhance relevant variations in the original spectra. The pre-treatments were selected based on their predictive performance for each parameter being investigated. For TSS and Hardness, standard normal variate (SNV) was used, while for TA, SNV was followed by Savitzky–Golay smoothing and first derivative correction (width of the filter window of 33 and a first-order polynomial for smoothing) [34].
Non-linearity is a common characteristic of large spectroscopic databases, arising from complex biological, environmental, and instrumental variations. Therefore, non-linear prediction models have been developed using artificial neural networks (ANNs).
There are several reasons to minimize the number of variables used for training an ANN, like enhancing computational efficiency, reducing redundancy, decreasing noise, and improving the model’s interpretability [35]. Among the various techniques available for reducing the number of variables, we chose the partial least squares (PLS) method, consistent with the approaches taken by other researchers [36] and previous studies conducted by our research group on similar datasets [37]. PLS is a computationally straightforward method that is often combined with NIR spectroscopy. While PLS models are frequently effective for predicting parameters in NIR datasets, non-linear models, such as ANNs, have been shown to outperform PLS models in certain scenarios. This is particularly true when predicting texture-related parameters [15,38]. Therefore, to minimize the number of variables used for training the ANN, we used the wavelengths that corresponded to the statistically significant highest absolute values of β-coefficients extracted from partial least squares models built on the same datasets, as previously described [39]. The wavelengths corresponding to the highest statistically significant (p-value < 0.05) absolute values of these coefficients (429 for TSS, 762 for TA, and 522 for Hardness) were selected as input data to develop the regression models using R software v 4.4.2 [36].
Min–max normalization was applied to the dataset because normalized data typically increases the learning rate and leads to faster convergence of ANNs. This normalization process scaled the input variables to the interval [0, 1]. Using the Kennard–Stone algorithm (Euclidean distance), the entire dataset was divided into a training set comprising 80% of the samples and a test set containing the remaining 20%. The training set was utilized to calculate and optimize the regression models through cross-validation, while the test set was used to assess the predictive ability of the model [37].
In the development and optimization of the multilayer ANN models, a feed-forward fully connected neural network with four layers was utilized (input: hidden: hidden: output) for each of the three parameters. The number of neurons in each layer is reported in Table 2, where “n” represents the numeric vector corresponding to the selected wave numbers.
Table 2.
Structure of ANN models.
Two activation functions were employed in the model. For the input and hidden layers, a Rectified Linear Unit (ReLU) function was used, initialized with He normal initialization, a commonly accepted method for weight initialization with the ReLU activation function. In the output layer, a linear activation function was applied. During the training procedure of the ANN model, the mean absolute error was monitored throughout the training process, using the Adam optimizer and the mean squared error as the loss function. The training was carried out over 1000 epochs, with a batch size of 32 and a validation split of 0.2, meaning that 80% of the data was used for training and 20% was reserved for testing the model.
Each model’s performance on the training and test sets was evaluated using the root mean square error (RMSE), coefficient of determination (R2), bias, and the residual predictive deviation (RPD, which is the ratio of the standard error of performance to the standard deviation), as reported in Table 3.
Table 3.
Prediction performance of ANN models.
The TSS index measures the density (mass/volume) of all soluble solids in a sample. In grapes, the TSS value primarily indicates the sugar content at harvest. As confirmed by results in Table 1, the sugar content in fruits is a parameter that can typically be well-predicted using NIR spectroscopy since sugar molecules contain NIR-active groups and are among the most abundant compounds found in fruits [40].
The density class greatly influences the texture properties of berries. Previous studies have emphasized the importance of sorting berries by density before conducting textural analyses, as berry size affects the force measured during testing. To streamline this process and avoid the time-consuming densimetric sorting, spectral data can be integrated with information about berry shape, density, or size to develop effective prediction models [37]. The simplest procedure involves a normalization of the outcome of the texture analysis using either the diameter or the volume of the berries [32]. To enhance the accuracy and precision of the prediction model for hardness, the dataset used to train the ANN was based on the measured force divided by the diameter (N/mm). The texture analyzer provides diameter measurements along with other parameters. Nevertheless, to ensure consistent measurements, all berries were measured for diameter using a caliper. For the berries consumed in the sensory analysis, the predicted hardness values are then converted into newton by multiplying each predicted value by the measured diameter of the respective berry.
Table 4 reports texture and maturity parameters predicted for the berries used in the sensory analysis. As for the berries analyzed in the laboratory, no strong difference was found among the three sets in terms of maturity and texture parameters. This confirms the homogeneity of the samples tested by consumers in each testing event.
Table 4.
Maturity parameters for grapes used in the sensory analysis.
3.3. Sensory Analysis Outcome
A total of 118 berries were tested during the European Researchers’ Night 2024 (tasters gender percentage: 53% female and 47% male), 154 berries during the Table Grape Fair (gender percentage: 26% female and 74% male), and 113 during CREA-VE open day (gender percentage: 42% female and 58% male) for a total of 385samples devoted to the sensory analysis. Globally, the testers involved were a total of 180 males and 60 females with a mean age of 36.7±21.8. The outcome of the sensory analyses is reported in Table 5.
Table 5.
Sensory analysis outcome.
The hedonic tasting scores were generally high, with an average liking score of 8 ± 1 across the three testing sessions. There was no significant difference in ratings based on the gender of the tasters. A product that achieves a score of 7 or higher on a nine-point scale can be confidently considered a strong example of ‘target’ quality [29]. Based on this criterion, the grapes harvested during the selected time frame for this research can be considered as a reference that realistically illustrates the sensory quality reflective of consumer acceptance. This is particularly important, as the proper harvest time is vital for non-climacteric fruits like grapes [41].
The numerosity of the berries achieving different votes differed greatly: just one berry was rated 2, three were rated 3, four were rated 4, 22 were rated 5, 39 were rated 6, 89 were rated 7, 117 were rated 8, and 110 were rated 9.To avoid the use of unbalanced classes for the classification step, we used only the berries which were scored 7 to 9. A split of the dataset was performed using 60 berries of each class to build the classification model; the rest of the samples were used as an external test set to check for the accuracy of the classification (Table 6). Several classification algorithms were tested: Linear Discriminant Analysis, Classification and Regression Trees, k-Nearest Neighbors, Support Vector Machines, and Random Forest. Linear Discriminant Analysis (LDA) was chosen as being the one with the highest accuracy. The LDA model allowed us to achieve only a 50% accuracy on the external dataset, with a better prediction towards 8 and 9 scores (balanced accuracy for score 7 is 0.55473, for score 8 is 0.5915, and for score 9 is 0.5913).
Table 6.
Confusion matrix.
The low accuracy of the classification is in line with the weak correlation between spectral wavelength intensities and sensory scores. Indeed, a Pearson correlation analysis revealed a positive correlation of only 0.1 between sensory analysis scores and 79 selected wavelengths in the range of 8800–9900 cm−1 (Figure 1).
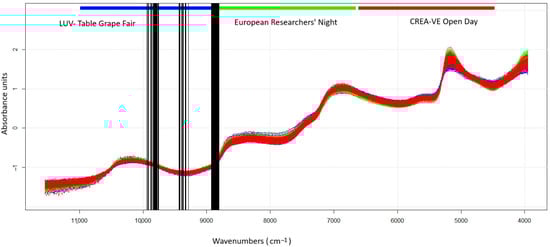
Figure 1.
SNV normalized NIR spectra and wavelengthcorrelated to sensory scores (in black).
4. Discussion
In this work, we focused our investigation on one table grape variety, obtained through a long selection process among improved table grape varieties. A broad range of consumers have tasted this variety during various public events, consistently showing a high level of appreciation. The slight differences in basic maturity parameters, mainly due to different harvesting times, did not influence the largely positive feedback, which was uniform across gender and age demographics.
Our findings show that while it is possible to predict several parameters with a non-destructive technique, it is challenging to attribute consumer “liking” solely to the predicted chemical parameters (such as TSS or TA) or physical attributes (like appearance or texture), without a throughout sensory evaluation of the product. This was particularly true for the samples examined in our study, which did not exhibit notable variations in composition and texture, and overwhelmingly positive scores in the sensory analysis. The homogeneous outcome of the sensory analysis, alongside the lack of distinct differences in berry composition, made it difficult to classify the berries into categories of differing consumer preferences.
To explore the differences among the highly rated berries, we conducted a classification. The outcome showed only 0.5% accuracy. The misclassified samples confirm that consumer appreciation is influenced not just by measurable parameters but also by intangible factors such as personal beliefs and eating habits. Thus, the combination of sensory analysis and chemometric methods, rather than just predicting scores, proves to be a useful approach for identifying the optimal maturity parameter ranges that ensure consumer appreciation for novel varieties. Indeed, the appreciation shown for the tested variety indicates how this variety, harvested with parameters in line with those reported in this article, *-could be a good choice for vine growers seeking a resistant grapevine.
This method could be applied to other novel varieties to gather information on the maturity and textural ranges that would ensure appreciation of a specific variety for a target panel.
Supplementary Materials
The following supporting information can be downloaded at: https://www.mdpi.com/article/10.3390/chemosensors13070238/s1. Excel spreadsheets: Raw NIR spectra from the sensory analysis, alongside measured and predicted parameters (TA, TSS, H, diameter and weight).
Author Contributions
Conceptualization, T.B.; data curation, T.B.; formal analysis, T.B. and L.R.F.; funding acquisition, R.P.; project administration, R.P.; resources, R.P.; software, T.B.; writing—original draft, T.B.; writing—review and editing, L.R.F. and R.P. All authors have read and agreed to the published version of the manuscript.
Funding
This research was funded by VALNUVAUT—Valutazione di Nuove varietà di uve da tavola ottenute in Puglia—(Bando PSR 2014–2020, Misura 16, Sottomisura 16.2, Determina n. 501 del 23.12.2019).
Institutional Review Board Statement
Ethical review and approval were waived for this study since studies falls in the Exemption Category: 45 CFR 46.104(d)(2)—Research involving the use of educational tests (cognitive, diagnostic, aptitude, achievement), survey procedures, interview procedures, or observation of public behavior, unless information obtained is recorded in such a manner that human subjects can be identified.
Informed Consent Statement
Written or oral consent was obtained from all subjects involved in the study.
Data Availability Statement
A dataset comprising original NIR spectra of samples (no pre-treatments) from the sensory analysis, alongside measured and predicted parameters for those berries (TA, TSS, H, diameter, and weight), is provided. Further requests for original 0.001 data from the TANGO Bruker spectrometer can be made upon request.
Acknowledgments
The authors acknowledge the technical support of Giuseppe Di Pierro.
Conflicts of Interest
The authors declare no conflicts of interest. The funders had no role in the design of the study; in the collection, analyses, or interpretation of data; in the writing of the manuscript; or in the decision to publish the results.
References
- Trapp, O.; Avia, K.; Borrelli, C.; Eibach, R.; Merdinoglu, D.; Töpfer, R. More sustainability in Europe’s vineyards—Using resistant grapevine varieties to reduce the input of pesticides. Plants People Planet 2025, 1–8. [Google Scholar] [CrossRef]
- Eibach, R.; Töpfer, R. Chaper 1 Traditional grapevine breeding techniques. In Grapevine Breeding Programs for the Wine Industry; Reynolds, A.G., Ed.; Elsevier Science: Burlington, ON, Canada, 2015; Volume 286, pp. 3–22. [Google Scholar]
- European Commission. Farm to Fork Strategy. 2020. Available online: https://food.ec.europa.eu/system/files/2020-05/f2f_action-plan_2020_strategy-info_en.pdf (accessed on 21 April 2025).
- Eurostat. The Use of Plant Protection Products in the European Union. Data 1992–2003, Euopean Union. 2007. Available online: https://ec.europa.eu/eurostat/documents/3217494/5611788/KS-76-06-669-EN.PDF.pdf/36c156f1-9fa9-4243-9bd3-f4c7c3c8286a?t=1414769021000 (accessed on 21 April 2025).
- Chapman, J.; Elbourne, A.; Khanh Truong, V.; Newman, L.; Gangadoo, S.; Rajapaksha Pathirannahalage, P.; Cheeseman, S.; Cozzolino, D. Sensomics—From conventional to functional NIR spectroscopy- Shining light over the aroma and taste of foods. Trends Food Sci. Technol. 2019, 91, 274–281. [Google Scholar] [CrossRef]
- Siesler, H.W. Near-Infrared Spectra, Interpretation. In Encyclopedia of Spectroscopy and Spectrometry, 3rd ed.; Lindon, J.C., Tranter, G.E., Koppenaal, D.W., Eds.; Academic Press: San Diego, CA, USA, 2017; pp. 30–39. [Google Scholar] [CrossRef]
- Cozzolino, D.; Roumeliotis, S.; Eglinton, J. Exploring the use of near infrared (NIR) reflectance spectroscopy to predict starch pasting properties in whole grain barley. Food Biophys. 2013, 8, 256–261. [Google Scholar] [CrossRef]
- Rolle, L.; Siret, R.; Segade, S.R.; Maury, C.; Gerbi, V.; Jourjon, F. Instrumental texture analysis parameters as markers of table-grape and winegrape quality: A review. Am. J. Enol. Vitic. 2012, 63, 11–28. [Google Scholar] [CrossRef]
- Huang, Y.; Kangas, L.J.; Rasco, B.A. Applications of artificial neural networks (ANNs) in food science. Crit. Rev. Food Sci. Nutr. 2007, 47, 113–126. [Google Scholar] [CrossRef]
- Lin, Y.; Ma, J.; Wang, Q.; Sun, D.W. Applications of machine learning techniques for enhancing non destructive food quality and safety detection. Crit. Rev. Food Sci. Nutr. 2023, 63, 1649–1669. [Google Scholar] [CrossRef]
- Basile, T.; Mallardi, D.; Cardone, M.F. Spectroscopy, a Tool for the Non-Destructive Sensory Analysis of Plant-Based Foods and Beverages: A Comprehensive Review. Chemosensors 2023, 11, 579. [Google Scholar] [CrossRef]
- Valnuvaut Project, Ursi Grape Description. Available online: https://www.valnuvaut.it/wp-content/uploads/2022/09/URSI-RS.pdf (accessed on 21 April 2025).
- Basile, T.; Forleo, L.R.; Mallardi, D.; Ferrulli, F.; Cardone, M.F.; Coletta, A.; Perniola, R. Are my kids going to eat it? Sensory analysis mediated by spectroscopic data to predict adolescent food choices. BIO Web Conf. 2023, 68, 04005. [Google Scholar] [CrossRef]
- Italian Institute of Services for the Agricultural Food Market (ISMEA) Report Based on Data Collected by the Italian National Institute of Statistics (Istat). Available online: https://www.uvadatavola.com/wp-content/uploads/2024/11/Tendenze_FRUTTA_Uvedatavola_211024__1_.pdf?_gl=1*uamx3x*_up*MQ..*_ga*MTU1Mzk5MDc5MS4xNzMyMjAwNDM1*_ga_0N9PWV8751*MTczMjIwMDQzNC4xLjEuMTczMjIwMDcyMi4wLjAuMA (accessed on 21 April 2025).
- Basile, T.; Marsico, A.D.; Perniola, R. NIR Analysis of Intact Grape Berries: Chemical and Physical Properties Prediction Using Multivariate Analysis. Foods 2021, 10, 113. [Google Scholar] [CrossRef]
- Zhao, X.; Zhao, X.; Huang, M.; Zhu, Q. An uncertainty sampling strategy based model updating method for soluble solid content and firmness prediction of apples from different years. Chemom. Intell. Lab. Syst. 2021, 217, 104426. [Google Scholar] [CrossRef]
- R Core Team. R: A Language and Environment for Statistical Computing, R Version 4.4.2; R Foundation for Statistical Computing: Vienna, Austria, 2020; Available online: https://www.R-project.org/ (accessed on 1 January 2025).
- Kuhn, M. Building Predictive Models in R Using the caret Package. J. Stat. Softw. 2008, 28, 1–26. [Google Scholar] [CrossRef]
- Luedeling, E. Package “chillR”, Version 0.72.2; Title Statistical Methods for Phenology Analysis in Temperate Fruit Trees; 6 January 2021. Available online: https://cran.r-project.org/web/packages/chillR/chillR.pdf (accessed on 1 January 2025).
- Wei, T.; Simko, V. R Package ‘Corrplot’, Visualization of a Correlation Matrix (Version 0.95); 2024. Available online: https://github.com/taiyun/corrplot (accessed on 1 January 2025).
- Wickham, H.; Chang, W.; Henry, L.; Pedersen, T.L.; Takahashi, K.; Wilke, C.; Woo, K.; Yutani, H.; Dunnington, D. Package “ggplot2”, Version 3.3.3; Title Create Elegant Data Visualisations Using the Grammar of Graphics; 30 December 2020. Available online: https://cran.r-project.org/web/packages/ggplot2/ggplot2.pdf (accessed on 1 January 2025).
- Falbel, D.; Allaire, J.J.; Chollet, F.; Tang, Y.; Van Der Bijl, W.; Studer, M.; Keydana, S. Package “keras”, Version 2.4.0; Title R Interface to “Keras”; 29 March 2021. Available online: https://cran.r-project.org/web/packages/keras/keras.pdf (accessed on 1 January 2025).
- Kucheryavskiy, S. mdatools—R package for chemometrics. Chemom. Intell. Lab. Syst. 2020, 198, 103937. [Google Scholar] [CrossRef]
- Hamner, B.; Frasco, M.; Le Dell, E. Package “Metrics’, Version 0.1.4; Title Evaluation Metrics for Machine Learning; 9 July 2018. Available online: https://cran.r-project.org/web/packages/Metrics/Metrics.pdf (accessed on 1 January 2025).
- Stevens, A.; Ramirez-Lopez, L. An Introduction to the Prospectr Package: R Package Vignette R Package Version 0.2.1. 2020. Available online: https://cran.r-project.org/web/packages/prospectr/vignettes/prospectr.html (accessed on 1 January 2025).
- Liaw, A.; Wiener, M. Classification and Regression by random Forest. R News 2002, 2, 18–22. [Google Scholar]
- Chalmers, P.; Sigal, M.; Oguzhan, O. Package “SimDesign”, Version 2.3; Title Structure for Organizing Monte Carlo Simulation Designs, 7 April 2021. Available online: https://cran.csiro.au/web/packages/SimDesign/SimDesign.pdf (accessed on 1 January 2025).
- Peryam, D.R.; Girardot, N.F. Advanced taste method. J. Food Eng. 1952, 24, 58–61. [Google Scholar]
- Everitt, M. Chapter 8—Consumer-Targeted Sensory Quality. In Global Issues in Food Science and Technology; Barbosa-Cánovas, G., Mortimer, A., Lineback, D., Spiess, W., Buckle, K., Colonna, P., Eds.; Academic Press: San Diego, CA, USA, 2009; pp. 117–128. [Google Scholar] [CrossRef]
- OIV Standard on Minimum Maturity Requirements for Table Grapes. RESOLUTION VITI 1/2008. Available online: https://www.oiv.int/node/3475#:~:text=Grapes%20with%20a%20Brix%20degree%20equal%20to%20or,the%20sugar%2Facid%20ratio%20are%20possible%20for%20particular%20varieties (accessed on 16 May 2025).
- Lin, M.; Sun, L.; Liu, X.; Fan, X.; Zhang, Y.; Jiang, J.; Liu, C. Genome-Wide Association Study of Grape Texture Based on Puncture. Int. J. Mol. Sci. 2024, 25, 13065. [Google Scholar] [CrossRef]
- Crespan, M.; Migliaro, D.; Vezzulli, S.; Zenoni, S.; Tornielli, G.B.; Giacosa, S.; Paissoni, M.A.; Segade, S.R.; Rolle, L. A major QTL is associated with berry grape texture characteristics. OENO One 2021, 55, 183–206. [Google Scholar] [CrossRef]
- Giacosa, S.; Zeppa, G.; Baiano, A.; Torchio, F.; Segade, S.R.; Gerbi, V.; Rolle, L. Assessment of sensory firmness and crunchiness of table grapes by acoustic and mechanical properties. Aust. J. Grape Wine Res. 2015, 21, 213–225. [Google Scholar] [CrossRef]
- Gorry, P.A. General least-squares smoothing and differentiation by the convolution (Savitzky-Golay) method. Anal. Chem. 1990, 62, 570–573. [Google Scholar] [CrossRef]
- May, R.J.; Maier, H.R.; Dandy, G.C.; Fernando, T.M.K.G. Non-linear variable selection for artificial neural networks using partial mutual information. Environ. Model. Softw. 2008, 23, 1312–1326. [Google Scholar] [CrossRef]
- Martelo-Vidal, M.J.; Vazquez, M. Application of artificial neural networks coupled to UV–VIS–NIR spectroscopy for the rapid quantification of wine compounds in aqueous mixtures. CyTA J. Food 2014, 13, 32–39. [Google Scholar] [CrossRef]
- Basile, T.; Marsico, A.D.; Perniola, R. Use of Artificial Neural Networks and NIR Spectroscopy for Non-Destructive Grape Texture Prediction. Foods 2022, 11, 281. [Google Scholar] [CrossRef] [PubMed]
- Boeriu, C.G.; Stolle-Smits, T.; van Dijk, C. Characterisation of cell wall pectins by near infrared spectroscopy. J. Near Infrared Spectrosc. 1998, 6, A299–A301. [Google Scholar] [CrossRef]
- Gestal, M.; Gómez-Carracedo, M.P.; Andrade, J.M.; Dorado, J.; Fernández, E.; Prada, D.; Pazos, A. Classification of apple beverages using artificial neural networks with previous variable selection. Anal. Chim. Acta 2004, 524, 225–234. [Google Scholar] [CrossRef]
- Alves de Oliveira, G.; de Castilhos, F.; Renard, C.M.-G.C.; Bureau, S. Comparison of NIR and MIR spectroscopic methods for determination of individual sugars, organic acids and carotenoids in passion fruit. Food Res. Int. 2014, 60, 154–162. [Google Scholar] [CrossRef]
- Basile, T.; Marsico, A.D.; Cardone, M.F.; Antonacci, D.; Perniola, R. FT-NIR Analysis of Intact Table Grape Berries to Understand Consumer Preference Driving Factors. Foods 2020, 9, 98. [Google Scholar] [CrossRef]

Disclaimer/Publisher’s Note: The statements, opinions and data contained in all publications are solely those of the individual author(s) and contributor(s) and not of MDPI and/or the editor(s). MDPI and/or the editor(s) disclaim responsibility for any injury to people or property resulting from any ideas, methods, instructions or products referred to in the content. |
© 2025 by the authors. Licensee MDPI, Basel, Switzerland. This article is an open access article distributed under the terms and conditions of the Creative Commons Attribution (CC BY) license (https://creativecommons.org/licenses/by/4.0/).