A Sensitive Epinephrine Sensor Based on Photochemically Synthesized Gold Nanoparticles


Abstract

1. Introduction
2. Materials and Methods
2.1. Materials
2.2. Instruments
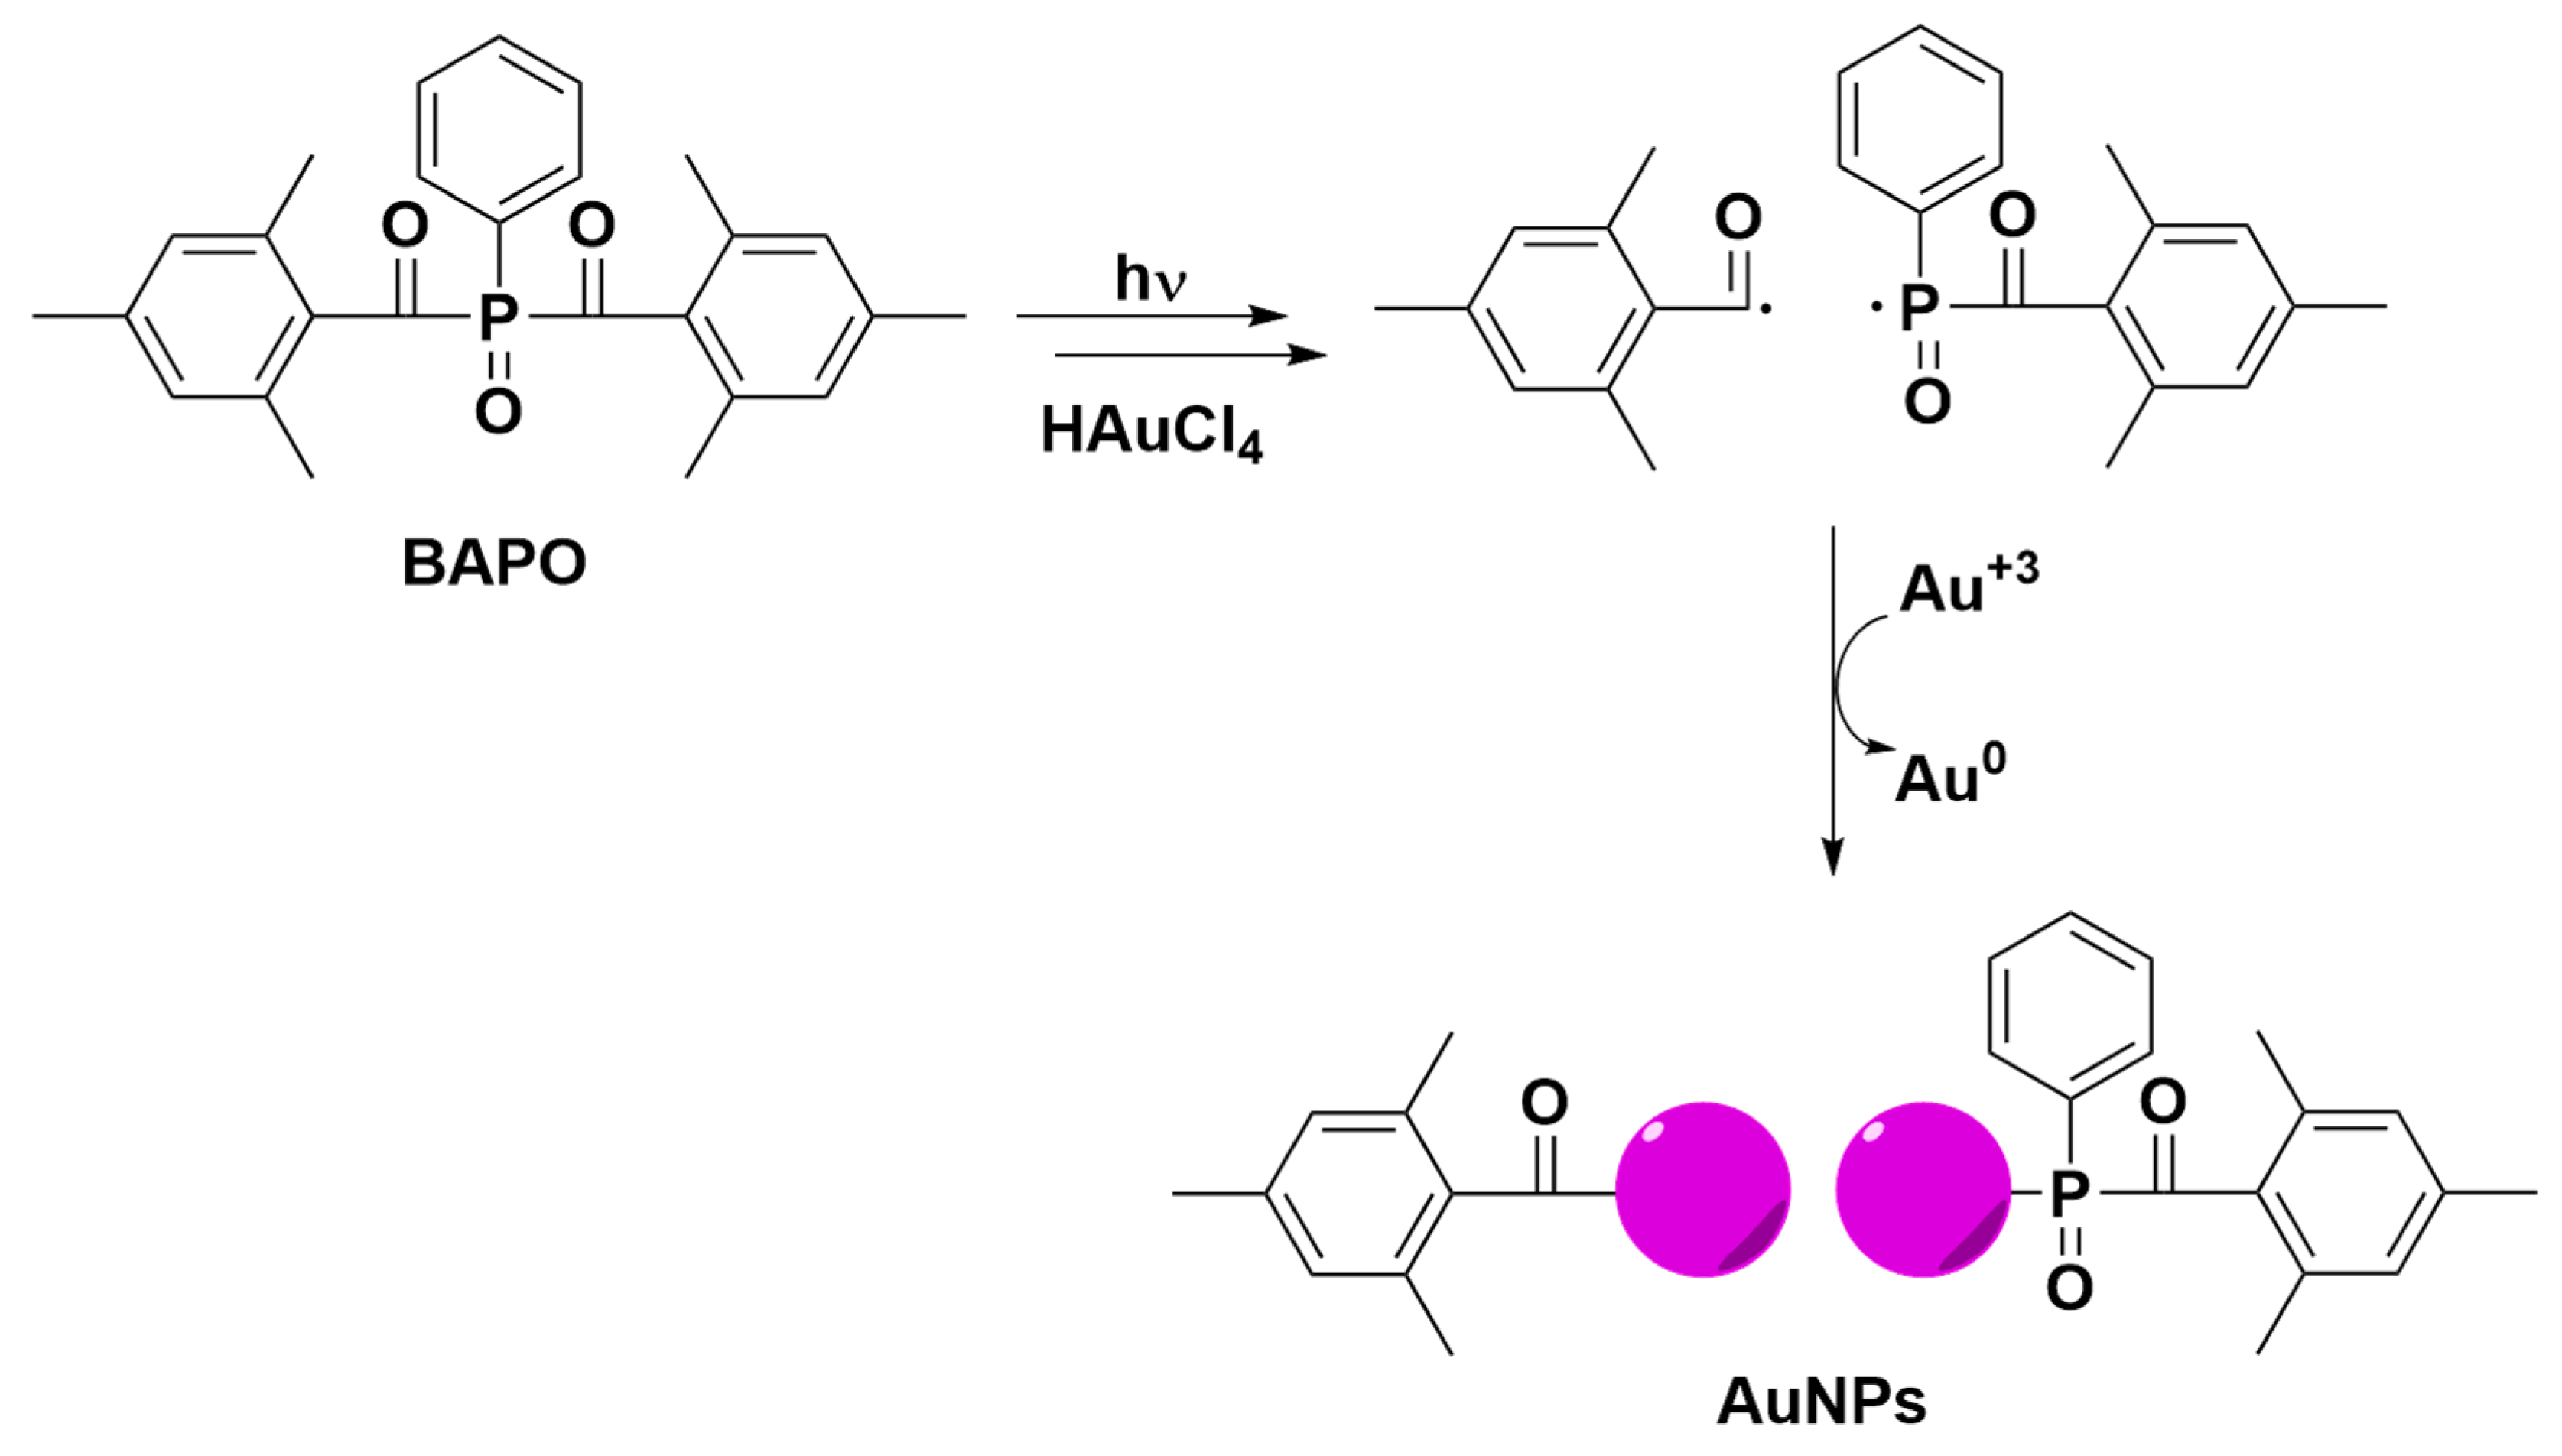
2.3. Photochemical Preparation of AuNPs and AuNPs@GO
2.4. Preparation of Epinephrine and Detection Solutions
2.5. UV-Vis and Fluorescence Spectroscopy Studies
2.6. LOD and LOQ Calculations
3. Results and Discussion
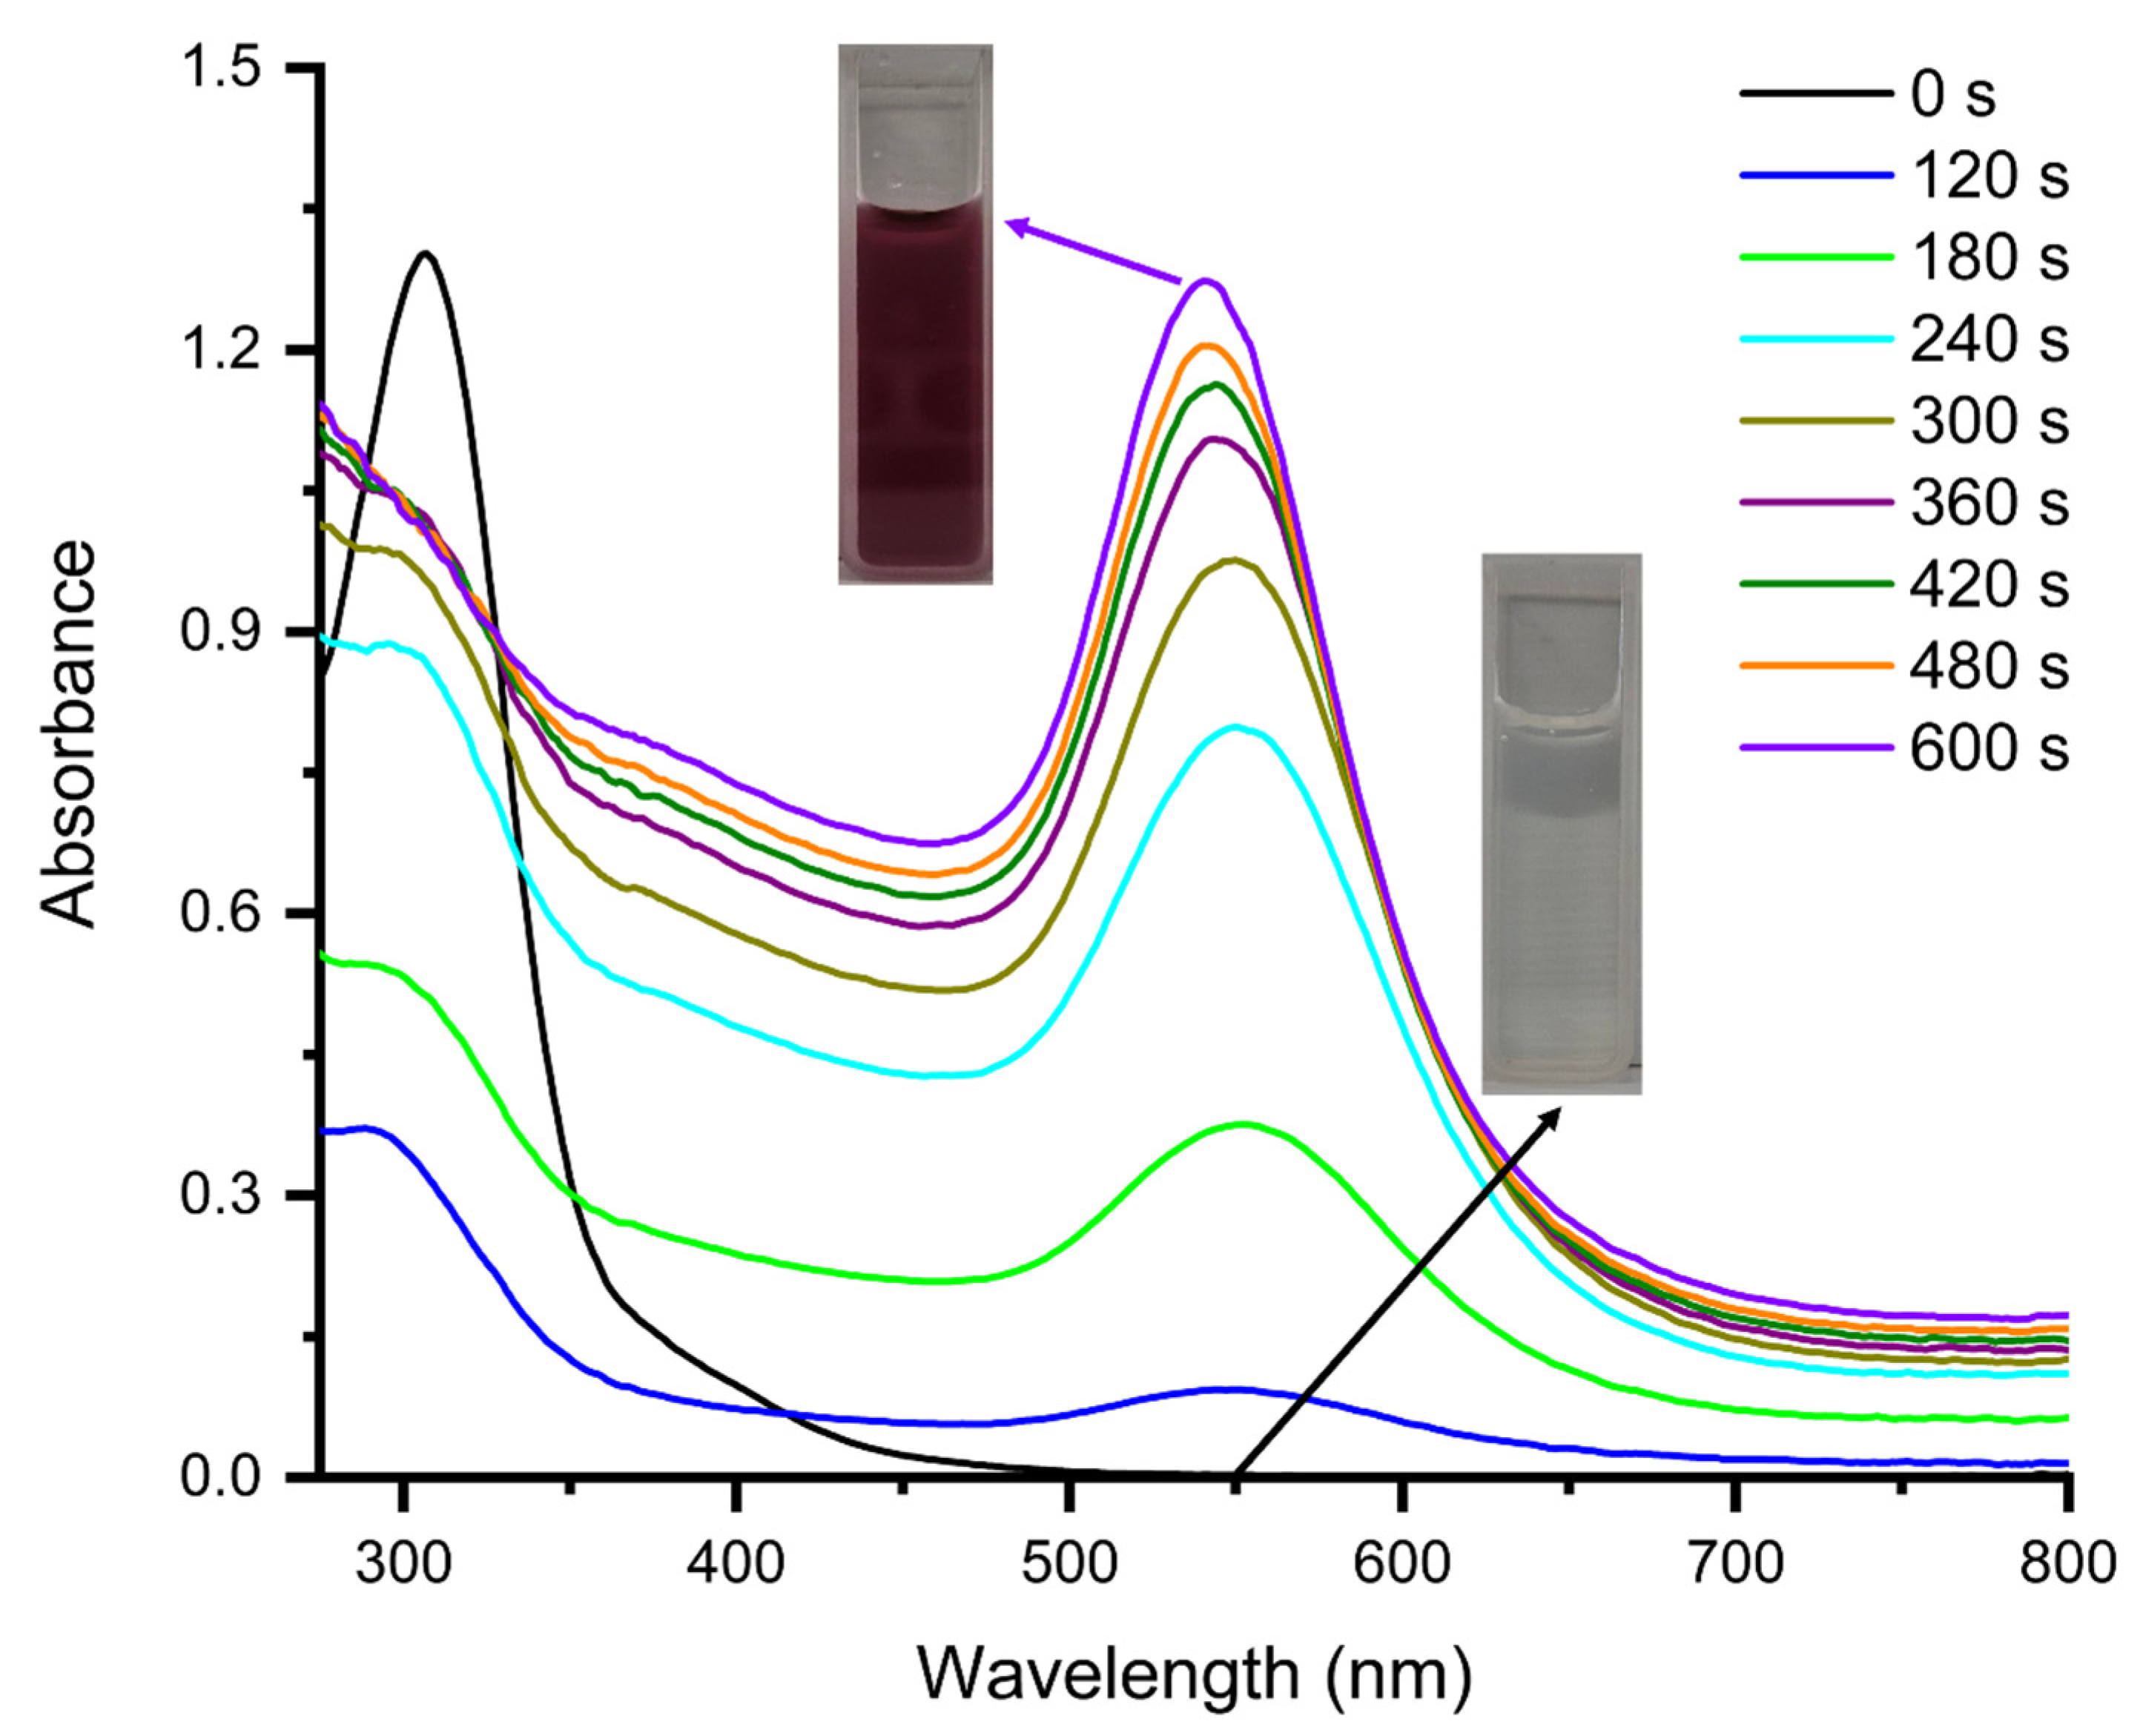
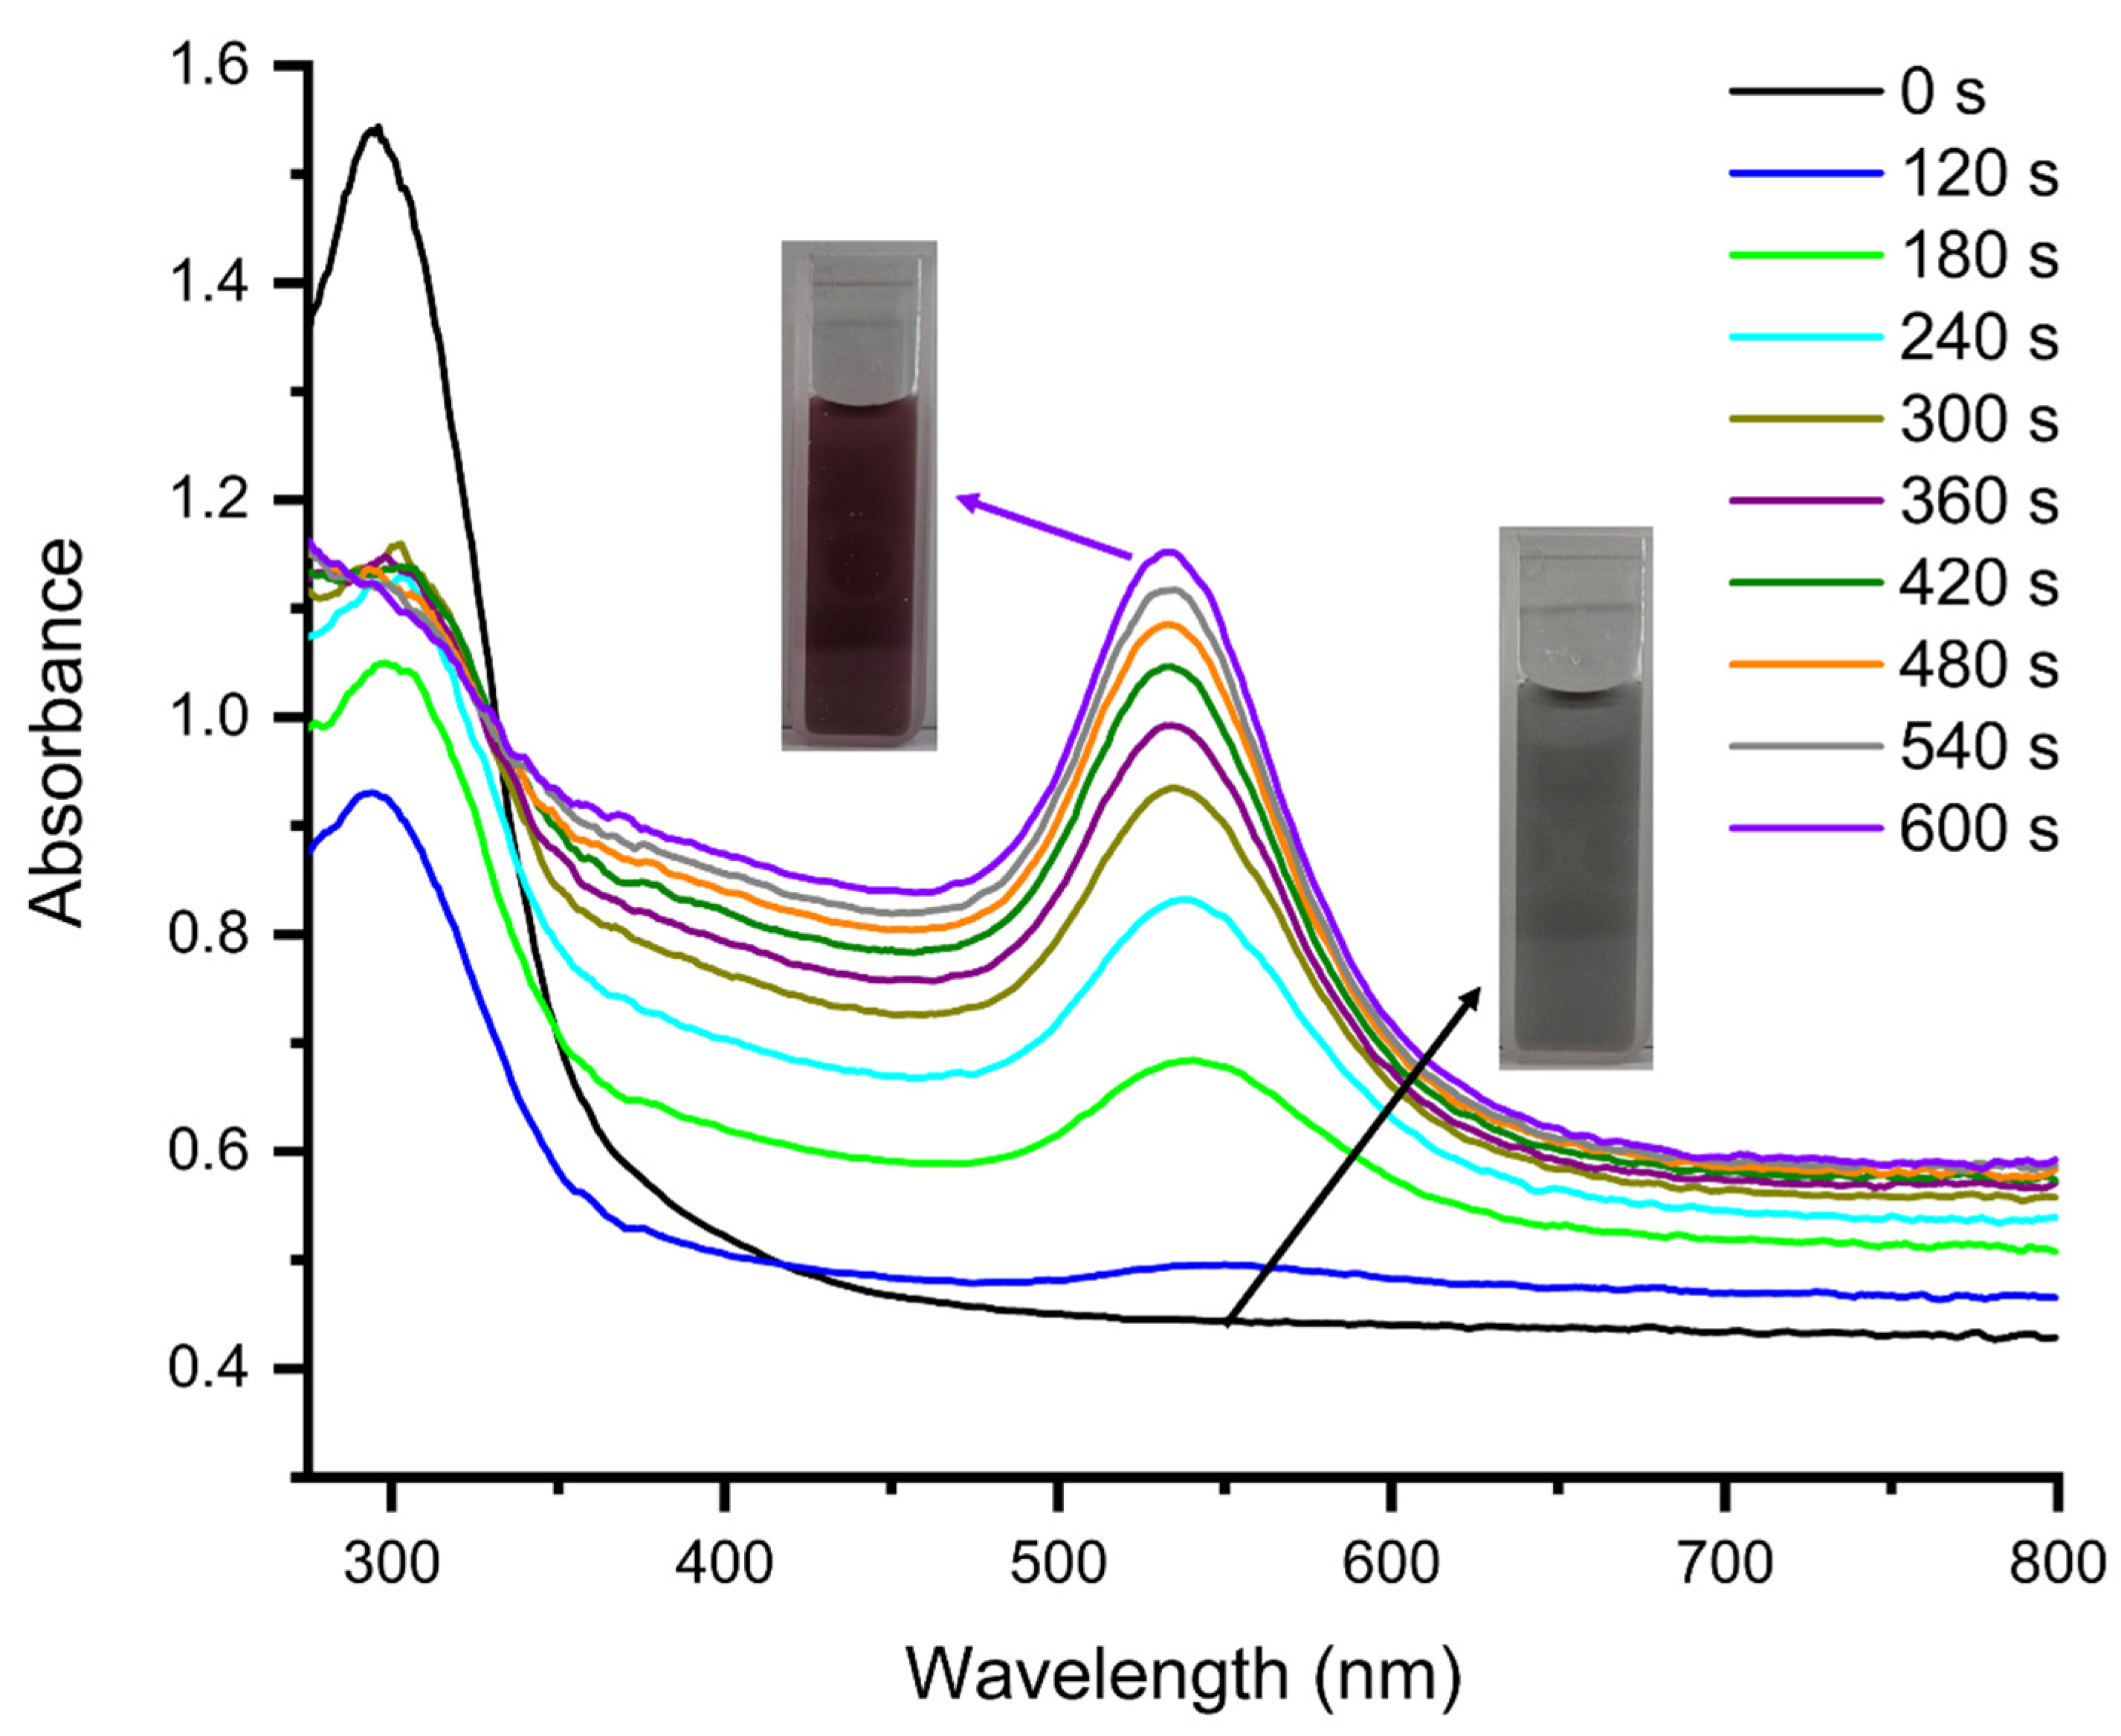
3.1. Photochemical Preparation of AuNPs and AuNPs@GO in Aqueous Media
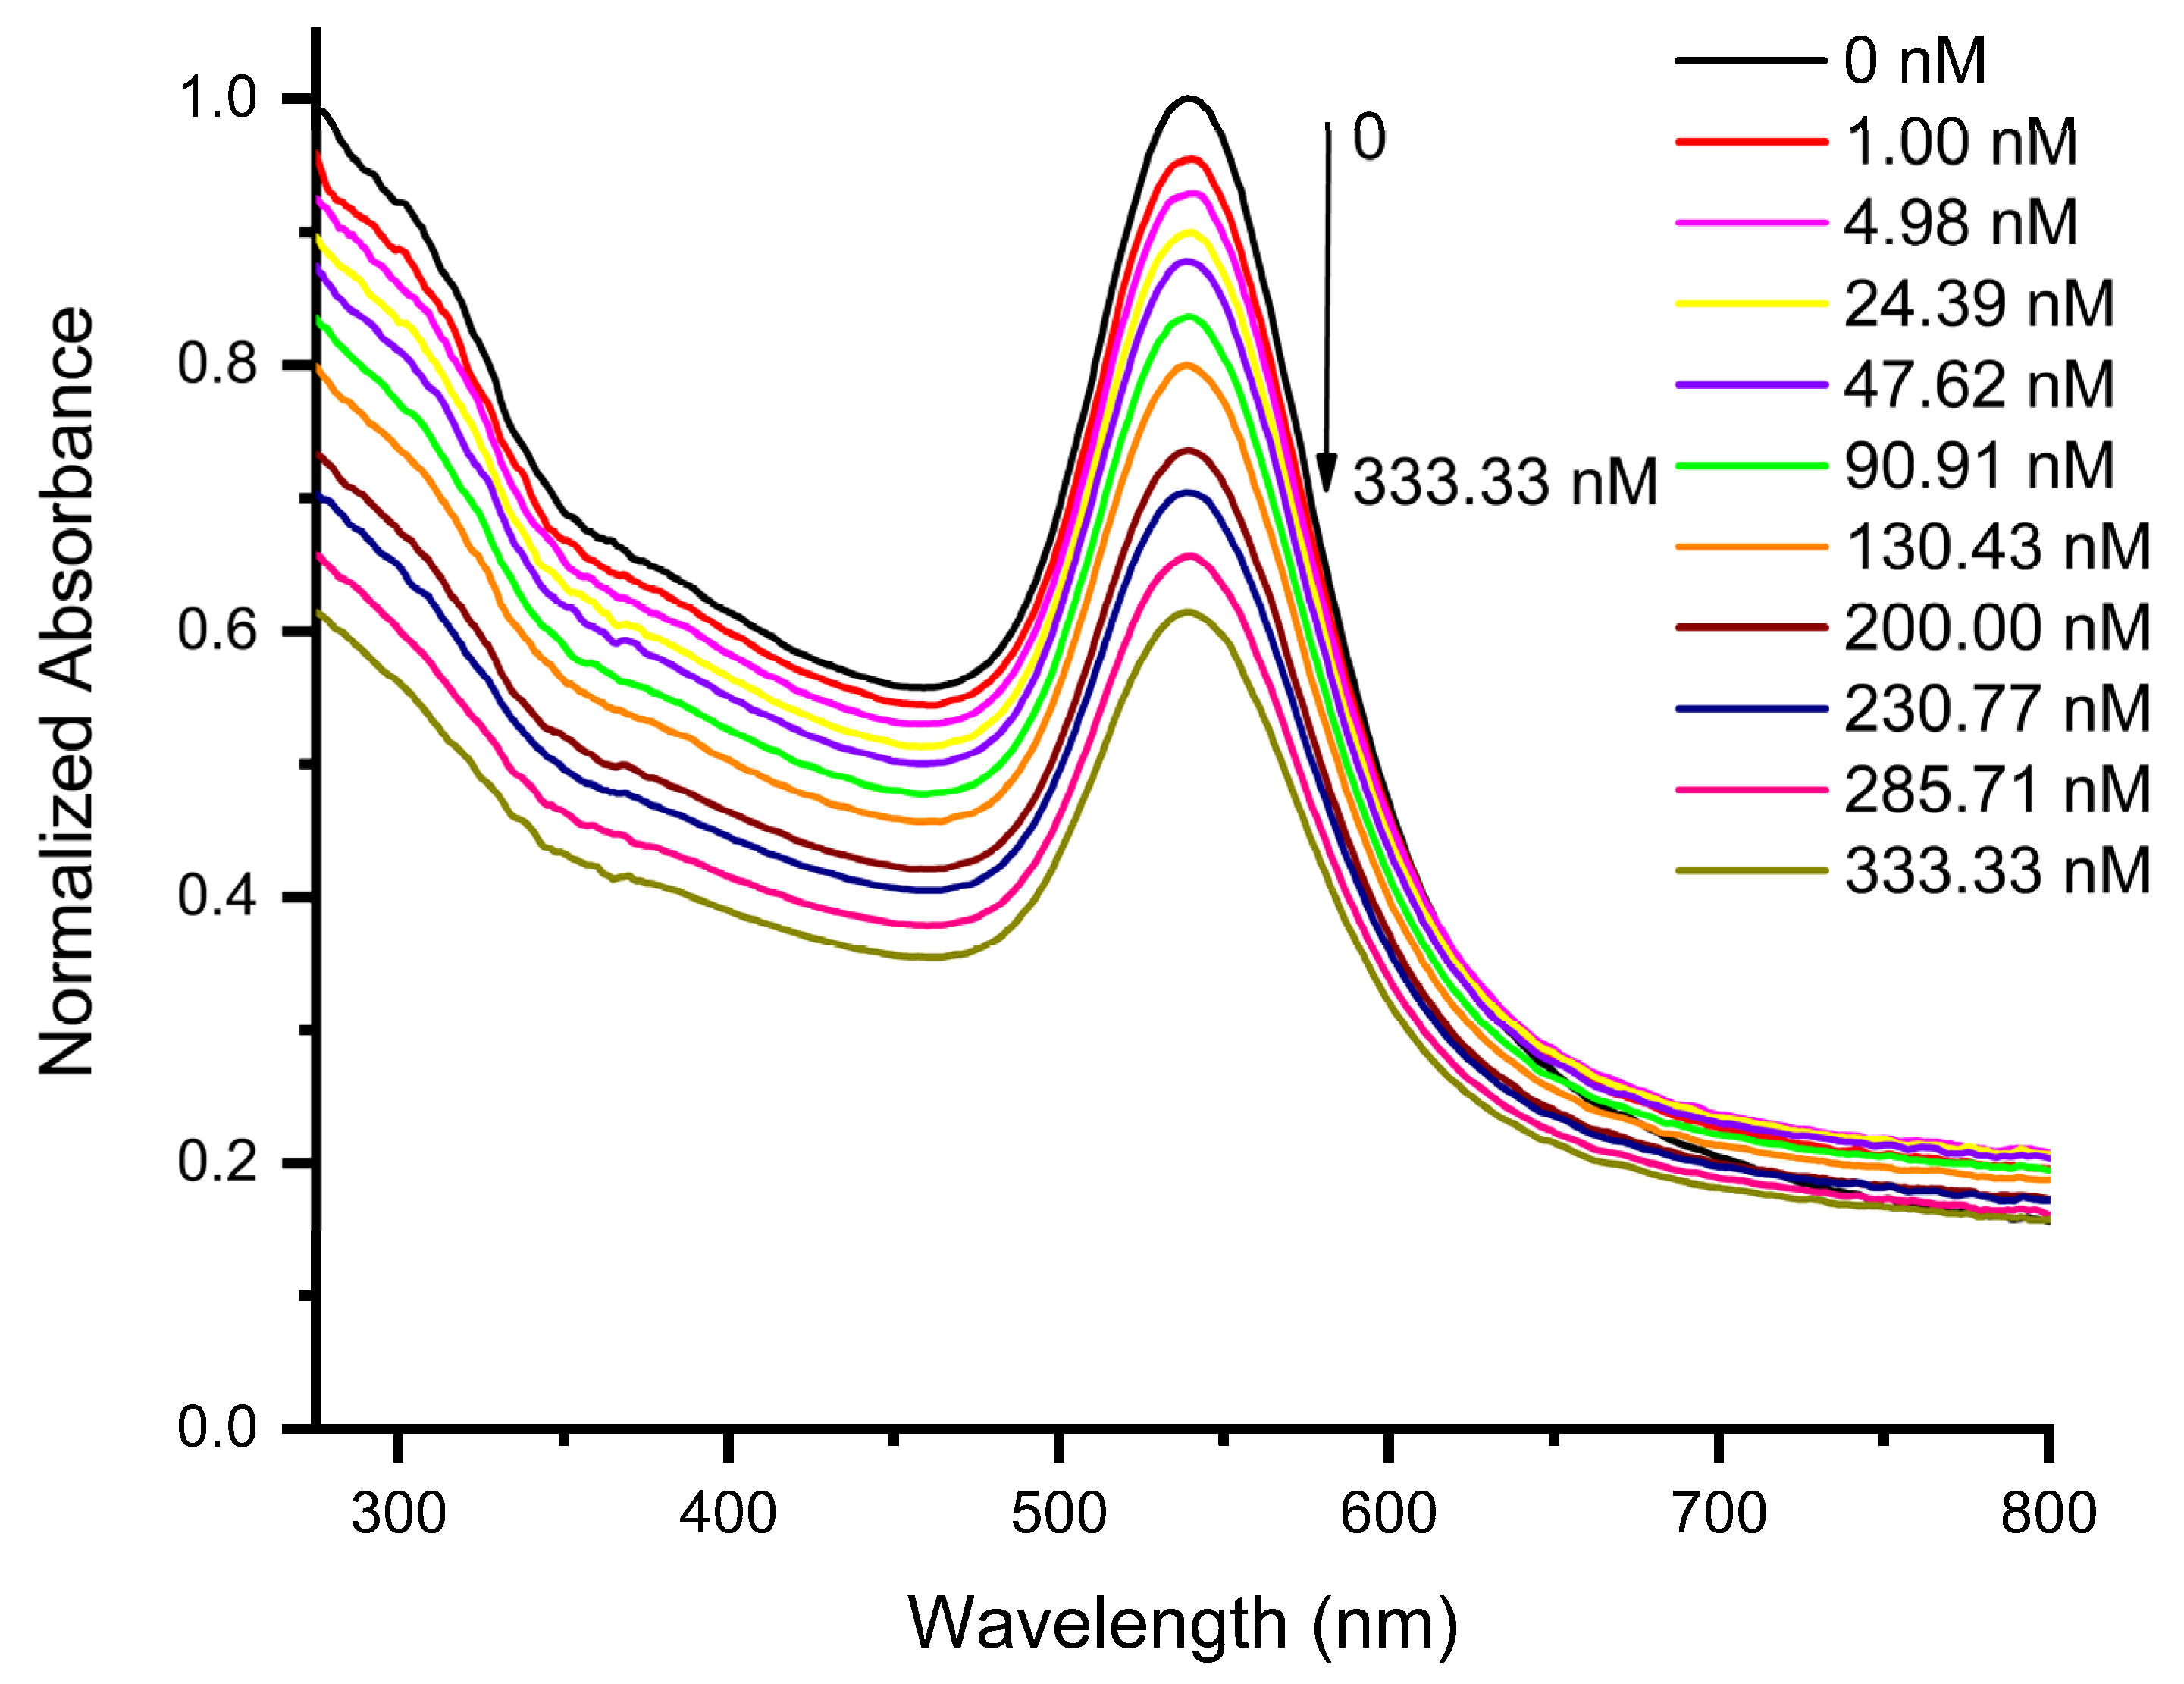
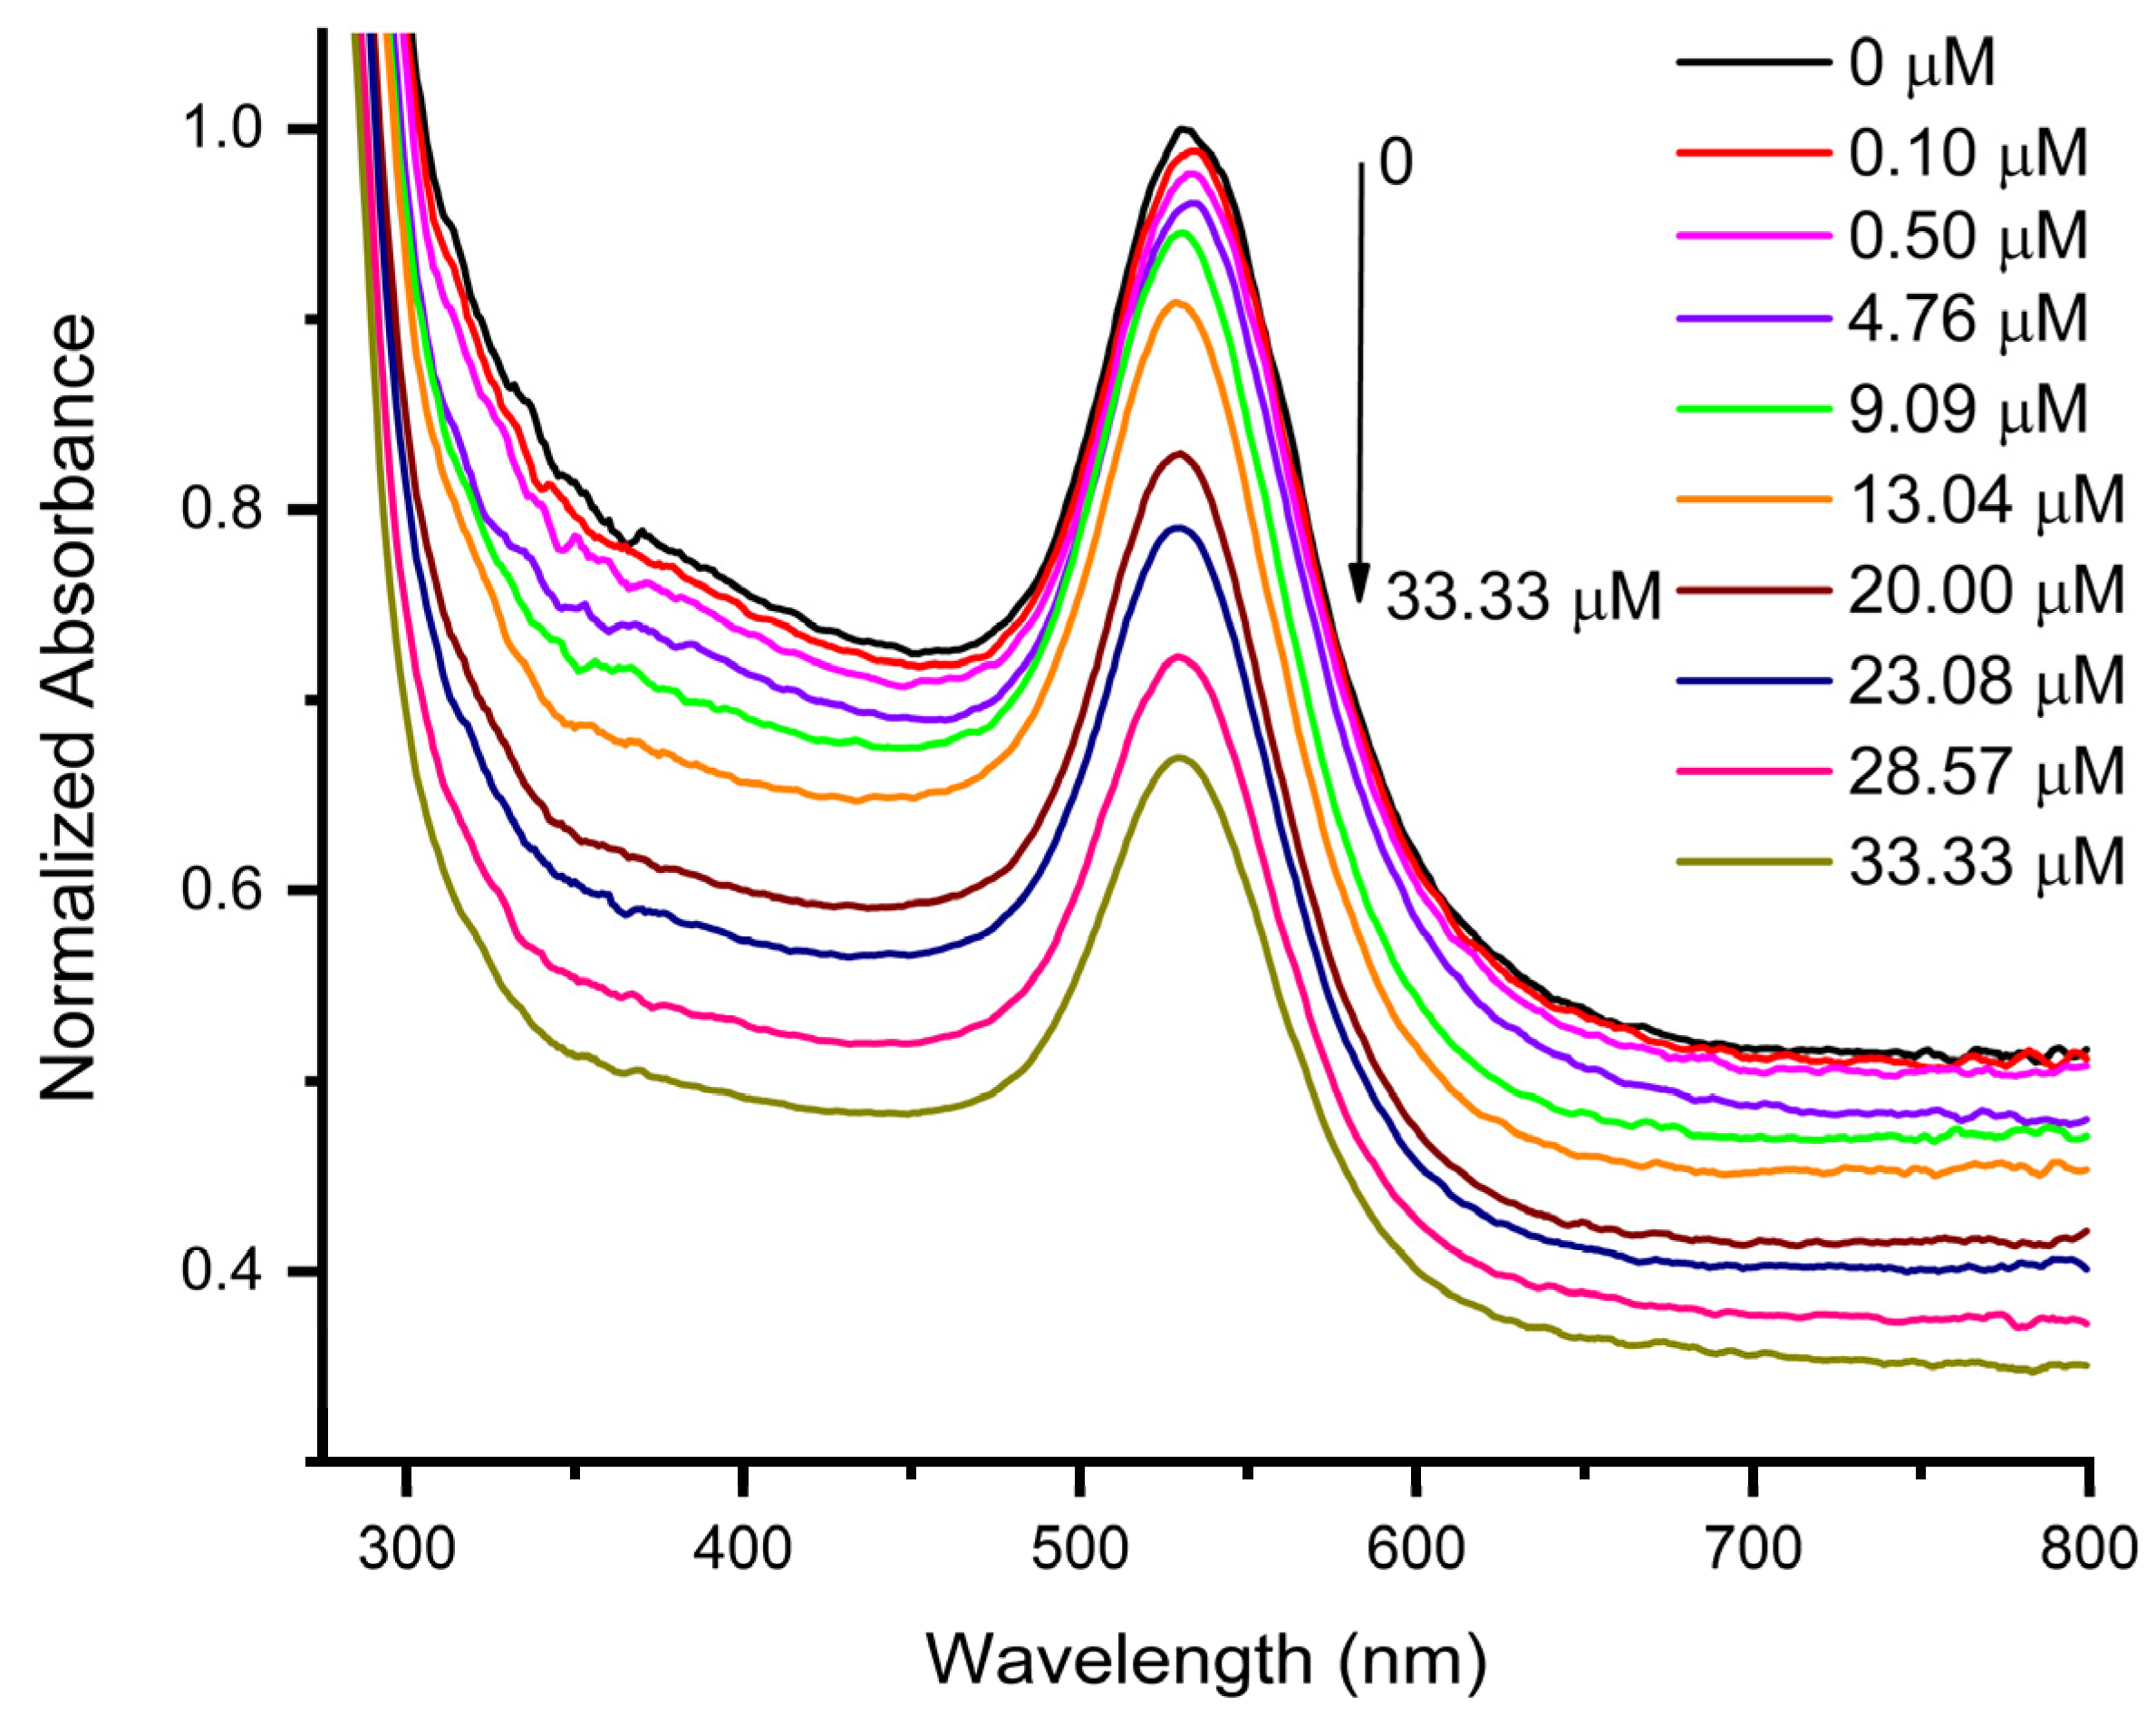
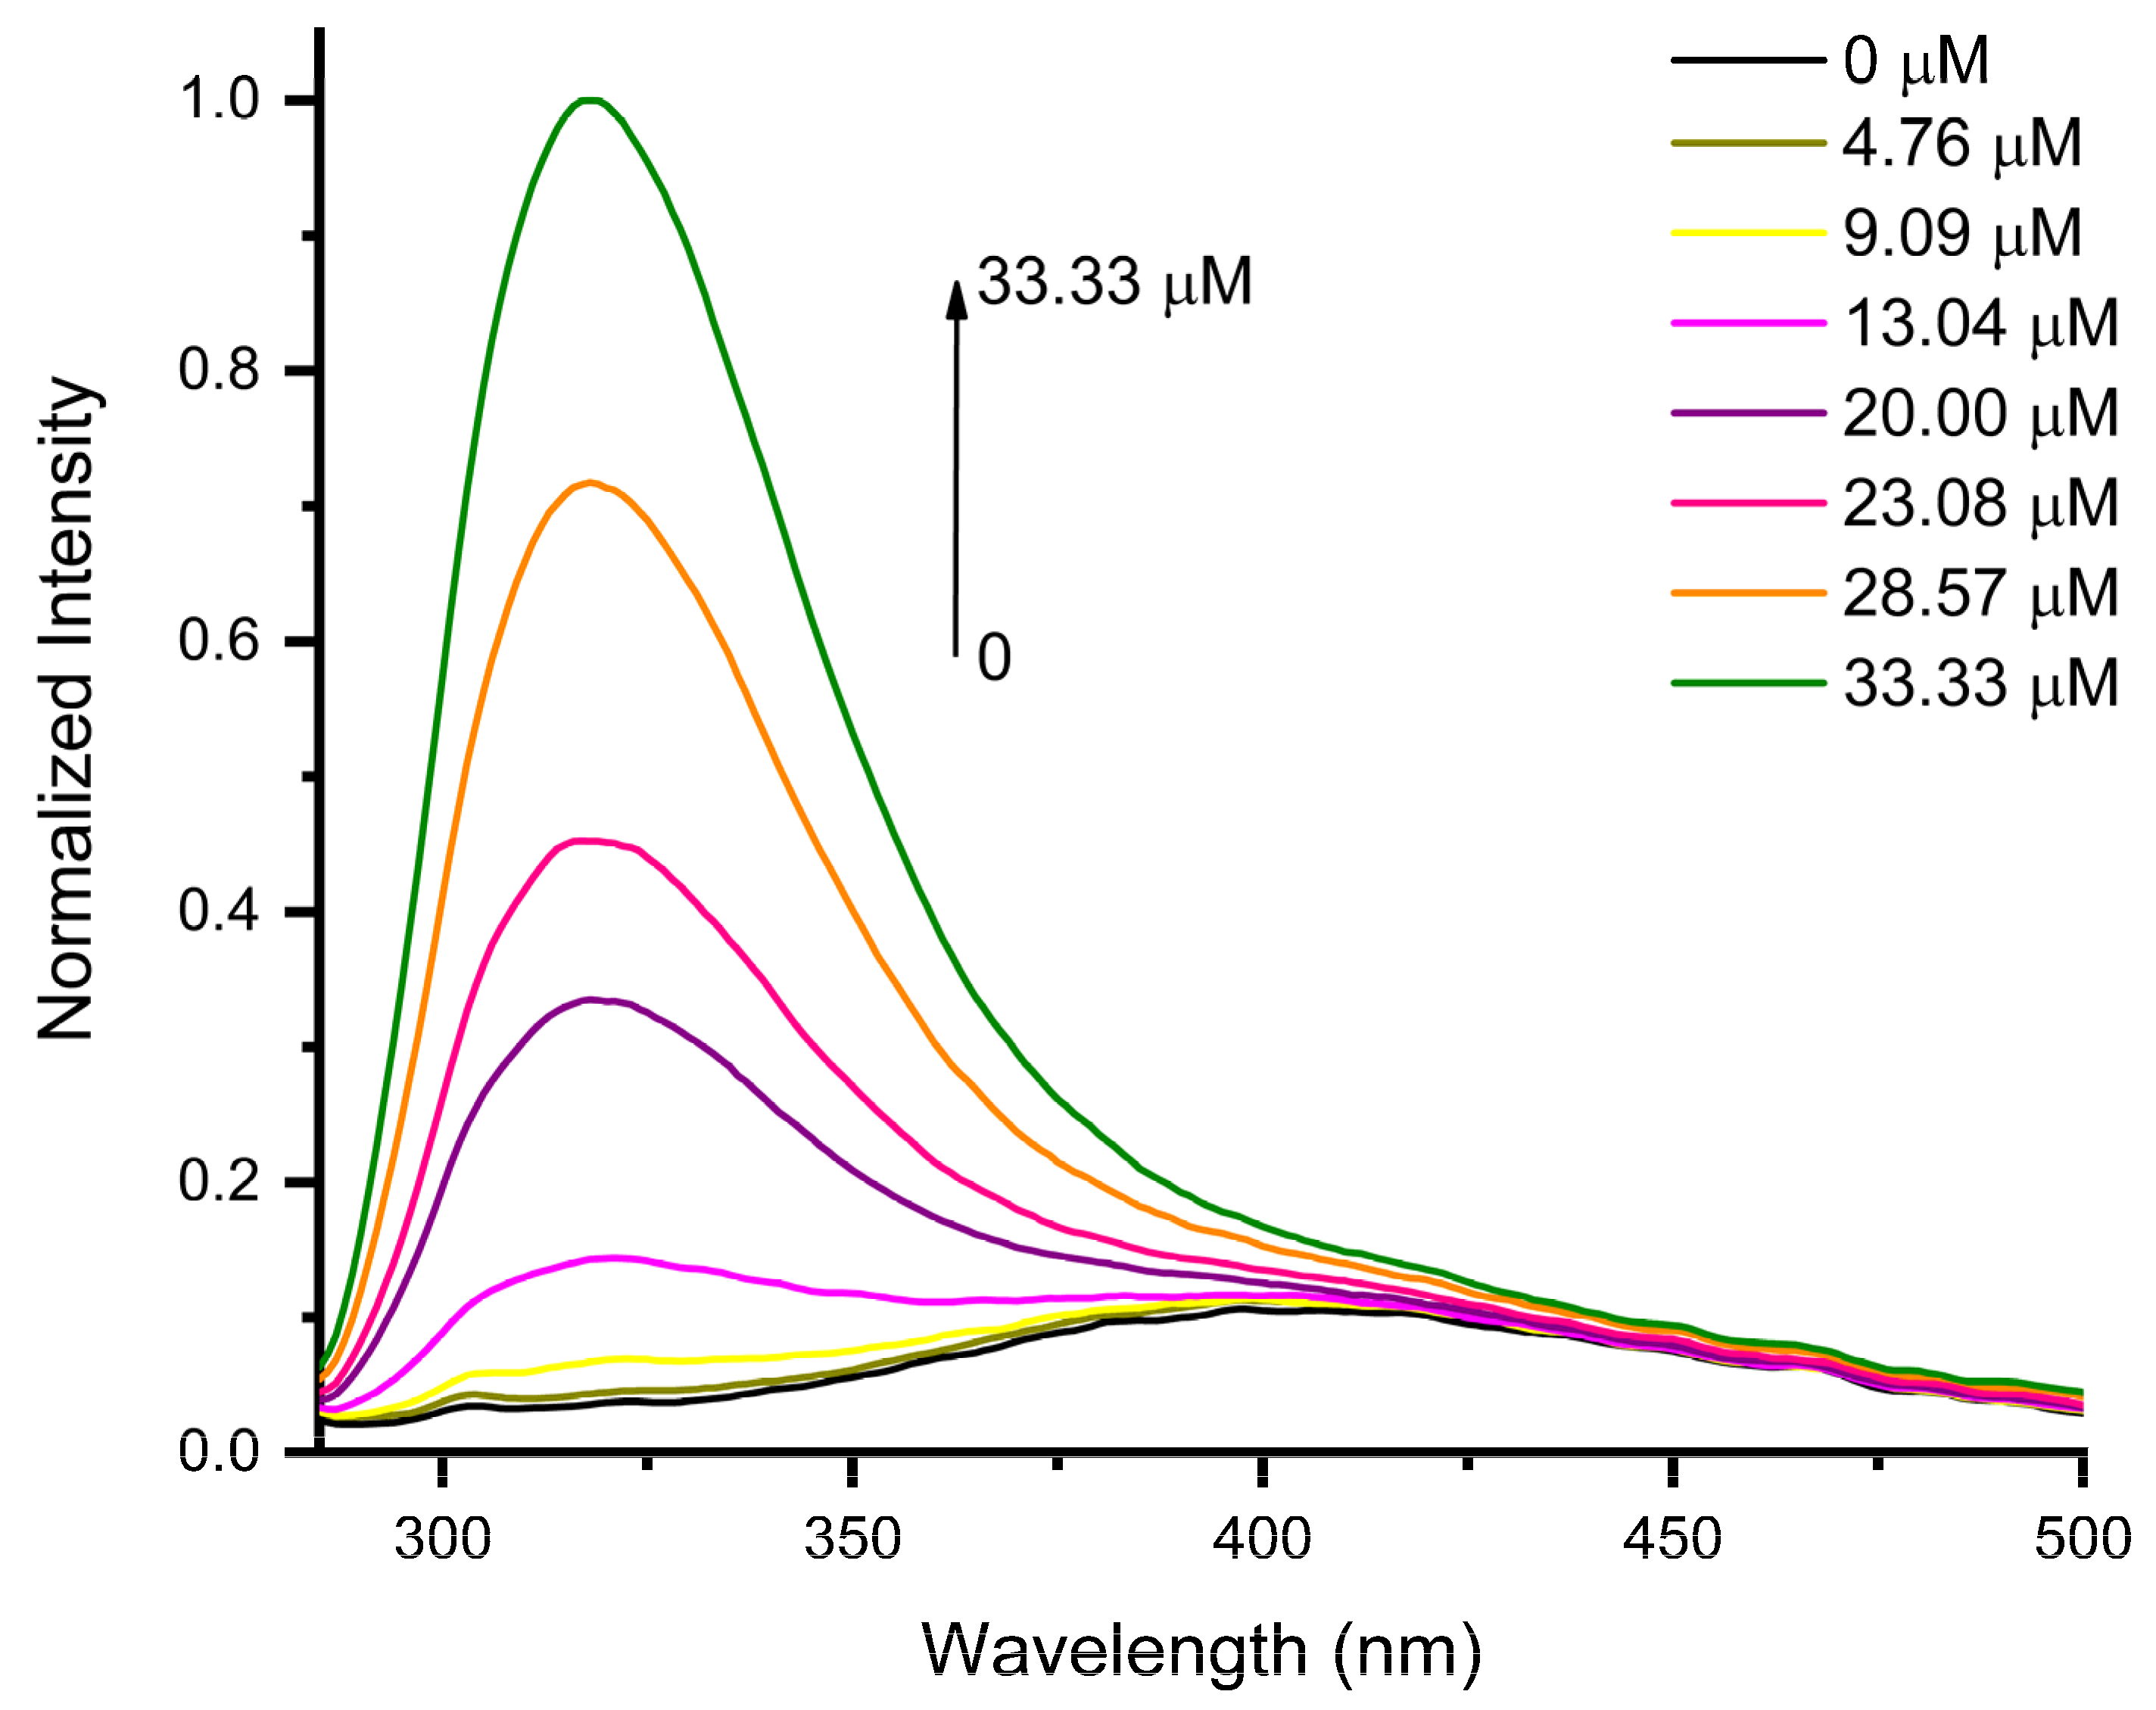
3.2. Sensing Performance of AuNPs for Epinephrine Detection
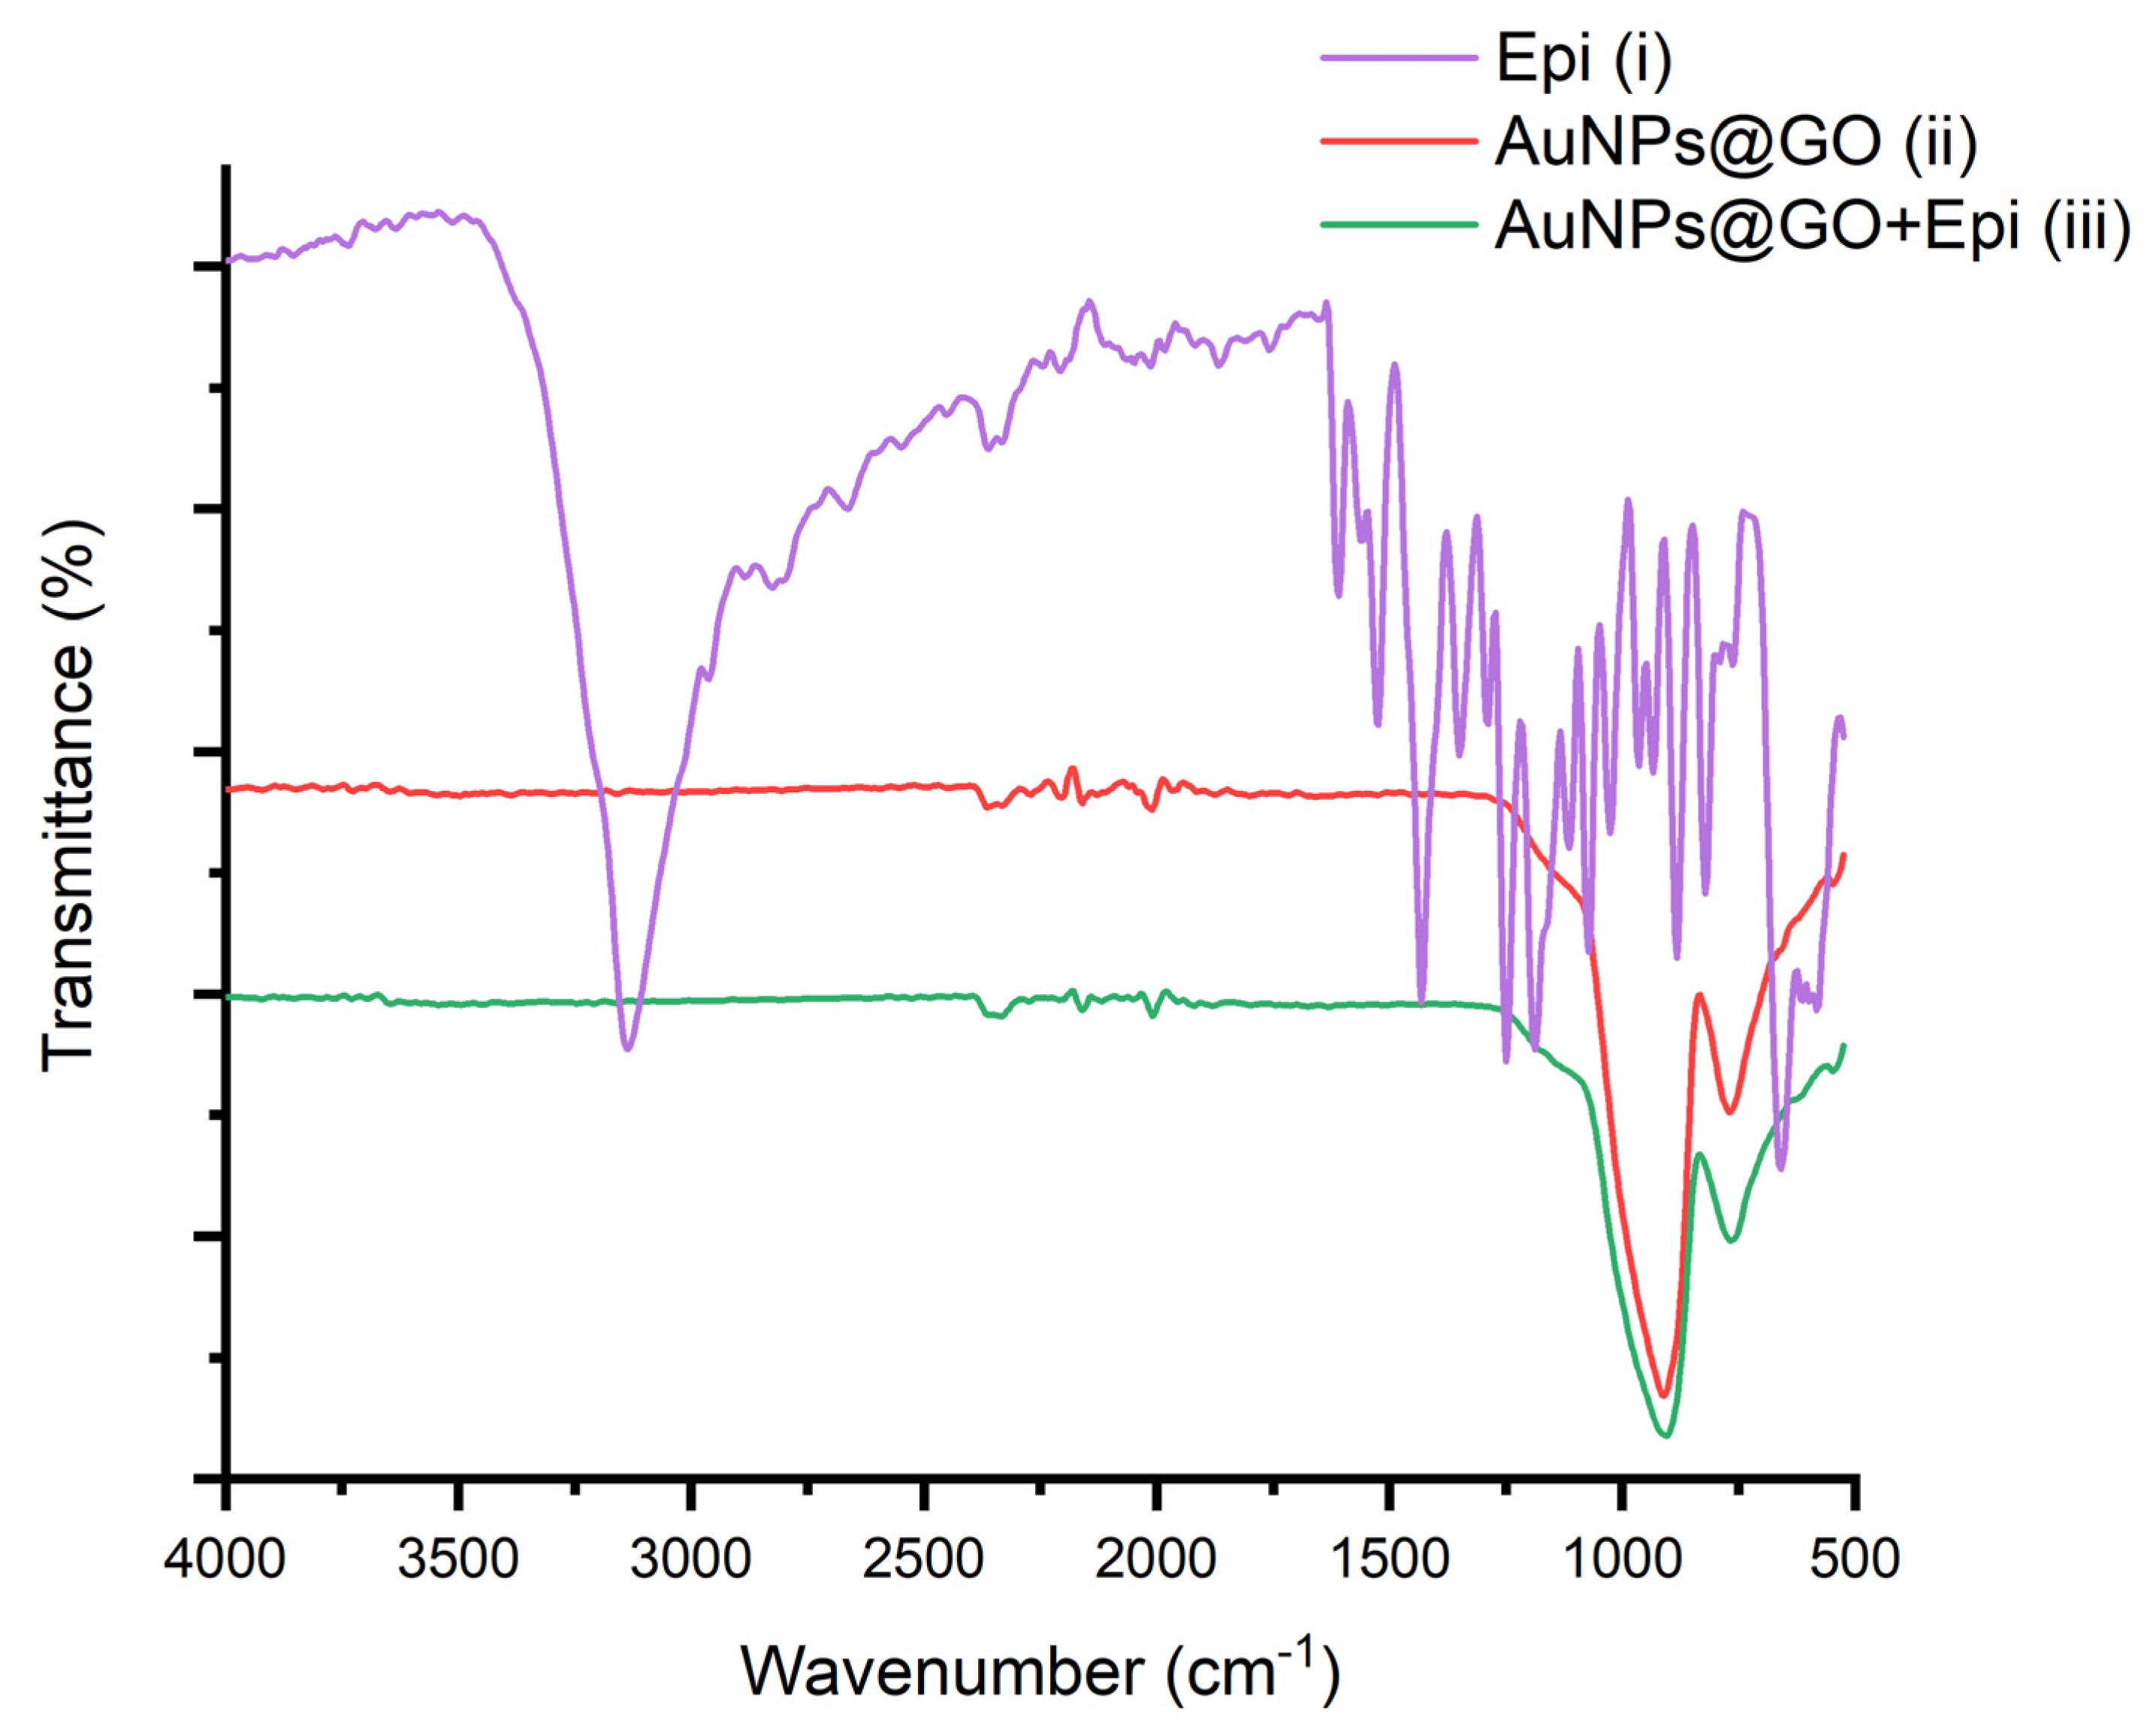
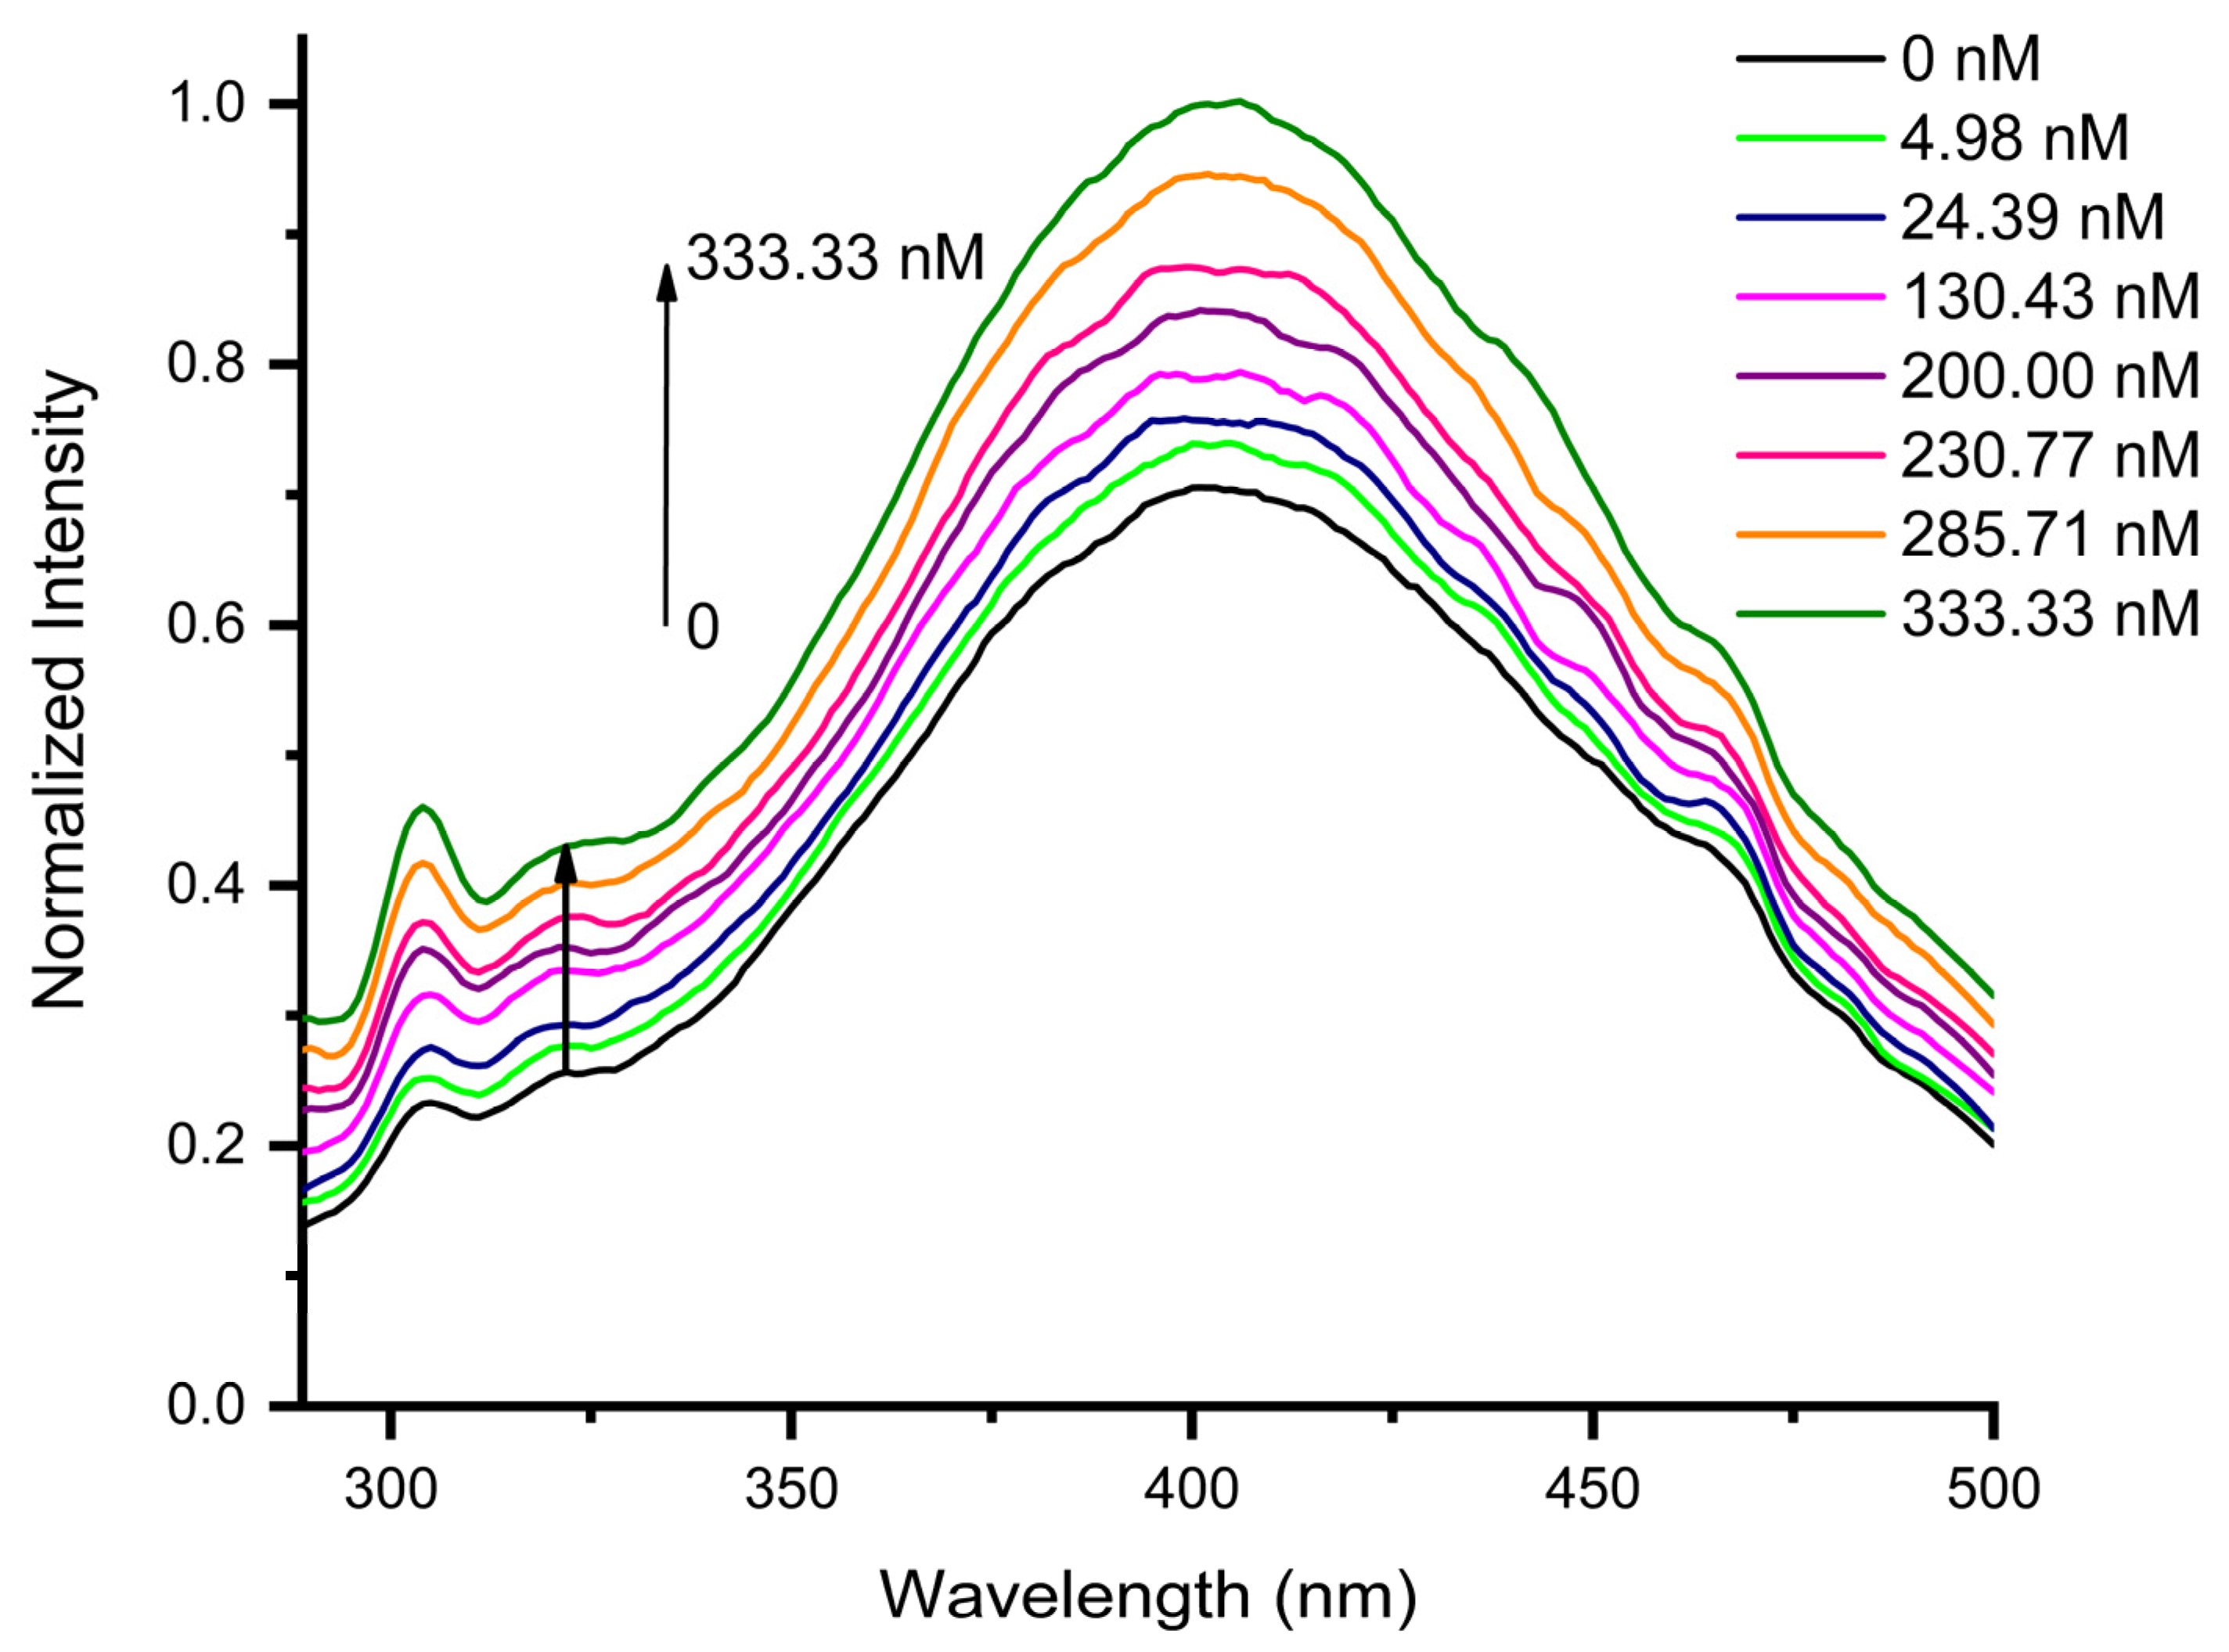
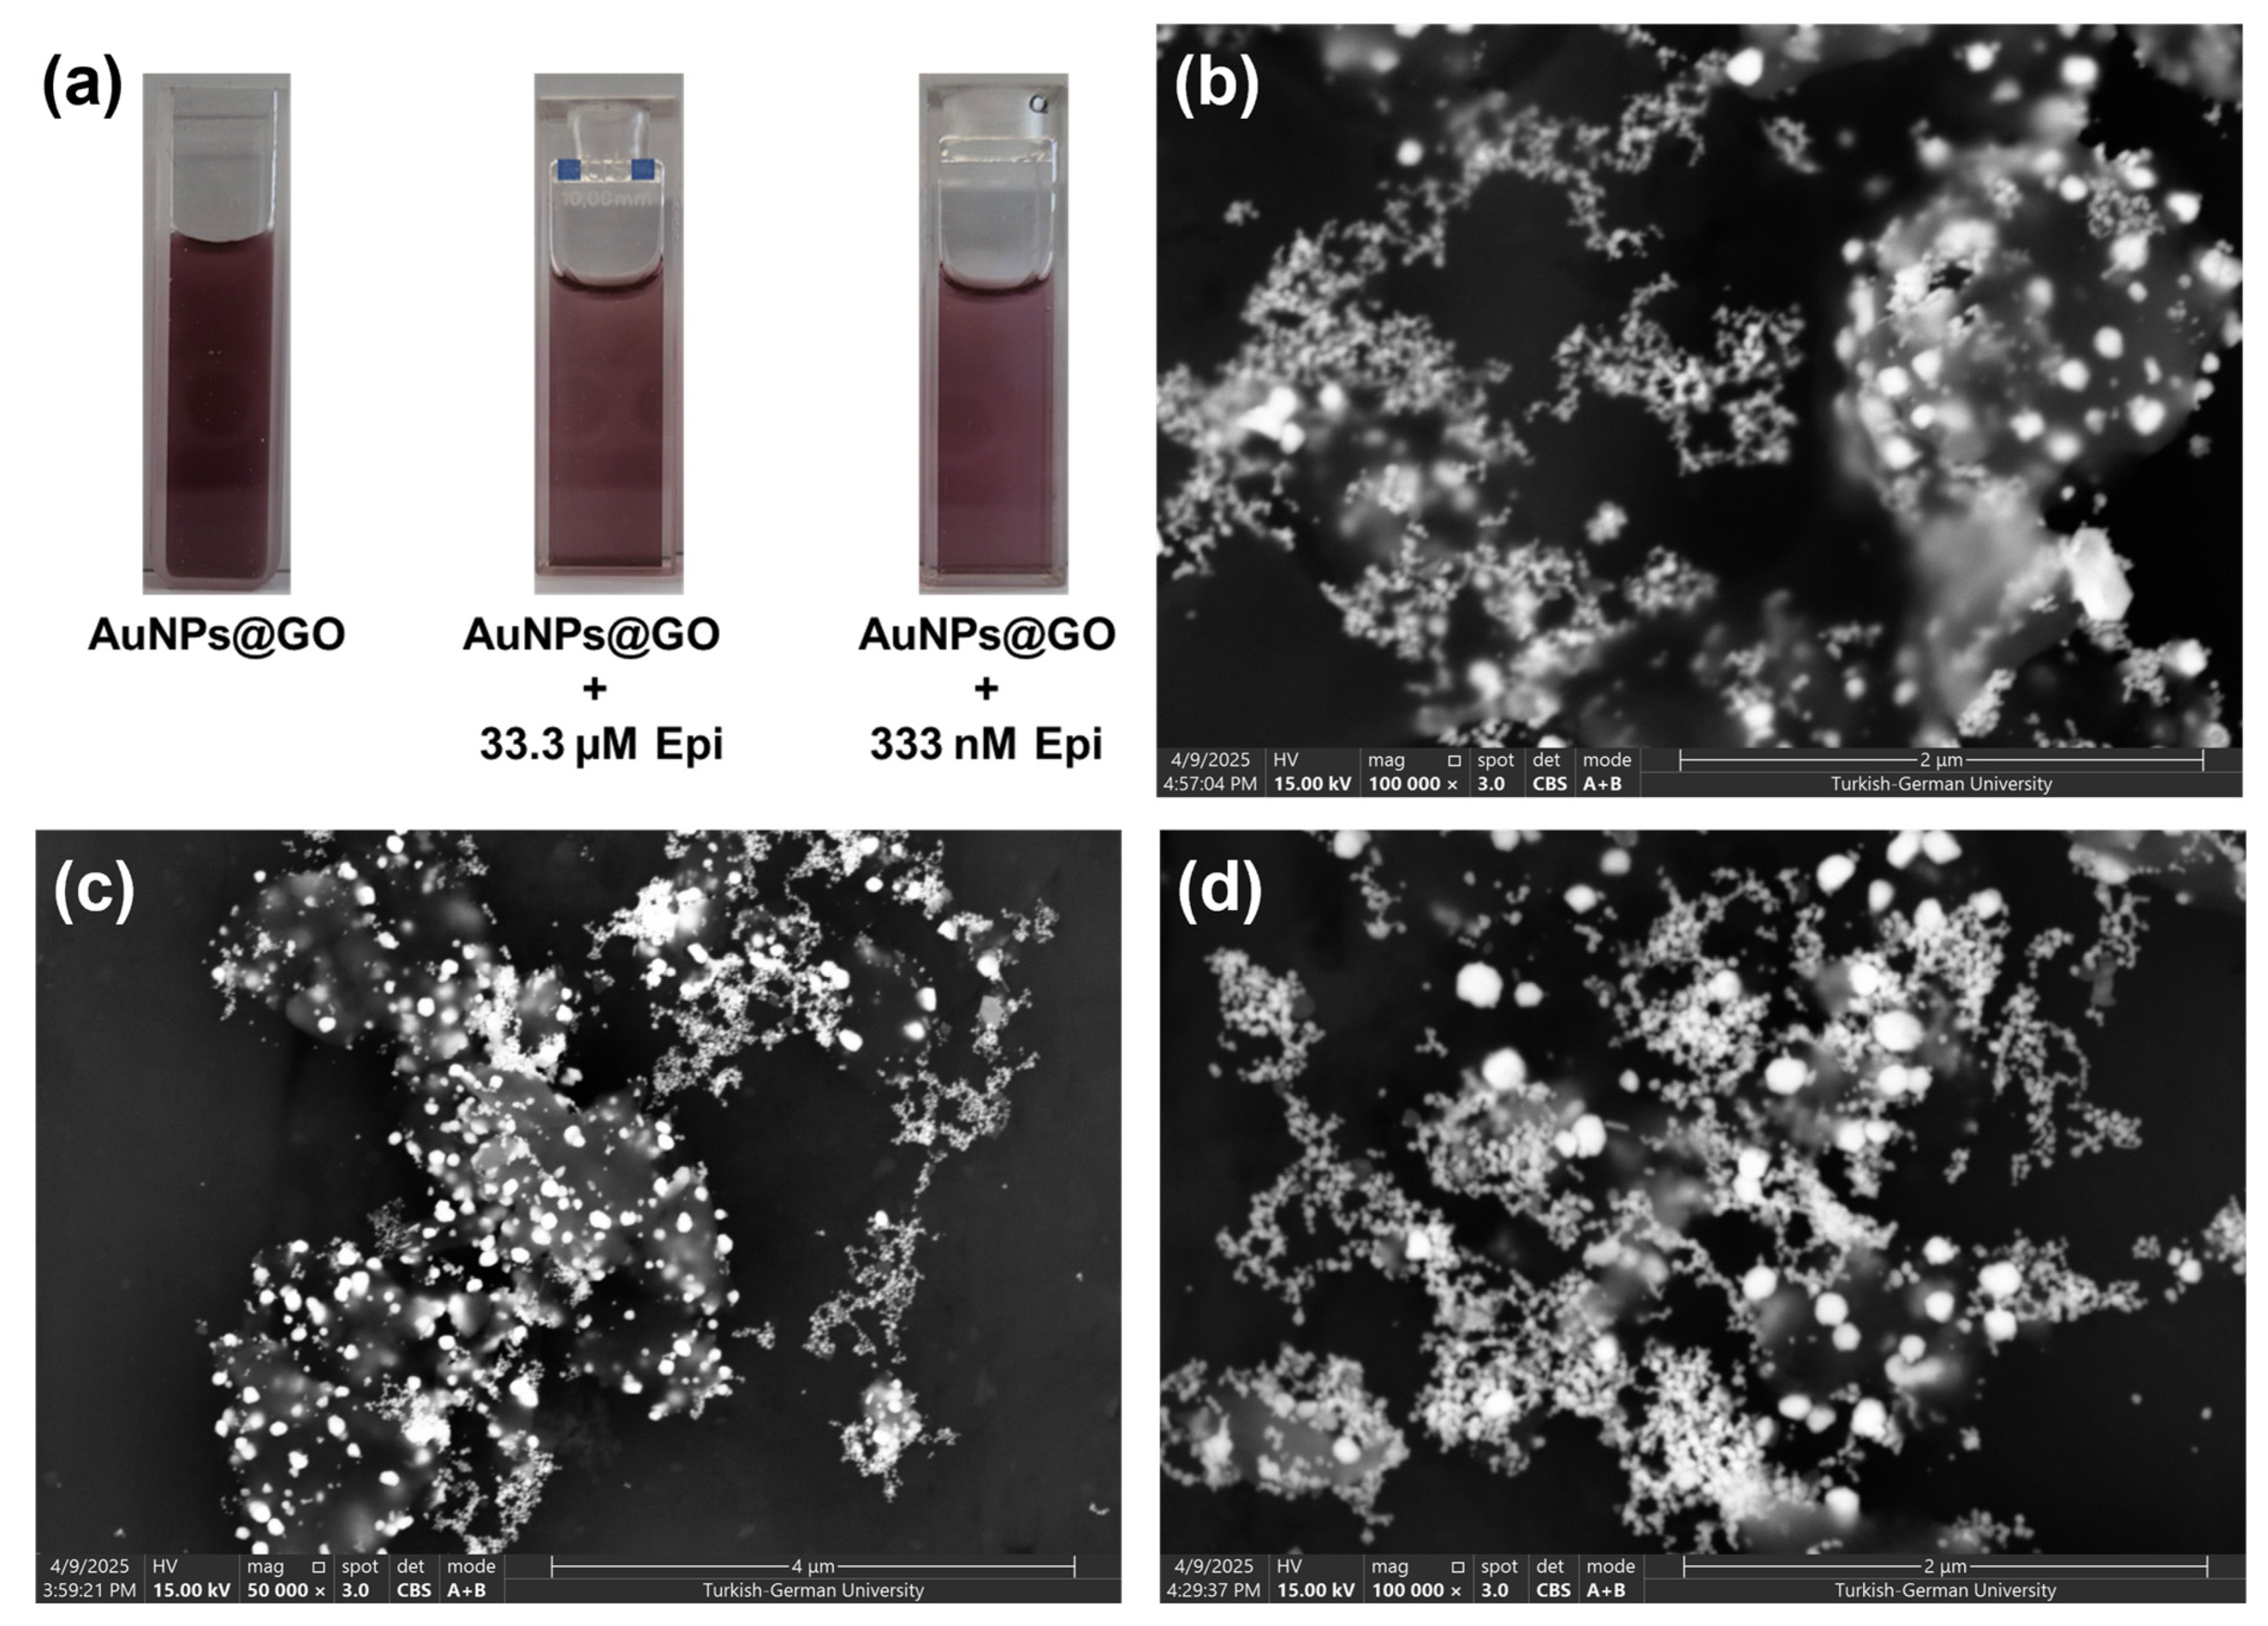
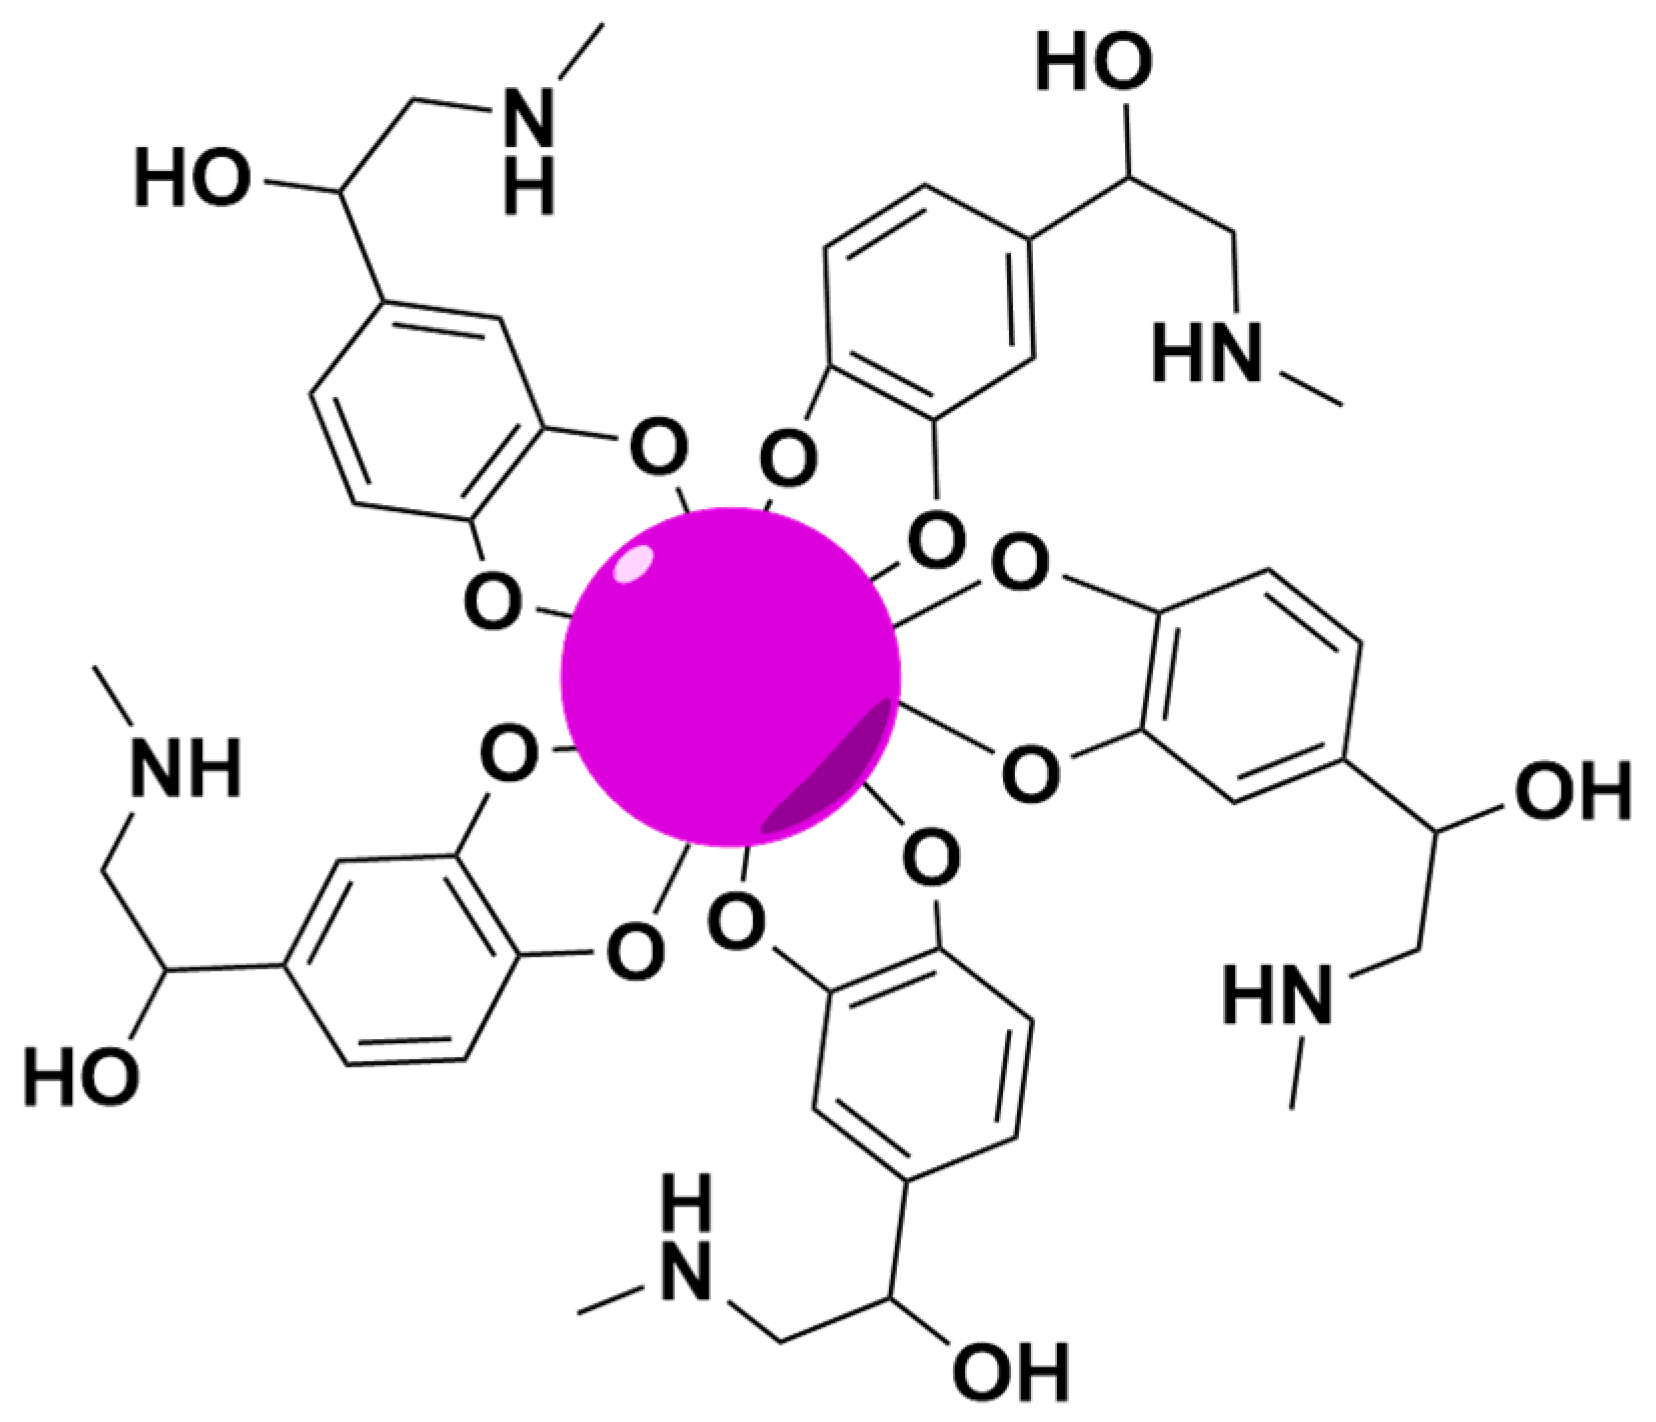
3.3. Sensing Performance of AuNPs@GO for Epinephrine Detection
4. Conclusions
Supplementary Materials
Author Contributions
Funding
Institutional Review Board Statement
Informed Consent Statement
Data Availability Statement
Acknowledgments
Conflicts of Interest
References
- Gul, M.; Kashif, M.; Muhammad, S.; Azizi, S.; Sun, H. Various Methods of Synthesis and Applications of Gold-Based Nanomaterials: A Detailed Review. Cryst. Growth Des. 2025, 25, 2227–2266. [Google Scholar] [CrossRef]
- Dheyab, M.A.; Aziz, A.A.; Moradi Khaniabadi, P.; Jameel, M.S.; Oladzadabbasabadi, N.; Mohammed, S.A.; Abdullah, R.S.; Mehrdel, B. Monodisperse Gold Nanoparticles: A Review on Synthesis and Their Application in Modern Medicine. Int. J. Mol. Sci. 2022, 23, 7400. [Google Scholar] [CrossRef] [PubMed]
- Shao, X.; Yang, D.; Wang, M.; Yue, Q. A Colorimetric Detection of Hg2+ Based on Gold Nanoparticles Synthesized Oxidized N-Methylpyrrolidone as a Reducing Agent. Sci. Rep. 2023, 13, 22208. [Google Scholar] [CrossRef] [PubMed]
- Kusuma, S.A.F.; Harmonis, J.A.; Pratiwi, R.; Hasanah, A.N. Gold Nanoparticle-Based Colorimetric Sensors: Properties and Application in Detection of Heavy Metals and Biological Molecules. Sensors 2023, 23, 8172. [Google Scholar] [CrossRef]
- Dizman, H.M.; Arsu, N. Rapid and Sensitive Colorimetric Determination of Dopamine and Serotonin in Solution and Polymer Matrix with Photochemically Prepared and N-Acetyl-L-Cysteine Functionalized Gold Nanoparticles. Mater. Today Commun. 2023, 35, 105599. [Google Scholar] [CrossRef]
- Yakut, S.; Ulutaş, K.; Bozoglu, D.; Adıbelli, M.; Ceper, T.; Arsu, N.; Deger, D. Dielectric Properties of AuNPs/PEGMEA/PEGDA Nanocomposite Film Prepared with an A−amino Ketone by in-Situ Photochemical Method. Phys. B Condens. Matter 2018, 542, 6–11. [Google Scholar] [CrossRef]
- Çeper, T.; Arsu, N. Photochemically Prepared Gold/Polymer Nanocoatings: Formation of Gold Mirror. Macromol. Chem. Phys. 2017, 218, 1700030. [Google Scholar] [CrossRef]
- Chu, Y.-L.; Young, S.-J.; Huang, Y.-R.; Arya, S.; Chu, T.-T. Highly Sensitive Ethanol Gas Sensors of Au Nanoparticle-Adsorbed ZnO Nanorod Arrays via a Photochemical Deposition Treatment. ACS Appl. Electron. Mater. 2025, 7, 2327–2338. [Google Scholar] [CrossRef]
- Jara, N.; Milán, N.S.; Rahman, A.; Mouheb, L.; Boffito, D.C.; Jeffryes, C.; Dahoumane, S.A. Photochemical Synthesis of Gold and Silver Nanoparticles—A Review. Molecules 2021, 26, 4585. [Google Scholar] [CrossRef]
- M. Aldebasi, S.; Tar, H.; S. Alnafisah, A.; Beji, L.; Kouki, N.; Morlet-Savary, F.; Alminderej, F.M.; Aroua, L.M.; Lalevée, J. Photochemical Synthesis of Noble Metal Nanoparticles: Influence of Metal Salt Concentration on Size and Distribution. Int. J. Mol. Sci. 2023, 24, 14018. [Google Scholar] [CrossRef]
- Wu, T.; Kheiri, S.; Hickman, R.J.; Tao, H.; Wu, T.C.; Yang, Z.-B.; Ge, X.; Zhang, W.; Abolhasani, M.; Liu, K.; et al. Self-Driving Lab for the Photochemical Synthesis of Plasmonic Nanoparticles with Targeted Structural and Optical Properties. Nat. Commun. 2025, 16, 1473. [Google Scholar] [CrossRef] [PubMed]
- Liu, J.; Bao, S.; Wang, X. Applications of Graphene-Based Materials in Sensors: A Review. Micromachines 2022, 13, 184. [Google Scholar] [CrossRef] [PubMed]
- Yadav, S.; Singh Raman, A.P.; Meena, H.; Goswami, A.G.; Bhawna; Kumar, V.; Jain, P.; Kumar, G.; Sagar, M.; Rana, D.K.; et al. An Update on Graphene Oxide: Applications and Toxicity. ACS Omega 2022, 7, 35387–35445. [Google Scholar] [CrossRef] [PubMed]
- Farjadian, F.; Abbaspour, S.; Sadatlu, M.A.A.; Mirkiani, S.; Ghasemi, A.; Hoseini-Ghahfarokhi, M.; Mozaffari, N.; Karimi, M.; Hamblin, M.R. Recent Developments in Graphene and Graphene Oxide: Properties, Synthesis, and Modifications: A Review. ChemistrySelect 2020, 5, 10200–10219. [Google Scholar] [CrossRef]
- Trikkaliotis, D.G.; Christoforidis, A.K.; Mitropoulos, A.C.; Kyzas, G.Z. Graphene Oxide Synthesis, Properties and Characterization Techniques: A Comprehensive Review. ChemEngineering 2021, 5, 64. [Google Scholar] [CrossRef]
- Kim, J.-W.; Kim, M.; Lee, K.K.; Chung, K.H.; Lee, C.-S. Effects of Graphene Oxide-Gold Nanoparticles Nanocomposite on Highly Sensitive Foot-and-Mouth Disease Virus Detection. Nanomaterials 2020, 10, 1921. [Google Scholar] [CrossRef]
- Kiranmai, S.; Kuchi, C.; Sravani, B.; Ƚuczak, T.; Kim, M.J.; Madhavi, G.; Veera Manohara Reddy, Y. Construction of Ultrasensitive Electrochemical Sensor Using TiO2-Reduced Graphene Oxide Nanofibers Nanocomposite for Epinephrine Detection. Surf. Interfaces 2022, 35, 102455. [Google Scholar] [CrossRef]
- Rajarathinam, T.; Kang, M.; Hong, S.; Chang, S.-C. Nanocomposite-Based Electrochemical Sensors for Neurotransmitters Detection in Neurodegenerative Diseases. Chemosensors 2023, 11, 103. [Google Scholar] [CrossRef]
- Leau, S.-A.; Lete, C.; Lupu, S. Nanocomposite Materials Based on Metal Nanoparticles for the Electrochemical Sensing of Neurotransmitters. Chemosensors 2023, 11, 179. [Google Scholar] [CrossRef]
- Leau, S.A.; Lete, C.; Matei, C.; Lupu, S. Electrochemical Sensing Platform Based on Metal Nanoparticles for Epinephrine and Serotonin. Biosensors 2023, 13, 781. [Google Scholar] [CrossRef]
- Zhan, S.; Xu, C.; Chen, J.; Xiao, Q.; Zhou, Z.; Xing, Z.; Gu, C.; Yin, Z.; Liu, H. A Novel Epinephrine Biosensor Based on Gold Nanoparticles Coordinated Polydopamine-Functionalized Acupuncture Needle Microelectrode. Electrochim. Acta 2023, 437, 141468. [Google Scholar] [CrossRef]
- Ally, N.; Hendricks, N.; Gumbi, B. A Colorimetric Detection of Noradrenaline in Wastewater Using Citrate-Capped Colloidal Gold Nanoparticles Probe. Colloids Interfaces 2022, 6, 61. [Google Scholar] [CrossRef]
- Govindaraju, S.; Reddy, A.S.; Kim, J.; Yun, K. Sensitive Detection of Epinephrine in Human Serum via Fluorescence Enhancement of Gold Nanoclusters. Appl. Surf. Sci. 2019, 498, 143837. [Google Scholar] [CrossRef]
- Godoy-Reyes, T.M.; Costero, A.M.; Gaviña, P.; Martínez-Máñez, R.; Sancenón, F. A Colorimetric Probe for the Selective Detection of Norepinephrine Based on a Double Molecular Recognition with Functionalized Gold Nanoparticles. ACS Appl. Nano Mater. 2019, 2, 1367–1373. [Google Scholar] [CrossRef]
- Saraf, N.; Bosak, A.; Willenberg, A.; Das, S.; Willenberg, B.J.; Seal, S. Colorimetric Detection of Epinephrine Using an Optimized Paper-Based Aptasensor. RSC Adv. 2017, 7, 49133–49143. [Google Scholar] [CrossRef]
- Ramirez, S.; Silva, N.; Oyarzun, M.P.; Pavez, J.; Silva, J.F. Gold Nanostructures on Self-Assembled Monolayers Activity for Epinephrine, Noradrenaline and Dopamine. J. Electroanal. Chem. 2017, 799, 349–357. [Google Scholar] [CrossRef]
- Chen, Z.; Hu, Y.; Yang, Q.; Wan, C.; Tan, Y.; Ma, H. A Highly Sensitive Colorimetric Sensor for Adrenaline Detection Based on Organic Molecules-Functionalized Gold Nanoparticles. Sens. Actuators B Chem. 2015, 207, 277–280. [Google Scholar] [CrossRef]
Disclaimer/Publisher’s Note: The statements, opinions, and data contained in all publications are solely those of the individual author(s) and contributor(s) and not of MDPI and/or the editor(s). MDPI and/or the editor(s) disclaim responsibility for any injury to people or property resulting from any ideas, methods, instructions, or products referred to in the content. |


| Name | Parameter | Method | |
|---|---|---|---|
| SE of Intercept | SE of Regression | ||
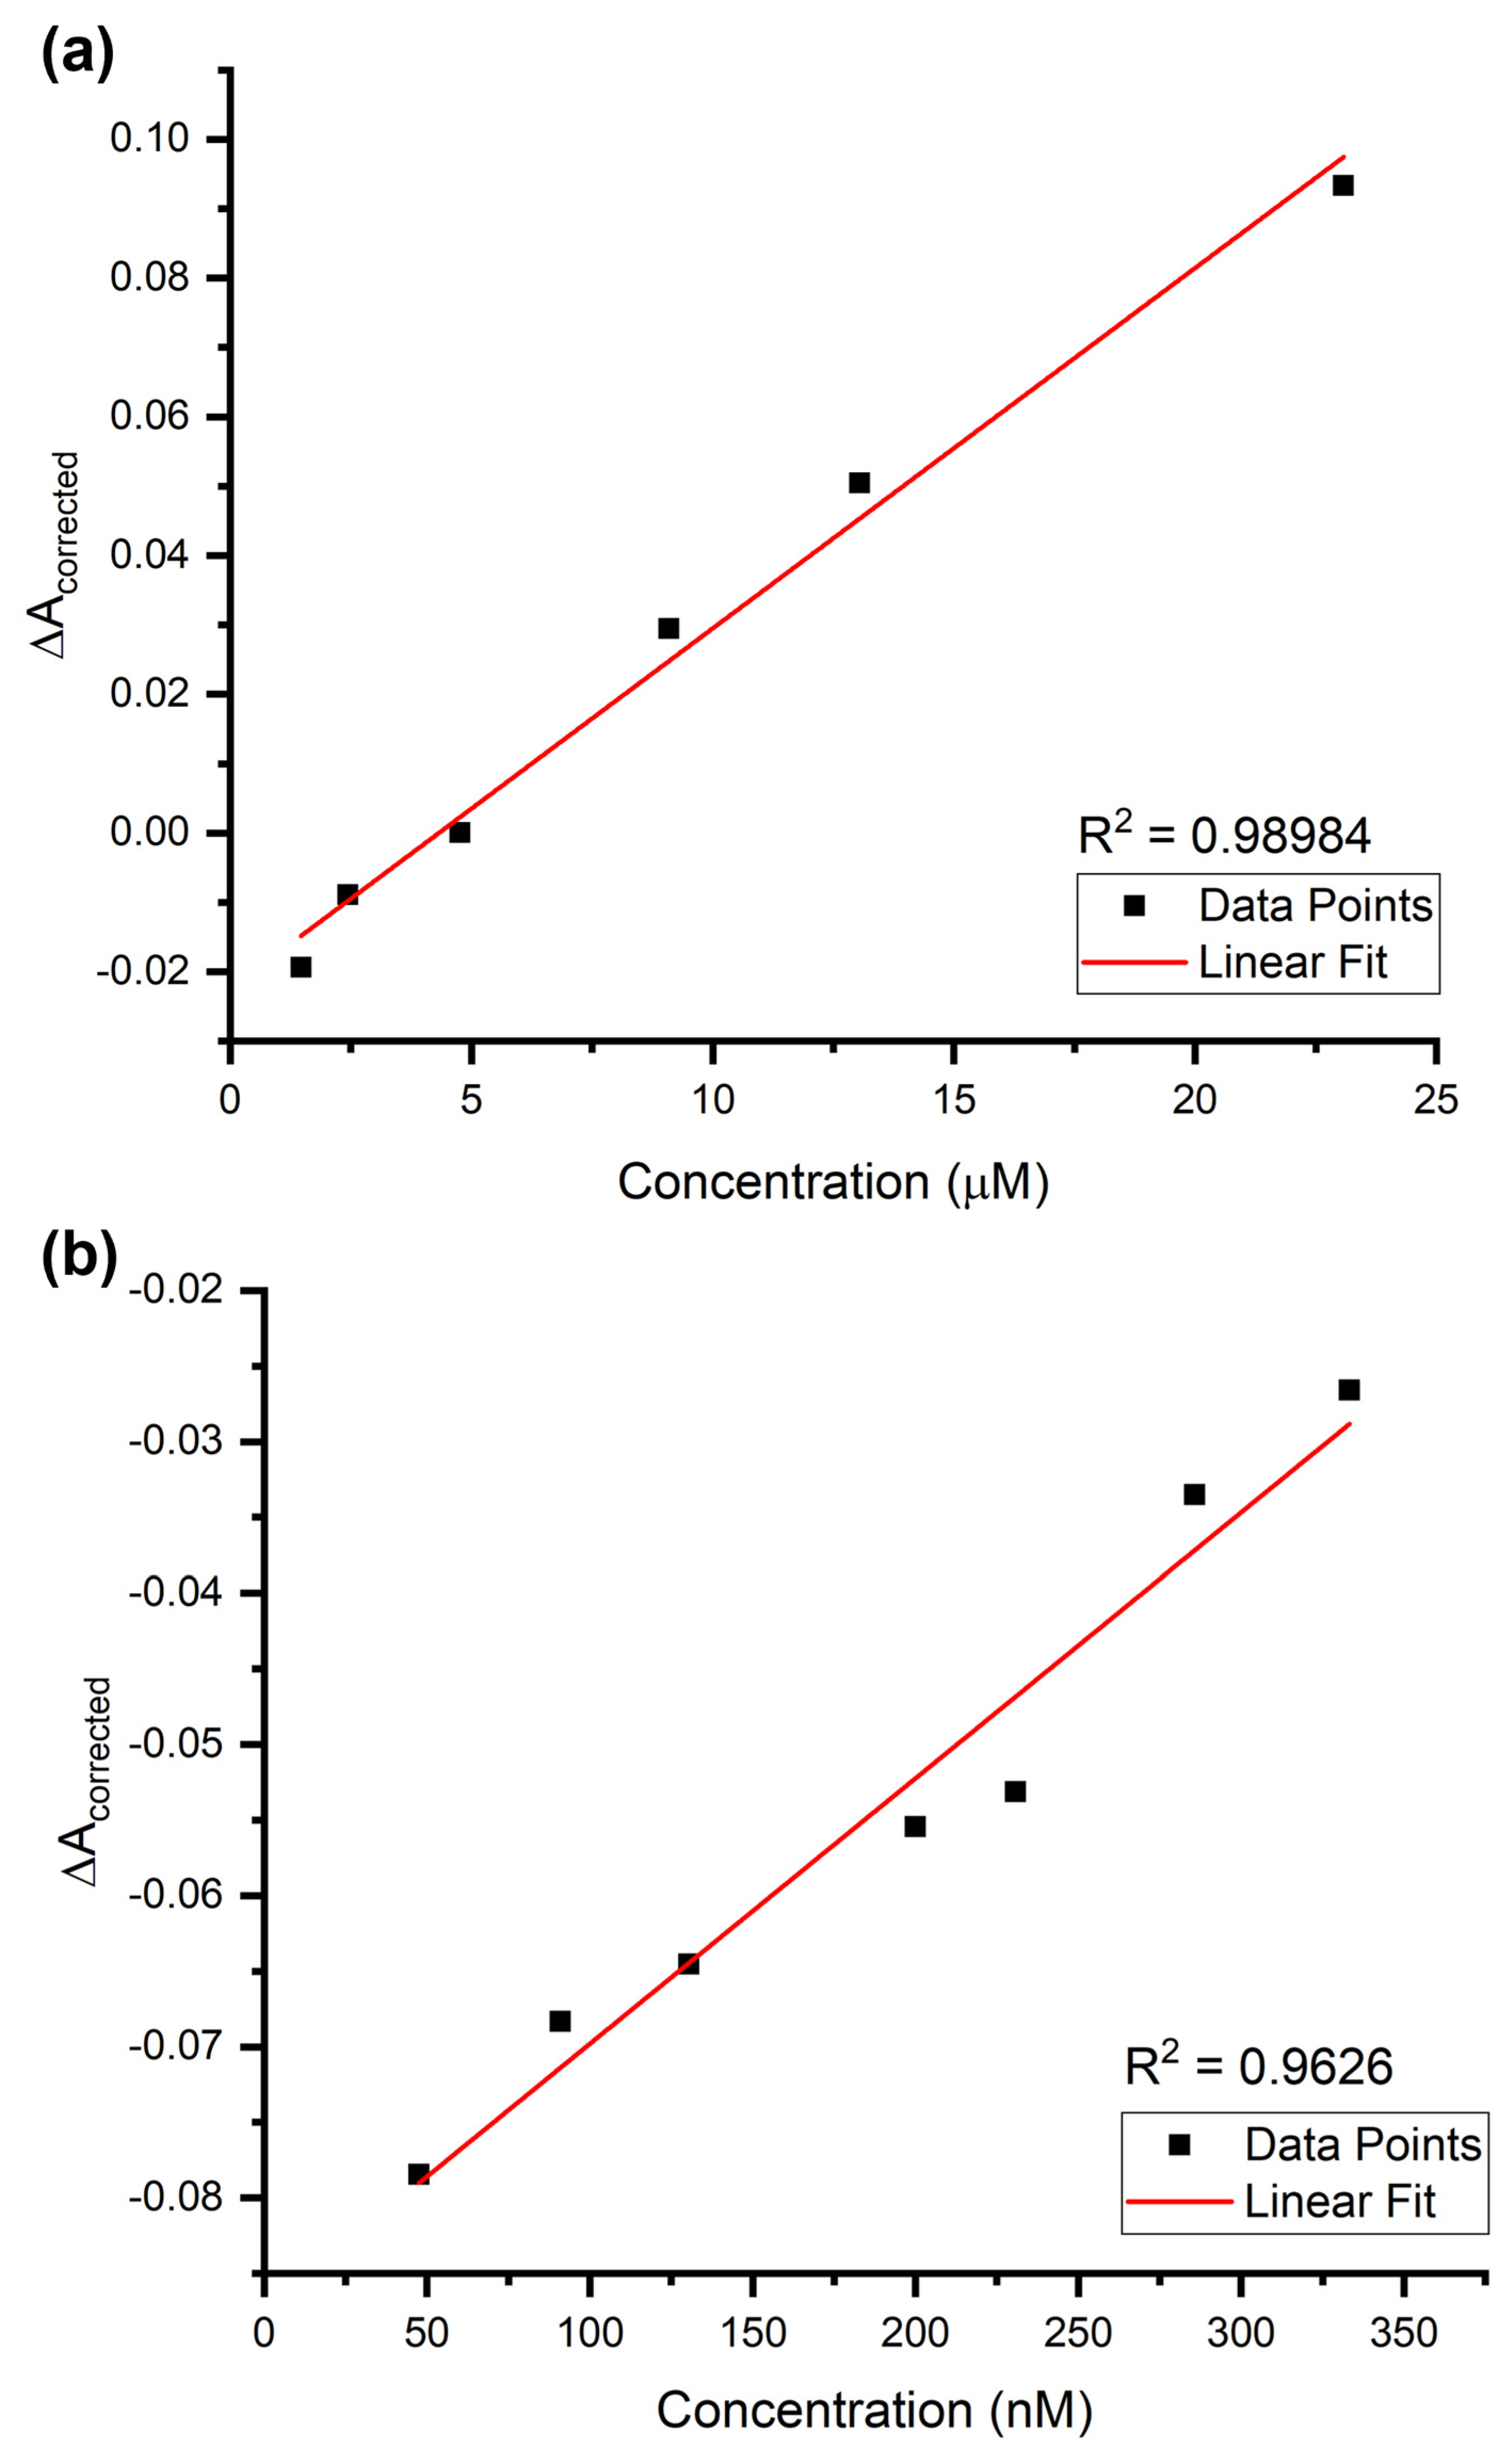
| AuNPs + Epinephrine (µM) | LOD | 1.77 µM | 3.05 µM |
| LOQ | 5.90 µM | 9.23 µM | |
| R2 | 0.98984 | ||
| Slope (Sensitivity) | 0.0052 | ||
| SEintercept or Sy/x | 0.00307 | 0.00480 | |
| Best linear subrange | 1.48 to 23.08 µM | ||
| AuNPs + Epinephrine (nM) | LOD | 56.03 nM | 74.21 nM |
| LOQ | 186.76 nM | 224.89 nM | |
| R2 | 0.9626 | ||
| Slope (Sensitivity) | 1.76 × 10⁻⁴ | ||
| SEintercept or Sy/x | 0.00328 | 0.00395 | |
| Best linear subrange | 47.62 to 333.33 nM | ||
| Name | Parameter | Method | |
|---|---|---|---|
| SE of Intercept | SE of Regression | ||
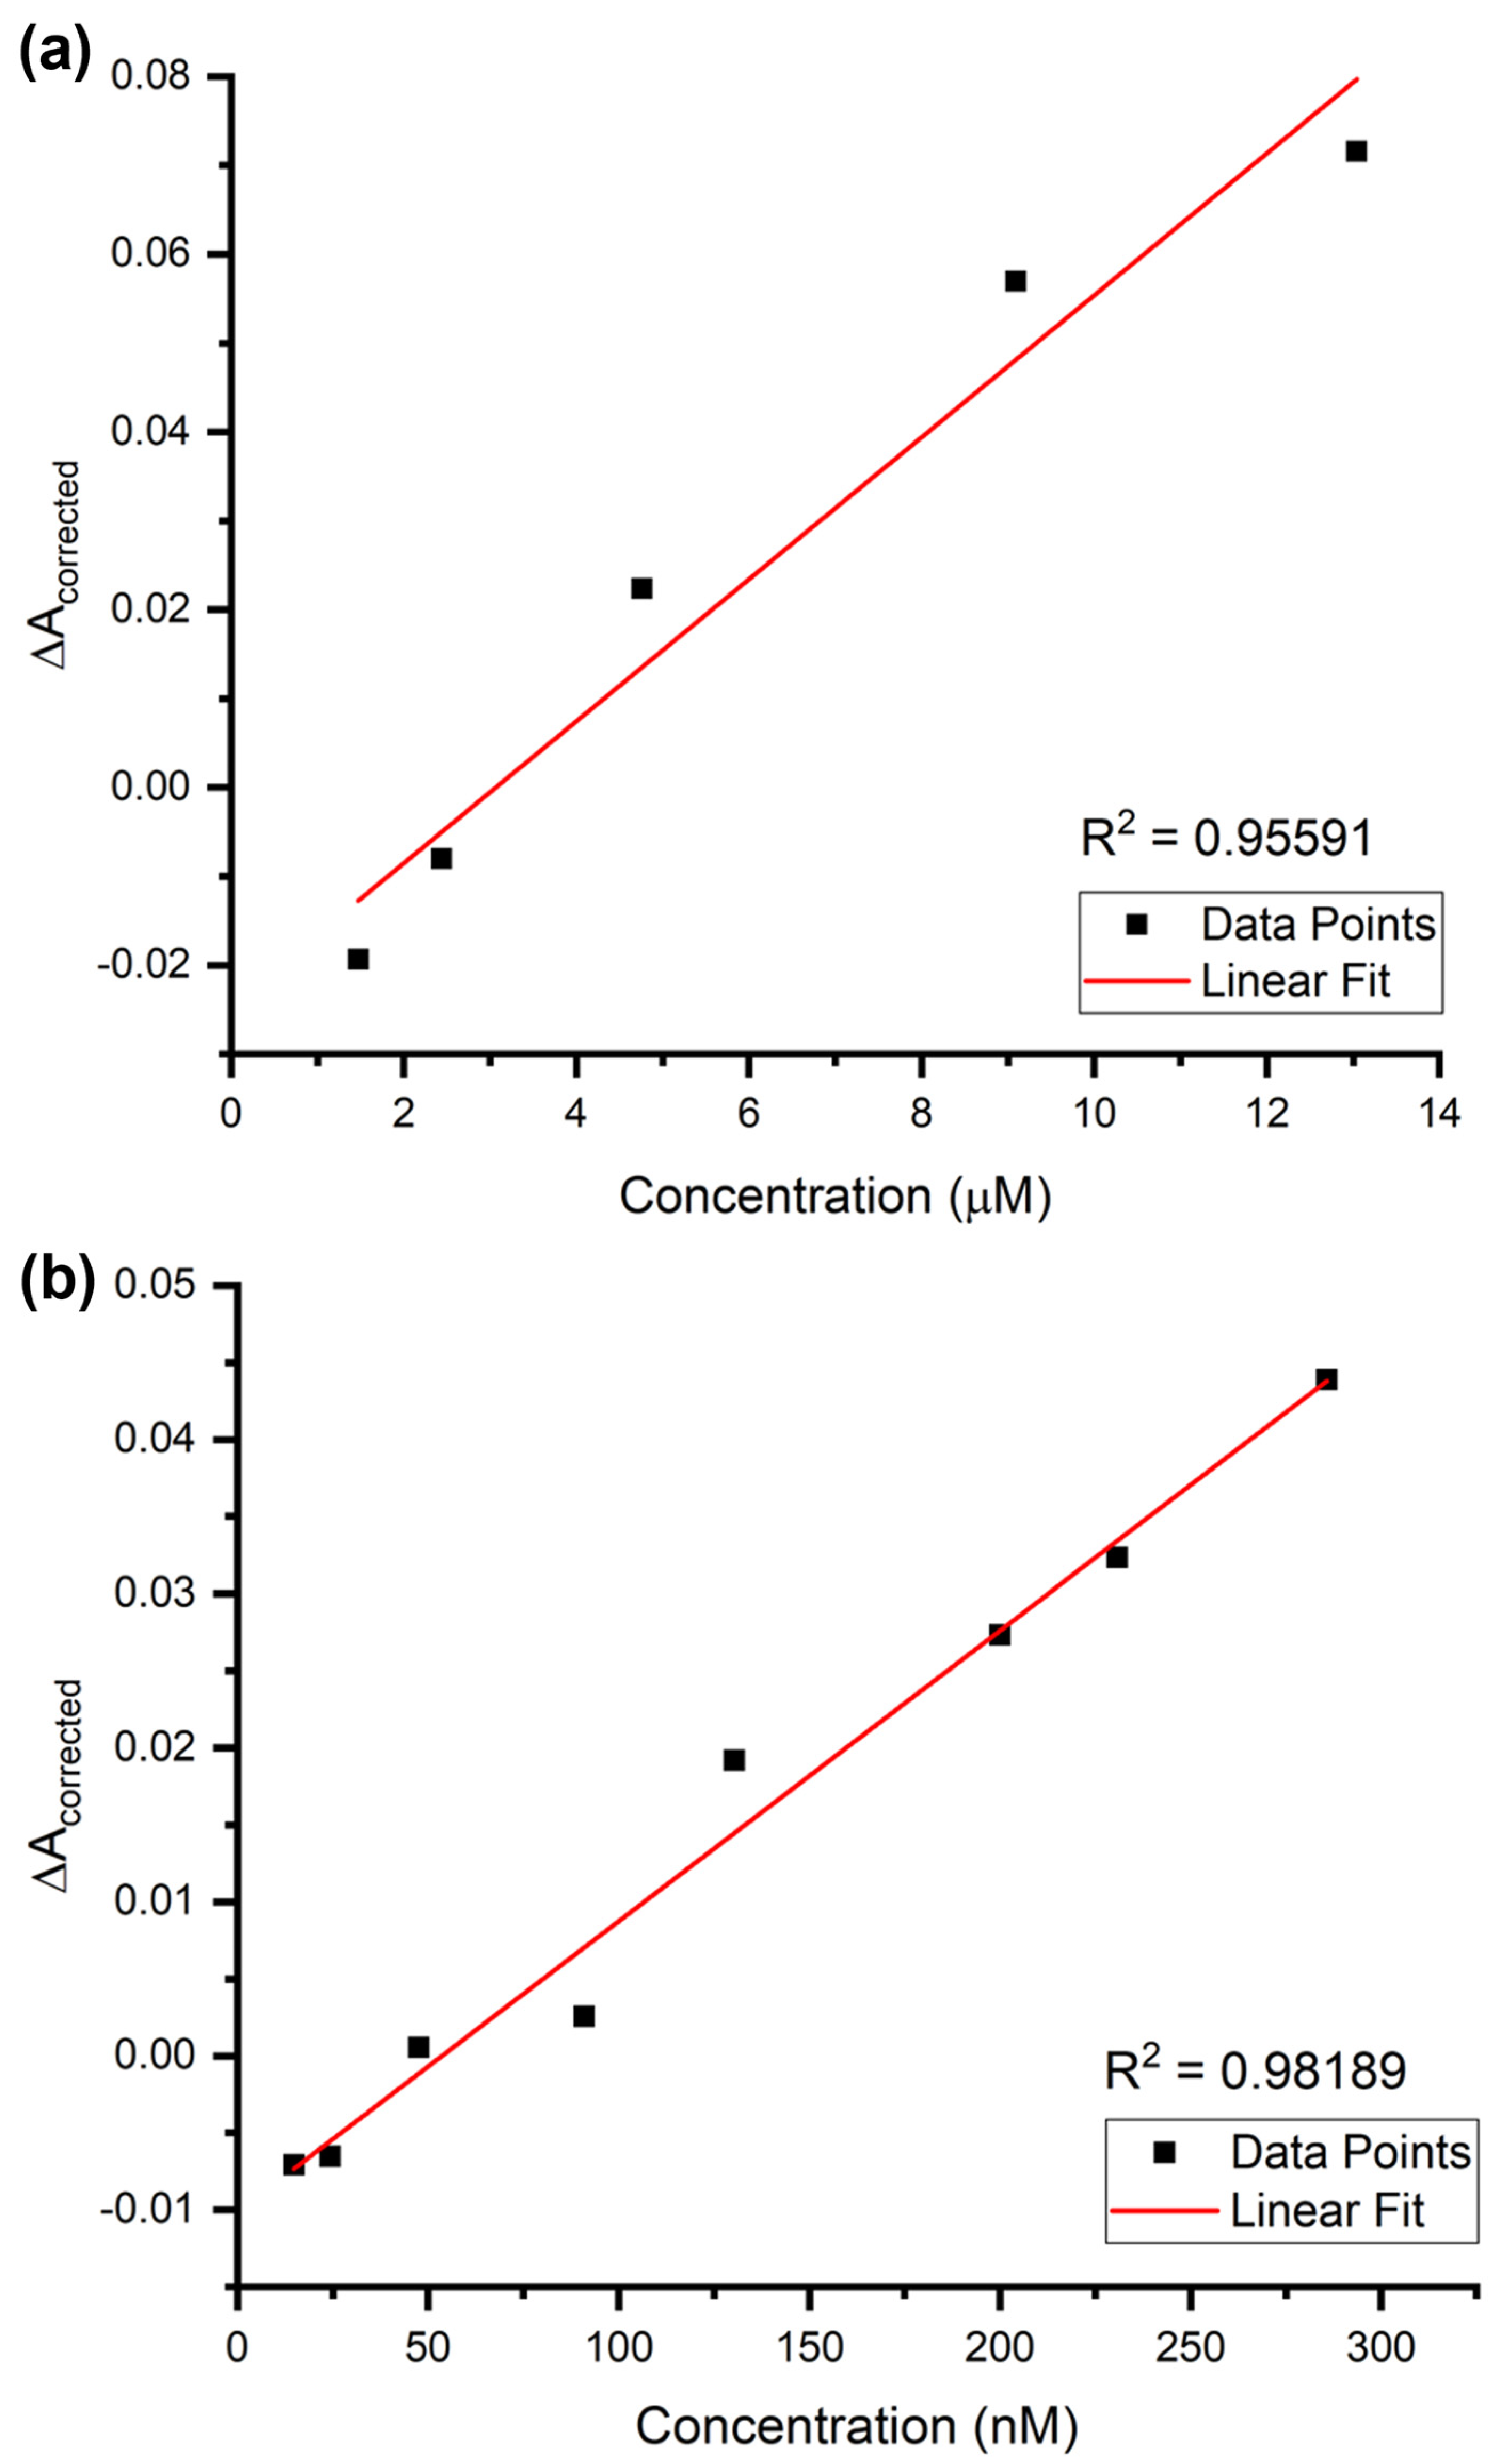
| AuNPs@GO + Epinephrine (µM) | LOD | 2.80 µM | 3.96 µM |
| LOQ | 9.34 µM | 11.99 µM | |
| R2 | 0.95591 | ||
| Slope (Sensitivity) | 0.00799 | ||
| SEintercept or Sy/x | 0.00746 | 0.00959 | |
| Best linear subrange | 1.48 to 13.04 µM | ||
| AuNPs@GO + Epinephrine (nM) | LOD | 26.55 nM | 49.09 nM |
| LOQ | 88.50 nM | 148.77 nM | |
| R2 | 0.98189 | ||
| Slope (Sensitivity) | 1.89 × 10⁻⁴ | ||
| SEintercept or Sy/x | 0.00167 | 0.00281 | |
| Best linear subrange | 14.78 to 285.71 nM | ||
| Name | Size (nm) |
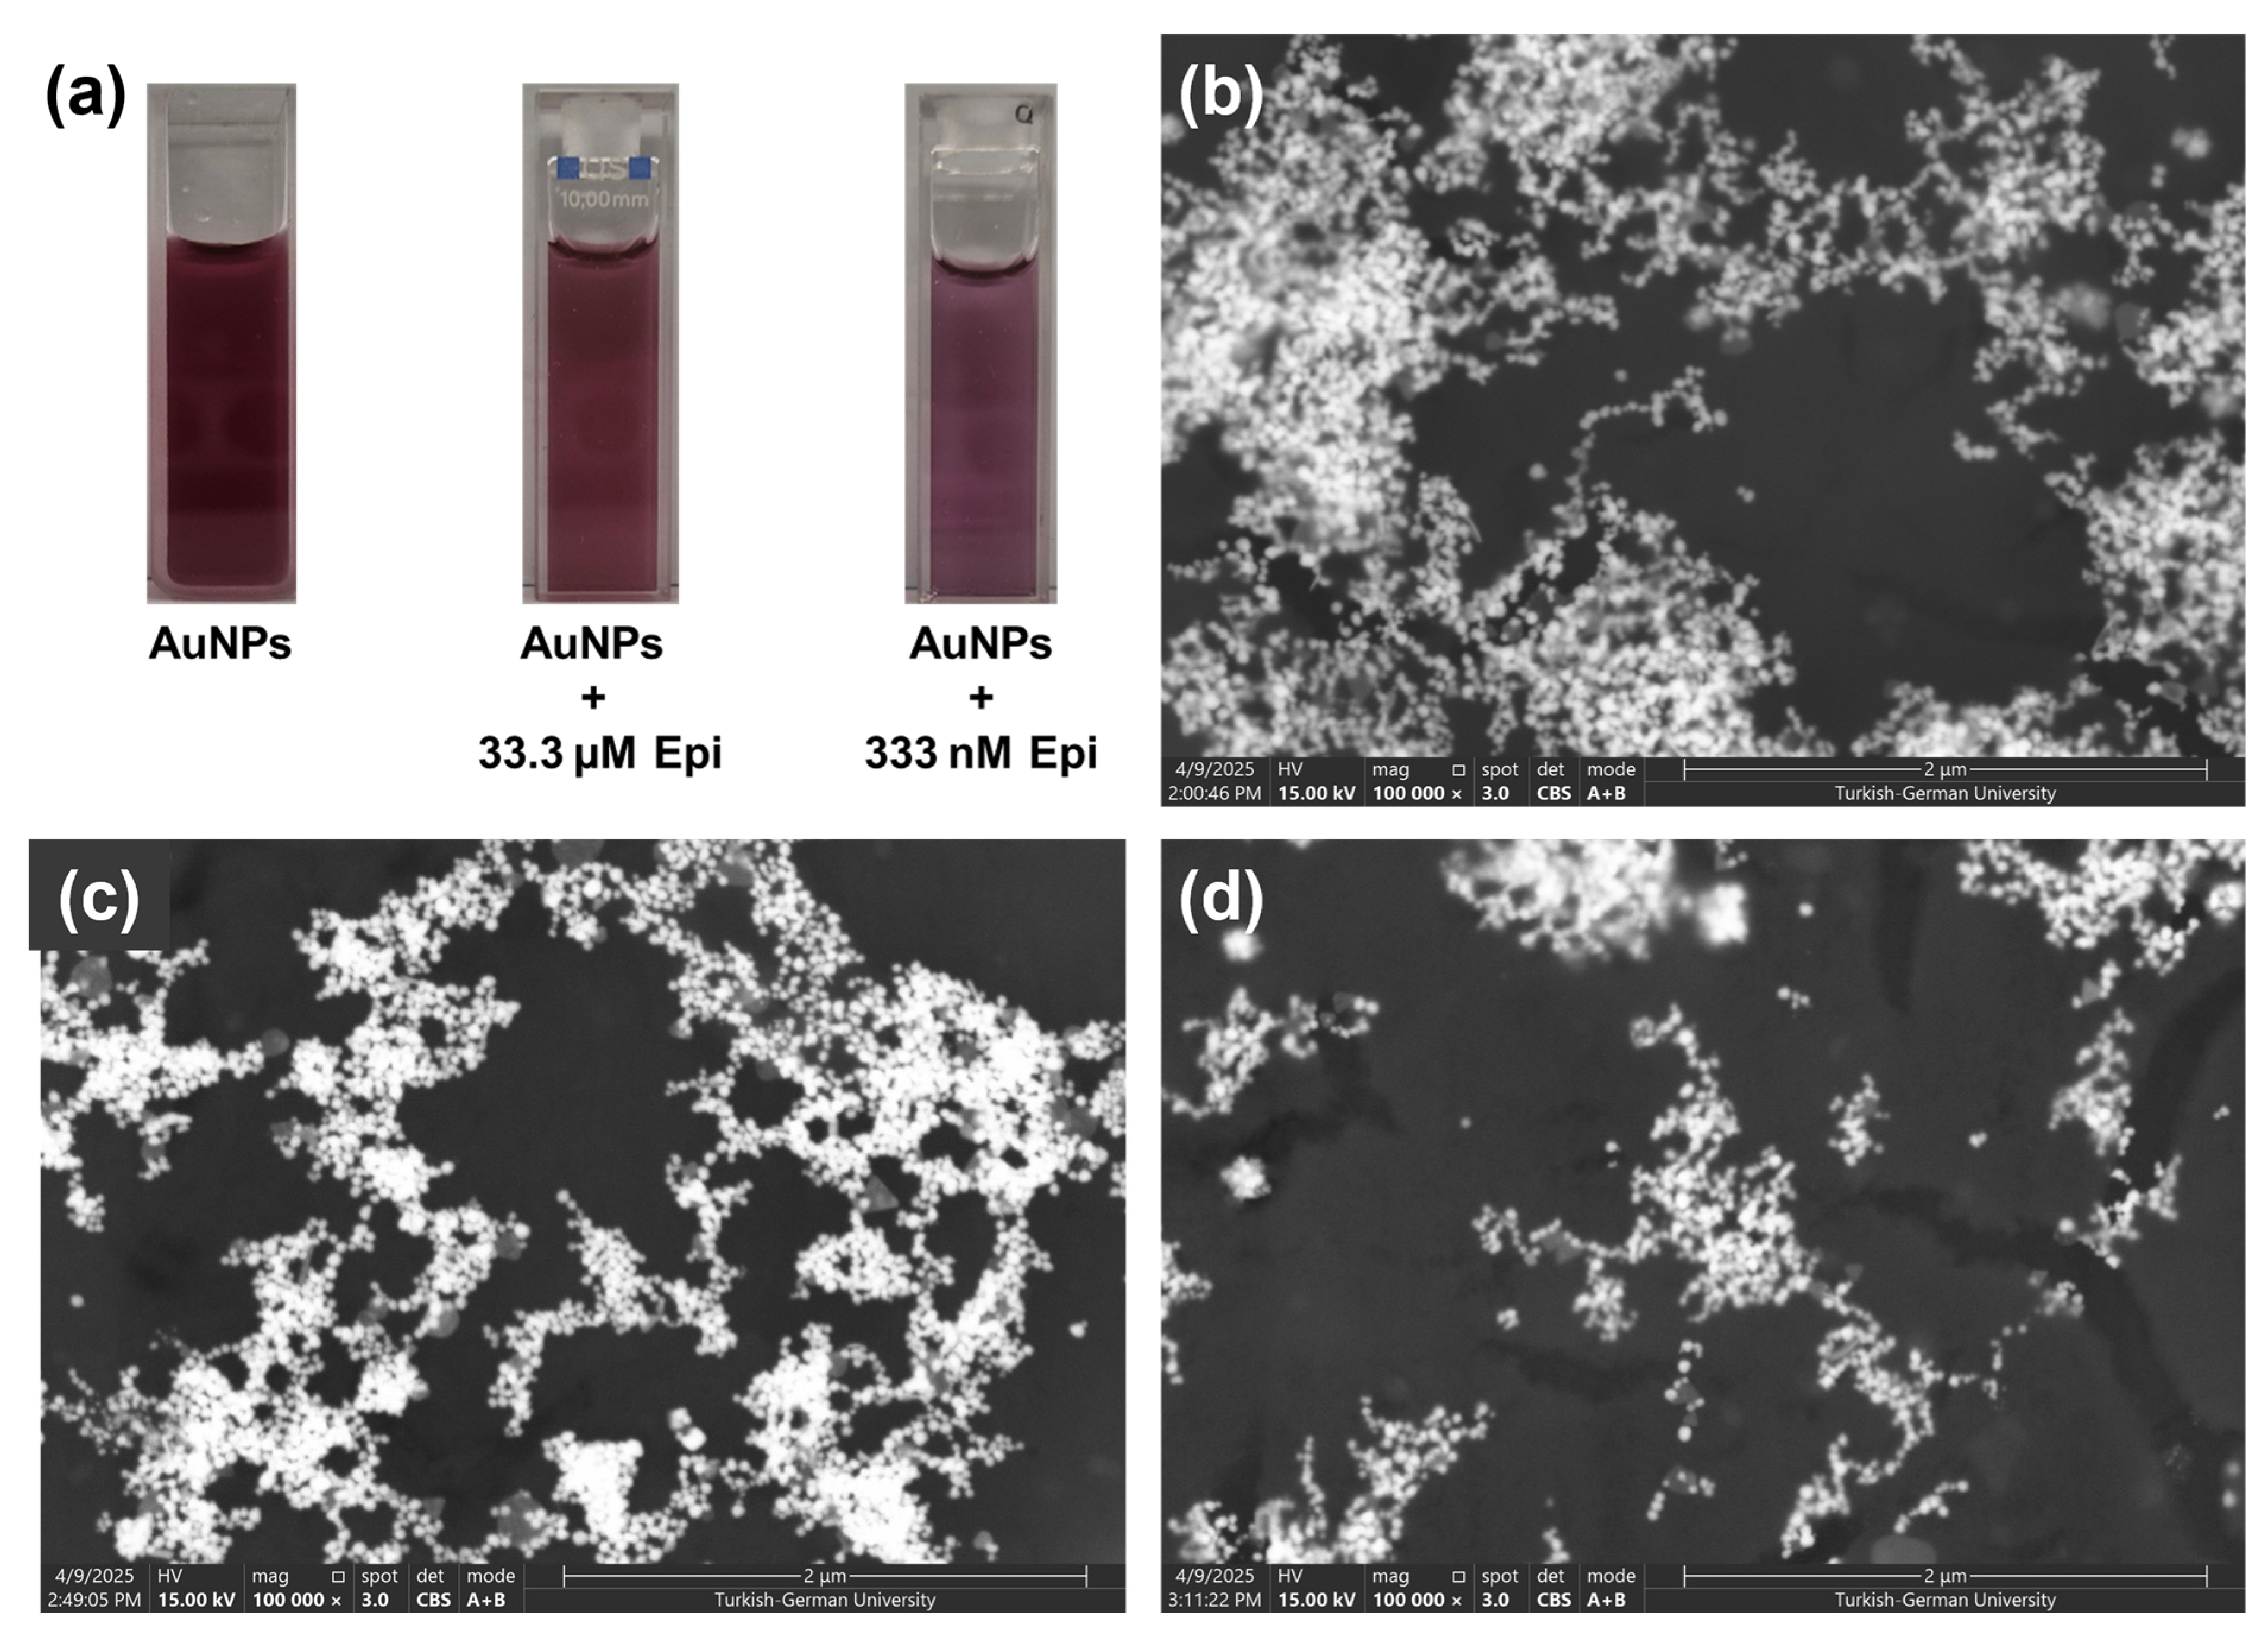
| AuNPs | 407.7 |
| AuNPs + 333 nM Epinephrine | 95.3 |
| AuNPs@GO | 476.1 |
| AuNPs@GO + 333 nM Epinephrine | 119 |
Disclaimer/Publisher’s Note: The statements, opinions and data contained in all publications are solely those of the individual author(s) and contributor(s) and not of MDPI and/or the editor(s). MDPI and/or the editor(s) disclaim responsibility for any injury to people or property resulting from any ideas, methods, instructions or products referred to in the content. |
© 2025 by the authors. Licensee MDPI, Basel, Switzerland. This article is an open access article distributed under the terms and conditions of the Creative Commons Attribution (CC BY) license (https://creativecommons.org/licenses/by/4.0/).
Share and Cite
Metin, E.; Batibay, G.S.; Aydin, M.; Arsu, N. A Sensitive Epinephrine Sensor Based on Photochemically Synthesized Gold Nanoparticles. Chemosensors 2025, 13, 229. https://doi.org/10.3390/chemosensors13070229
Metin E, Batibay GS, Aydin M, Arsu N. A Sensitive Epinephrine Sensor Based on Photochemically Synthesized Gold Nanoparticles. Chemosensors. 2025; 13(7):229. https://doi.org/10.3390/chemosensors13070229
Chicago/Turabian StyleMetin, Eyup, Gonul S. Batibay, Meral Aydin, and Nergis Arsu. 2025. "A Sensitive Epinephrine Sensor Based on Photochemically Synthesized Gold Nanoparticles" Chemosensors 13, no. 7: 229. https://doi.org/10.3390/chemosensors13070229
APA StyleMetin, E., Batibay, G. S., Aydin, M., & Arsu, N. (2025). A Sensitive Epinephrine Sensor Based on Photochemically Synthesized Gold Nanoparticles. Chemosensors, 13(7), 229. https://doi.org/10.3390/chemosensors13070229