Article

PrFeTiO5-Based Chemoresistive Gas Sensors for VOCs Detection

1
Department of Physics and Earth Sciences, University of Ferrara, Via Saragat 1/C, 44122 Ferrara, Italy
2
Laboratory of Physical-Chemistry of Applied Materials, Department of Chemistry, Faculty of Sciences Ben M’Sik, University Hassan II of Casablanca, Casablanca 20670, Morocco
3
Institute for the Study of Nanostructured Materials ISMN-CNR, Via Gobetti 101, 40129 Bologna, Italy
4
Department of Civil, Environmental, Architectural Engineering and Mathematics (DICATAM), Università degli Studi di Brescia—Via Branze 43, 25123 Brescia, Italy
5
Laboratory of Inorganic Materials for Sustainable Energy Technologies, Mohammed VI Polytechnic University (UM6P), Lot 660-Hay Moulay Rachid, Ben Guerir 43150, Morocco
*
Authors to whom correspondence should be addressed.
Chemosensors 2025, 13(7), 222; https://doi.org/10.3390/chemosensors13070222
Submission received: 15 May 2025 / Revised: 13 June 2025 / Accepted: 17 June 2025 / Published: 20 June 2025

Abstract

The development of effective, cost-efficient, and printable solid-state gas sensors for the detection of volatile organic compounds is of great interest due to their wide range of applications, spanning from real-time indoor monitoring to emerging fields such as non-invasive medical diagnostics. However, gas sensors encounter difficulties in discovering materials that have both good selectivity and sensitivity for numerous volatile organic compounds in both dry and humid settings. To expand the class of sensing materials, the current study investigates the sensing performance of solid solutions based on a rare-earth metal oxide. Pr, Fe, and Ti oxide solid solutions were produced using a solid-state technique, with thermal treatments at varied temperatures to tune their structural and functional properties. The powders were used, for the first time, to produce chemoresistive sensors, which showed promising sensing capabilities vs. ethanol, acetone, and acetaldehyde. The sensors were characterized by varying the concentration of the target gases from 1 to 50 ppm in a controlled environment, with the relative humidity ranging from 2 to 40%. The findings bring a turning point, leading to fruitful paths for the development of Pr-based solid solutions-based chemoresistive gas sensors for the detection of volatile organic compounds.

1. Introduction

The detection of volatile organic compounds (VOCs) is of particular concern due to their widespread emission from numerous sources, making their detection critical for environmental monitoring, industrial safety, and biomedical diagnostics, e.g., breath analysis [1].
Currently, reliable analytical methods, such as gas chromatography (GC) coupled with mass spectrometry (MS), can be employed for VOC monitoring. While these techniques offer high accuracy, they are often expensive, time-consuming, and not easily portable. Consequently, significant research efforts have been directed toward the development of cost-effective, rapid-response, and compact gas sensors for VOC detection [2].
Printable chemical gas sensors have emerged as a transformative technology, gathering significant attention due to advanced sensing capabilities across various applications, including smart homes, smart cities, next-generation healthcare, and industry monitoring [3]. The realization of a trillion-sensor universe will be achievable through the use of low-cost and easy-to-manufacture sensor technologies [3,4]. Printable chemoresistive gas sensors are particularly advantageous because of their good sensitivity, as well as their simple transducer/receptor design, which facilitates fabrication and miniaturization. Indeed, the principles governing gas detection are based on the interaction of gaseous molecules with a nanostructured semiconducting sensing film, which causes a measurable change in its electrical behavior. Furthermore, these sensors are typically more cost-effective and exhibit a longer operational lifetime than electrochemical sensors and other chemical-sensing technologies.
Commonly studied materials for the production of chemoresistive VOC sensors are metal oxides (MOXs) like ZnO, SnO2, Fe2O3, In2O3, WO3, and NiO [2], which have been strategically engineered to improve their sensing performance by modulating the shape and size of nanostructures [5,6,7], controlling crystal surface orientation [8,9,10,11], modifying the surface with noble metal nanoparticles or clusters [12,13,14,15,16], and introducing dopants into the metal–oxide lattice [17]. However, there remains a sustained market demand for chemoresistive gas sensors with greater control over material qualities for improved gas responsiveness and long-term reliability, as well as greater levels of detection control for the various environmental conditions envisaged in different applications [18].
This study aims to investigate a new MOX material for the production of printable sensing films to develop chemoresistive gas sensors for the detection of VOCs. The purpose is to expand the class of sensing materials by considering bi- and tri-metallic solid solutions based on a rare-earth metal. Indeed, in addition to transition and post-transition metal-based materials, rare-earth-based materials are emerging as promising sensing receptors, despite having received comparatively less attention in the literature to date. Indeed, although some pure rare-earth oxides, such as Sm2O3 [19], CeO2 [20], and Pr6O11 [21], have shown VOCs detection capabilities, their response levels are generally modest. Consequently, they are mainly used as dopants to modify the properties of transition MOXs [22] or to form solid solutions. The latter approach is particularly promising, as a solid solution would offer a significant advantage to tune the materials’ sensing properties by merging the qualities of independently sensitive MOXs and providing diverse active sites on its surface [23]. This approach has already been successfully employed to develop solid solutions, such as (Sn,Ti,Nb)xO2 [24] and SnO2/ZnO composites [25], with selectivity toward ethanol. According to our knowledge, Ce, Sm, and Eu are the most commonly investigated rare-earth elements in the formation of composite materials for sensing [26,27,28,29,30,31,32,33,34,35]. Therefore, we focused on a different rare-earth element, namely Praseodymium (Pr), to discover a novel sensitive material and explore new research directions.
Pr6O11 showed good ethanol sensitivity as early as 1998 [21]. Ma et al. varied PrOx-sensing capabilities by developing PrFeO3 nanostructures with high acetone sensitivity and selectivity [36]. Shitu et al. confirmed acetone sensing properties of PrFeO3, despite displaying that the film resistance had a remarkable dependence on humidity [37]. Ping et al. synthesized a porous hollow sphere-structured PrFeO3 as an efficient sensing material for n-butanol detection, but the high response value to the analyte strongly decreased as the humidity increased [38]. Indeed, water molecules are commonly highly reactive and might directly interact with the MOX surface, forming hydroxyl groups (OH) and releasing electrons (e), thereby changing the active sites for target gas detection while affecting the electrical properties of the film [24,38]. Minimizing the impact of water molecules on gas sensor performance is crucial for ensuring accurate and reliable measurements, as humidity is a major environmental interferent. The inclusion of Ti in solid solutions has shown promising results in achieving this objective. For instance, the minimal effect of humidity on selective detection of ethanol was displayed by SnO2–TiO2 [39] and (Sn,Ti,Nb)xO2 solid solutions [24]. The fundamental role of Ti on this effect was experimentally demonstrated by Spagnoli et al. through operando diffuse reflectance infrared Fourier spectroscopy investigations on the sensing mechanism of both (Sn,Ti)xO2 and Sn,Ti,Nb)xO2 [40]. Ti possesses the peculiar property of promoting non-dissociative adsorption of H2O through hydrogen bonds rather than redox reactions, hence limiting the formation of hydroxyl groups over the surface [40]. This mechanism would have the important advantage of reducing the effect of ambient humidity on the Pr-based solid solution film baseline and sensing properties.
Motivated by these findings, the current study examines the sensing capabilities of a newly synthesized solid solution based on Pr, Fe, and Ti oxides. Notably, the PrFeTiO5 compound was synthesized in powder form by a solid-state reaction and structurally characterized for the first time by Chakir et al. in 2022 [41]. Optimizing a solid solution for sensing purposes would involve the evaluation of multiple variables, which in this case, are primarily the activation temperature of the solid-state reaction and the relative proportions of the metal precursors. As a preliminary investigation, we focused on the effect of temperature on the morphology, crystal structure, and sensing capabilities of Pr, Fe, and Ti oxide-based solid solutions. The highest synthesis temperature employed, 1200 °C, was adopted from the procedure reported in [41] to obtain PrFeTiO5. However, our previous study demonstrated that this temperature led to micro-sized structures due to coarsening processes. Since nano-structurization enhances the surface-to-volume ratio, typically improving sensor response by increasing the available surface for gas interaction, the synthesis temperature was also reduced to 1000 °C and 800 °C to promote the formation of nanostructured powders.
The material is proposed for the detection of ethanol, acetone, and acetaldehyde, which are VOCs of particular interest since they can significantly contribute to indoor air pollution and are associated with a range of health effects, from mild irritations to serious, chronic illnesses. Indeed, ethanol vapor may cause dizziness, headache, and nausea; acetone can irritate the throat, nose, and eyes [2]; and acetaldehyde is classified as a carcinogenic pollutant [42]. In industrial production, such as in biofuel production [43], VOCs frequently coexist and may form a toxic or explosive mixture [2]. In medical diagnostics, ethanol is commonly used as a biomarker for alcohol consumption [44], while acetone can serve as an indicator of diabetes [45]. Moreover, they represent three distinct classes of VOCs: alcohols, ketones, and aldehydes.
Therefore, the characterization of the new sensors proposed in this work includes (i) testing toward the three selected analytes, namely ethanol, acetone, and acetaldehyde, in a wide range of concentrations (1–50 ppm), (ii) evaluation of selectivity against commonly reactive gases such as NH3, H2, and CO, as well as (iii) assessment of interference from gases typically present in high concentrations in ambient air, namely CO2 and H2O. The purpose is to establish a new background for the application of solid solution based on Pr with the addition of transition MOXs for the production of chemoresistive VOC sensors.

2. Materials and Methods

2.1. Chemicals

The chemicals used for the synthesis were praseodymium oxide (Pr6O11, 99.9%, iron(III) oxide (Fe2O3, 99.9%), and titanium dioxide (TiO2, 99%). All chemicals were purchased from Sigma-Aldrich (Casablanca/Morocco)

2.2. Synthesis of PrFeTiO5

PrFeTiO5 polycrystalline was synthesized using a solid-state reaction method in ambient atmospheric conditions [41]. The starting materials, Pr6O11, Fe2O3, and TiO2, were mixed in stoichiometric proportions using an agate mortar to ensure homogeneity. Based on the 1:1:1 molar ratio of Pr:Fe:Ti in the final compound, the corresponding molar ratio of the starting oxides was Pr6O11:Fe2O3:TiO2 = 1:3:6. Three separate mixtures were prepared, each corresponding to a different synthesis temperature. Each sample was then subjected to heat treatment at a specific temperature: 800 °C, 1000 °C, and 1200 °C. In order to ensure a complete reaction between the precursor materials, the heating process was performed for 24 h in an open-air muffle furnace, allowing for adequate oxidation and phase formation. After heating, the furnace was cooled to room temperature (RT), and the powders of each sample were collected. These were labelled according to the powder’s treatment temperature, namely PFT-800, PFT-1000, and PFT-1200, for samples based on materials heated at 800, 1000, and 1200 °C.

2.3. Film Deposition and Sensor Development

The resulting powders were added to a solution mixed with α-terpineol and ethylcellulose to form a homogeneous paste and then screen-printed onto alumina substrates with interdigitated gold electrodes on the top side, which act as an electrical contact to assess the functional film’s electrical properties. The screen-printing mask had a mesh size of about 250, while the thickness of the film ranged from 20 to 30 μm [46]. The film’s surface covered an area of 1 × 1.5 mm2. The sensing layer of the devices was thermally activated by a platinum heater on the rear side. The films were sintered for 2 h at 650 °C in a muffle furnace in the presence of air to remove the organic precursors used in the screen-printing paste formulation and to improve the mechanical stability and film adhesion to the substrate. Finally, the devices were packaged by soldering the four contacts with 0.06 mm gold wires to a TO-39 support with a wedge wire bonder. Figure S1a,b (Supporting Information) illustrate a schematic of the sensor’s front and rear sides, respectively, while Figure S1c shows a picture of the finally assembled device.

2.4. Materials and Functional Films Characterization

The structure, morphology, chemical composition, and optical properties of the samples were characterized using the techniques described below.
X-ray powder diffraction (XRPD) data were collected using a Bruker D8 Advance Da Vinci powder diffractometer (Bruker, Karlsruhe, Germany) operating in Bragg–Brentano geometry and equipped with Cu radiation and a LynxEye XE silicon strip detector. Samples were placed over a zero-background sample holder, and a knife perpendicular to the sample was placed at a suitable distance from the sample surface to reduce the air-induced scattering. The samples were scanned at RT in a continuous mode from 3 to 120° 2θ with a step size of 0.02° 2θ and a counting time of 2 s per step. The qualitative phase identification was conducted using the EVA software v.6.0 (Bruker), and the XRPD patterns obtained were refined using the Rietveld method (TOPAS v.5.0, Bruker).
The morphology and homogeneity of both the powders and the screen-printed sensing films were investigated by scanning electron microscopy (SEM) using a Zeiss LEO 1530 FEG microscope (Carl Zeis, Oberkochen, Germany), equipped with an Oxford Inst. INCA 250 30 mm2 SSD with X-Ray energy-dispersive spectrometry (EDS) for compositional analysis.
The most promising sample, namely PFT-1200, was prepared for observation in the high-resolution transmission electron microscope (HRTEM). A cross-section of the sample sintered at 1200 °C was prepared by a Ga-ion-focused ion beam (FIB) in a ZEISS Crossbeam 340 dual-beam FIB-SEM system. The electron-transparent lamella was observed in a TECNAI F20 TEM, operated at 200 kV, and capable of compositional analysis at high spatial resolution with the scanning–TEM imaging (STEM) mode combined with EDS.
Optical measurements were performed in the ultra-violet–visible–near-infrared (UV-Vis-NIR) range by using a JASCO V770 spectrophotometer (JASCO EUROPE S.R.L. Milan, Italy) operating in diffuse reflectance (200–2500 nm range, 1 nm step size, BaSO4 integrating sphere, a Spectralon diffuse reflectance target as a white reference material). Reflectance (R∞) was converted to absorbance ( K S ) by the Kubelka–Munk equation:
K S = 1 R 2 · 2 R 1
The bandgap of the powders was calculated by using Tauc’s method for direct band gaps.

2.5. Gas-Sensing Measurements

The sensing properties of the PFT-800, PFT-1000, and PFT-1200 were investigated by placing the devices in a customized apparatus containing a sealed gas test chamber and a data acquisition system. The chamber was equipped with a gas diffuser at the center, and gas sensors were positioned circularly around it. A series of mass-flow controllers (MFCs) allowed the injection of a total flow rate of 500 sccm (standard cubic centimeters) inside the gas test chamber, which, considering its volume of 622 cm3, can be filled in 1 min 15 s. The temperature and relative humidity (RH%) inside the chamber were measured by a commercially available Honeywell HIH-4000 sensor, and the outer temperature of the chamber was maintained at 25 °C by placing it inside a climatic box. Please, for the experimental apparatus schematization, refer to Ref. [46].
The optimized working temperature of the sensor was estimated by comparing the response to 5 ppm of ethanol at increasing working temperatures ranging from 350 to 450 °C. In order to obtain the sensor baseline stabilization, the devices were exposed to synthetic dry air (20% O2 and 80% N2) for almost one day at their working temperature. The sensors’ calibration in dry conditions was obtained by exposing them to several concentrations (1, 5, 10, 20, and 50 ppm) of ethanol, acetone, and acetaldehyde, fluxed from certified cylinders (N 5.0 degree of purity).
The sensor response ( R ) was defined as [47]:
R = G g a s G a i r G a i r
where G g a s and G a i r are the conductance values in the presence of the analyte gas and synthetic air, respectively. Indeed, Equation (2) is used for n-type materials, in which the conductance increases after reaction with reducing gases.
The calibration curves in wet conditions and the impact of increasing RH% on the sensors’ response level to VOCs were studied by using the set-up represented in Figure S2.
For calibration curves in wet conditions, the sensors were stabilized in a flux of 17% RH @ 28 °C, and then, the target gas concentration was increased to the range of 1–50 ppm.
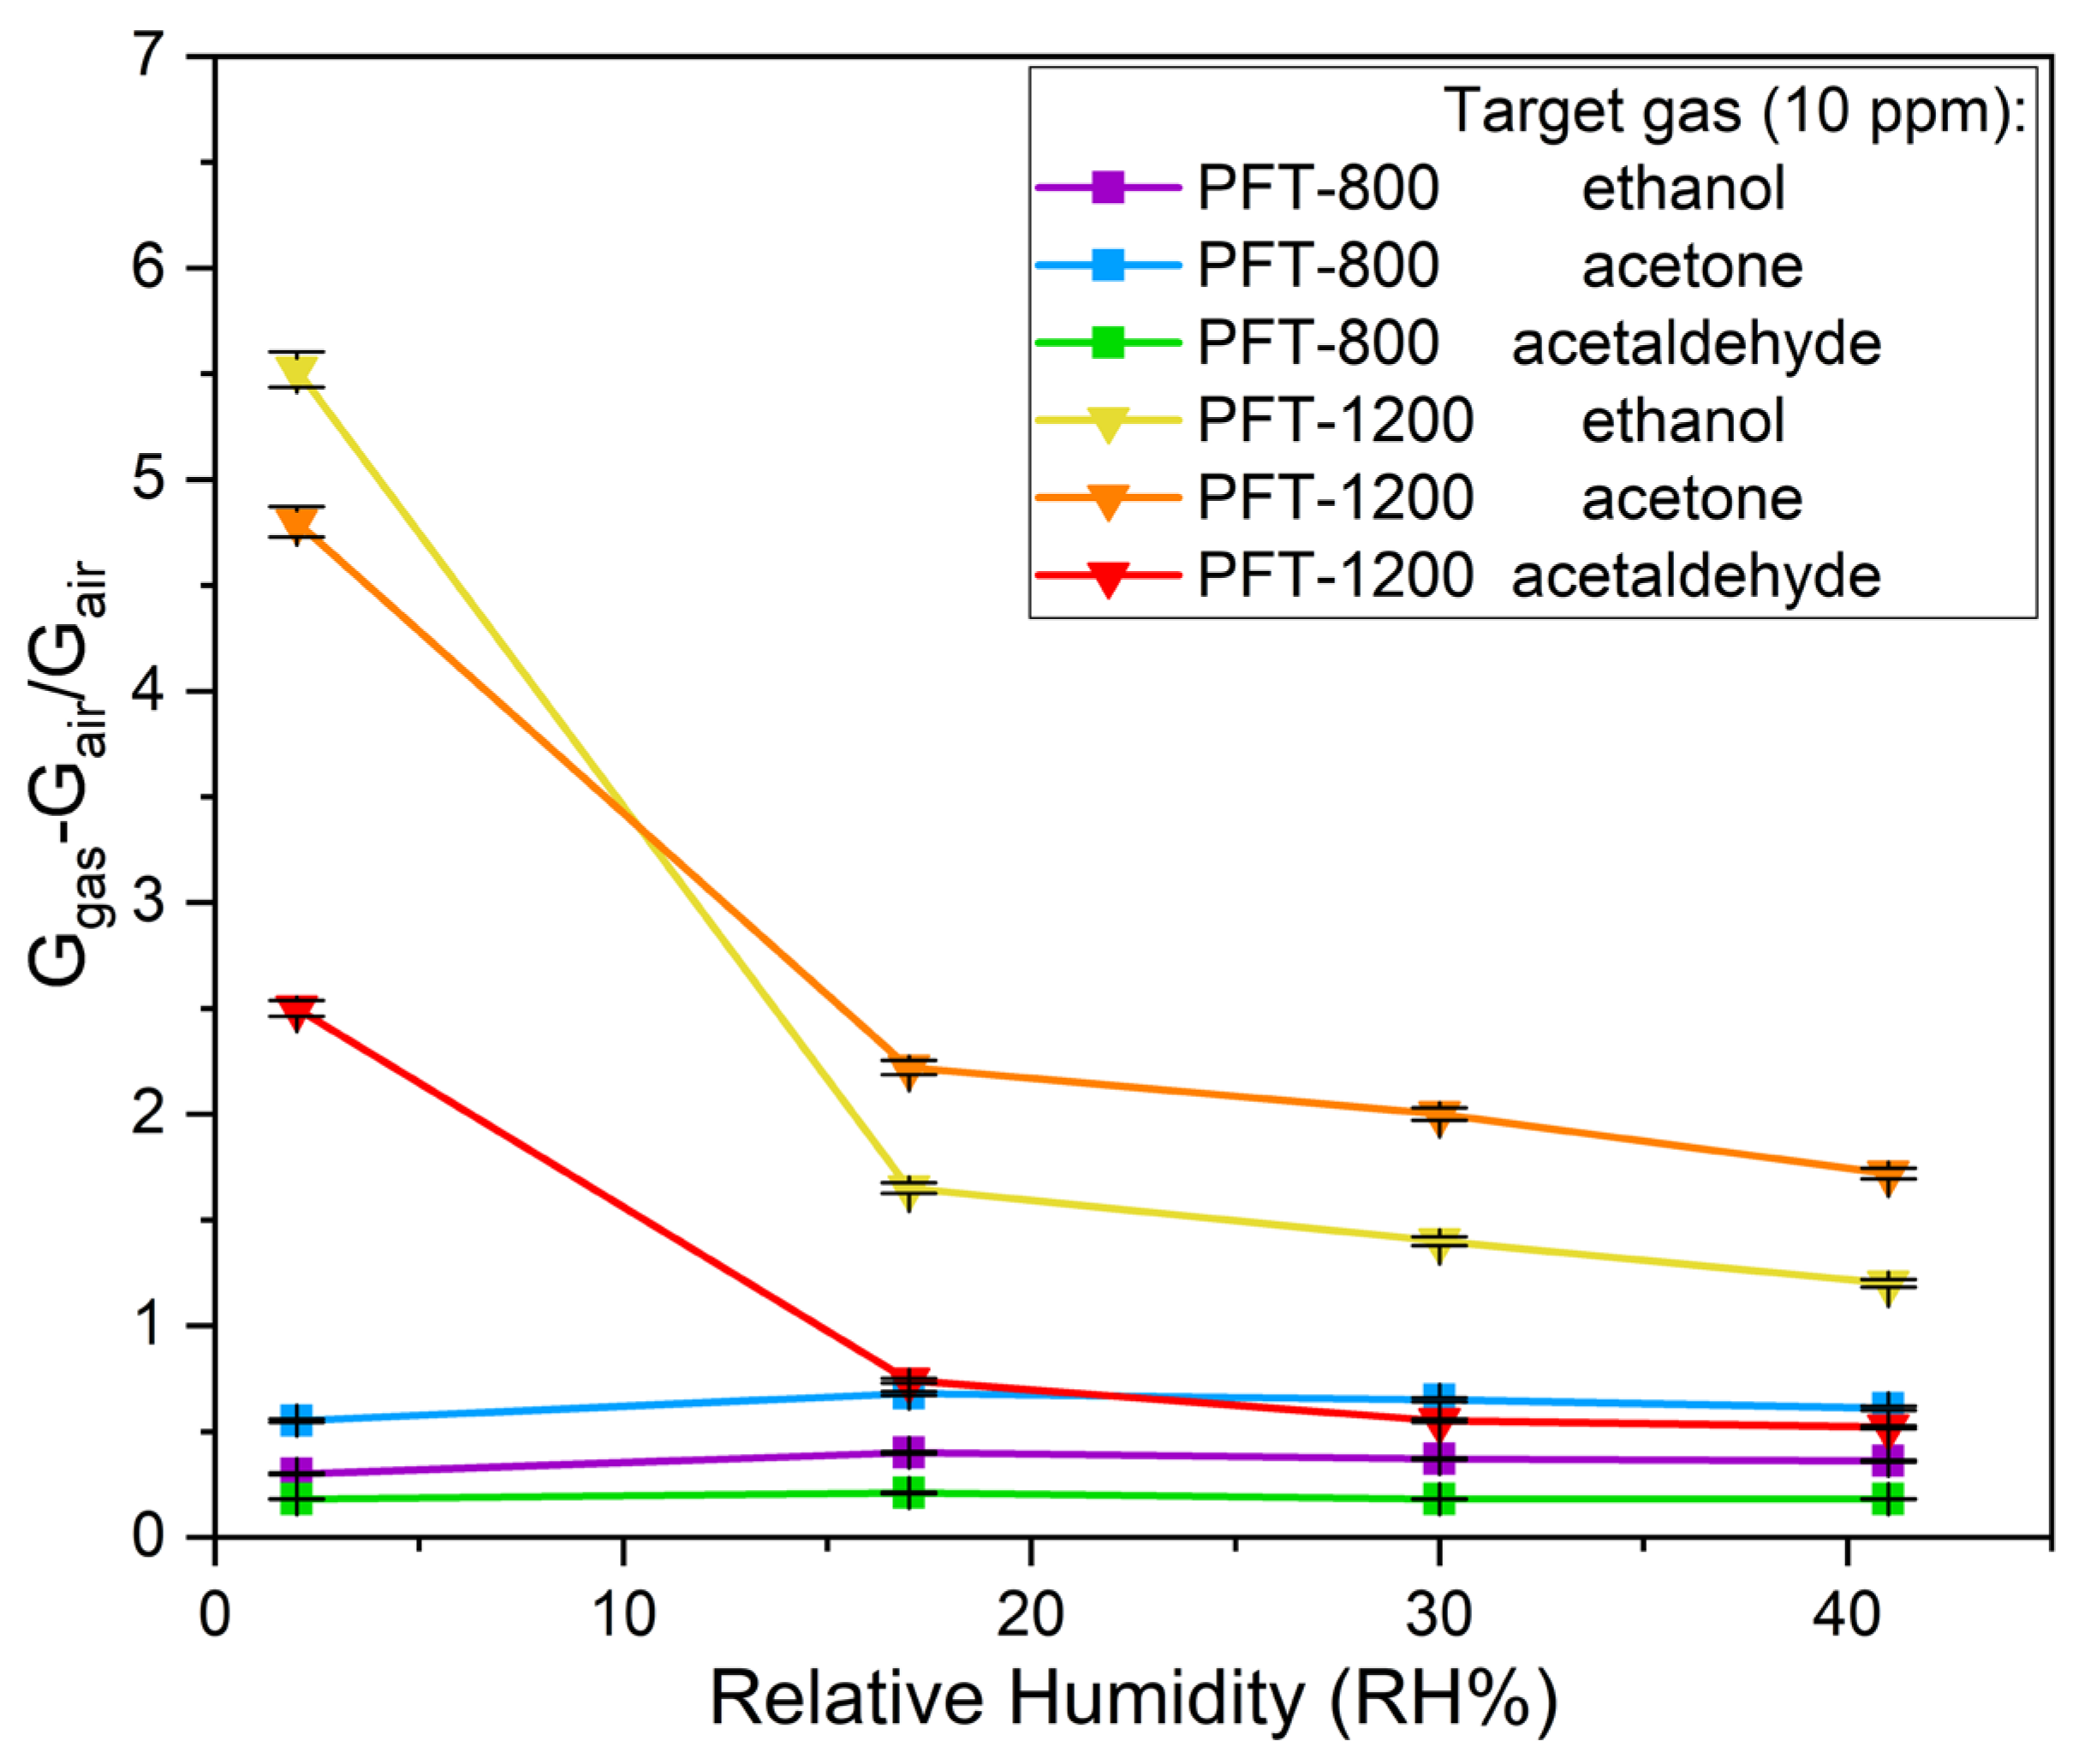
To investigate the influence of humidity on the sensors’ response, different sccm proportions of dry and wet air were used to change the humidity inside the chamber in a range of 2–41% RH, while the sccm from the VOC cylinders (ethanol, acetone, or acetaldehyde) was maintained constant to keep a concentration of 10 ppm. The maximum relative humidity reached in the sensor chamber at 28 °C, while maintaining a concentration of 10 ppm of target gas, was 41% RH. The range 17–41% RH @ 28 °C is representative of low/medium absolute humidity (AH) in real-like conditions. AH is a useful parameter to compare humidity levels in different settings, independently of temperature [48], and can be obtained from RH% using Equation (3):
R = R H × P s R w × T × 100
in which P s is the saturation vapor pressure, measured in (Pa), R w = 461.5 J/(kg⋅K) is the specific gas constant for water vapor, and T is the temperature, measured in Kelvin.
In this work, the RH range 17–41% @ 28 °C corresponds to an AH range of 4.6–11.2 g/m3, which is similar to the recommended range of indoor AH in air-conditioned buildings, namely 6.9–13.8 g/m3, corresponding to 30–60% RH @ 25 °C [49,50].
The selectivity of the sensing devices was evaluated by exposing them to commonly reactive reducing gases: 100 ppm of H2, 25 ppm of NH3, 1200 ppm of CO2, and 25 ppm of CO. The gas concentrations were chosen according to their TLV-TWA (threshold limit value-time weighted average) and the average tested values reported in the literature to cover the different chemical species and gases that are relevant for environmental monitoring [47,51,52,53,54]. The response and recovery times were determined as the time required to achieve 90% of its maximum change in conductance upon exposure of the target analyte and the time required for the signal to return to 90% of the original baseline value, respectively [24,55].

3. Results

3.1. Structural, Morphological, and Chemical Characterization

The synthesis of PrFeTiO5 involved a temperature-dependent phase evolution. The diffractogram plots of the three samples displayed in Figure S3 show that, at different synthesis temperatures (800, 1000, and 1200 °C), both the position and intensity of the peaks evolve significantly, highlighting distinct changes in the phase composition. The quantitative phase analysis and unit-cell parameters are summarized in Table S1. A progressive increase in the intensity of the target PrFeTiO5 phase (mullite-type with the general formula R2M4O10 [41]) is observed with an increasing temperature, together with a visible narrowing of the diffraction peaks, which is typically associated with a reduced full width at half maximum (FWHM) [56,57] and indicative of enhanced crystallinity and improved structural order within the sample.
In PFT-800, the PrFeTiO5 phase was still not observed. Instead, the sample consisted of Pr2Ti2O7 (45.7%), Fe2TiO5 (42.8%), and TiO2 (10.1%). This observation was consistent with the literature, which indicates that the bimetallic phases start to be formed at 800 °C due to partial reactions among Pr2O3, Fe2O3, and TiO2 precursors [58]. Both Pr2Ti2O7 and Fe2TiO5 were preferentially formed as low-temperature intermediates, owing to their lower activation energies and favorable thermodynamic stability under these synthesis conditions. When the synthesis temperature was increased to 1000 °C, the PrFeTiO5 phase began to appear (14.0%), accompanied by a reduction in the amount of Pr2Ti2O7 (41.1%) and Fe2TiO5 (41.3%), suggesting their consumption in the transformation towards the target phase. Moreover, a small amount of Pr2O3 (3.7%) was detected. Studies have demonstrated that Pr2Ti2O7 decomposes at higher temperatures [58,59], releasing components that react with Fe-containing phases to form PrFeTiO5. At 1200 °C, the reaction reached near completion, yielding PrFeTiO5 as the dominant phase (84.4%) with minimal residual Pr2Ti2O7 (10.2%) and Fe2TiO5 (5.3%). This transformation is driven by the enhanced cation mobility and increased thermodynamic stability of PrFeTiO5 at high temperatures [58]. Such conditions promote site ordering and phase purity, as predicted by Rietveld refinement models [41]. Thus, the crystallization pathway is governed not only by thermodynamics but also by diffusion kinetics and local cation site preferences, with 1200 °C identified as the optimal condition for achieving high-purity and well-crystallized PrFeTiO5.
The annealing temperature influenced not only the crystallographic phase evolution but also the shape and dimensions of the materials, as evidenced by the SEM images of PFT-800, PFT-1000, and PFT-1200 powders in Figure 1. Figure 1a shows that the sample annealed at 800 °C was characterized by nanograins with diameters in the range of 100–200 nm. On the other hand, the nanostructures composing PFT-1000 exhibited a shapeless morphology (Figure 1b) resulting from the coalescence of grains induced by the elevated temperature of 1000 °C. The degree of sintering further increased when the powders were treated at 1200 °C, promoting extensive grain growth and densification, producing compact and dense microstructures. The surface of a single micrometer-sized particle is shown in Figure 1c, with a few smaller fragments lying over it.
The SEM images in Figure S4 display that the screen-printing deposition resulted in uniform sensing films.
EDS analyses were performed to estimate the elemental composition of the samples. No impurities were found in all of the compounds, which displayed comparable atomic % of Ti, Fe, and Pr.
The phase transition to PrFeTiO5 mixed oxide upon treatment at 1200° was observed from the steep grain coarsening, as well as the modification in the crystalline arrangement. Indeed, HRTEM imaging combined with electron diffraction analysis shows the high degree of ordering in the PFT-1200 mixed oxide, with large domains featuring a single-crystal arrangement.
Figure 2a highlights the presence of systematic rows of diffraction peaks in the electron diffraction pattern, demonstrating the highly ordered structure of the sample PFT-1200, and the TEM image, Figure 2b, shows that the single crystalline domains largely exceed the measure of one micrometer and that the grain boundaries are straight and well defined, as a consequence of large grain growth promoted by the phase transformation. Three differently oriented domains are visible in the figure, separated by boundaries joining at a point at the center of the picture. The bright horizontal lines are artifacts caused by uneven sample thinning with the Ga beam of the FIB. Figure 2c shows that the single crystal maintains the highly ordered structure, with high visibility for the contrast fringes, arising from the diffraction of the 122 lattice planes with a specific distance d122 = 0.231 nm, up to the grain termination, as the lattice fringes visibly extend to the surface. No evidence of amorphous or secondary oxide phases was recorded at the surface of PrFeTiO5 crystals.
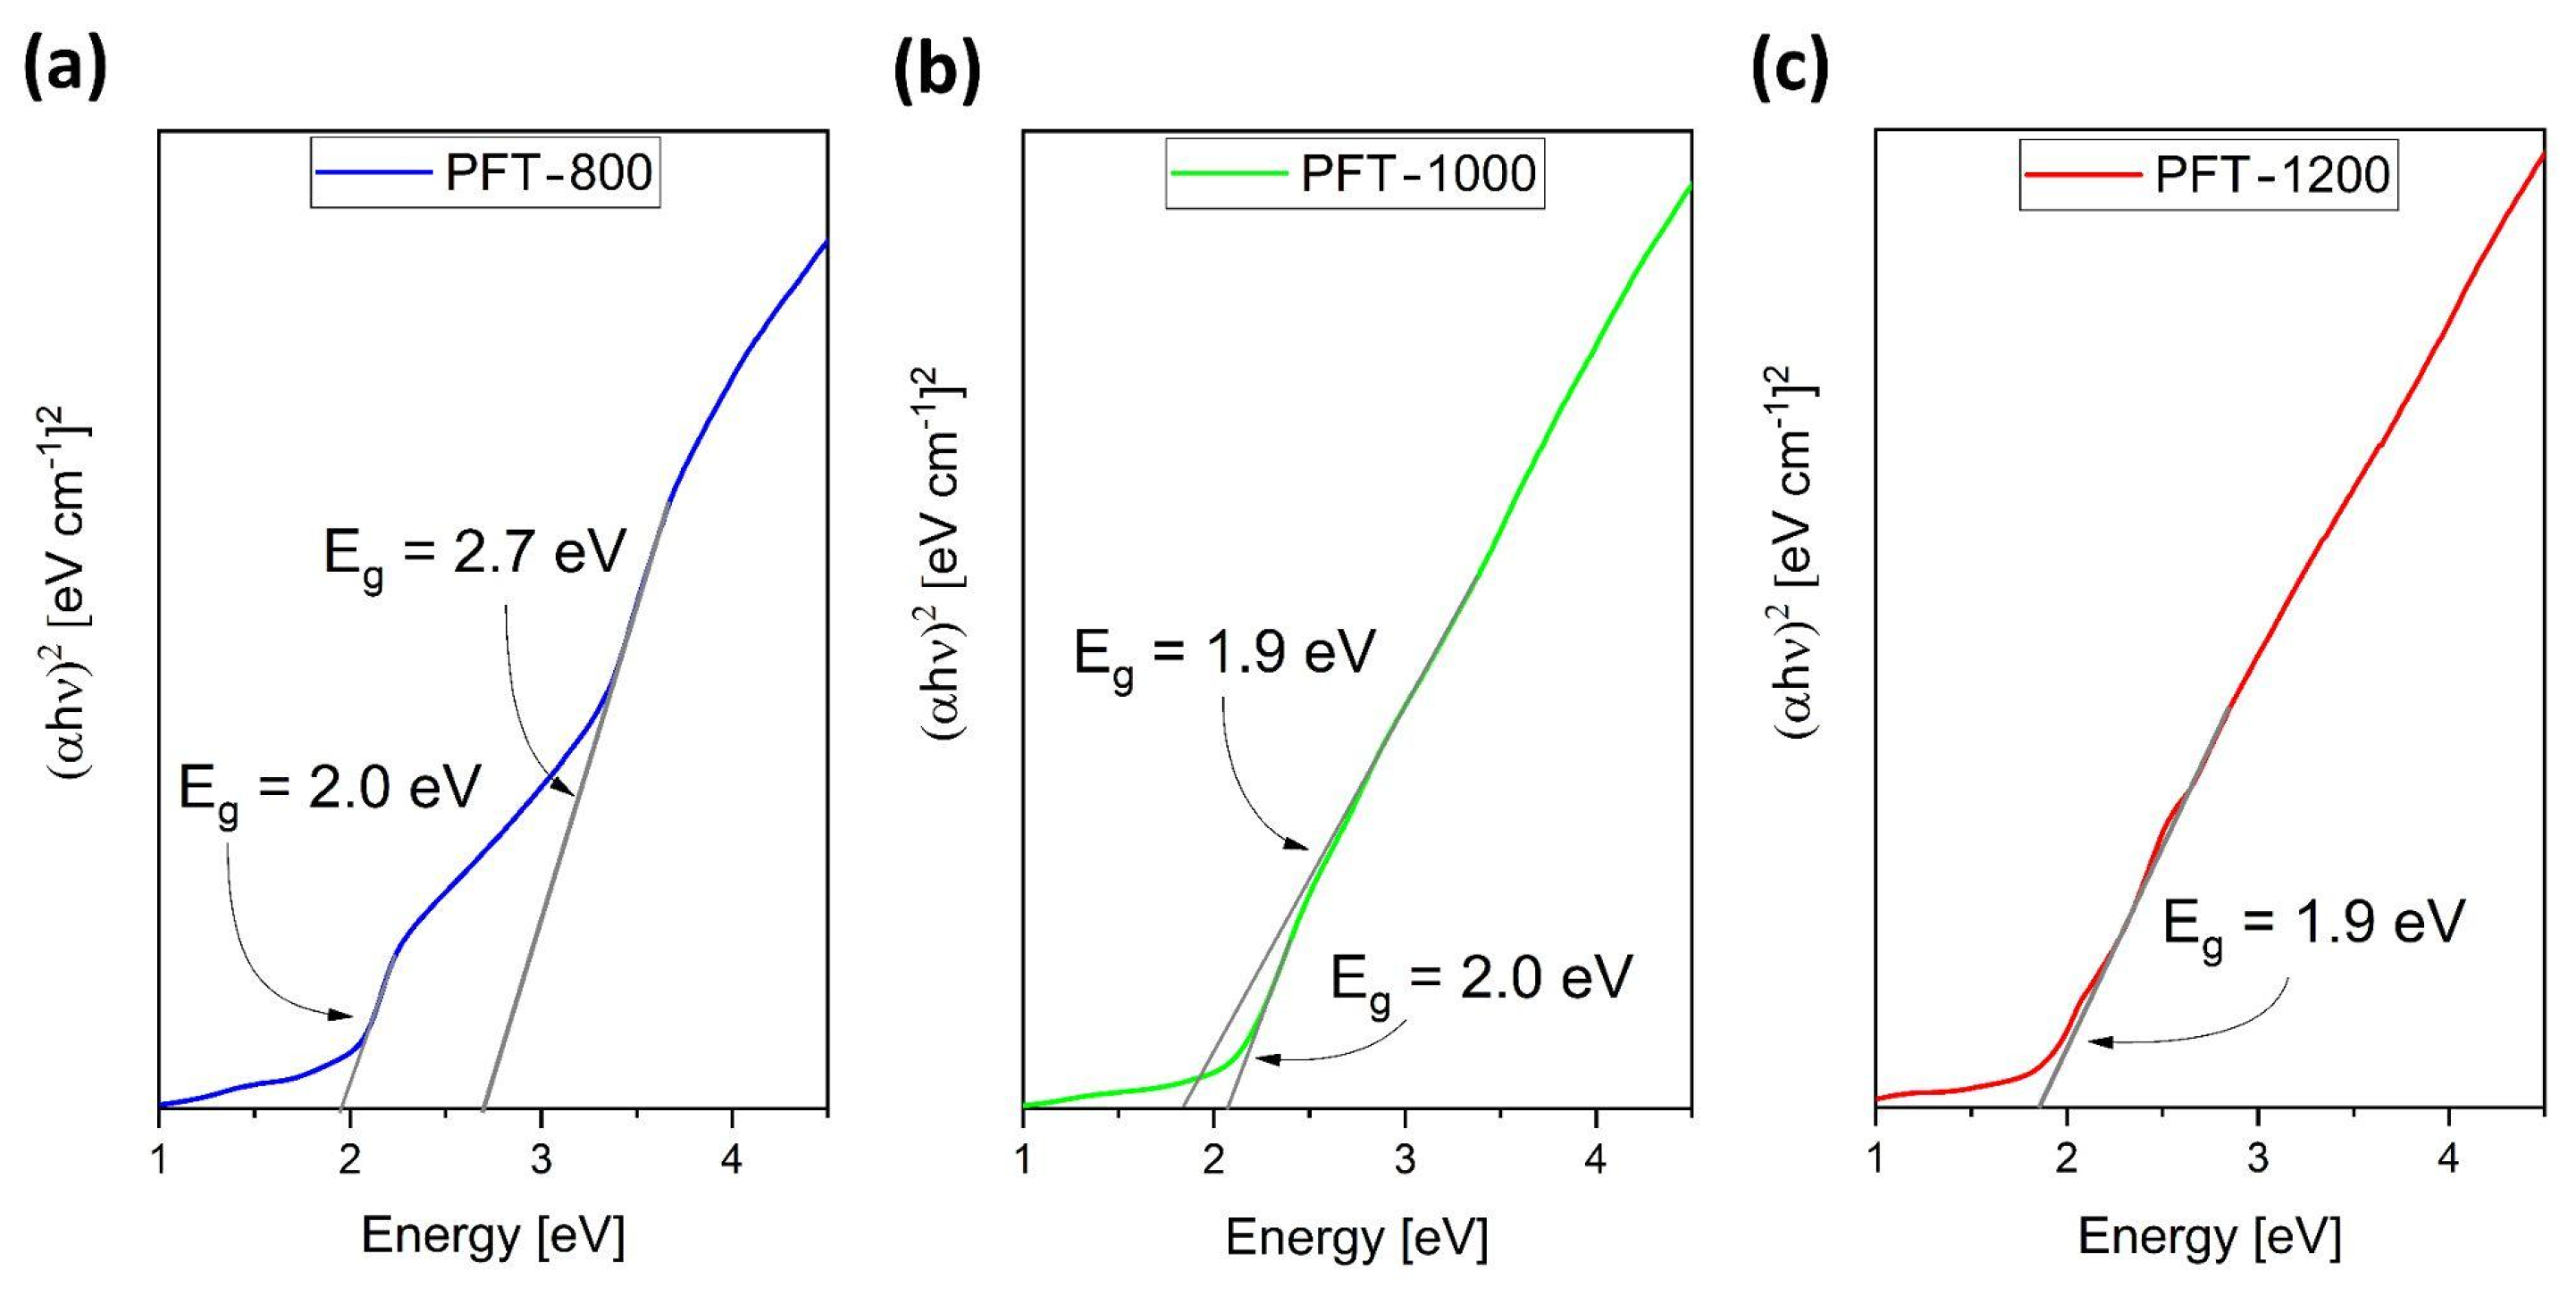
The UV–Vis–NIR absorption spectra of fired powders are shown in Figure S5. The optical band-gap energy (Eg) was estimated by using Tauc’s plot method (see Figure 3). For the PFT-800, two distinct Eg can be identified: the one at 2.7 eV is attributed to Pr2Ti2O7 [58], while the one at 2.0 eV is associated with Fe2TiO5 [60]. The 2.0 eV Eg is also observed in PFT-1000, which has a significant fraction of Fe2TiO5. Furthermore, an Eg of 1.9 eV was discovered, which is attributable to the formation of PrFeTiO5. In the sample PFT-1200, only the band gap of 1.9 eV is visible, owing to the larger contribution of PrFeTiO5.

3.2. Gas-Sensing Performance

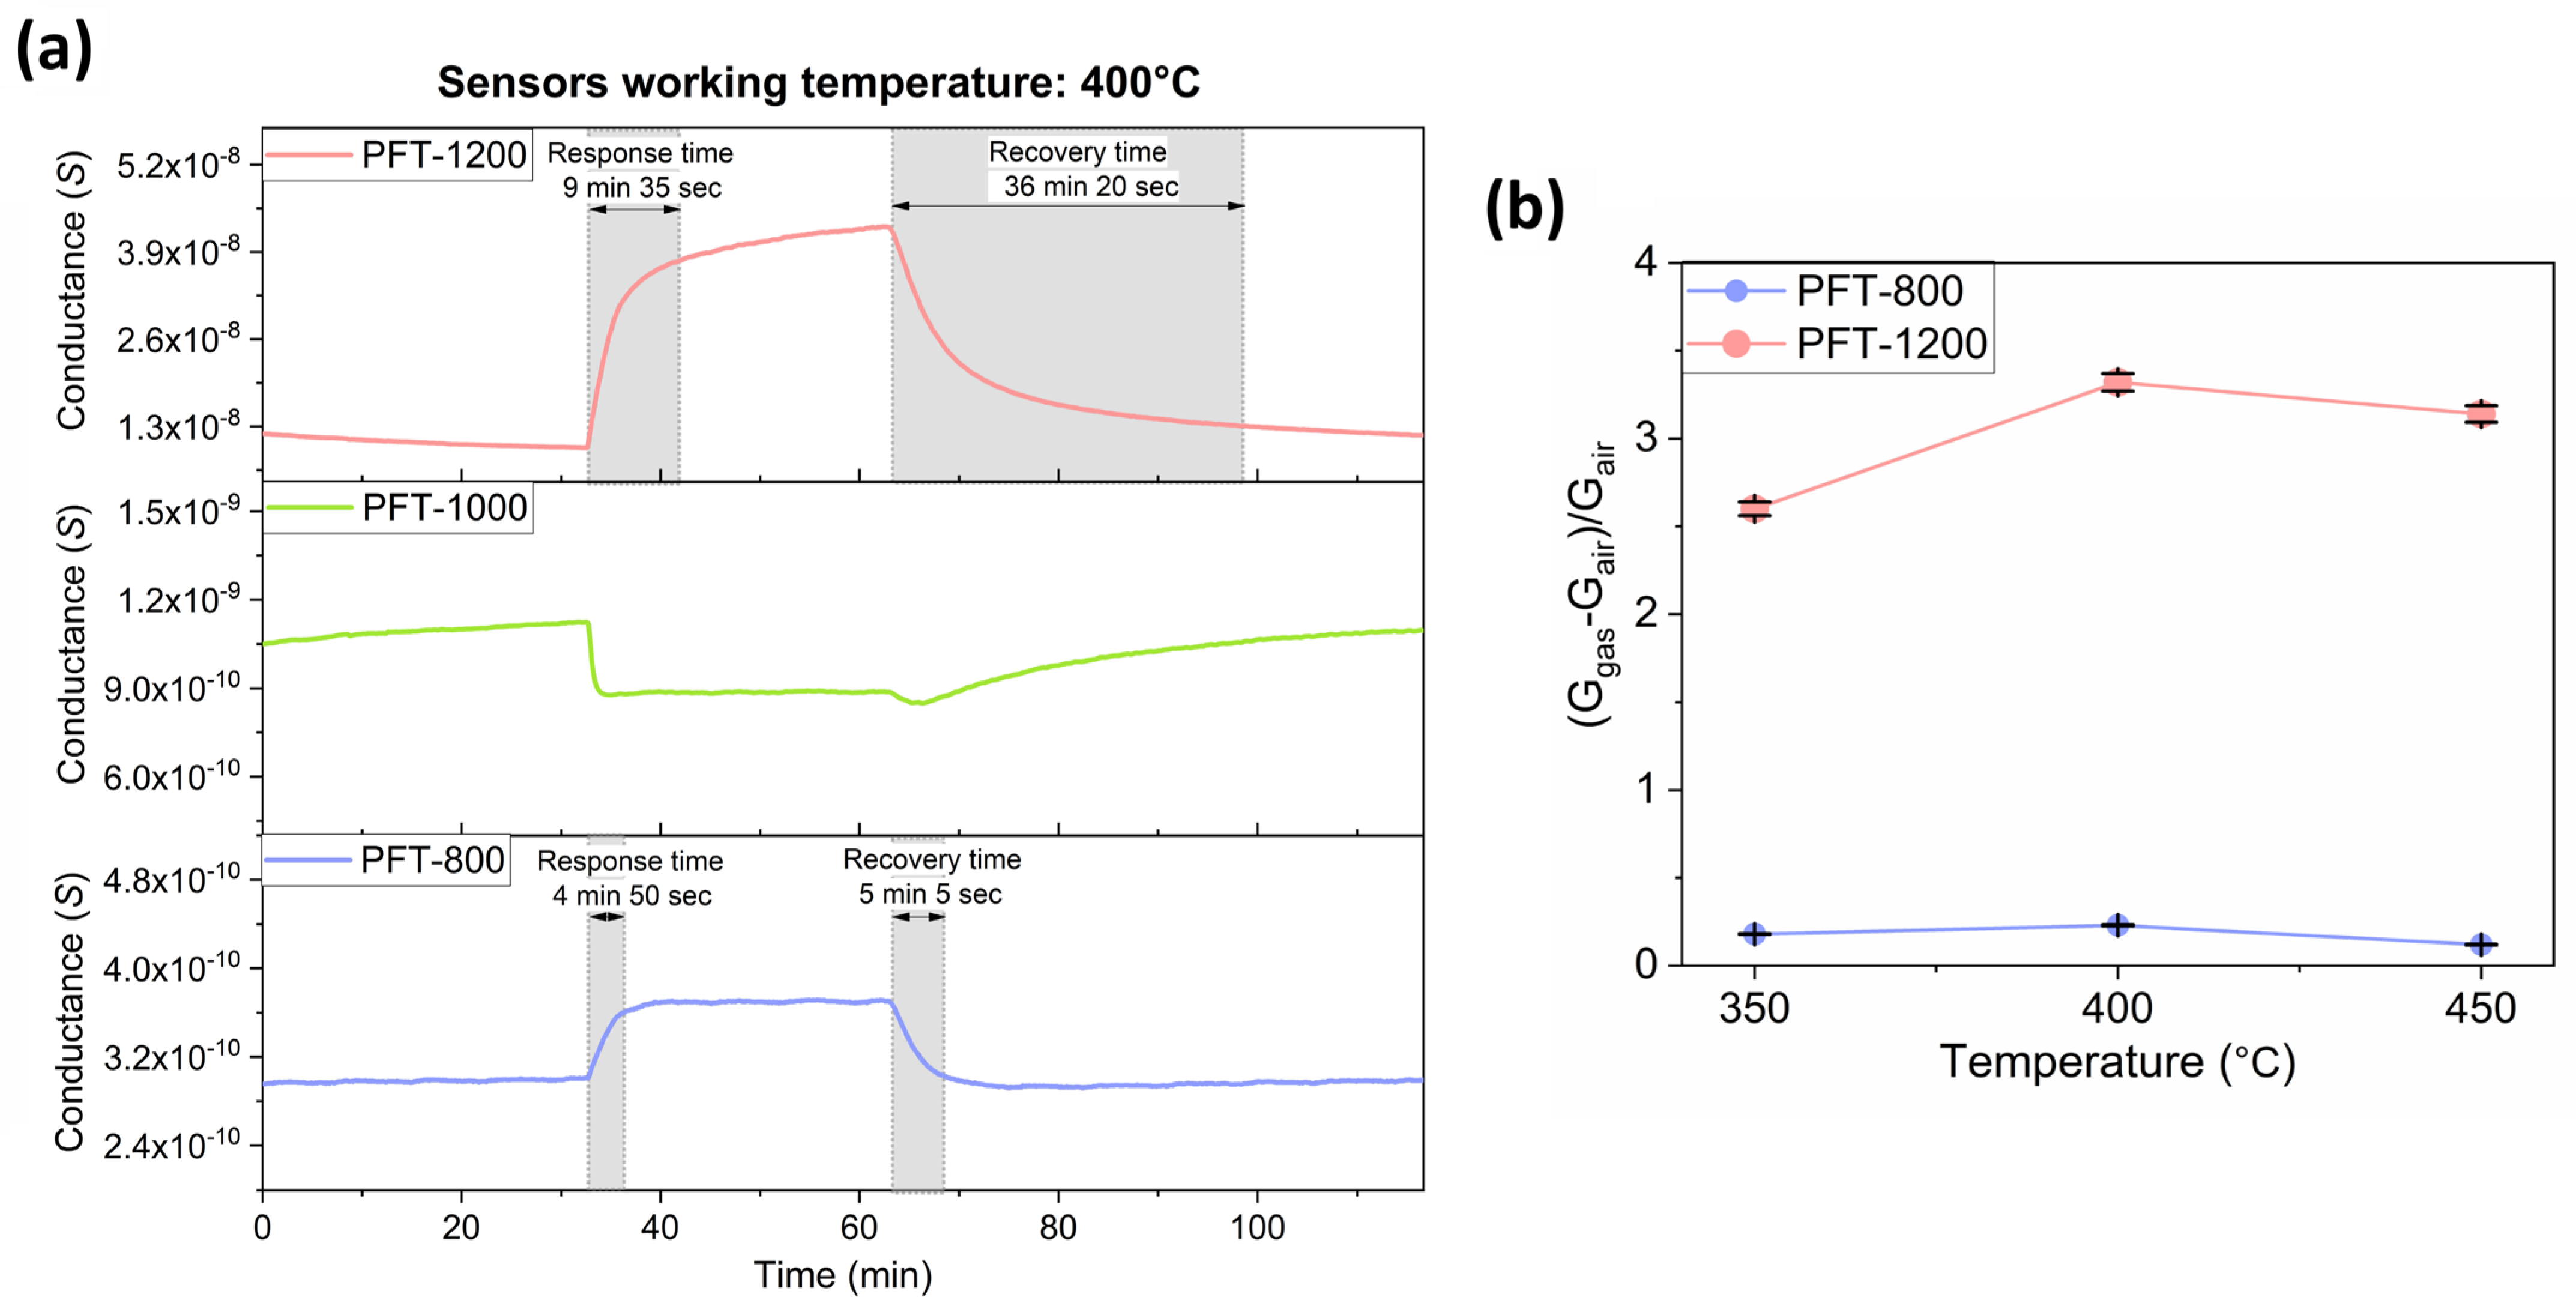
The operating temperature is an important parameter to tune in order to optimize the sensing properties of MOX-based gas sensors. Therefore, the response of PFT sensors to 5 ppm of ethanol was investigated at different working temperatures in the range 350–450 °C (Figures S6, S7, and Figure 4a). Below 350 °C, the functional films displayed a conductance that was too low to be exactly measured with the available data acquisition system. The conductance in dry air increased with the operating temperature (see Table S2). The measurements displayed that both the PFT-800 and PFT-1200 conductance increased after the injection of ethanol, independently of the operating temperature. This behavior is consistent with n-type semiconductors reacting with reducing gas. The response and recovery times for PFT-1200 and PFT-800 are shown in Figure 4b, displaying that PFT-800 was faster in achieving electrical stabilization after gaseous variation. The response and recovery times within minutes have already been observed for thick-film chemoresistive gas sensors based on traditional SnO2 and other materials in our previous works [5,33,61,62]. They were dependent upon the size and geometry of the chamber and on the speed of the gas flow [62]. As illustrated in Figure 4a, PFT-1200 and PFT-800 exhibited their maximum response to the target gas at an operating temperature of 400 °C. Therefore, the optimal operating temperature of 400 °C was selected for the following tests. PFT-1200 showed the highest response value, at more than 10 times greater than that of PFT-800.
The PFT-1000 sensor working temperature was set to 400 °C for comparison with the other two sensors. However, the response was not calculated using Equation (2), as its conductance decreased upon exposure to 5 ppm of ethanol, as shown in Figure 4a, which illustrates the conductance variation of PFT-based sensors operated at 400 °C following ethanol injection. This behavior was also observed for the working temperatures of 350 °C and 450 °C (Figures S6 and S7). It was not fit to use p-type or n-type equations for determining the response level of this sensor since, as can be seen in the following measurements, the conductance varied in an erratic fashion with varying gas concentrations. Motivations for this behavior are elaborated upon in Section 4.
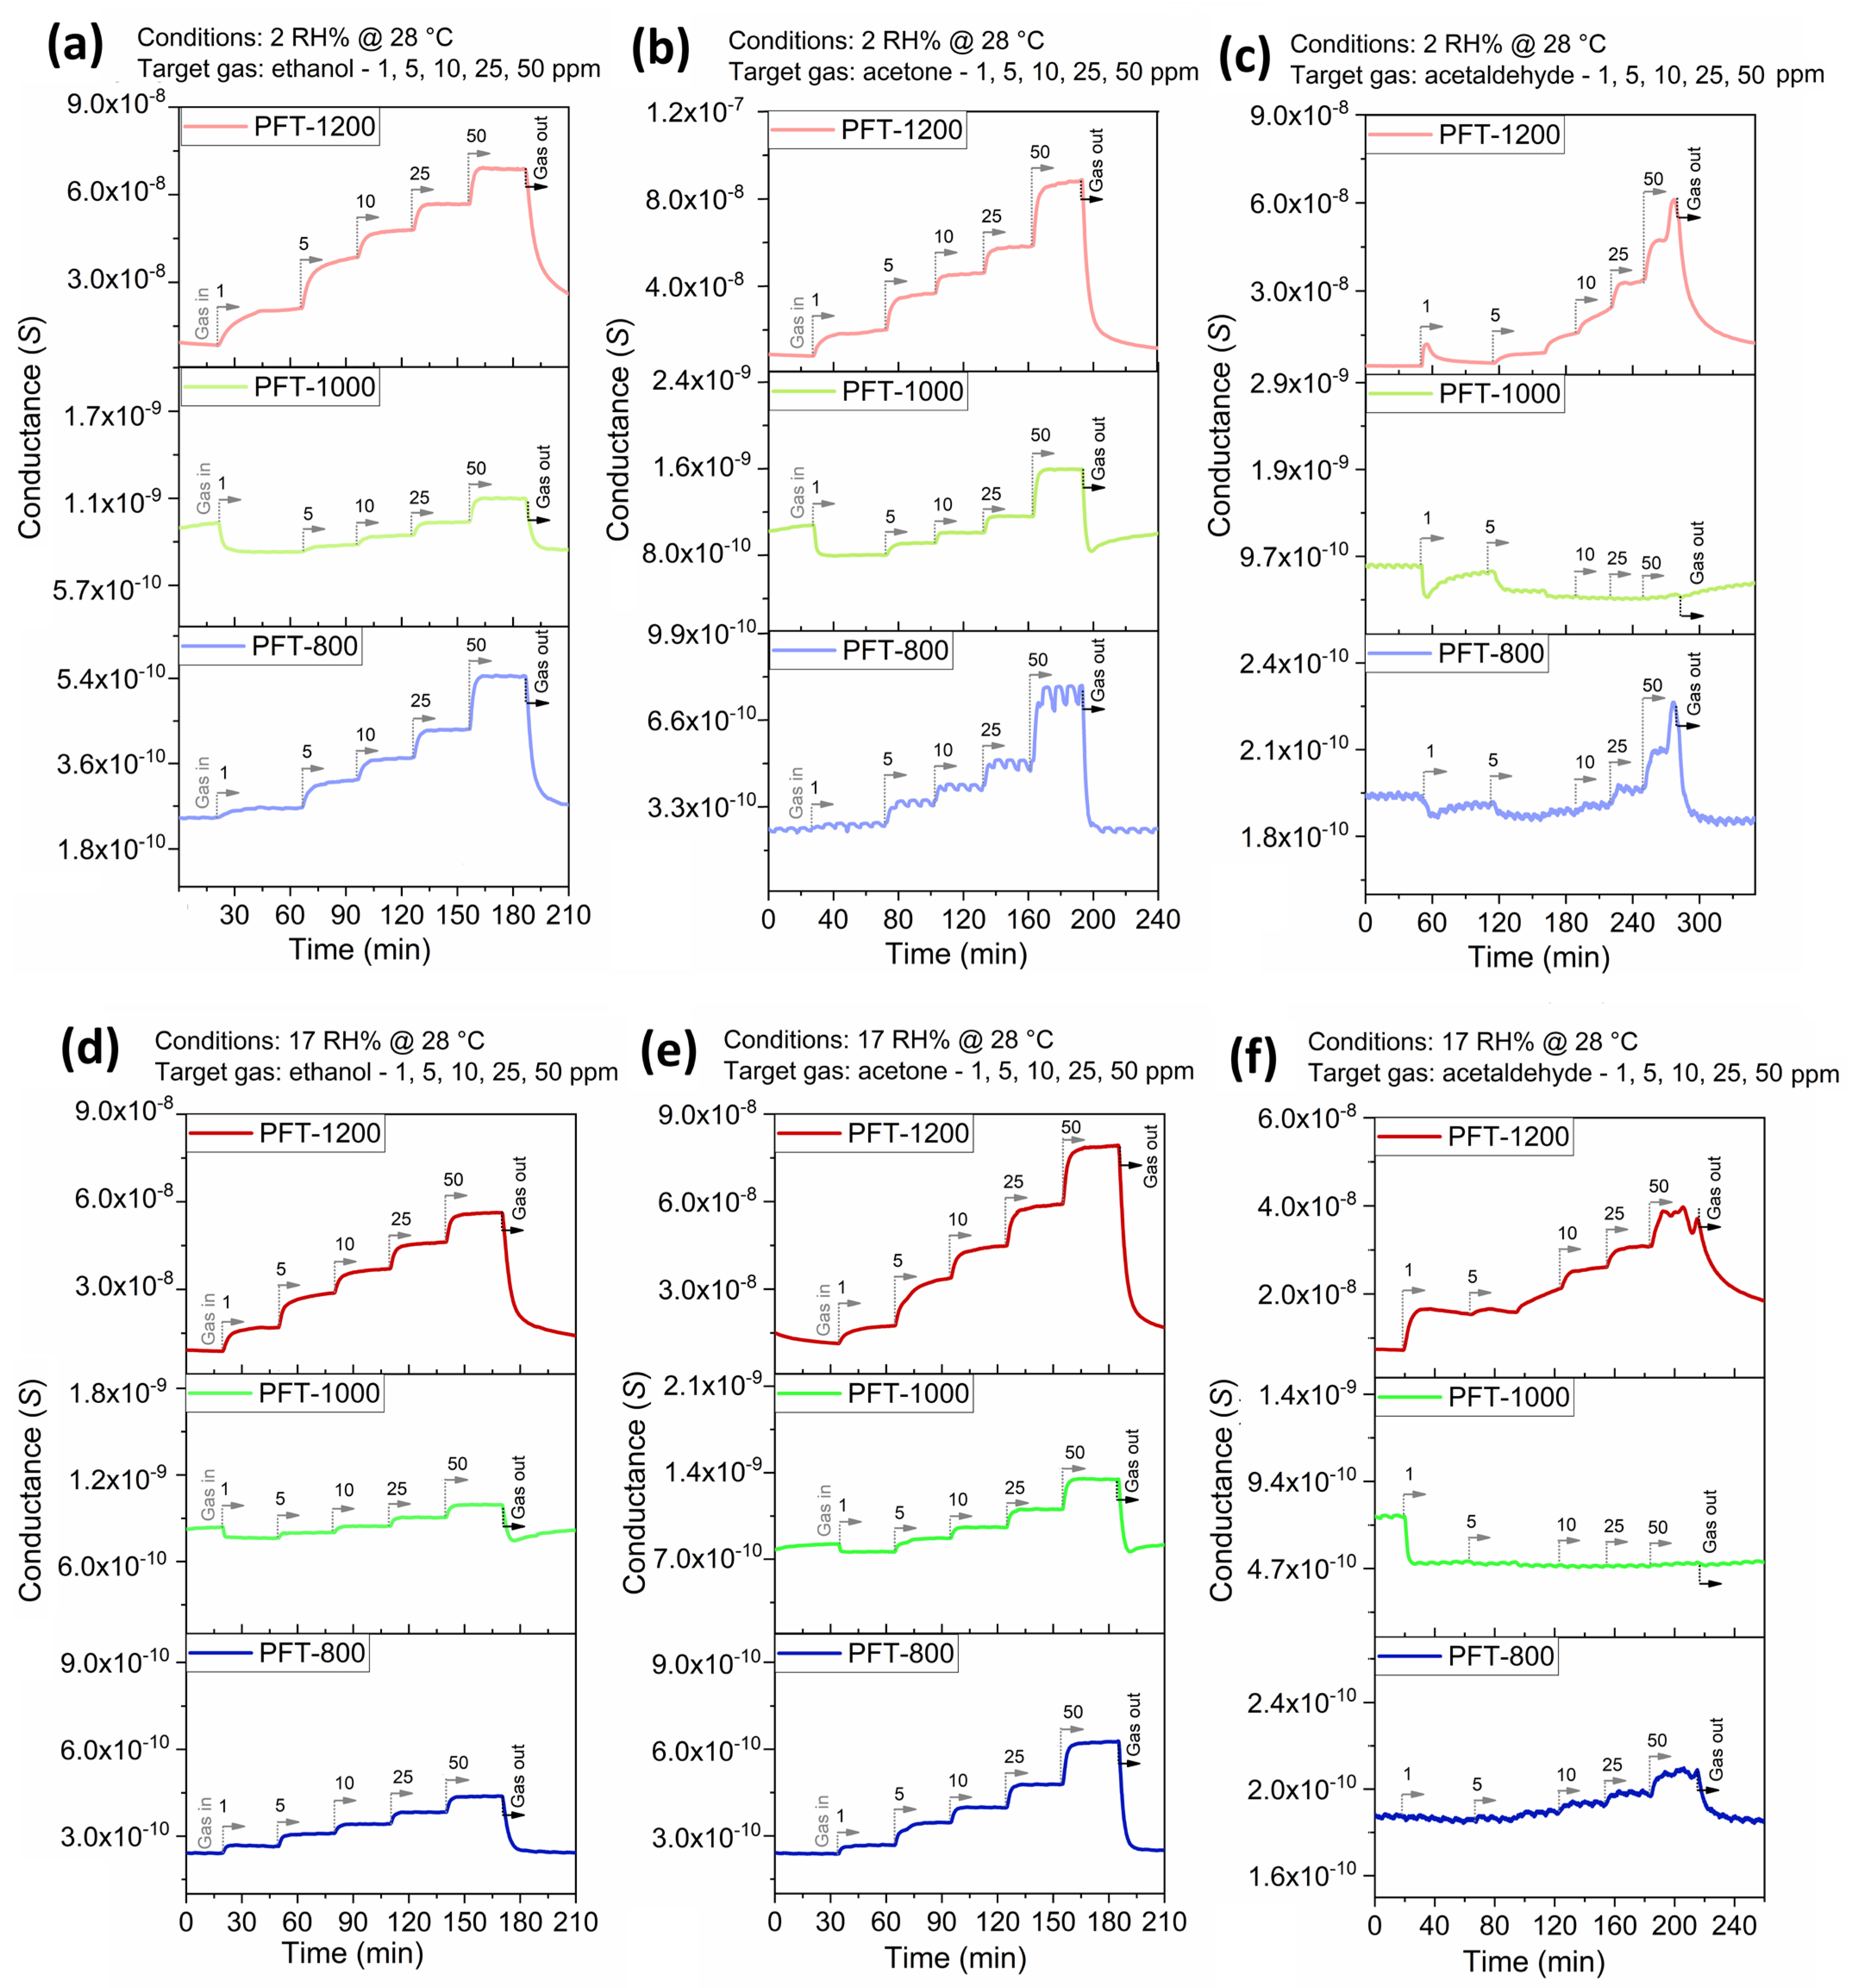
The conductance variations of PFT-based films to 1, 5, 10, 20, and 50 ppm of ethanol, acetone, and acetaldehyde were measured for sensor calibration in dry (2% RH @ 28 °C) and in wet (17 RH % @ 28 °C) conditions (Figure 5). For PFT-800 and PFT-1200, the conductance increased with an increasing VOC concentration (reducing gases), indicating that the materials composing the sensing film were n-type. While both sensors reached a conductance plateau over the time span of exposure to ethanol and acetone, fluctuations in the signal were observed during exposure to acetaldehyde. PFT-1000 still displayed a peculiar behavior, decreasing its conductance after the first injection of 1 ppm of the target gases while increasing it for subsequent steps in the range 5–50 ppm. Because of its dynamics, the sensor’s response was not calculated. Although Figure 4b and Figure 5 showed that PFT-1000 did not prove effective as a sensor, it provided valuable insights that will be discussed in Section 4.
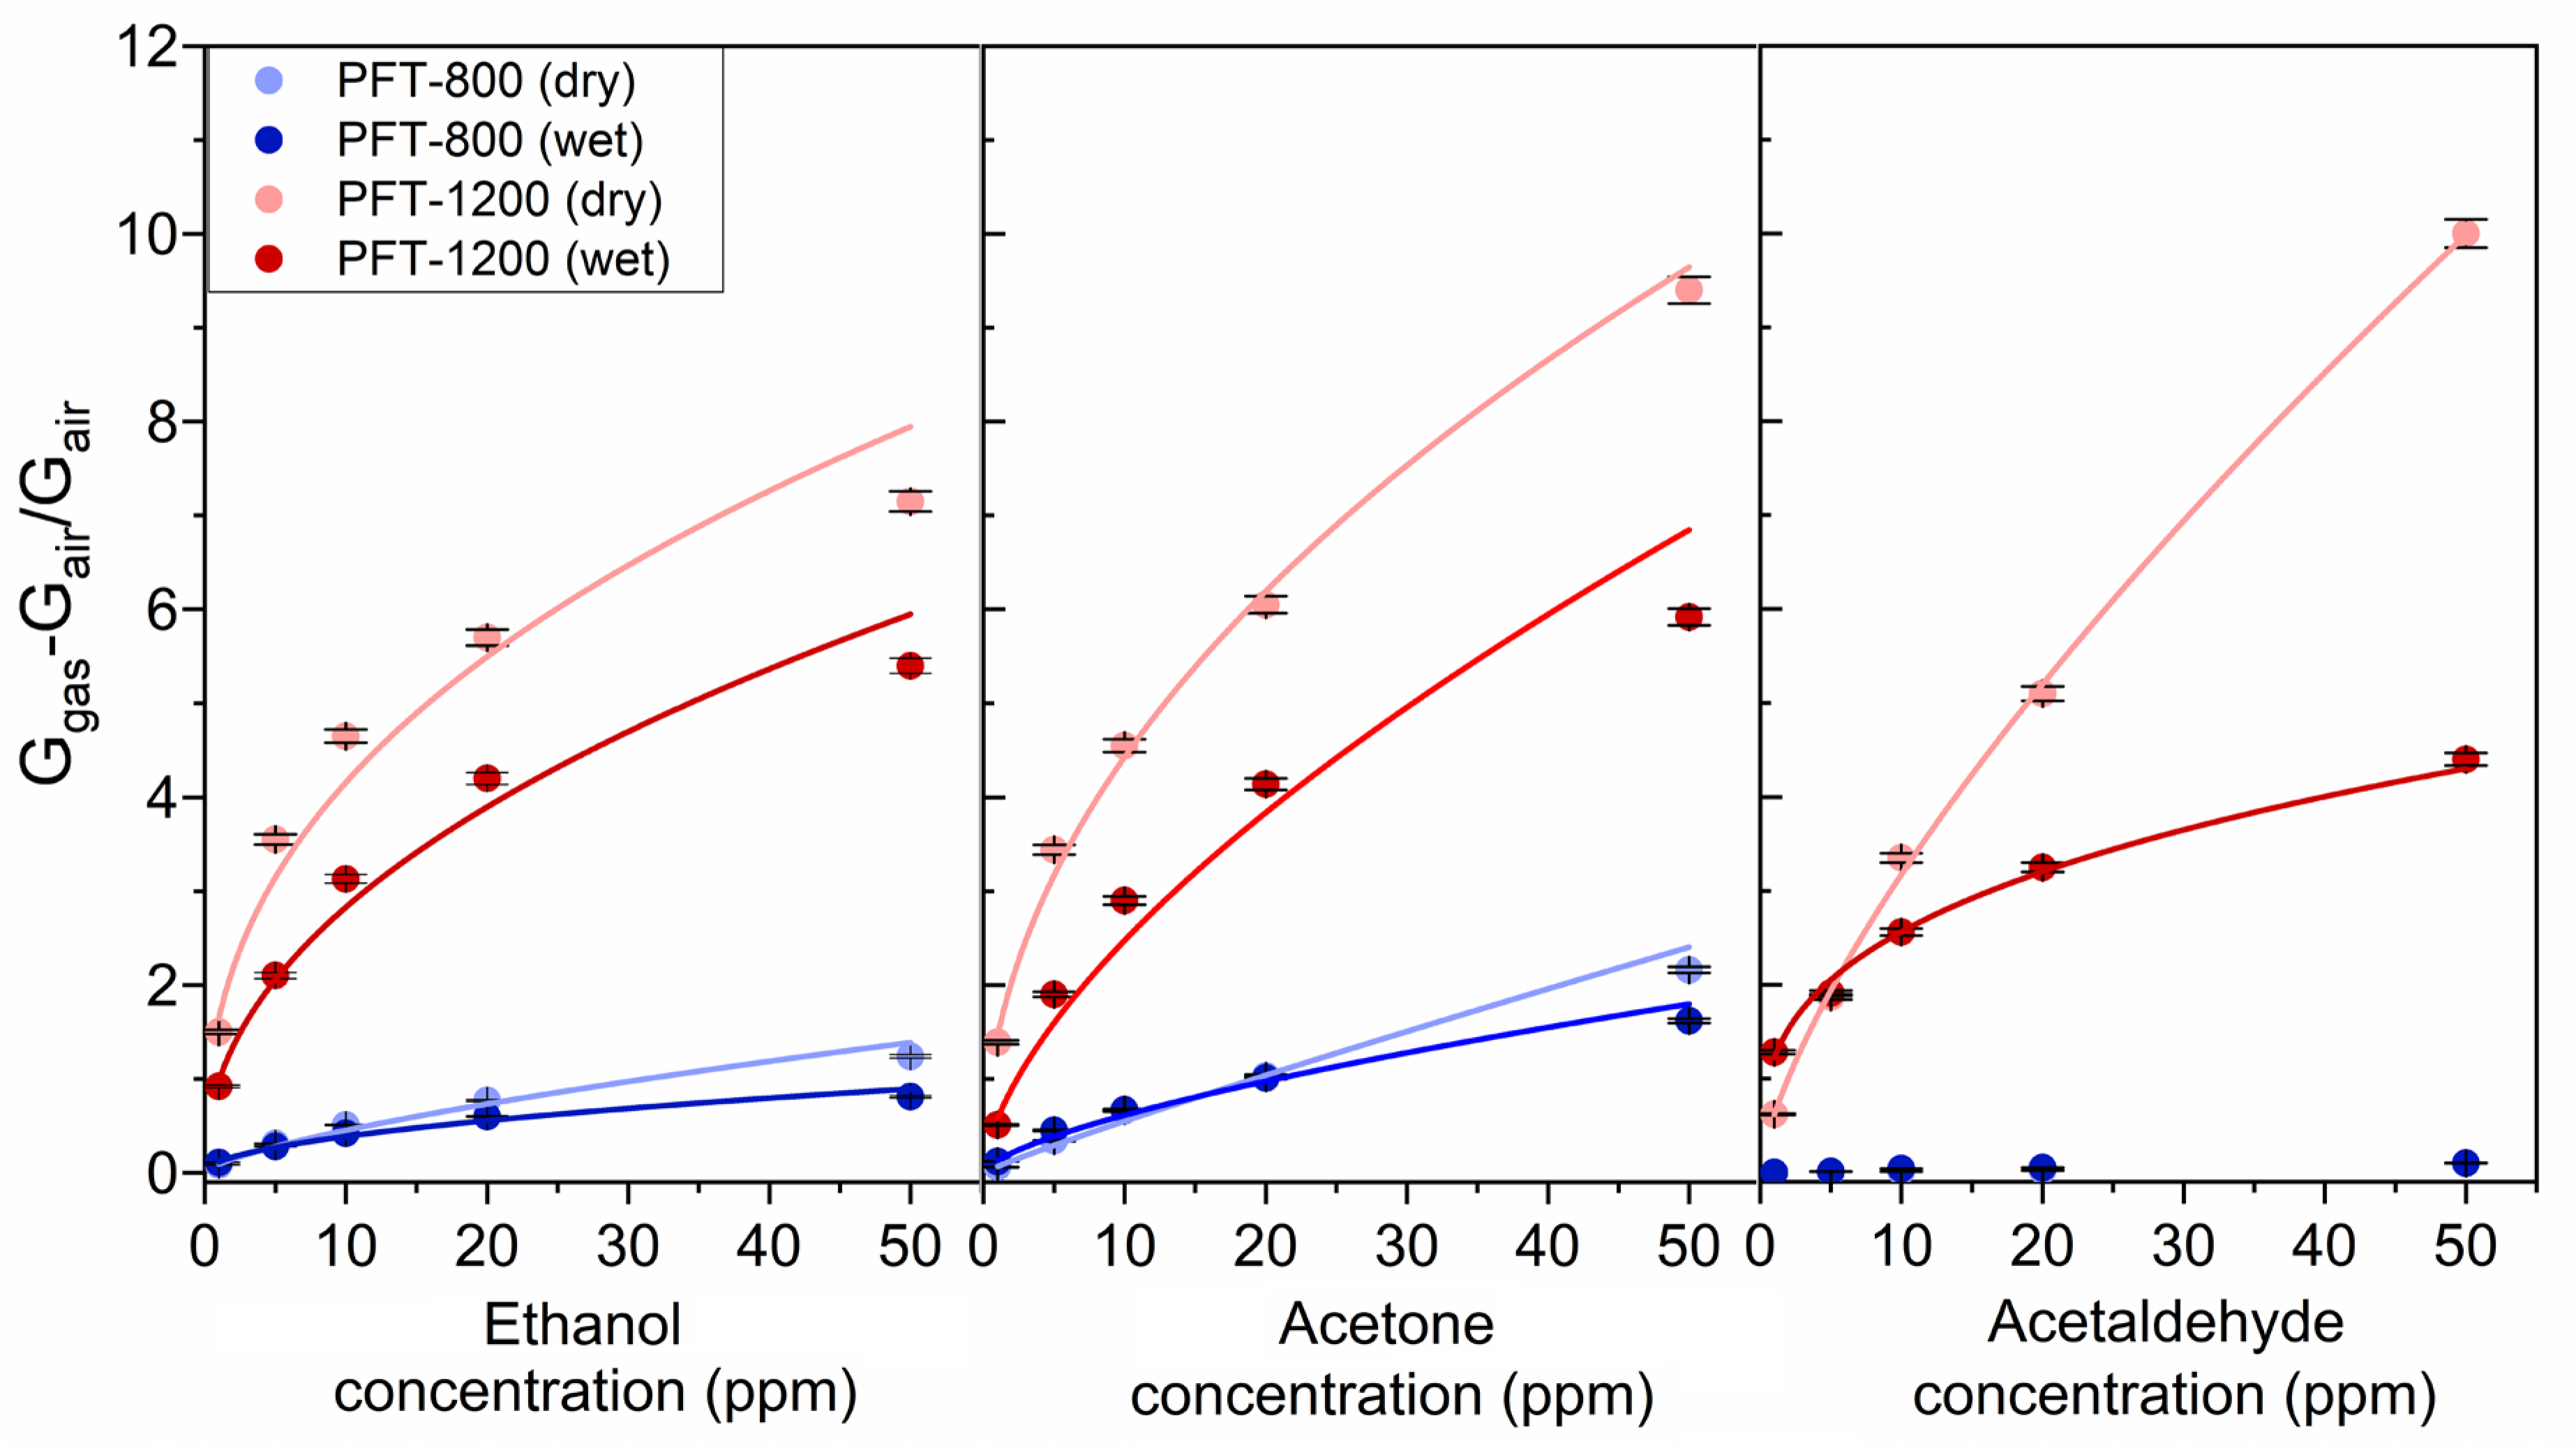
In Figure 6, the response level to concentration x in the range of 1–50 ppm of ethanol, acetone, or acetaldehyde, in dry or humid settings, were fitted with a power law function R = a x b , with R being the PFT-800 and PFT-1200 sensor response. Parameters a and b are listed in Table S3. The PFT-1200 exhibited good sensitivity vs. all three VOCs within the range of concentrations considered, although the response values slightly decreased in wet conditions. The PFT-800 was incapable of detecting acetaldehyde, and although the responses to ethanol and acetone were low, they were only minimally affected by humidity.
To determine the influence of different humidity levels on the sensing performance of PFT sensors, their baseline was stabilized at 2%, 17%, 30% and 41% RH prior to exposing the sensing films to 10 ppm of ethanol (Figure S8), acetone (Figure S9), and acetaldehyde (Figure S10). The conductance of PFT-800 remained unaffected by variation in RH%, whereas the conductance of PFT-1200 first slightly increased with the increase in humidity from 2% to 17% RH and then remained constant within the range 17–41% RH. Even under humid conditions, PFT-1000 exhibited anomalous behavior that hindered the calculation of the response values. Therefore, Figure 7 shows the responses only for PFT-1200 and PFT-800, calculated by taking G a i r in Equation (2), as the conductance attained at the RH% under consideration. The response value of PFT-800 in a humid setting was kept unchanged compared to the one obtained at 2% RH. PFT-1200 showed a general response decrease at 17% RH, while it was kept rather constant throughout the range of 17–41% RH.
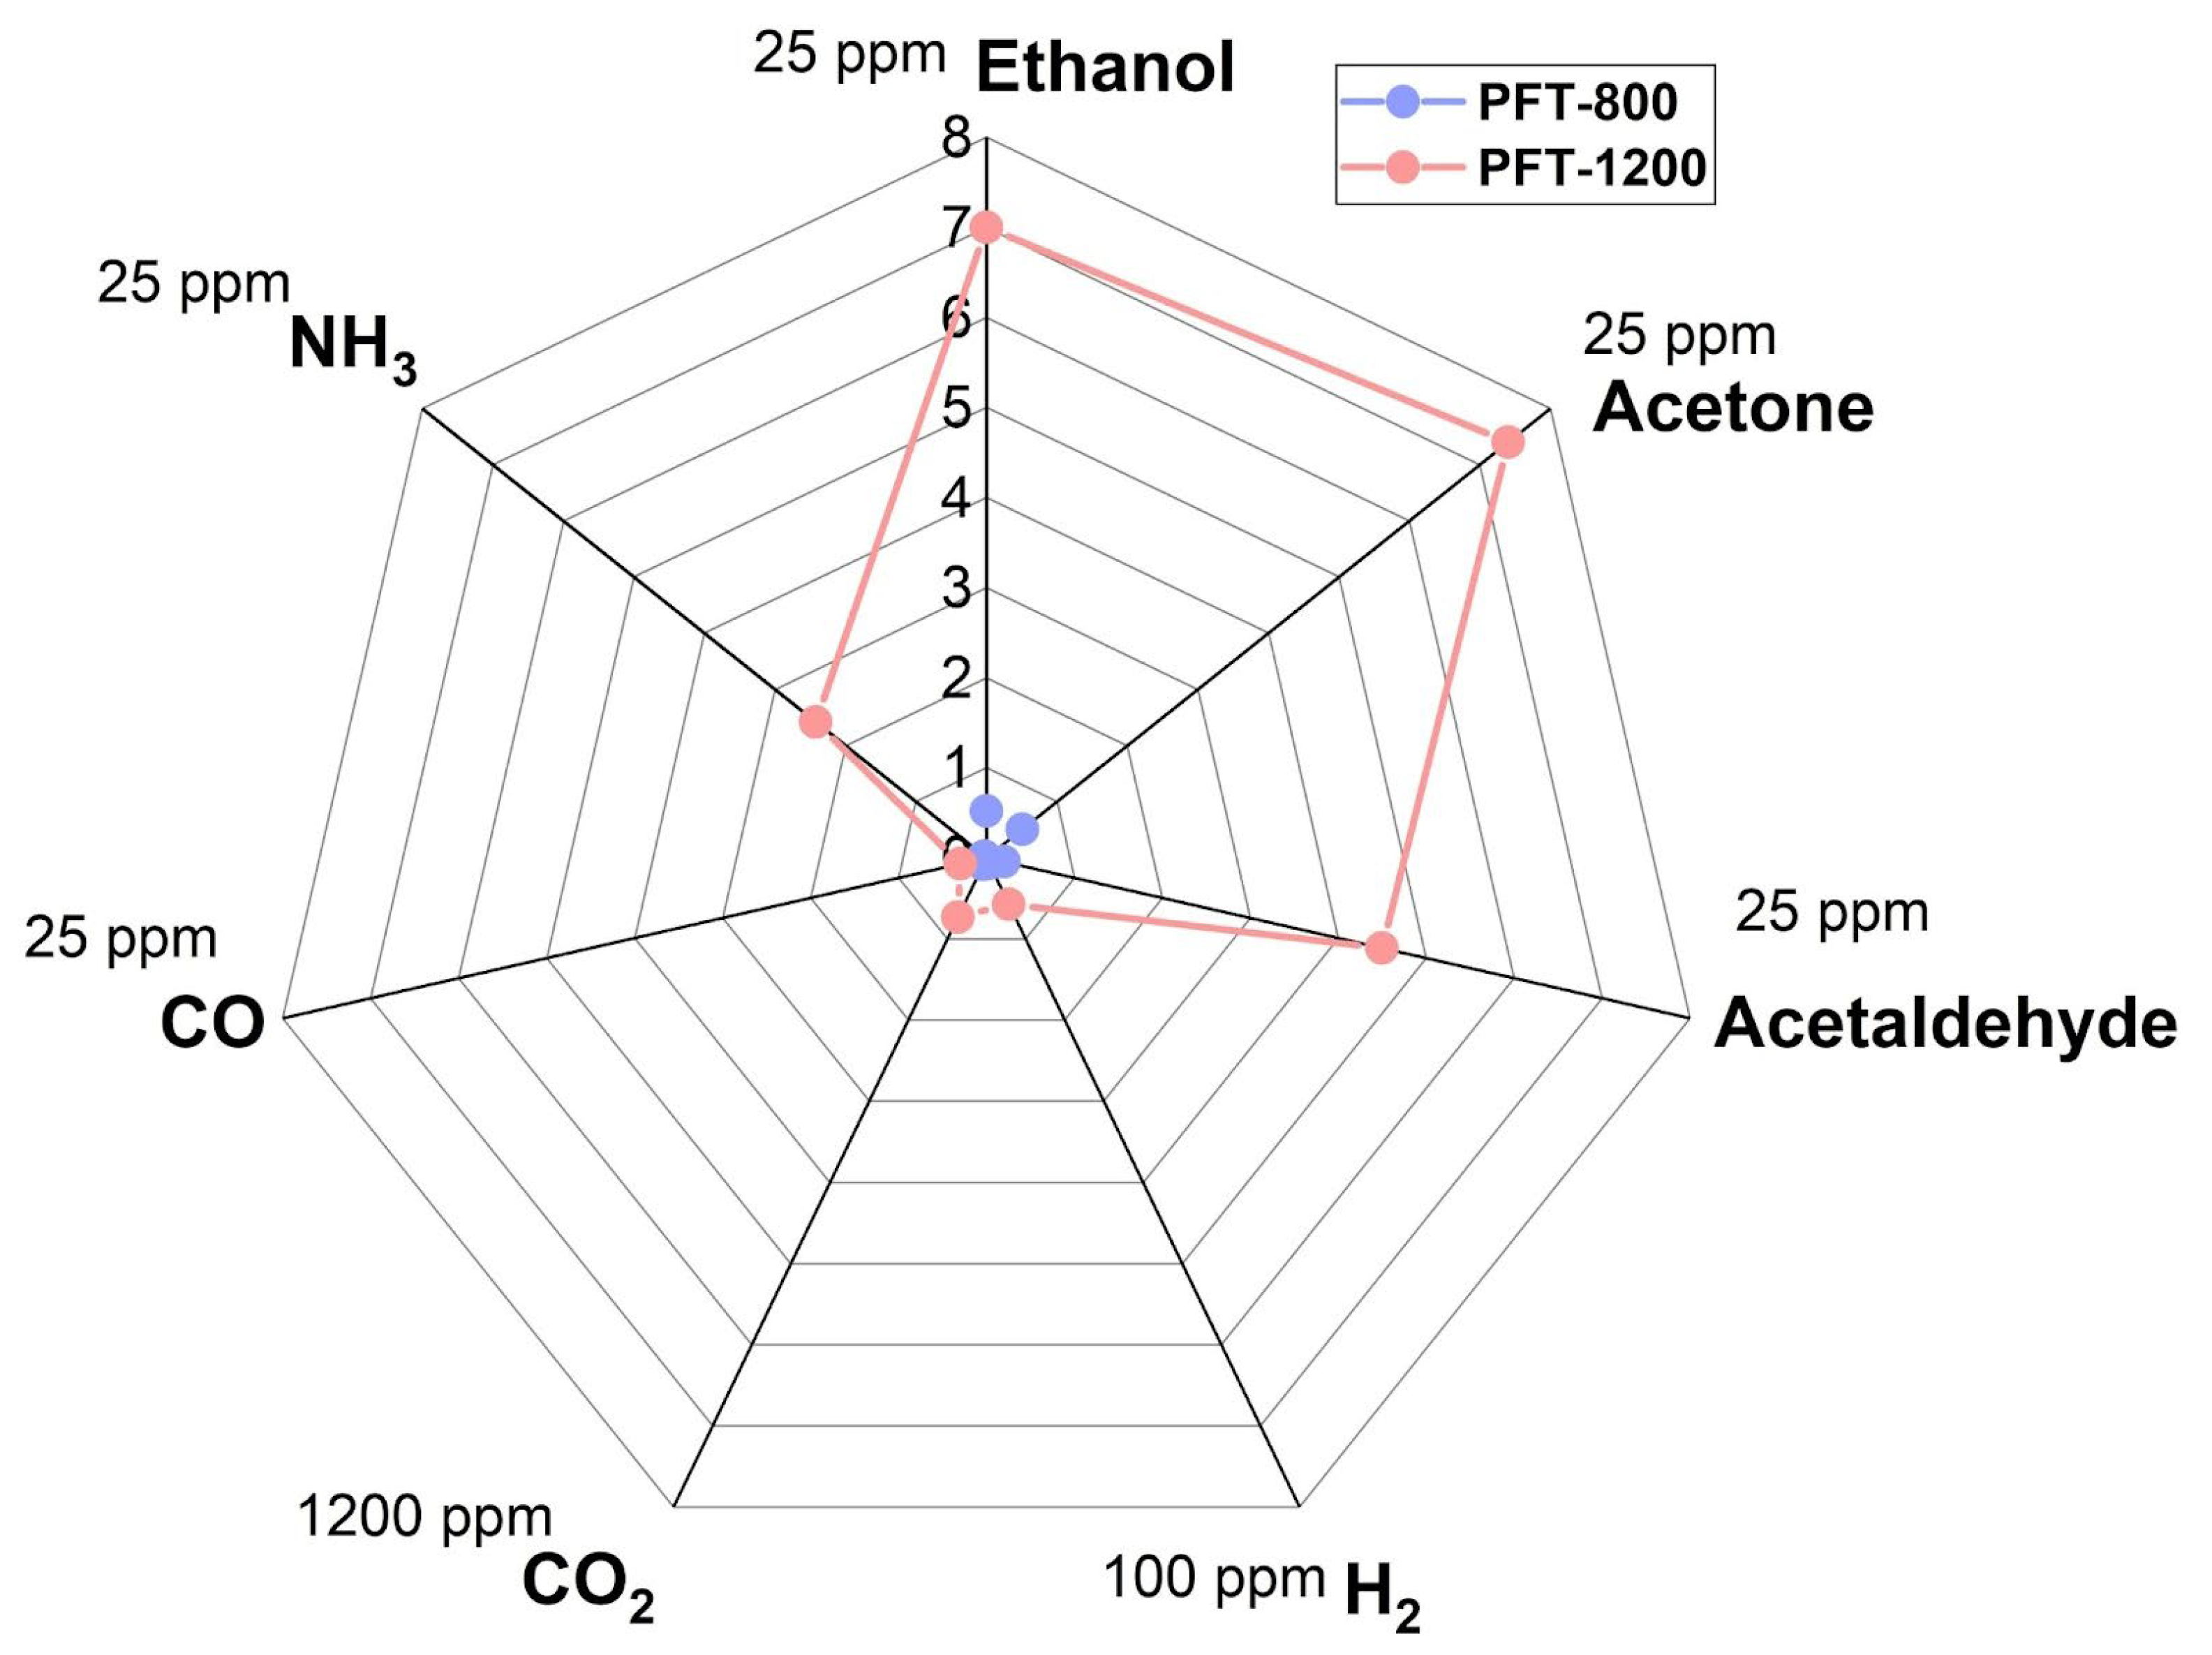
The selectivity vs. VOCs was explored by exposing the sensors to CO, NH3, CO2, and H2. The dynamic response to all target gases is shown in Figures S11–S17. The radar plot of Figure 8 highlights a pronounced selectivity of the PFT-1200 film towards ethanol, acetone, and acetaldehyde.

4. Discussion

The solid solution of PrFeTiO5, as mainly a sample phase, was obtained only at the reaction temperature of 1200 °C. However, the powder’s micrometric and compact morphology, resulting from coalescence phenomena, impeded the production of sensing films with an optimized surface-to-volume ratio. Lower reaction temperatures of 800 °C and 1000 °C prevented micrometric grain growth, although mixed powders of mono- and bi-metallic oxides were formed. This indicates that lowering the reaction temperature below 1200 °C is not a viable strategy to address the issue of enlarged structures. Although PFT-800 and PFT-1000 behaviors are difficult to interpret due to their chemical and crystallographic inhomogeneity, they are still discussed, as their sensing characterization can provide useful insights for establishing a background in the study of Pr-based solid solutions.
For all the sensors, the conductance increased when the operating temperature increased from 350 °C to 400 °C and 450 °C. Indeed, at higher temperatures, charge carriers from deeper levels inside the gap may contribute to the conductance of the film, which consequently increased.
The working temperature impacted not only the conductance in the bulk of the nanostructures, but also the response value to 5 ppm of ethanol, which increased, moving from 350 °C to 400 °C. In the literature, the increase in sensor response with the rise in operating temperature is mainly attributed to two effects. First, the ionosorption of atmospheric O2 leads to the formation of molecular (O2) or atomic (O, O2) surface species with different reactivities, with O and O2 generally being the most reactive toward reducing gases [63]. At the operating temperature of 400 °C, both O and O2 are typically considered to be formed [64,65]. Second, the thermal energy must be high enough to overcome the activation energy barrier to promote a gas reaction with the active sites on the surface of the sensing MOX film.
When ethanol, acetone, and acetaldehyde were fluxed inside the test chamber, the conductance of PFT-800 and PFT-1200 increased, highlighting an n-type behavior. Indeed, usually, the selected VOCs act as reducing gases, reacting with surface-preadsorbed oxygens, releasing electrons e and decreasing the intergranular Schottky barrier. The highest number of e released is achieved once VOCs are fully decomposed, like in Equations (4)–(6) [66,67,68]. Nevertheless, ethanol, acetone, and acetaldehyde may also undergo partial oxidation, dehydration, or dehydrogenation, leading to the formation of intermediates such as acetaldehyde, ethylene, acetic acid, and formic acid [40,69,70]. These intermediates typically release fewer charge carriers compared to the full oxidation to CO2 and H2O. Then, the sensor response level may also depend on the surface reactivity toward these intermediate products, which generally increases with operating temperature due to enhanced catalytic activity.
C 2 H 5 OH + 6 O / O 2   2 CO 2 + 3 H 2 O + 6 / 12 e
CH 3 COCH 3 + 8 O / O 2 3 CO 2 + 3 H 2 O + 8 / 16 e
CH 3 CHO + 5 O / O 2 2 CO 2 + 2 H 2 O + 5 / 10 e
The response of PFT-800 to the target VOCs remained consistently below two, even at concentrations as high as 50 ppm. Nevertheless, a clear conductance deviation from the baseline was detectable from the concentration of 5 ppm, thanks to the low signal noise. Interestingly, both the PFT-800 baseline conductance and VOC response were not influenced by humidity in all of the range explored (2–41% RH). Figure 5 also evidenced that a good response stability in a humid setting was maintained in the whole range of VOC concentrations explored. According to previous studies on TiO2 [39,40,71], the overall performance of PFT-800 can be attributed to this MOX, which constituted almost 10 wt% of the sensing film (see Section 3.1. Indeed, TiO2 is known to be low reactive vs. H2O molecules [40,72,73]. The other components, mainly Pr2Ti2O7 and Fe2TiO5, are not believed to significantly contribute to the sensing mechanism. PFT-1000, in which TiO2 was not present and was primarily composed of Pr2Ti2O7 and Fe2TiO5, lost the capability to clearly detect ethanol, acetone, and acetaldehyde, showing only minimal variations of electrical behavior in response to changes in the surrounding gas composition. Additionally, on one hand, the film conductance slightly increased by increasing the VOC concentrations from 5 to 50 ppm (Figure 5), highlighting an n-type behavior. On the other hand, the decrease in the conductance of PFT-1000 after the first injection of VOCs (Figure 5) or humidity (Figures S8–S10) suggested an interaction with a p-type semiconductor. The erratic behavior of PFT-1000 might be induced by a competition between n-type and p-type semiconductors composing the sensing film. Indeed, XRD analysis confirmed that the sensing film was composed of different MOXs: PrFeTiO5 (14.0%), Pr2Ti2O7 (41.1%), Fe2TiO5 (41.3%), and Pr2O3 (3.7%). PrFeTiO5 and Fe2TiO5 are n-type semiconductors [74], while the p-type contribution cannot be attributed in the present work, since the electrical behaviors of Pr2O3 and Pr2Ti2O7 are not well documented. To discern the roles of individual MOXs, sensors containing only one phase and homogeneous chemical composition should be produced. However, the characterization of the PFT-1000 sensor revealed that none of its constituent phases exhibited promising sensing properties for VOCs detection, suggesting that further research should not pursue the study of Pr2Ti2O7 and Fe2TiO5 bimetallic solid solutions.
In contrast, PFT-1200 showed good sensing performance, demonstrating a higher surface reactivity vs. ethanol, acetone, and acetaldehyde than other reducing gases like NH3, H2, CO, and CO2. The good detection capabilities of PFT-1200 toward gases belonging to the class of alcohols, ketones, and aldehydes are likely the result of a synergistic interaction between Fe- and Pr-based reactive sites. While both Fe2O3 and PrOx can detect certain VOCs, their performance, in terms of stability and sensitivity in humid conditions, strongly requires improvement. Enhanced stability has been achieved in the literature through the tailored engineering of the material morphology [75] and surface reactivity, for instance, via doping or surface functionalization [76]. In our case, the characterization of PFT-1200 demonstrated that both the baseline (Figures S8–S10) and VOC response (Figure 5) were influenced, increasing from 2% to 17% RH. The increase in film conductance and the decrease in response vs. the VOCs investigated can be attributed to the reaction of water molecules with the film surface, forming hydroxyl groups (OH) and releasing electrons ( e ), thereby changing the active sites for target gas detection while affecting the electrical properties of the film [24,38]. However, at 17% RH, the sensitivity was still good, allowing for detecting low ppm concentrations of ethanol, acetone, and acetaldehyde. Moreover, both PFT-1200 baseline and sensing performance only slightly changed in the range 17–41% RH, facilitating data processing. The good performance of PFT-1200 under humidity, and its stabilization at medium RH%, can be attributed to the presence of Ti sites. It is well documented that the addition of Ti to solid solutions promotes the formation of monolayers of water, preventing surface hydroxylation [40,72,73]. Our work demonstrated that using solid solutions, like the newly discovered PrFeTiO5, can be a viable strategy to obtain chemoresistive gas sensors for VOC detection with good response at RH%, simulating real-like conditions.
Our findings appear to bring the field to a crossroads, opening up several promising research directions. The evidence presented may act as signposts, guiding future efforts toward effective Pr-based solid solutions.
Indeed, PFT-1200 sensing performance is already competitive with that of the chemoresistive MOX sensors for VOC detection listed in a wide summary table of a recent review article [2], additionally displaying good stability in humid settings. The use of PrFeTiO5 as a material for the development of ethanol, acetone, and acetaldehyde sensors can be enhanced by optimizing its morphology, going from the micrometric to nanometric range.
The use of advanced synthesis strategies, such as hydrothermal and microwave-assisted methods, may enable the direct formation of nanostructured PrFeTiO5 at lower temperatures, avoiding the grain growth associated with high-temperature solid-state reactions and exposing a larger active surface area to gas detection. Alternatively, ball milling subsequent to solid-state synthesis at 1200 °C might be employed to decrease the size of the micrometric powders. The optimization of the surface-to-volume ratio and pore size of the film through the different techniques can be studied through BET measurements in future work. The application of operando characterization techniques, such as diffuse reflectance infrared Fourier-transform spectroscopy (DRIFTS) or Raman spectroscopy, analyzing the sensing film during gas exposure, could provide deeper insights into the surface reaction mechanisms and clarify the specific role of the different metal sites involved in the sensing process.
Building on these results, PrFeTiO5-based sensing films highlight the broader potential of rare-earth multimetallic solid solutions for gas-sensing applications. Extending the investigation to other Pr-based systems, such as Pr-Ti–M–O (where M = Mn, Co, Cr, etc.), could allow fine-tuning of selectivity and sensitivity toward different classes of VOCs while maintaining good humidity stability.

5. Conclusions

The work focused on solid solutions derived from Pr, Fe, and Ti precursors, selected for the peculiar sensing properties of the corresponding single MOXs. Fe2O3 and PrOx can detect different VOCs, despite their performance in terms of stability in humid conditions, and sensitivity requires improvement. On the other hand, TiO2 sensitivity is commonly low, although it offers outstanding electrical stability towards humid variations.
The ternary MOX solid solution PrFeTiO5, synthesized via a solid-state reaction at 1200 °C under ambient atmospheric conditions, displayed promising performance, demonstrating high reactivity toward ethanol, acetone, and acetaldehyde. In particular, PFT-1200 achieved good sensitivity vs. VOCs in both dry and humid environments, despite the limited surface-to-volume ratio associated with its micro-sized grains.
A crystallographic characterization of the PFT-800 and PFT-1000 samples revealed that the formation of the PrFeTiO5 phase was not achieved at the synthesis temperatures of 800 °C and 1000 °C. Although these samples exhibited nanostructured morphology, typically favorable for gas sensing, their sensing layers, composed of unevenly distributed bi- and mono-metallic phases, showed limited reactivity toward the target VOCs. PFT-800 displayed generally low response levels, while PFT-1000 demonstrated ineffective sensing behavior. However, through the characterization of PFT-800 and PFT-1000 sensors, it is hypothesized that none of their constituent phases exhibits promising sensing properties for VOCs detection, suggesting that further research should not pursue the study of bimetallic solid solutions like Pr2Ti2O7 and Fe2TiO5.
In summary, the results highlight the potentialities of the newly discovered PrFeTiO5 solid solution for the production of chemoresistive gas sensors for VOCs detection. Moreover, the work may guide future efforts toward effective Pr-based solid solutions, suggesting promising strategies such as new synthesis approaches to obtain the nanostructurization and substitution of transition metals for fine-tuning selectivity and sensitivity toward different classes of VOCs while maintaining good stability in humid settings.

Supplementary Materials

The following supporting information can be downloaded at https://www.mdpi.com/article/10.3390/chemosensors13070222/s1: Figure S1: Schematic of (a) the interdigitated electrodes on the front and (b) the heater on the back of a sensor working in thermo-activation mode. (c) Picture of the device; Figure S2: Schematic representation of the set-up used in humidity sensing measurements; Figure S3: Diffractogram of the powders; Table S1: Lattice parameters of the identified phases; Figure S4: SEM images of the screen-printed sensing films; Figure S5: Absorbance spectrum of PFT_800, PFT_1000, and PFT_1200; Figures S6 and S7: Conductance variation of PFT-sensors operated at 350 °C (S6) and 450 °C (S7), after injection of ethanol; Table S2: Conductance values of the sensors at different operating temperatures; Table S3: Parameters a and b of the calibration fit shown in Figure 6; Figures S8–S10: Influence of humidity on sensors conductance when exposed to 10 ppm of ethanol (S8), acetone (S9), and acetaldehyde (S10) under different humidity conditions; Figures S11–S17: Conductance variation of PFT-based films when exposed to 25 ppm of ethanol (S11), at 25 ppm of acetone (S12), 25 ppm of acetaldehyde (S13), 100 ppm of H2 (S14), 25 ppm of NH3 (S15), 1200 ppm of CO2 (S16), 25 ppm of CO (S17), operating temperature of 400 °C.

Author Contributions

Conceptualization, D.A., E.S. and A.C.; methodology, D.A., E.S., A.C., B.M., A.E.B. and B.F.; validation, D.A. and E.S.; formal analysis, D.A. and E.S.; investigation, D.A., E.S., M.M. and M.F.; resources, B.F.; data curation, D.A., E.S., M.M. and M.F.; writing—original draft preparation, E.S. and A.C.; writing—review and editing, D.A., M.F. and B.F.; supervision, E.S. and B.F.; project administration, E.S.; funding acquisition, B.F. All authors have read and agreed to the published version of the manuscript.

Funding

This publication was produced while attending the doctoral course in Physics (D. Ahmed) at the University of Ferrara, cycle 39, with the support of a scholarship funded by the D.M. n. 117/2023, supported by PNRR—funded by the UE—NextGenerationEU—Mission 4 “Education and Research”—Component 1 “Strengthening the offer of educational services: from nursery schools to university”—Investment 3.3 “Innovative PhDs that respond to the innovation needs of companies.” Chemosensors 13 00222 i001

Institutional Review Board Statement

Not applicable.

Informed Consent Statement

Not applicable.

Data Availability Statement

The original contributions presented in this study are included in the article/Supplementary Materials. Further inquiries can be directed to the corresponding authors.

Conflicts of Interest

The authors declare no conflicts of interest.

Abbreviations

The following abbreviations are used in this manuscript:
VOCsVolatile Organic Compounds
GCGas Chromatography
MSMass Spectrometry
MOXMetal Oxide
RTRoom Temperature
RH%% of Relative Humidity
MFCMass-Flow Controller
XRPDX-Ray Powder Diffraction
SEMScanning Electron Microscopy
EDSEnergy Dispersive Spectrometry
HRTEMHigh-Resolution Transmission Electron Microscope
FIBFocused Ion Beam
STEMScanning Transmission Electron Microscope
UV-Vis-NIRUltra-Violet–Visible–Near Infrared
FWHMFull Width at Half Maximum

References

  1. Epping, R.; Koch, M. On-Site Detection of Volatile Organic Compounds (VOCs). Molecules 2023, 28, 1598. [Google Scholar] [CrossRef] [PubMed]
  2. Lin, T.; Lv, X.; Hu, Z.; Xu, A.; Feng, C. Semiconductor Metal Oxides as Chemoresistive Sensors for Detecting Volatile Organic Compounds. Sensors 2019, 19, 233. [Google Scholar] [CrossRef]
  3. Pecunia, V.; Petti, L.; Andrews, J.B.; Ollearo, R.; Gelinck, G.H.; Nasrollahi, B.; Jailani, J.M.; Li, N.; Kim, J.H.; Ng, T.N.; et al. Roadmap on Printable Electronic Materials for Next-Generation Sensors. Nano Futures 2024, 8, 032001. [Google Scholar] [CrossRef]
  4. Stetter, J.R.; Stetter, E.F.; Carter, M.T. Abundant Chemical Sensors and the Trillion Sensor Universe. ECS Meet. Abstr. 2014, MA2014-01, 451. [Google Scholar] [CrossRef]
  5. Spagnoli, E.; Krik, S.; Fabbri, B.; Valt, M.; Ardit, M.; Gaiardo, A.; Vanzetti, L.; Della Ciana, M.; Cristino, V.; Vola, G.; et al. Development and Characterization of WO3 Nanoflakes for Selective Ethanol Sensing. Sens. Actuators B Chem. 2021, 347, 130593. [Google Scholar] [CrossRef]
  6. Saruhan, B.; Lontio Fomekong, R.; Nahirniak, S. Review: Influences of Semiconductor Metal Oxide Properties on Gas Sensing Characteristics. Front. Sens. 2021, 2, 657931. [Google Scholar] [CrossRef]
  7. Korotcenkov, G. The Role of Morphology and Crystallographic Structure of Metal Oxides in Response of Conductometric-Type Gas Sensors. Mater. Sci. Eng. R Rep. 2008, 61, 1–39. [Google Scholar] [CrossRef]
  8. Gao, X.; Zhang, T. An Overview: Facet-Dependent Metal Oxide Semiconductor Gas Sensors. Sens. Actuators B Chem. 2018, 277, 604–633. [Google Scholar] [CrossRef]
  9. Rudel, H.E.; Lane, M.K.M.; Muhich, C.L.; Zimmerman, J.B. Toward Informed Design of Nanomaterials: A Mechanistic Analysis of Structure–Property–Function Relationships for Faceted Nanoscale Metal Oxides. ACS Nano 2020, 14, 16472–16501. [Google Scholar] [CrossRef]
  10. Yang, Y.; Hong, A.; Liang, Y.; Xu, K.; Yu, T.; Shi, J.; Zeng, F.; Qu, Y.; Liu, Y.; Ding, M.; et al. High-Energy {001} Crystal Facets and Surface Fluorination Engineered Gas Sensing Properties of Anatase Titania Nanocrystals. Appl. Surf. Sci. 2017, 423, 602–610. [Google Scholar] [CrossRef]
  11. Xu, J.; Xue, Z.; Qin, N.; Cheng, Z.; Xiang, Q. The Crystal Facet-Dependent Gas Sensing Properties of ZnO Nanosheets: Experimental and Computational Study. Sens. Actuators B Chem. 2017, 242, 148–157. [Google Scholar] [CrossRef]
  12. Zhu, L.-Y.; Ou, L.-X.; Mao, L.-W.; Wu, X.-Y.; Liu, Y.-P.; Lu, H.-L. Advances in Noble Metal-Decorated Metal Oxide Nanomaterials for Chemiresistive Gas Sensors: Overview. Nano-Micro Lett. 2023, 15, 89. [Google Scholar] [CrossRef] [PubMed]
  13. Staerz, A.F.; Seo, H.G.; Tuller, H.L. Surface Electron Modulation of Metal Oxide-based Electrochemical Devices by Surface Additives—Linking Sensors and Fuel Cells. J. Am. Ceram. Soc. 2024, 107, 1959–1973. [Google Scholar] [CrossRef]
  14. Zhu, M.; Zhang, H.; Zhang, S.; Yao, H.; Shi, X.; Xu, S. Chemoresistive Gas Sensors Based on Noble-Metal-Decorated Metal Oxide Semiconductors for H2 Detection. Materials 2025, 18, 451. [Google Scholar] [CrossRef]
  15. Shah, V.; Bhaliya, J.; Patel, G.M.; Joshi, P. Recent Advancement in Pd-Decorated Nanostructures for Its Catalytic and Chemiresistive Gas Sensing Applications: A Review. Top. Catal. 2022, 1–41. [Google Scholar] [CrossRef]
  16. Cheng, Y.; Guo, H.; Wang, Y.; Zhao, Y.; Li, Y.; Liu, L.; Li, H.; Duan, H. Low Cost Fabrication of Highly Sensitive Ethanol Sensor Based on Pd-Doped α-Fe2O3 Porous Nanotubes. Mater. Res. Bull. 2018, 105, 21–27. [Google Scholar] [CrossRef]
  17. Degler, D.; Weimar, U.; Barsan, N. Current Understanding of the Fundamental Mechanisms of Doped and Loaded Semiconducting Metal-Oxide-Based Gas Sensing Materials. ACS Sens. 2019, 4, 2228–2249. [Google Scholar] [CrossRef]
  18. Hunter, G.W.; Akbar, S.; Bhansali, S.; Daniele, M.; Erb, P.D.; Johnson, K.; Liu, C.-C.; Miller, D.; Oralkan, O.; Hesketh, P.J.; et al. Editors’ Choice—Critical Review—A Critical Review of Solid State Gas Sensors. J. Electrochem. Soc. 2020, 167, 037570. [Google Scholar] [CrossRef]
  19. Jamnani, S.R.; Moghaddam, H.M.; Leonardi, S.G.; Neri, G.; Ferlazzo, A. VOCs Sensing Properties of Samarium Oxide Nanorods. Ceram. Int. 2024, 50, 403–411. [Google Scholar] [CrossRef]
  20. Arun Kumar, K.L.; Durgajanani, S.; Jeyaprakash, B.G.; Balaguru Rayappan, J.B. Nanostructured Ceria Thin Film for Ethanol and Trimethylamine Sensing. Sens. Actuators B Chem. 2013, 177, 19–26. [Google Scholar] [CrossRef]
  21. Chi Tsang, S.; Bulpitt, C. Rare Earth Oxide Sensors for Ethanol Analysis. Sens. Actuators B Chem. 1998, 52, 226–235. [Google Scholar] [CrossRef]
  22. Sharma, N.; Choudhury, S.P. Gas Sensing Using Metal Oxide Semiconductor Doped with Rare Earth Elements: A Review. Mater. Sci. Eng. B 2024, 307, 117505. [Google Scholar] [CrossRef]
  23. Spagnoli, E.; Gaiardo, A.; Fabbri, B.; Valt, M.; Krik, S.; Ardit, M.; Cruciani, G.; Della Ciana, M.; Vanzetti, L.; Vola, G.; et al. Design of a Metal-Oxide Solid Solution for Sub-Ppm H2 Detection. ACS Sens. 2022, 7, 573–583. [Google Scholar] [CrossRef]
  24. Spagnoli, E.; Fabbri, B.; Gaiardo, A.; Valt, M.; Ardit, M.; Krik, S.; Cruciani, G.; Della Ciana, M.; Vanzetti, L.; Vola, G.; et al. Design of a Metal-Oxide Solid Solution for Selective Detection of Ethanol with Marginal Influence by Humidity. Sens. Actuators B Chem. 2022, 370, 132426. [Google Scholar] [CrossRef]
  25. de Lacy Costello, B.P.J.; Ewen, R.J.; Ratcliffe, N.M.; Sivanand, P.S. Thick Film Organic Vapour Sensors Based on Binary Mixtures of Metal Oxides. Sens. Actuators B Chem. 2003, 92, 159–166. [Google Scholar] [CrossRef]
  26. Peng, S.; Ma, M.; Yang, W.; Wang, Z.; Wang, Z.; Bi, J.; Wu, J. Acetone Sensing with Parts-per-Billion Limit of Detection Using a BiFeO3-Based Solid Solution Sensor at the Morphotropic Phase Boundary. Sens. Actuators B Chem. 2020, 313, 128060. [Google Scholar] [CrossRef]
  27. Ueda, T.; Kamura, S.; Shimizu, Y.; Hyodo, T. Effects of Thickness of CeO2-Added Au Electrodes of YSZ-Based Gas Sensors on VOC-Sensing Properties. Sens. Actuators B Chem. 2024, 417, 136217. [Google Scholar] [CrossRef]
  28. Zakaria, S.A.; Ahmadi, S.H.; Amini, M.H. CeO2/Ni-Al Layered Double Hydroxide Composite as a Gas Sensor for Volatile Organic Compounds Detection. Mater. Today Commun. 2024, 40, 109677. [Google Scholar] [CrossRef]
  29. Ortega, P.P.; Gherardi, S.; Spagnoli, E.; Fabbri, B.; Landini, N.; Malagù, C.; Macchi, C.; Aldao, C.M.; Ponce, M.A.; Simões, A.Z.; et al. Deciphering the CO Sensing Mechanisms of CeO2-Based Nanostructured Semiconductors: Influence of Doping, Morphology, and Humidity. Sens. Actuators B Chem. 2025, 440, 137921. [Google Scholar] [CrossRef]
  30. Ueda, T.; Hayashi, H.; Tsukahara, R.; Shimizu, Y.; Hyodo, T. Effects of Structure and Thickness of Ce0.9Pr0.1O2 Electrodes of YSZ-Based Gas Sensors on VOC-Sensing Properties. Sens. Actuators B Chem. 2025, 422, 136580. [Google Scholar] [CrossRef]
  31. Fois, M.; Cox, T.; Ratcliffe, N.; de Lacy Costello, B. Rare Earth Doped Metal Oxide Sensor for the Multimodal Detection of Volatile Organic Compounds (VOCs). Sens. Actuators B Chem. 2021, 330, 129264. [Google Scholar] [CrossRef]
  32. Shailja; Singh, K.J.; Sharma, S. Selective Xylene Sensor Employing Europium-Doped Nickel Oxide Nanoparticles. J. Mater. Sci. Mater. Electron. 2022, 33, 26243–26262. [Google Scholar] [CrossRef]
  33. Gaiardo, A.; Zonta, G.; Gherardi, S.; Malagù, C.; Fabbri, B.; Valt, M.; Vanzetti, L.; Landini, N.; Casotti, D.; Cruciani, G.; et al. Nanostructured SmFeO3 Gas Sensors: Investigation of the Gas Sensing Performance Reproducibility for Colorectal Cancer Screening. Sensors 2020, 20, 5910. [Google Scholar] [CrossRef]
  34. Ahmadnia-Feyzabad, S.; Mortazavi, Y.; Khodadadi, A.A.; Hemmati, S. Sm2O3 Doped-SnO2 Nanoparticles, Very Selective and Sensitive to Volatile Organic Compounds. Sens. Actuators B Chem. 2013, 181, 910–918. [Google Scholar] [CrossRef]
  35. Zhang, Y.; Zhou, L.; Liu, Y.; Liu, D.; Liu, F.; Liu, F.; Yan, X.; Liang, X.; Gao, Y.; Lu, G. Gas Sensor Based on Samarium Oxide Loaded Mulberry-Shaped Tin Oxide for Highly Selective and Sub Ppm-Level Acetone Detection. J. Colloid Interface Sci. 2018, 531, 74–82. [Google Scholar] [CrossRef]
  36. Ma, L.; Ma, S.Y.; Shen, X.F.; Wang, T.T.; Jiang, X.H.; Chen, Q.; Qiang, Z.; Yang, H.M.; Chen, H. PrFeO3 Hollow Nanofibers as a Highly Efficient Gas Sensor for Acetone Detection. Sens. Actuators B Chem. 2018, 255, 2546–2554. [Google Scholar] [CrossRef]
  37. Pei, S.; Ma, S.; Xu, X.; Xu, X.; Almamoun, O. Modulated PrFeO3 by Doping Sm3+ for Enhanced Acetone Sensing Properties. J. Alloys Compd. 2021, 856, 158274. [Google Scholar] [CrossRef]
  38. Ni, P.; Ma, S.; Ma, N.; Xu, C.; Fan, G.; Guo, J.; Wei, J.; Liu, J. Porous Hollow Sphere Structure PrFeO3 as an Efficient Sensing Material for N-Butanol Detection. J. Alloys Compd. 2024, 1002, 175392. [Google Scholar] [CrossRef]
  39. Tricoli, A.; Righettoni, M.; Pratsinis, S.E. Minimal Cross-Sensitivity to Humidity during Ethanol Detection by SnO2–TiO2 Solid Solutions. Nanotechnology 2009, 20, 315502. [Google Scholar] [CrossRef]
  40. Spagnoli, E.; Valt, M.; Gaiardo, A.; Fabbri, B.; Guidi, V. Insights into the Sensing Mechanism of a Metal-Oxide Solid Solution via Operando Diffuse Reflectance Infrared Fourier Transform Spectroscopy. Nanomaterials 2023, 13, 2708. [Google Scholar] [CrossRef]
  41. Chakir, A.; Mehdaoui, B.; Chari, A.; Bih, L.; El Bouari, A. Structural and Dielectric Properties of PrFeTiO5 Oxide. J. Mater. Sci. Mater. Electron. 2022, 33, 6150–6167. [Google Scholar] [CrossRef]
  42. Mizumoto, A.; Ohashi, S.; Hirohashi, K.; Amanuma, Y.; Matsuda, T.; Muto, M. Molecular Mechanisms of Acetaldehyde-Mediated Carcinogenesis in Squamous Epithelium. Int. J. Mol. Sci. 2017, 18, 1943. [Google Scholar] [CrossRef]
  43. Baer, Z.C.; Bormann, S.; Sreekumar, S.; Grippo, A.; Toste, F.D.; Blanch, H.W.; Clark, D.S. Co-production of Acetone and Ethanol with Molar Ratio Control Enables Production of Improved Gasoline or Jet Fuel Blends. Biotechnol. Bioeng. 2016, 113, 2079–2087. [Google Scholar] [CrossRef] [PubMed]
  44. Nazaroff, W.W.; Weschler, C.J. Methanol and Ethanol in Indoor Environments. Indoor Environ. 2024, 1, 100049. [Google Scholar] [CrossRef]
  45. Rodríguez-Torres, M.; Altuzar, V.; Mendoza-Barrera, C.; Beltrán-Pérez, G.; Castillo-Mixcóatl, J.; Muñoz-Aguirre, S. Acetone Detection and Classification as Biomarker of Diabetes Mellitus Using a Quartz Crystal Microbalance Gas Sensor Array. Sensors 2023, 23, 9823. [Google Scholar] [CrossRef]
  46. Rossi, A.; Spagnoli, E.; Tralli, F.; Marzocchi, M.; Guidi, V.; Fabbri, B. New Approach for the Detection of Sub-Ppm Limonene: An Investigation through Chemoresistive Metal-Oxide Semiconductors. Sensors 2023, 23, 6291. [Google Scholar] [CrossRef] [PubMed]
  47. Rossi, A.; Spagnoli, E.; Visonà, A.; Ahmed, D.; Marzocchi, M.; Guidi, V.; Fabbri, B. SO2 Detection over a Wide Range of Concentrations: An Exploration on MOX-Based Gas Sensors. Chemosensors 2024, 12, 111. [Google Scholar] [CrossRef]
  48. Fabbri, B.; Valt, M.; Parretta, C.; Gherardi, S.; Gaiardo, A.; Malagù, C.; Mantovani, F.; Strati, V.; Guidi, V. Correlation of Gaseous Emissions to Water Stress in Tomato and Maize Crops: From Field to Laboratory and Back. Sens. Actuators B Chem. 2020, 303, 127227. [Google Scholar] [CrossRef]
  49. Wolkoff, P.; Kjærgaard, S.K. The Dichotomy of Relative Humidity on Indoor Air Quality. Environ. Int. 2007, 33, 850–857. [Google Scholar] [CrossRef]
  50. TIS-GDV. Climate/Humidity Table. Available online: https://www.tis-gdv.de/tis_e/misc/klima-htm/ (accessed on 31 May 2025).
  51. Zhang, X.; Sun, J.; Tang, K.; Wang, H.; Chen, T.; Jiang, K.; Zhou, T.; Quan, H.; Guo, R. Ultralow Detection Limit and Ultrafast Response/Recovery of the H2 Gas Sensor Based on Pd-Doped RGO/ZnO-SnO2 from Hydrothermal Synthesis. Microsystems Nanoeng. 2022, 8, 67. [Google Scholar] [CrossRef]
  52. ACGIH. Ammonia. Available online: https://www.acgih.org/ammonia/ (accessed on 10 May 2025).
  53. Rossi, A.; Fabbri, B.; Spagnoli, E.; Gaiardo, A.; Valt, M.; Ferroni, M.; Ardit, M.; Krik, S.; Pedrielli, A.; Vanzetti, L.; et al. Functionalization of Indium Oxide for Empowered Detection of CO2 over an Extra-Wide Range of Concentrations. ACS Appl. Mater. Interfaces 2023, 15, 33732–33743. [Google Scholar] [CrossRef] [PubMed]
  54. ACGIH. Carbon Monoxide. Available online: https://www.acgih.org/Carbon-Monoxide-3/ (accessed on 10 May 2025).
  55. Duan, X.; Jiang, Y.; Liu, B.; Duan, Z.; Zhang, Y.; Yuan, Z.; Tai, H. Enhancing the Carbon Dioxide Sensing Performance of LaFeO3 by Co Doping. Sens. Actuators B Chem. 2024, 402, 135136. [Google Scholar] [CrossRef]
  56. Muniz, F.T.L.; Miranda, M.A.R.; Morilla dos Santos, C.; Sasaki, J.M. The Scherrer Equation and the Dynamical Theory of X-Ray Diffraction. Acta Crystallogr. Sect. A Found. Adv. 2016, 72, 385–390. [Google Scholar] [CrossRef] [PubMed]
  57. He, K.; Chen, N.; Wang, C.; Wei, L.; Chen, J. Method for Determining Crystal Grain Size by X-Ray Diffraction. Cryst. Res. Technol. 2018, 53, 1700157. [Google Scholar] [CrossRef]
  58. Patwe, S.J.; Katari, V.; Salke, N.P.; Deshpande, S.K.; Rao, R.; Gupta, M.K.; Mittal, R.; Achary, S.N.; Tyagi, A.K. Structural and Electrical Properties of Layered Perovskite Type Pr2Ti2O7: Experimental and Theoretical Investigations. J. Mater. Chem. C 2015, 3, 4570–4584. [Google Scholar] [CrossRef]
  59. Long, C.Y.; Peng, F.F.; Jin, M.M.; Tang, P.S.; Chen, H.F. Preparation and Characterization of Pr2Ti2O7 by Sol-Gel Process. Key Eng. Mater. 2017, 748, 413–417. [Google Scholar] [CrossRef]
  60. Enhessari, M.; Razi, M.K.; Etemad, L.; Parviz, A.; Sakhaei, M. Structural, Optical and Magnetic Properties of the Fe2TiO5 Nanopowders. J. Exp. Nanosci. 2014, 9, 167–176. [Google Scholar] [CrossRef]
  61. Gaiardo, A.; Fabbri, B.; Guidi, V.; Bellutti, P.; Giberti, A.; Gherardi, S.; Vanzetti, L.; Malagù, C.; Zonta, G. Metal Sulfides as Sensing Materials for Chemoresistive Gas Sensors. Sensors 2016, 16, 296. [Google Scholar] [CrossRef]
  62. Gaiardo, A.; Fabbri, B.; Giberti, A.; Valt, M.; Gherardi, S.; Guidi, V.; Malagù, C.; Bellutti, P.; Pepponi, G.; Casotti, D.; et al. Tunable Formation of Nanostructured SiC/SiOC Core-Shell for Selective Detection of SO2. Sens. Actuators B Chem. 2020, 305, 127485. [Google Scholar] [CrossRef]
  63. Madou, M.J.; Morrison, S.R. Chemical Sensing with Solid State Devices; Elsevier: Amsterdam, The Netherlands, 1989; ISBN 9780124649651. [Google Scholar]
  64. Gurlo, A. Interplay between O2 and SnO2: Oxygen Ionosorption and Spectroscopic Evidence for Adsorbed Oxygen. ChemPhysChem 2006, 7, 2041–2052. [Google Scholar] [CrossRef]
  65. Barsan, N.; Weimar, U. Conduction Model of Metal Oxide Gas Sensors. J. Electroceramics 2001, 7, 143–167. [Google Scholar] [CrossRef]
  66. Haron, W.; Wisitsoraat, A.; Wongnawa, S. Nanostructured Perovskite Oxides—LaMO3 (M = Al, Co, Fe) Prepared by Co-Precipitation Method and Their Ethanol-Sensing Characteristics. Ceram. Int. 2017, 43, 5032–5040. [Google Scholar] [CrossRef]
  67. Singh, P.; Bansal, N.K.; Dey, S.; Singh, R.; Singh, T. Recent Progress on Perovskite Materials for VOC Gas Sensing. Langmuir 2024, 40, 21931–21956. [Google Scholar] [CrossRef] [PubMed]
  68. Li, C.; Choi, P.G.; Kim, K.; Masuda, Y. High Performance Acetone Gas Sensor Based on Ultrathin Porous NiO Nanosheet. Sens. Actuators B Chem. 2022, 367, 132143. [Google Scholar] [CrossRef]
  69. Bhowmik, B.; Dutta, K.; Hazra, A.; Bhattacharyya, P. Low Temperature Acetone Detection by P-Type Nano-Titania Thin Film: Equivalent Circuit Model and Sensing Mechanism. Solid State Electron. 2014, 99, 84–92. [Google Scholar] [CrossRef]
  70. Yang, B.-Q.; Cheng, X.-L.; Zhao, X.; Zhang, X.-F.; Guo, C.-Y.; Huo, L.-H.; Wang, T.-T.; Huang, C.-B.; Major, Z.; Xu, Y.-M. Development of a High Property Acetone Sensor Based on TiO2 Core-Shell Spheres and Their Sensing Mechanism Analysis. Rare Met. 2025, 44, 1182–1194. [Google Scholar] [CrossRef]
  71. Carotta, M.C.; Fioravanti, A.; Gherardi, S.; Malagù, C.; Sacerdoti, M.; Ghiotti, G.; Morandi, S. (Ti, Sn) Solid Solutions as Functional Materials for Gas Sensing. Sens. Actuators B Chem. 2014, 194, 195–205. [Google Scholar] [CrossRef]
  72. Egashira, M.; Nakashima, M.; Kawasumi, S.; Selyama, T. Temperature Programmed Desorption Study of Water Adsorbed on Metal Oxides. 2. Tin Oxide Surfaces. J. Phys. Chem. 1981, 85, 4125–4130. [Google Scholar] [CrossRef]
  73. Bandura, A.V.; Kubicki, J.D.; Sofo, J.O. Comparisons of Multilayer H2O Adsorption onto the (110) Surfaces of α-TiO2 and SnO2 as Calculated with Density Functional Theory. J. Phys. Chem. B 2008, 112, 11616–11624. [Google Scholar] [CrossRef]
  74. Imrich, T.; Krýsová, H.; Neumann-Spallart, M.; Krýsa, J. Pseudobrookite (Fe2TiO5) Films: Synthesis, Properties and Photoelectrochemical Characterization. Catal. Today 2023, 413–415, 113982. [Google Scholar] [CrossRef]
  75. Geng, W.; Ge, S.; He, X.; Zhang, S.; Gu, J.; Lai, X.; Wang, H.; Zhang, Q. Volatile Organic Compound Gas-Sensing Properties of Bimodal Porous α-Fe2O3 with Ultrahigh Sensitivity and Fast Response. ACS Appl. Mater. Interfaces 2018, 10, 13702–13711. [Google Scholar] [CrossRef] [PubMed]
  76. Yang, J.; Ren, Y.; Yuan, Y.; Zhao, H.; Wang, Y.; Wang, L.; Wang, M.; Liu, J.; Pei, C.; Liu, B.; et al. Enhanced Response of Hydrogenated Fe2O3 Nanostructured Materials to Volatile Organic Compound Vapors and Gas Sensing Mechanism. J. Alloys Compd. 2019, 806, 705–716. [Google Scholar] [CrossRef]
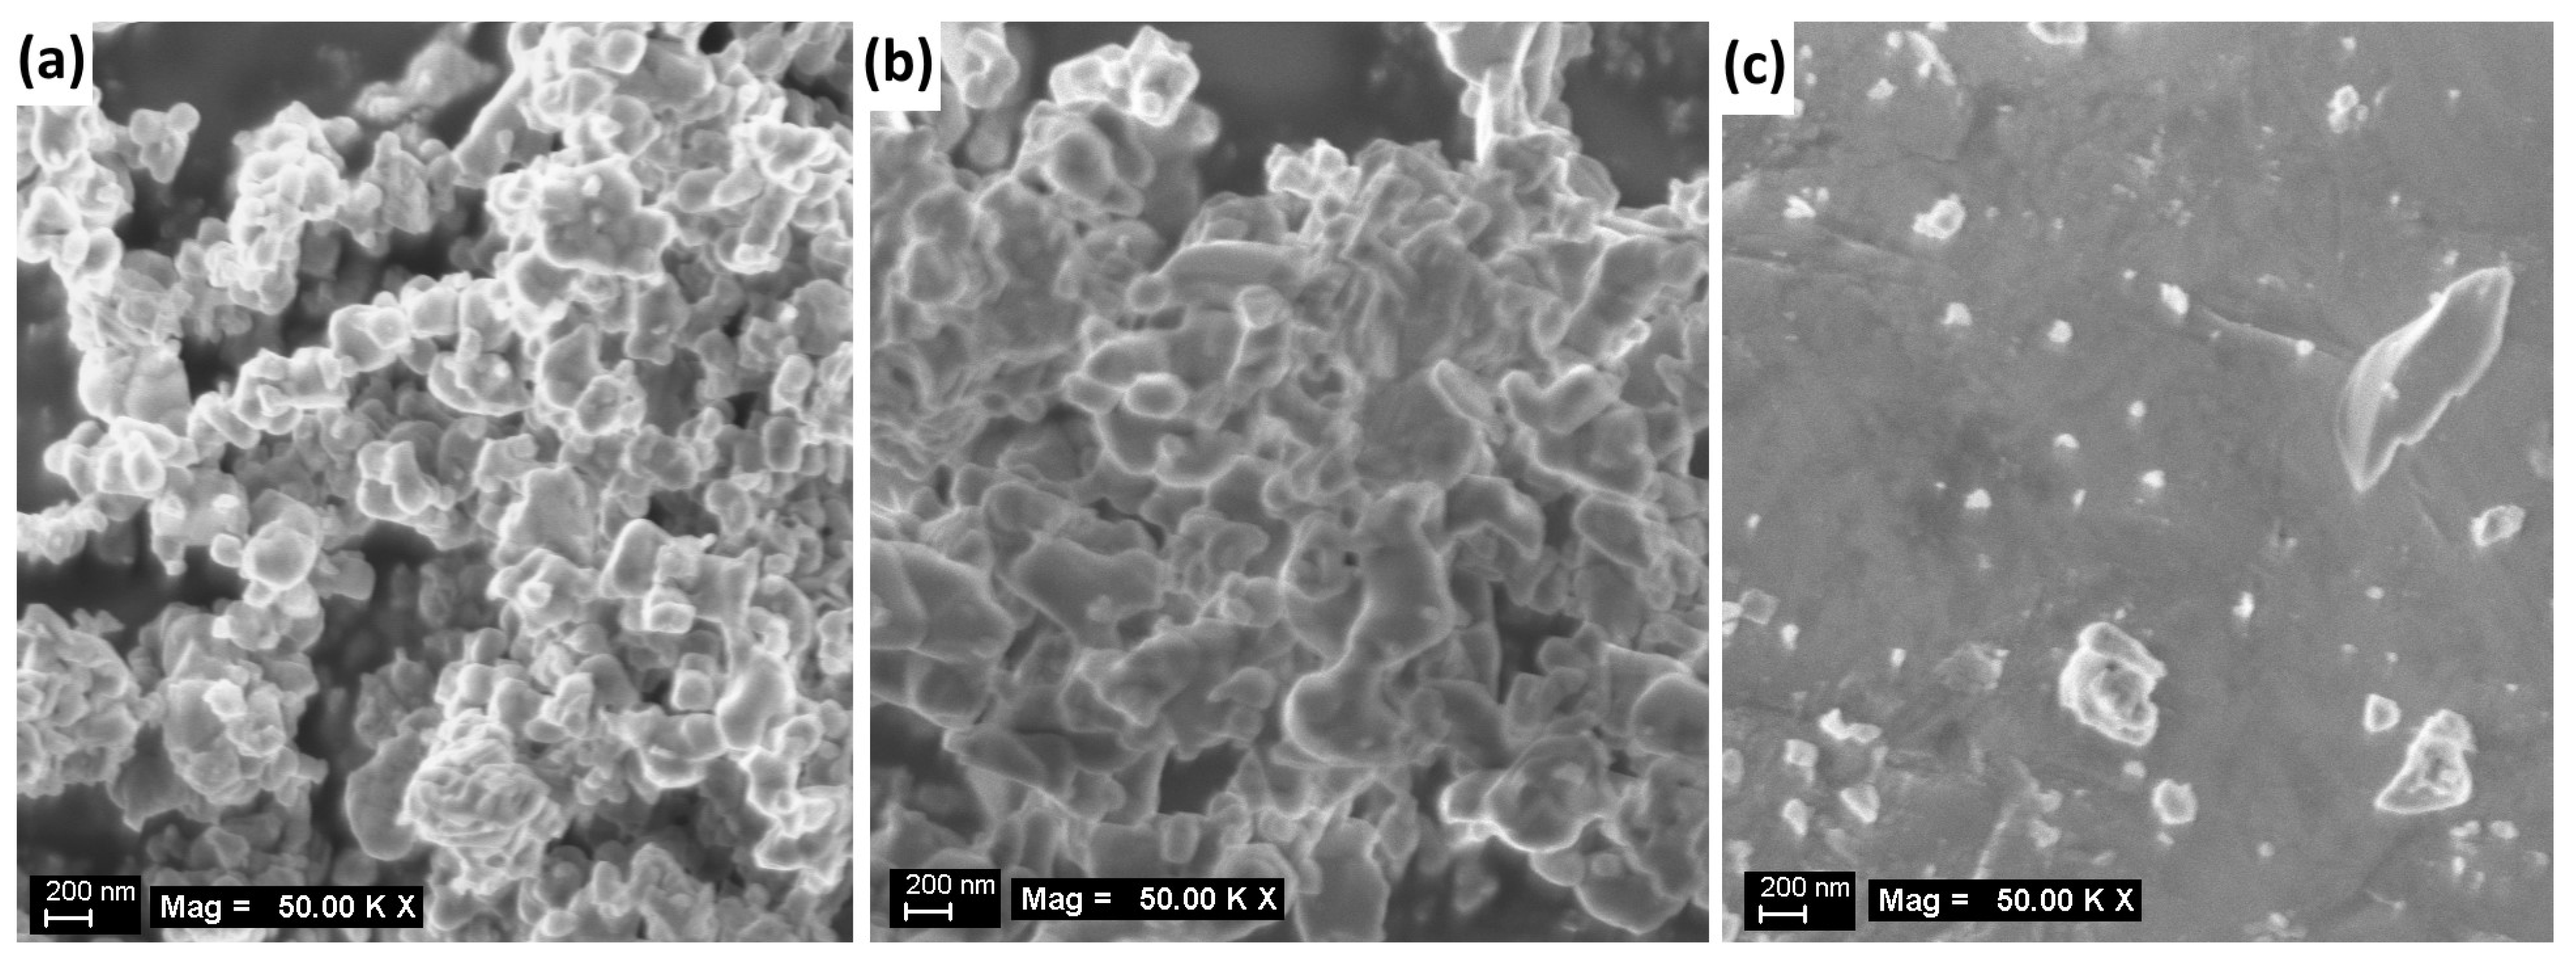
Figure 1. SEM images of the (a) PFT-800, (b) PFT-1000, and (c) PFT-1200 powders.
Chemosensors 13 00222 g001
Figure 2. (a) TEM image of three crystalline areas from the sample PFT-1200 with straight grain boundaries. (b) Electron diffraction pattern from one area showing the single crystal arrangement. (c) High-resolution TEM image of the termination of a crystalline area, showing no presence of secondary phase at the grain boundaries.
Chemosensors 13 00222 g002
Figure 3. Tauc plots showing extrapolation of the straight-line portion to determine the direct band gaps for (a) PFT_800, (b) PFT_1000, and (c) PFT_1200 samples.
Chemosensors 13 00222 g003
Figure 4. (a) Conductance variation of PFT-sensors, operated at 400 °C, after injection of ethanol 5 ppm. Response times of PFT-1200 and PFT-800 are highlighted in gray. (b) Response values of PFT-800 and PFT-1200 towards 5 ppm ethanol gas at working temperatures of 350 °C, 400 °C, and 450 °C.
Chemosensors 13 00222 g004
Figure 5. Conductance variation of PFT films in dry (2RH % @ 28 °C) and wet (17 RH % @ 28 °C) when exposed to 5, 10, 20, and 50 ppm of ethanol (a,d), acetone (b,e), and acetaldehyde (c,f), respectively.
Chemosensors 13 00222 g005
Figure 6. Calibration curves of PFT-800 and PFT-1200 films in dry (2% RH @ 28 °C) and wet (17% RH @ 28 °C) conditions for ethanol, acetone, and acetaldehyde, in the range 1–50 ppm. The error bars correspond to 5% of the instrumental error.
Chemosensors 13 00222 g006
Figure 7. Influence of humidity on response of PFT-1200 and PFT-800 vs. 10 ppm of ethanol, acetone, and acetaldehyde. The temperature inside the chamber was 28 °C in the whole range of RH%. The lines are drawn to guide the eye. The error bars correspond to 5% of the instrumental error.
Chemosensors 13 00222 g007
Figure 8. Radar plot showing PFT-800 and PFT-1200 responses to 25 ppm of ethanol, 25 ppm acetone, 25 ppm acetaldehyde, 25 ppm NH3, 25 ppm CO, 1200 ppm CO2, and 100 ppm H2.
Chemosensors 13 00222 g008
Disclaimer/Publisher’s Note: The statements, opinions and data contained in all publications are solely those of the individual author(s) and contributor(s) and not of MDPI and/or the editor(s). MDPI and/or the editor(s) disclaim responsibility for any injury to people or property resulting from any ideas, methods, instructions or products referred to in the content.