Article

A UV-Photon-Energy-Integrated Gas Sensor Based on Pt-Nanoparticle-Decorated TiO2 Nanorods for Room-Temperature Hydrogen Detection

1
Department of IT Semiconductor Convergence Engineering, Research Institute of Advanced Convergence Technology, Tech University of Korea, Siheung 15073, Republic of Korea
2
Department of Nano & Semiconductor Engineering, Tech University of Korea, Siheung 15073, Republic of Korea
3
Department of Materials Science and Engineering, Seoul National University of Science and Technology, Seoul 01811, Republic of Korea
4
Department of Semiconductor Engineering, Tech University of Korea, Siheung 15073, Republic of Korea
*
Author to whom correspondence should be addressed.
These authors contributed equally to this work.
Chemosensors 2025, 13(5), 177; https://doi.org/10.3390/chemosensors13050177
Submission received: 20 March 2025 / Revised: 28 April 2025 / Accepted: 8 May 2025 / Published: 11 May 2025
(This article belongs to the Special Issue Functional Nanomaterial-Based Gas Sensors)

Abstract

:
Hydrogen sensors play a crucial role in ensuring safety in various industrial applications. In this study, we demonstrated the use of a room-temperature hydrogen gas sensor based on Pt-nanoparticle-decorated TiO2 nanorods (TiO2 NRs/Pt NP). The TiO2 NRs were synthesized via a hydrothermal method, followed by Pt deposition using sputtering and thermal annealing. Under UV illumination, the TiO2 NR/Pt NP gas sensor exhibited a remarkable response of 2.4 at a 1% hydrogen concentration, which is approximately 5.9 times higher than that of bare TiO2 NRs measured in the dark. This enhancement is attributed to the synergistic effect of Pt NPs, which promote charge separation and spillover for oxygen molecules, and UV activation, which generates additional carriers. Moreover, the sensor demonstrated stable and reliable detection of hydrogen concentrations up to 1% without the need for external heating, underscoring its practical applicability under ambient conditions. These results demonstrate that TiO2 NRs/Pt NP, combined with UV activation, provide a promising approach for highly sensitive and room-temperature hydrogen detection, offering significant potential for hydrogen monitoring and hydrogen energy systems.

Graphical Abstract

1. Introduction

Hydrogen is regarded as a clean energy source, which is the ultimate fossil fuel replacement. Hydrogen is an abundant resource that can be extracted from water and other sources and has high energy efficiency. Moreover, using hydrogen as an energy source has the advantage of producing only water as a byproduct. Due to these advantages, hydrogen energy has been applied to a variety of applications such as fuel cells, aerospace, semiconductor processing, power generation, and metal smelting [1,2,3]. Industrial hydrogen sensors typically have a hydrogen-concentration measurement range from 0.01% to 10% to provide flexibility in various applications [4]. In fuel cells, changes in hydrogen concentration directly impact the system’s lifespan and efficiency [5,6]. If the hydrogen concentration is too low, the output voltage of the fuel cell decreases, while if the concentration is too high, it can pose a safety risk to the fuel cell. Therefore, accurately monitoring the hydrogen concentration is essential to ensure the stability of the fuel cell system and to maximize its efficiency.
As sensing materials for hydrogen gas sensors, metal oxide semiconductors (MOSs) (e.g., ZnO, SnO2, TiO2, In2O3, and Cu2O) have attracted much attention due to their low cost, simple manufacturing process, and high sensitivity. Among the various MOS materials, TiO2 has gained significant attention due to its non-toxic nature, high stability, and eco-friendliness. Its wide bandgap (3.0–3.4 eV) and excellent catalytic properties make it an attractive candidate for gas-sensing applications [7].
MOS gas sensors, including TiO2-based sensors, detect gases through the resistance changes induced by gas adsorption and desorption on the material surface. Typically, to facilitate rapid adsorption–desorption reactions, TiO2 gas sensors operate at temperatures above 100 °C [8,9]. However, such high-temperature operations pose challenges such as material phase changes and long-term stability degradation. Therefore, developing room-temperature gas sensors is crucial for enhancing sensor durability and practical applicability. To achieve this, three key strategies—ultraviolet (UV) activation, metal-catalyst doping, and nanostructure engineering—have been explored to enhance the sensing performance at RT [10,11,12,13,14,15,16,17,18,19,20]. Among them, UV activation plays a crucial role by generating electron–hole pairs that enhance surface reactions, reducing the need for external heating. Recently, Y.-Y. Guo et al. reported that high sensitivity could be obtained, even at room temperature, using UV activation for a gas sensor comprising a ZnO-TiO2 composite [14]. Furthermore, for hydrogen gas sensors, A. Vijaykumar et al. reported the fabrication of an RT hydrogen gas sensor based on TiO2 thin films (TF) using UV irradiation, achieving a sensitivity of 87.7% at 30 °C for 100 ppm of H2 gas [10]. T. Thathsara et al. reported a UV-assisted hydrogen gas sensor using TiO2/Pd composites to obtain high sensitivity and selectivity [15]. Additionally, metal catalysts such as Pt NPs improve hydrogen dissociation and facilitate charge transfer, leading to increased sensor response and faster recovery times. S. Cui et al. reported on the use of a TiO2/Pd composite-based hydrogen gas sensor, which achieved a high response of 3.5 for a 200 ppm hydrogen concentration at 100 °C [16]. S. Kanth et al. demonstrated the use of an RT hydrogen gas sensor using TiO2 TF/PdO NPs, achieving a response of 70% for a 1% hydrogen concentration [11]. In terms of the structure of the MOS gas sensor, one-dimensional (1D) TiO2 nanostructures, such as TiO2 NRs, offer a high surface area-to-volume ratio, which enhances gas adsorption and reaction kinetics. Despite the individual benefits of these approaches, studies that integrate all three strategies simultaneously remain limited.
In this study, we demonstrated the use of an RT hydrogen sensor based on 1D TiO2 NRs that leverages the combined effects of UV activation and Pt-nanoparticle decoration. TiO2 NRs were synthesized via a hydrothermal method, with Pt NPs serving as the catalytic material. Although the overall sensitivity does not exceed that of sensors operated at elevated temperatures, the TiO2 NRs/Pt NP sensor achieves stable and reproducible hydrogen-sensing performance at room temperature, particularly achieving reliable detection at hydrogen concentrations of up to 1%. The improvement in performance results from the synergistic effect between UV-induced charge-carrier generation and the catalytic activity of Pt NPs. This sensor shows strong potential for practical use in hydrogen monitoring under ambient conditions.

2. Materials and Methods

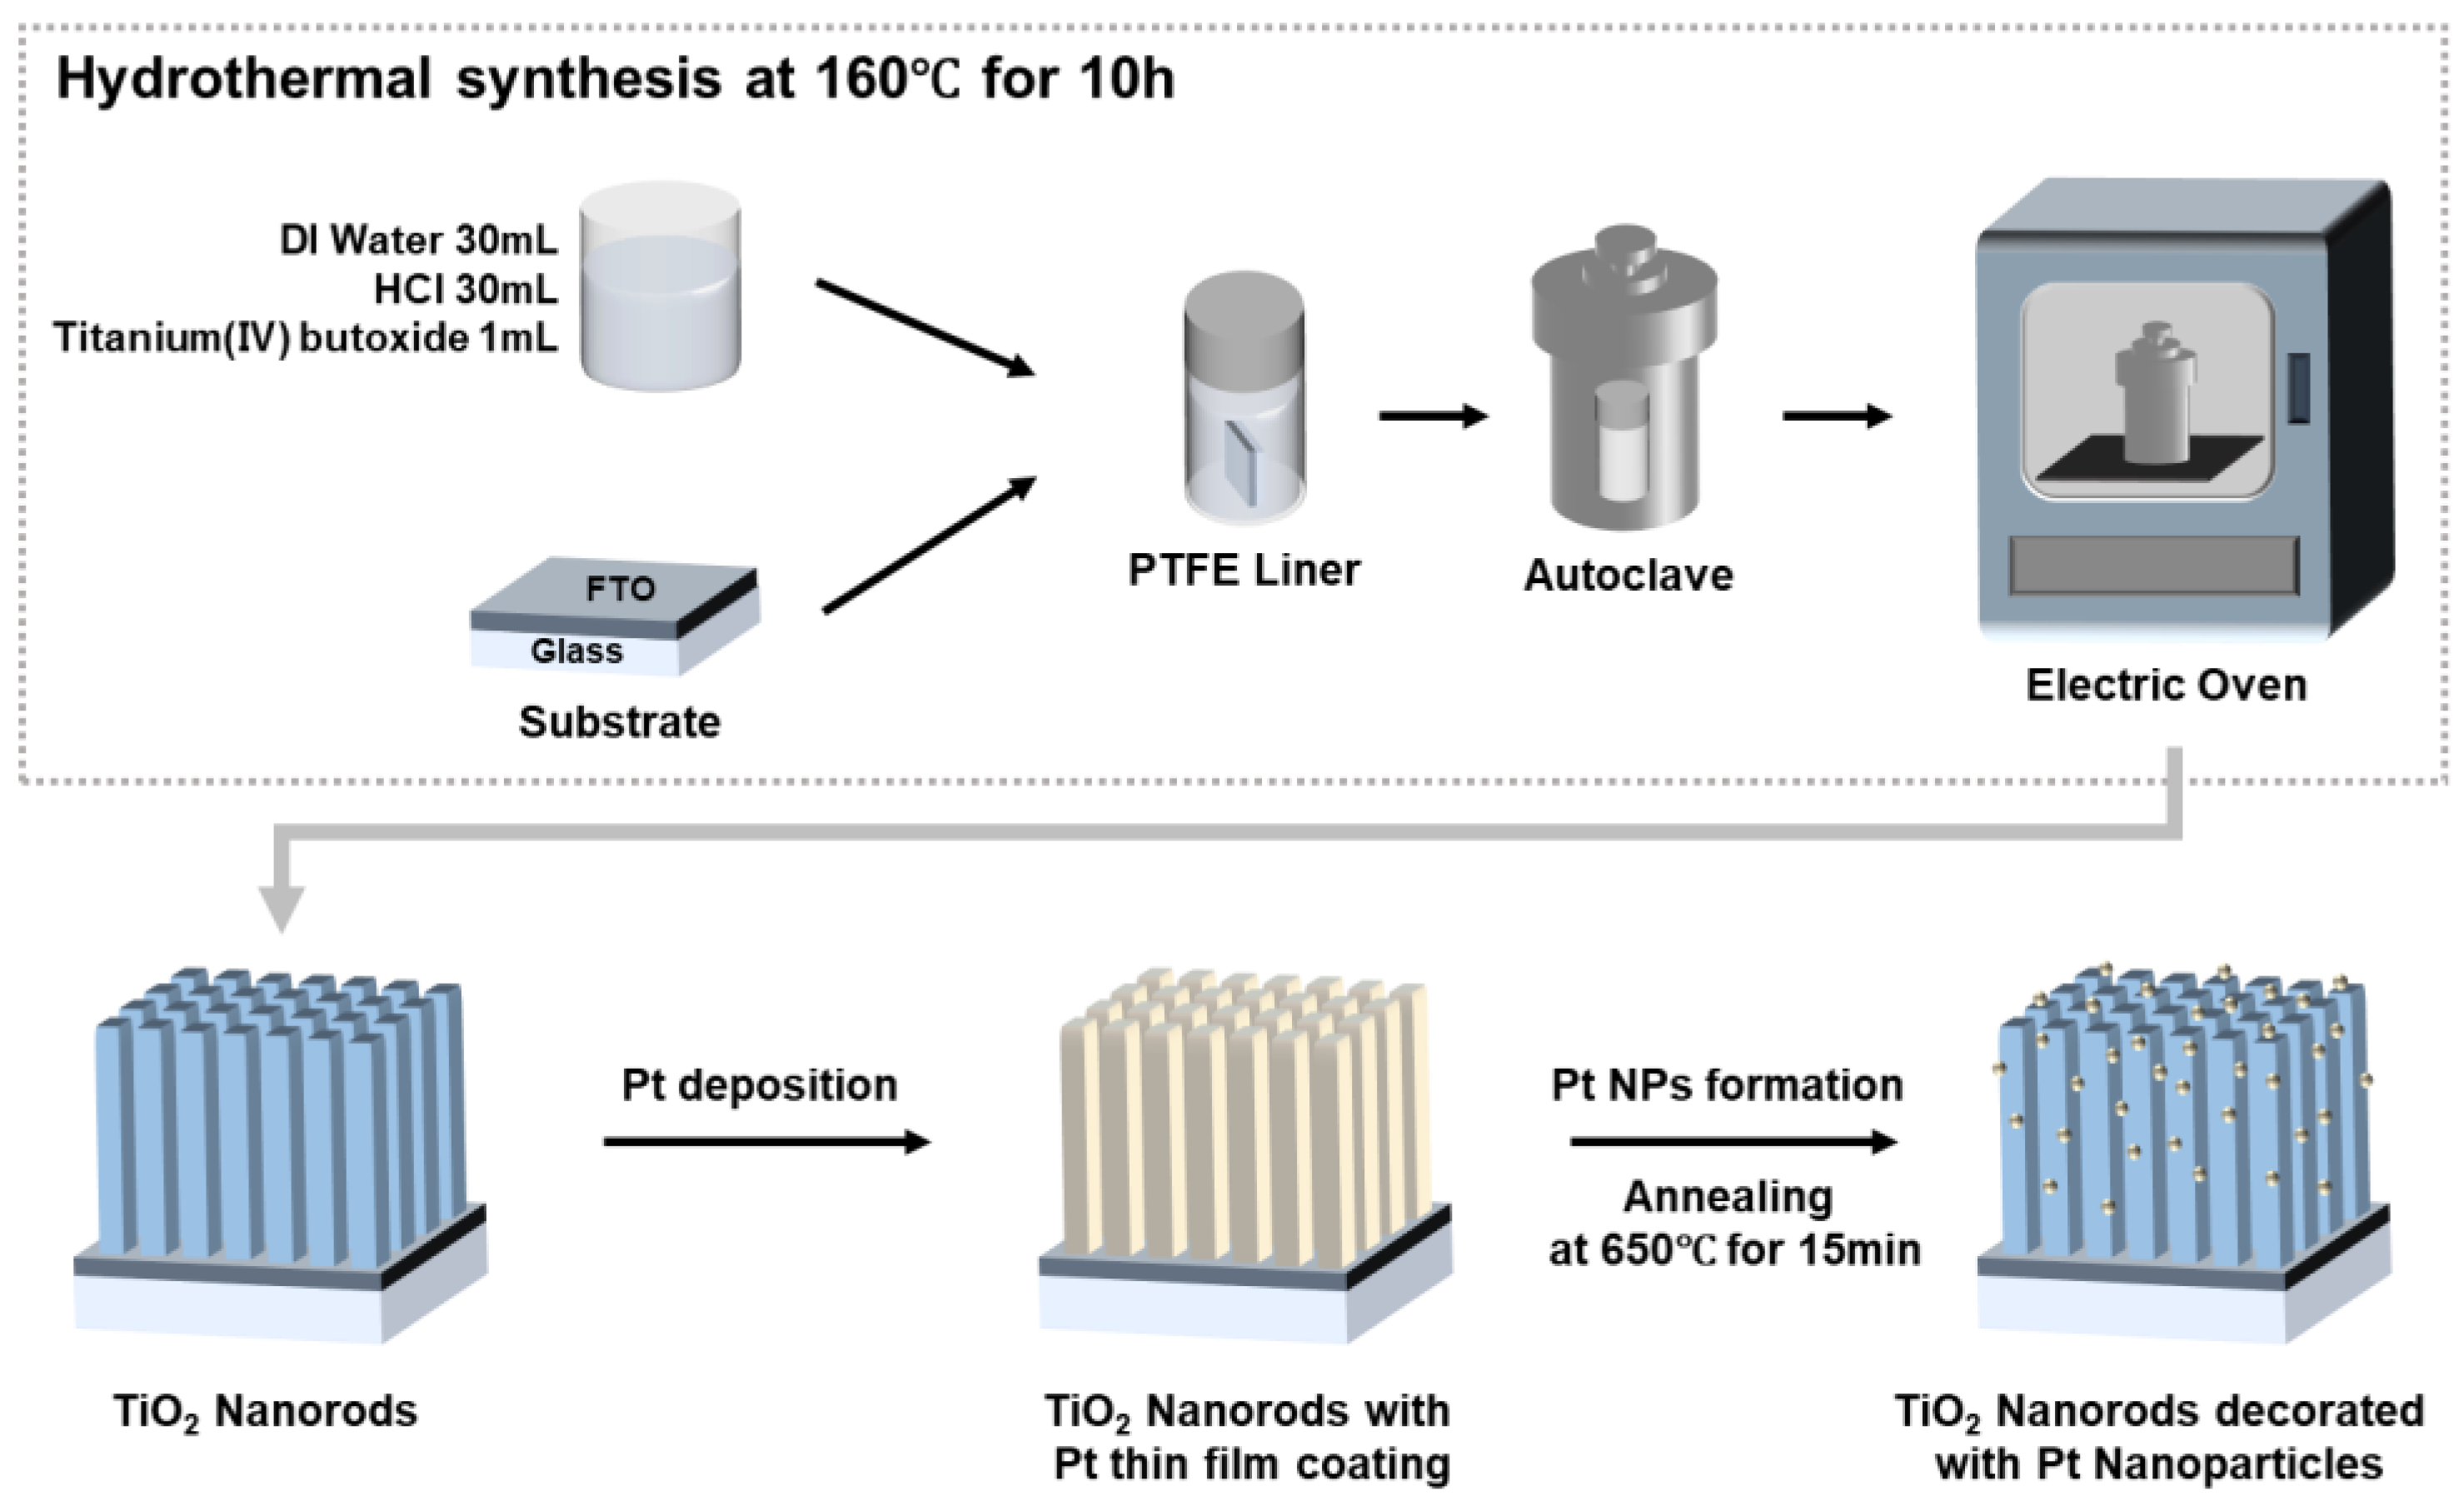
2.1. Synthesis of TiO2 NRs

Figure 1 shows the schematic of fabricating a TiO2 NR/Pt NP-based gas sensor. A fluorine-doped tin oxide (FTO) glass (15 Ω/square) was used as a substrate for the grown TiO2 NRs. The substrates were cut into square-shaped pieces (15 mm × 15 mm) and cleaned by ultrasonication in EnSolv, acetone, and isopropanol alcohol (IPA). After rinsing in deionized (DI) water, the substrates were dried in N2 gas. The aqueous solution was prepared by mixing 30 mL of hydrochloric acid (HCl; MV = 36.46) and 30 mL of DI water. Then, 1 mL of titanium butoxide (97%) was added to the mixture and stirred for 15 min. Subsequently, the mixed solution was poured into a polytetrafluoroethylene (PTFE) liner, and the cleaned substrates were immersed in the solution by placing the substrates vertically. The sealed PTFE liner was autoclaved and then put into the electric oven and maintained at 160 °C for 10 h. After the hydrothermal process, the substrates with the growing TiO2 NRs were cleaned in DI water and dried with N2 gas.

2.2. Synthesis of Pt NPs

The Pt thin film was deposited onto the TiO2 NR surface using a DC sputter coater at 15 mA for 120 s. To agglomerate the Pt, the Pt-coated TiO2 NRs were annealed in a box furnace at 650 °C for 15 min in ambient air.

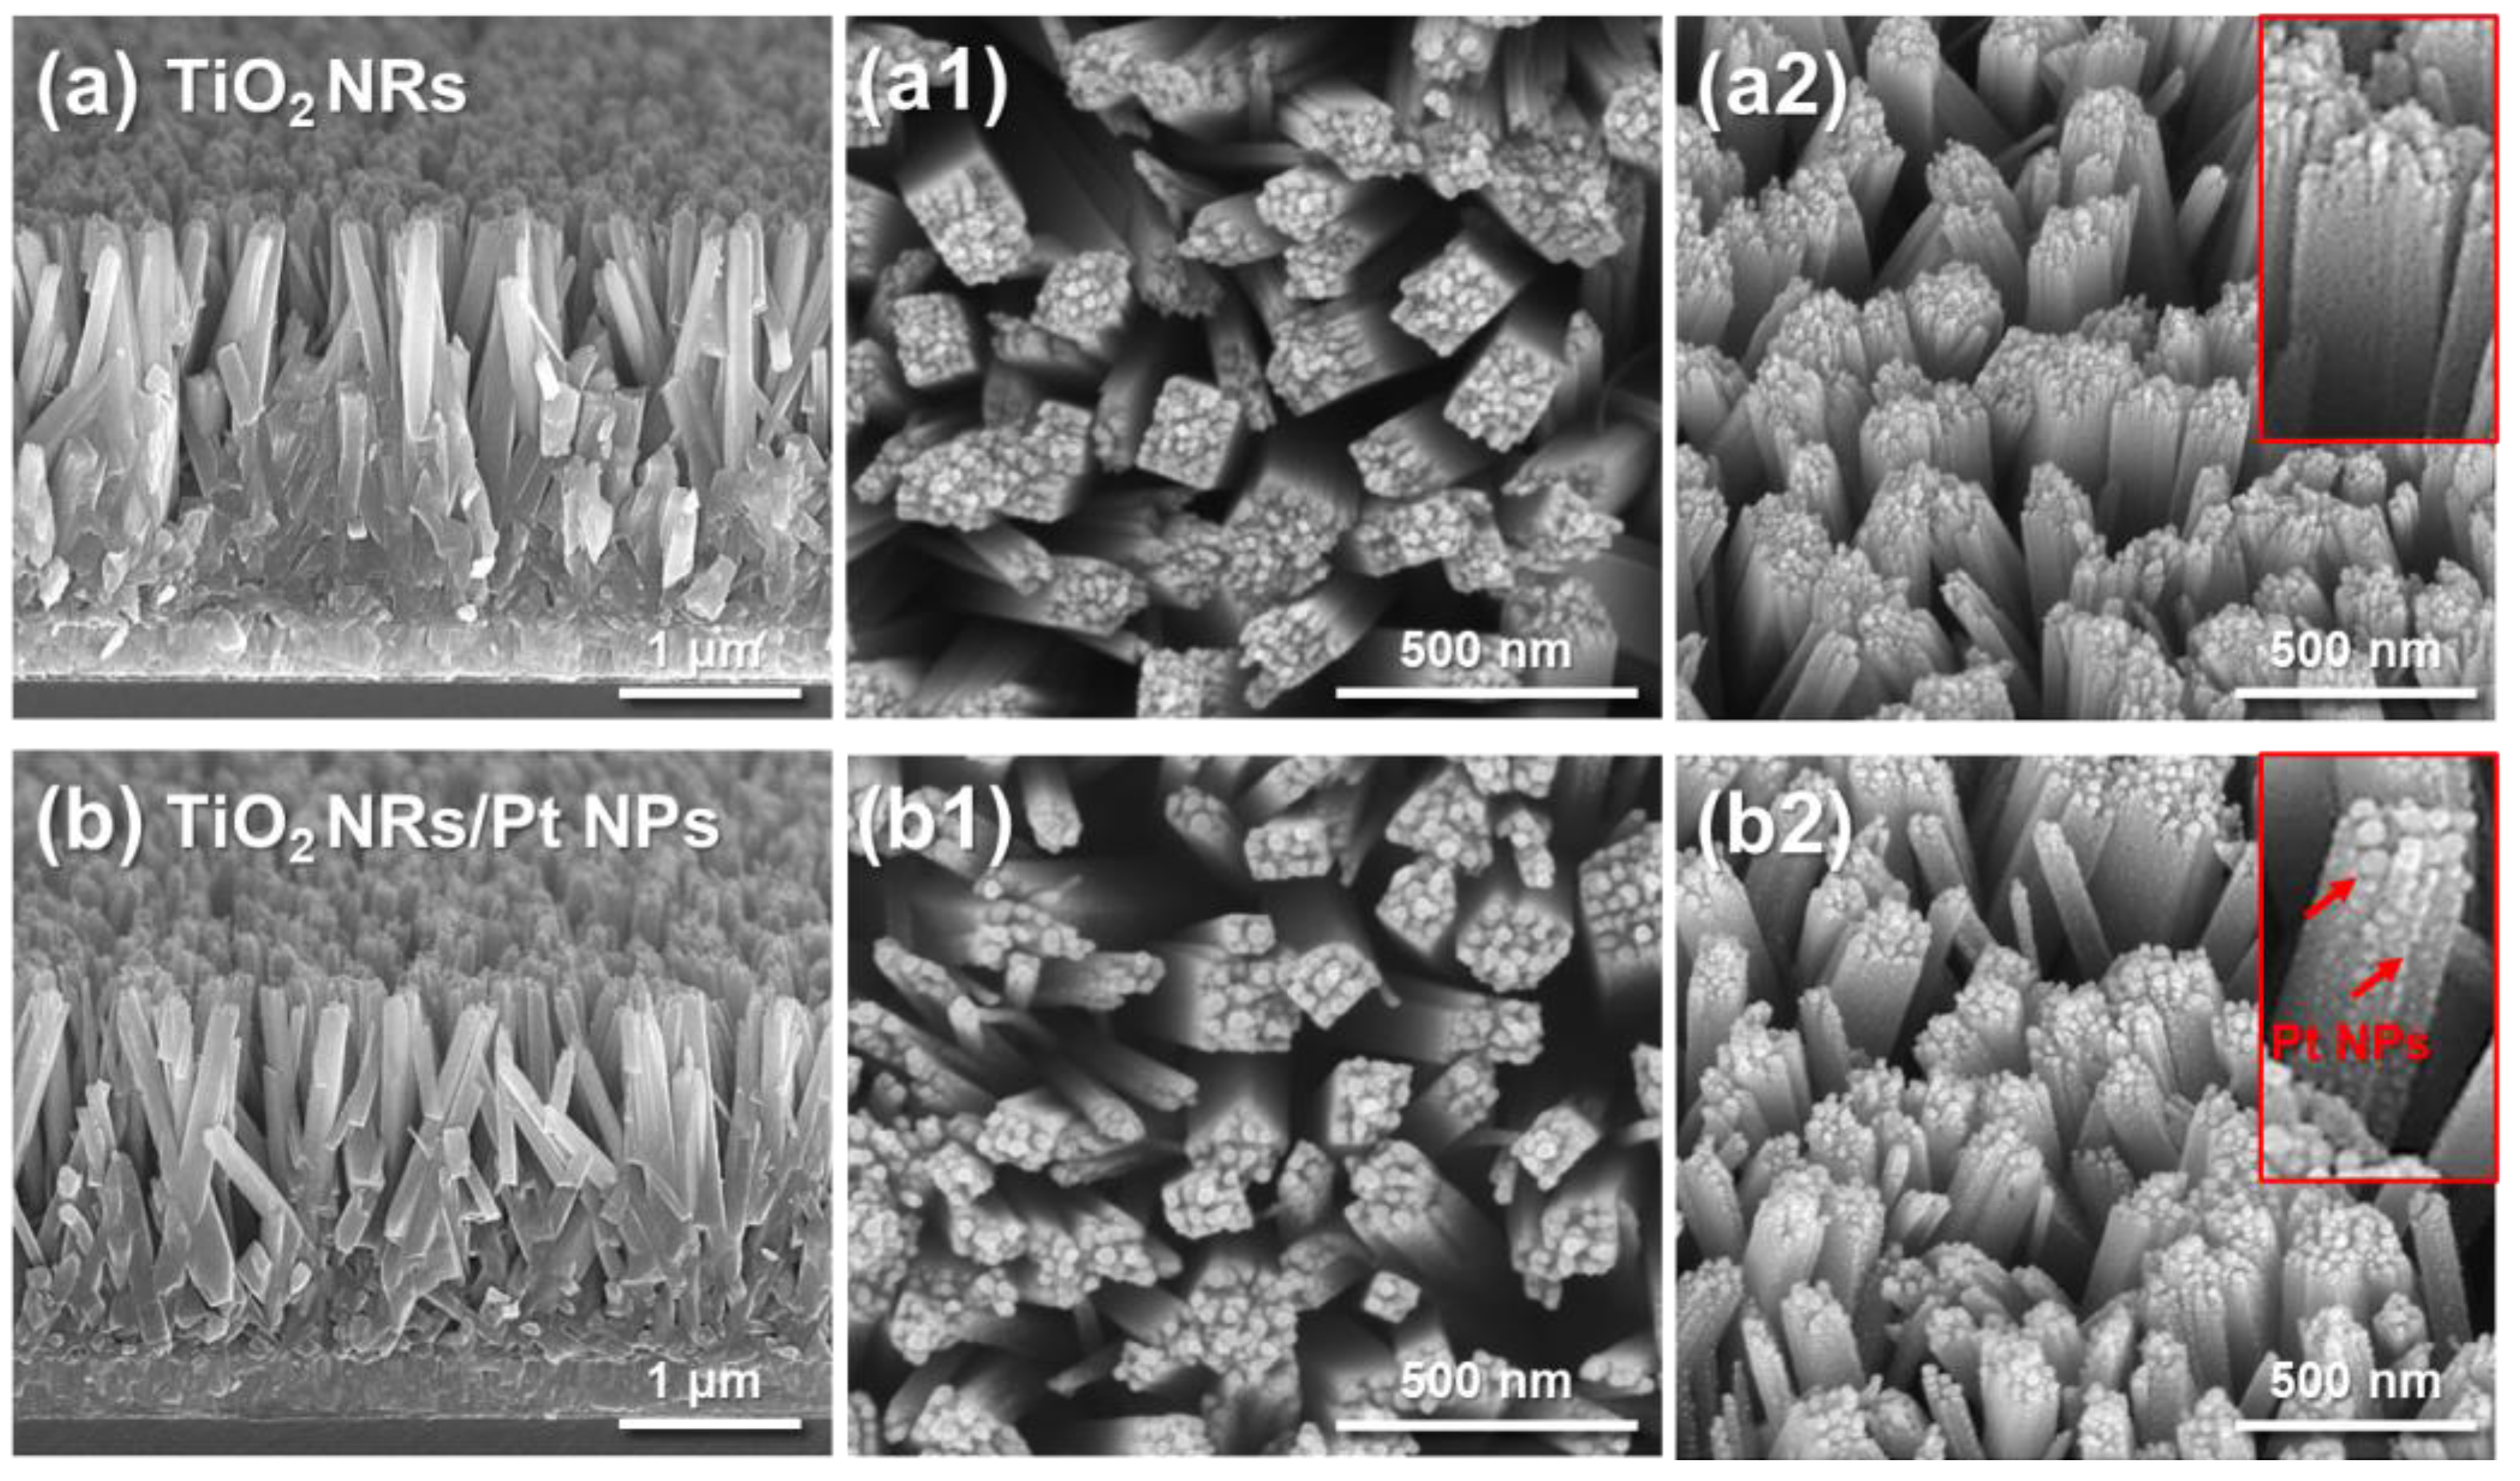
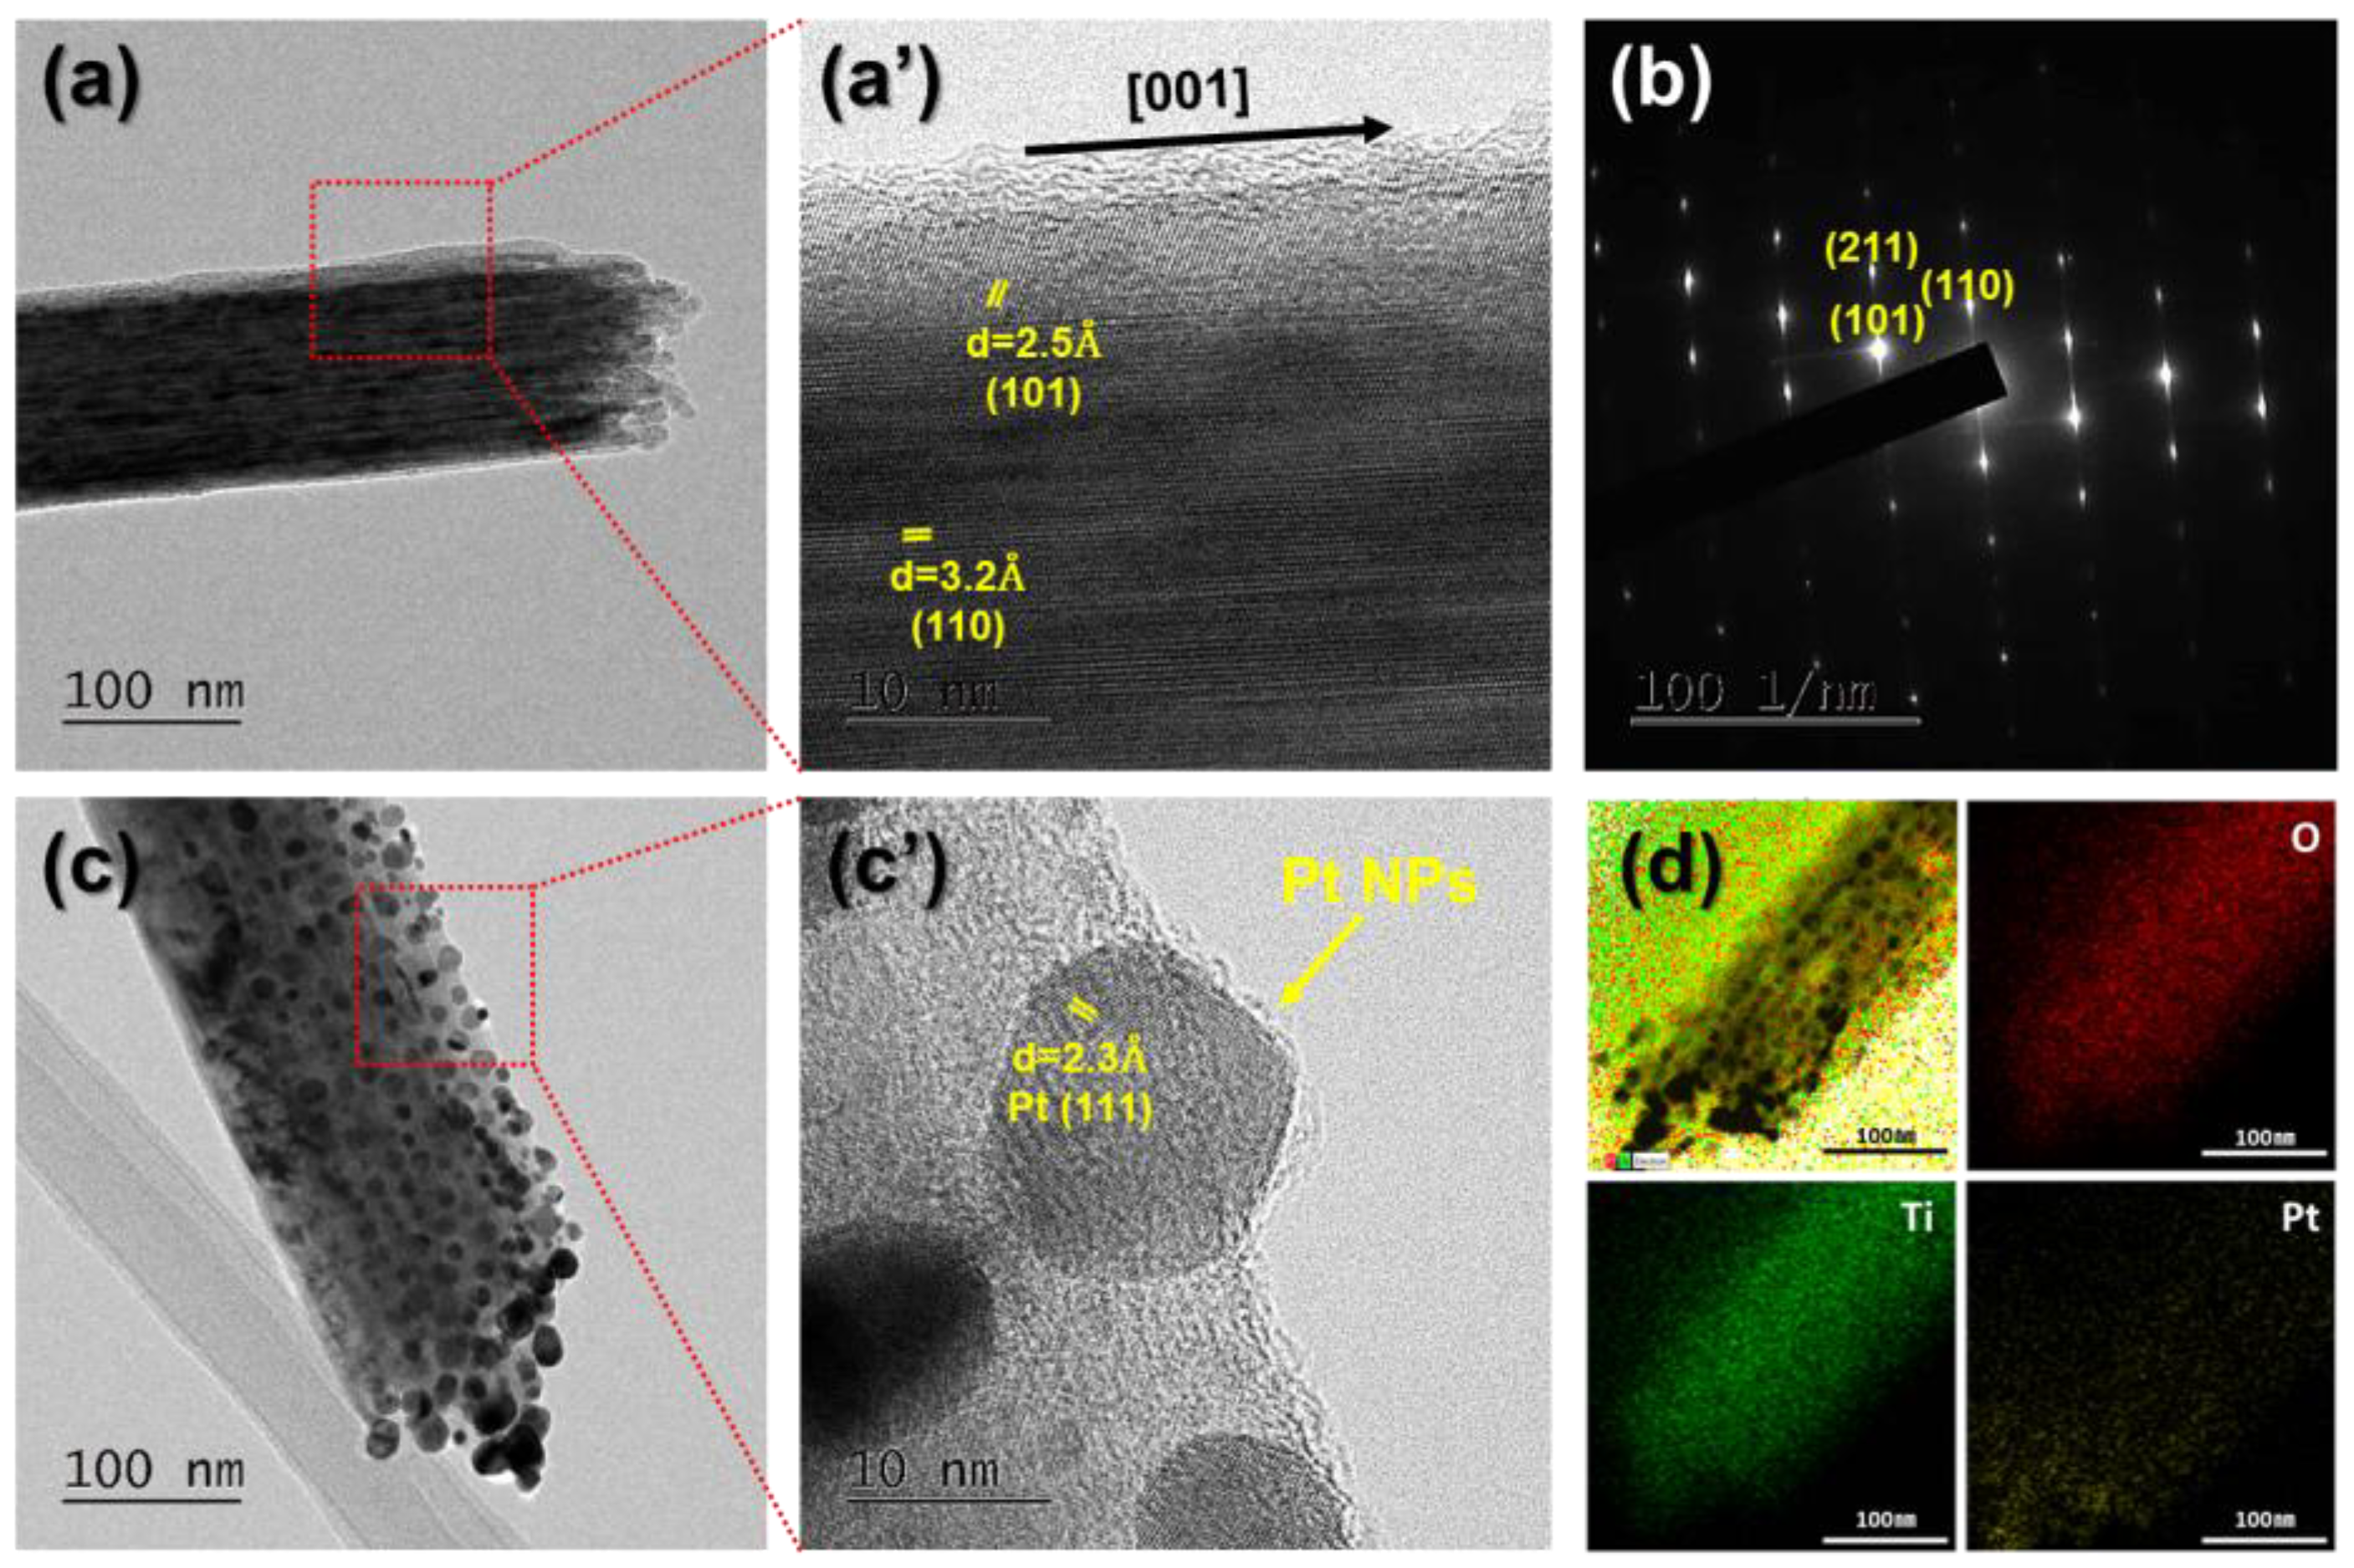
2.3. Structural and Morphological Characterization

The structure and morphology of the fabricated gas sensors were characterized using a high-resolution field-emission scanning electron microscope (HR FE-SEM; Nova NanoSEM 450, FEI Company, Hillsboro, Oregon, USA) at 10 kV and a field-emission transmission electron microscope (FE-TEM; JEM-2100F, JEOL Ltd., Tokyo, Japan) at 300 kV. In addition, energy-dispersive X-ray spectroscopy (EDS; Oxford INCA Energy, Oxford Instruments, Oxford, United Kingdom) and selected-area electron diffraction (SAED) pattern analyses were conducted. To analyze the crystalline phase, high-resolution X-ray diffraction (HR-XRD; SmartLab, Rigaku Corporation, Tokyo, Japan) was performed with Cu Kα radiation (λ = 1.54060 Ǻ) at 9 kW from 20° to 80° at a scanning speed of 5° min−1.

2.4. H2 Gas-Sensing Characterization

Electrodes were deposited onto the TiO2 NR-based gas sensor to measure the electrical signal. Then, 100 nm of titanium (Ti) and 50 nm of gold (Au) were deposited sequentially using an e-beam evaporator. The schematic of the gas-sensing measurement system is shown in Figure S1. The H2 gas-sensing properties of the TiO2 NRs and TiO2 NRs/Pt NP were measured using a homemade chamber. The air and hydrogen gas were injected into the chamber by a mass-flow controller and maintained at a constant flow rate of 1000 standard cubic centimeters per minute (sccm) during the measurement. The concentration of hydrogen gas was controlled at between 5000 to 10,000 parts per million (ppm) by mixing with ultra-high-purity air. The fabricated gas sensor was placed in the chamber and contacted by probes to measure the electrical resistance. The resistance change in the gas sensors, which varied according to the hydrogen gas concentration, was measured by a multimeter (Keithley 2700, Keithley Instruments, Cleveland, OH, USA) and transmitted to the PC. A UV-LED with a wavelength of 368 nm was attached to the top of the chamber and supplied with power through an external power supply (MK3005D, MESTECH, Shenzhen, China). The gas-sensing measurements were conducted in the dark and under UV irradiation at RT. The response of the gas sensor, to the injection and concentration of gas was calculated using the following equation:
Response = ∆R/Rg = (Ra − Rg)/Rg
where Rg is the resistance of the sensor measured in hydrogen gas, and Ra is the resistance of the sensor measured in ambient air.

3. Results and Discussion

Figure 2 presents FE-SEM images of the fabricated TiO2 NRs and TiO2 NRs/Pt NP. The cross-sectional images in Figure 2a,b reveal that both cubic-shaped TiO2 NRs and TiO2 NRs/Pt NP are vertically aligned on the substrate. In the top-view images (Figure 2(a1,b1)), the diameters of the TiO2 NRs are measured to be in the range of 40–220 nm. Notably, Pt NPs are observed on the top surfaces of the TiO2 NRs/Pt NPs in Figure 2(b1). To examine the Pt NPs in greater detail, tilted-view images of the TiO2 NRs and TiO2 NRs/Pt NPs are provided in Figure 2(a2,b2), respectively. As shown in Figure 2(b2), Pt NPs are distributed on both the top and sidewalls of the TiO2 NRs. The largest Pt NPs are concentrated at the top of the nanorods, while their frequency and size gradually decrease downward to the TiO2 NR. This distribution is attributed to the physical vapor deposition (PVD) process, where Pt is deposited most thickly on the top surfaces due to the shadowing effect. Consequently, Pt deposition is thinner on the sidewalls and becomes increasingly sparse toward the bottom of the nanorods, resulting in larger Pt NPs at the top.
The TiO2 NRs were further analyzed using FE-TEM, as shown in Figure 3. Figure 3(a,a’) show an FE-TEM image of the TiO2 NRs and the high-magnification image of the TiO2 NR’s surface, respectively. In Figure 3a’, the lattice fringes indicate that TiO2 NRs have a crystallized structure. The average lattice spacing in the TiO2 NRs is 0.25 and 0.32 nm, corresponding to the (101) and (110) planes of the rutile TiO2. Among the major facets of rutile TiO2, the (110) plane has been reported to have the lowest surface energy (1.78 J/m2), followed by the (101) plane (1.85 J/m2). Since the (110) plane is the most stable due to its low surface energy, the initial growth primarily occurs laterally along the (110) plane [21]. However, as the TiO2 NRs come into contact with each other, spatial limitations prevent further growth along the (110) plane. Consequently, the growth shifts predominantly to the (101) plane, which has the next-lowest surface energy.
In Figure 3a’, it can be observed that the inside of the TiO2 NR primarily consists of the (110) plane, while the surface mainly exhibits growth along the (101) plane. Figure 3b shows the SAED patterns of the TiO2 NR, revealing distinct diffraction spots that indicate the single-crystal nature of the TiO2 NR. Figure 3c presents the TEM image of a TiO2 NR/Pt NP, demonstrating the successful formation of Pt NPs on the TiO2 NR surface. Additionally, consistent with the FE-SEM images, the Pt NPs on the top region of the TiO2 NR appear to have the largest size. In Figure 3c’, the lattice spacing of the Pt NPs is measured to be 0.23 nm, corresponding to the cubic Pt (111) plane. Figure 3d provides an EDS mapping image of a TiO2 NR/Pt NP, confirming the presence of Ti and O elements in the TiO2 NR region, while the Pt element is distributed throughout the TiO2 NR due to the Pt NPs.
To further clarify the crystal structure of TiO2 NRs and TiO2 NRs/Pt NP, Figure 4 presents the XRD results. Both TiO2 NRs and TiO2 NRs/Pt NP exhibit a TiO2 rutile-phase crystal structure, with the corresponding peaks showing good agreement with the standard ICCD (ICCD card No: 96-900-4143). In particular, as observed in the FE-TEM analysis, the (101) plane is predominantly detected at 36°. However, the (110) plane seen in Figure 3a’ was not detected in the XRD results. This is because the (110) plane in nanorods has an orientation that makes it difficult for X-ray diffraction to occur, preventing its detection in XRD analysis [21]. Additionally, the SnO2 (111) plane, which corresponds to the substrate and seed layer, was observed at 41.3° (ICCD card No: 96-152-6638). Notably, in the TiO2 NRs/Pt NP, a Pt (111) peak was detected, indicating the formation of a cubic Pt structure on the surface (ICCD card No: 96-500-0222).
Figure 5 shows the hydrogen gas-sensing characteristics of the TiO2 NRs and TiO2 NRs/Pt NP as gas sensors under different UV light activation conditions and gas concentrations. First, before hydrogen gas injection, an initial stabilization was conducted by injecting air into the TiO2 NRs/Pt NP. The initial stabilization process was carried out for 30 min under a continuous flow of ultra-high-purity air. In cases where measurements were performed under UV illumination, the UV-LED was also turned on during the stabilization period under the same conditions. During this stabilization process, oxygen molecules in the air adsorb onto the surface of the TiO2 and capture free electrons, forming oxygen species such as O2, O, and O22−, as described by the following reactions:
O2(gas) ↔ O2(ads)
O2(ads) + e ↔ O2(ads)
O2(ads) + e ↔ 2O(ads)
O(ads) + e ↔ O2−(ads)
For the n-type semiconductor TiO2, electrons in the conduction band are trapped by oxygen, forming a depletion layer and increasing resistance. However, this reaction generally requires thermal activation at high temperatures, and at room temperature, only a small portion of the surface interacts with oxygen molecules. In particular, the O and O2− species, which are known to be highly reactive toward gas molecules, tend to dissociate at high temperatures, leading to minimal conductivity changes [22,23]. Therefore, in this study, UV irradiation was applied to replace thermal activation and to enable RT operation by increasing surface reactions through photoactivation. When exposed to UV light, the MOS generates electron–hole pairs due to photoactivation energy:
hν → h⁺(hν) + e(hν)
The photogenerated holes desorb the adsorbed oxygen species by recombining with their electrons, forming O2:
h⁺(hν) + O2(ads) → O2(hν)
Upon UV illumination, not only photogenerated holes but also electrons are produced. These additional electrons promote the adsorption of a greater number of oxygen species compared with the condition without UV light, thereby enhancing the efficiency of the gas-sensing process.
e(hν) + O2(gas) → O2(ads)
When exposed to hydrogen, it reacts with the photo-induced oxygen species, releasing electrons back into the conduction band of the sensing material [24]. This reduces the depletion layer, ultimately decreasing the resistance:
H2(gas) → H2(ads)
H2(ads) + O2(ads) → 2H2O(gas) + e
Figure 5a illustrates the resistance changes in the gas sensor in response to hydrogen gas with and without UV irradiation. Hydrogen gas was injected at concentrations of 0.5, 0.7 and 1% for 600 s each. The base resistance in the air stabilization was significantly higher in the TiO2 NR/Pt NP gas sensor than in the TiO2 NR gas sensor. This increase in resistance is attributed to the expansion of the depletion region at the TiO2 and Pt interface due to their junction formation. As shown in Figure 5a, the resistance change in response to hydrogen gas was substantially higher in the TiO2 NR/Pt NP sensor compared with that in the TiO2 NR sensor. Additionally, the hydrogen-sensing performance of the TiO2 NR/Pt NP gas sensor varied depending on the UV illumination. While hydrogen gas detection was observed even in dark conditions (without UV illumination), the sensor exhibited a significantly higher response under UV illumination. In Figure 5a’, the resistance change of the TiO2 NRs gas sensor is shown by replotting the Y-axis of Figure a with an expanded scale. The TiO2 NR gas sensor also shows a greater resistance change under UV illumination compared with in the dark. Moreover, all the gas sensors exhibited an increase in the resistance change as the hydrogen gas concentration increased, regardless of UV illumination.
To further clarify the hydrogen gas-sensing performance, Figure 5b,c show the sensor response calculated from the resistance values and the response values based on the hydrogen gas concentration, respectively. These response values are also summarized in Table 1. The TiO2 NR gas sensor without UV illumination demonstrated a gradual increase in the response with increasing hydrogen concentration. However, the overall response remained below 1.0, indicating very low sensitivity. The highest response was observed in the TiO2 NR/Pt NP gas sensor under UV illumination, which achieved a response of 2.40 at a 1% hydrogen concentration. Additionally, it is observed that the response of the TiO2 NR gas sensor under UV illumination is lower than that of the TiO2 NR/Pt NP gas sensor in the dark, confirming that the application of Pt NPs alone also enhances the room-temperature hydrogen-sensing performance. However, the sensitivity of all types of gas sensors tends to increase exponentially as the hydrogen concentration increases. This means that as the hydrogen gas concentration increases, the sensor becomes more sensitive. Table S1 summarizes the enhancement in sensitivity relative to the TiO2 NR sensor under dark conditions, demonstrating the effects of UV illumination, Pt NP decoration, and their combined application. The degree of improvement remained relatively consistent across different hydrogen concentrations. In all cases—UV application alone, Pt NP application alone, and the combined application of UV and Pt NPs—the enhancement in sensitivity compared with the TiO2 NR gas sensor was significantly greater as the hydrogen concentration increased. As the hydrogen concentration increases, more hydrogen molecules adsorb onto the sensor surface, which enhances the reaction with oxygen ions, resulting in the release of more electrons. The increase in electron concentration leads to a greater decrease in the resistance of TiO2, and the sensitivity improves exponentially [25]. Specifically, the TiO2 gas sensor that applied both UV and Pt NPs exhibited the greatest improvement in sensitivity. These findings indicate that the synergistic interaction between Pt NPs and UV illumination significantly influences the RT hydrogen-sensing performance.
The potential long-term stability and cyclic reliability of the UV-enhanced TiO2 NR/Pt NP gas sensor were further investigated. Figure 6a shows the cyclic sensing responses obtained by repeatedly exposing the sensor to 1% hydrogen gas at RT over 10 consecutive cycles. During these repeated measurements, the sensor maintained a consistent response with minimal variation, suggesting good short-term cyclic stability.
Figure 6b presents the relative error calculated from the cyclic sensing tests conducted on Day 1 and again after a two-day interval (Day 3) under the same conditions. As shown in Figure S2, the average responses on Day 1 and Day 3 were 2.7 and 2.6, respectively. The TiO2 NR/Pt NP gas sensor exhibited consistent performance over this period, with all the relative errors remaining within 10%. These results suggest that the UV-enhanced TiO2 NR/Pt NP gas sensor may offer reasonable reliability for hydrogen detection at RT, although further extended testing would be necessary to fully validate its long-term stability.
Additionally, to compare our results with previous studies, related data have been summarized in Table 2. Although the sensitivity may be somewhat lower than that reported in some earlier works, comparable performance was successfully achieved. In particular, this study demonstrates the ability to reliably detect approximately 1% hydrogen concentration at room temperature, via UV illumination, which represents a significant originality from existing research.
Figure 7 illustrates the mechanism behind the enhanced sensitivity due to the addition of Pt NPs. In general, in MOSs, the electron–hole pairs generated by UV light have a very short recombination time, causing many photogenerated electrons to recombine before participating in gas reactions. This rapid recombination rate can limit the reaction with hydrogen gas, even though additional carriers are generated under UV irradiation.
Meanwhile, when Pt NPs are decorated onto TiO2 surfaces, a Schottky barrier is formed at the TiO2-Pt junction due to the work functions of Pt (5.6 eV) and TiO2 (4.2 eV), as shown in Figure 7a’. Then, when the TiO2 and Pt are exposed to UV, the photogenerated electrons in TiO2 can migrate to the Pt NPs; however, due to the Schottky barrier, it is difficult for them to move back to the TiO2 side. As a result, electrons and holes become separated, which increases the electron–hole carrier recombination time and enhances the reaction with hydrogen. Therefore, although the TiO2 NR gas sensor exhibits an increased response under UV illumination compared with the dark condition due to the generation of additional carriers, its sensitivity is still lower, and its response rate is slower than that of the TiO2 NR/Pt NP gas sensor. As previously shown in Figure 5, the incorporation of Pt NPs leads to significantly enhanced sensitivity and a faster response under UV illumination.
Additionally, as shown in Figure 7b, the sensitivity enhancement due to Pt NP application can be explained by the spillover effect [32,33]. The spillover effect is a well-known catalytic phenomenon that is most active in noble metal catalysts such as Pt and Pd. Oxygen molecules near the metal catalyst adsorb onto the metal surface, dissociate into oxygen ions, and then migrate to the oxide surface (e.g., TiO2), expanding the surface depletion region. Furthermore, hydrogen adsorbs onto the catalyst surface and then diffuses onto the oxide surface, which reacts with adsorbed oxygen species, affecting the surface conductivity. This phenomenon explains the enhanced response observed in Figure 5, where the TiO2 NR gas sensor with Pt NPs alone exhibited improved sensitivity compared with the bare TiO2 NR sensor.
Furthermore, the application of Pt NPs plays a crucial role in this sensor due to their synergistic effect with UV illumination. Under UV light, Pt NPs exhibit localized surface plasmon resonance (LSPR), which induces collective oscillations of the charge density on their surface [34,35]. This oscillatory behavior significantly enhances the interaction with hydrogen molecules, leading to enhanced sensing performance, particularly under light exposure. This synergistic mechanism contributes to the enhanced sensitivity of the sensor.

4. Conclusions

In this study, we demonstrated the use of a RT hydrogen gas sensor based on TiO2 NRs decorated with Pt NPs and investigated the effects of Pt NP decoration and UV activation on the gas-sensing performance. The TiO2 NRs were synthesized via a hydrothermal method, and Pt NPs were introduced through DC sputtering followed by thermal annealing. Structural and morphological analyses confirmed the successful formation of TiO2 NRs with vertically aligned nanorod arrays and dispersed Pt NPs, which played a crucial role in enhancing the gas-sensing performance.
The fabricated TiO2 NR/Pt NP gas sensor exhibited a significantly improved response to hydrogen gas at RT compared with bare TiO2 NRs. Under UV irradiation (368 nm), the TiO2 NR/Pt NP gas sensor achieved a high response of 2.40 at a 1% hydrogen concentration, demonstrating approximately a 5.9-fold enhancement in sensitivity compared with TiO2 NRs in the dark. Notably, the gas sensor achieved stable and reliable detection of hydrogen concentrations of up to 1% at room temperature, highlighting its practical applicability for hydrogen monitoring without the need for external heating. In addition, cyclic sensing tests conducted over multiple cycles showed minimal variations in the response, further supporting the short-term stability and reliability of the sensor.
The improved performance was attributed to the synergistic effect of Pt catalytic activity and UV-induced photoactivation, which facilitated the adsorption and reaction of hydrogen molecules on the TiO2 surface. Furthermore, our results indicate that Pt NPs contributed to an increased depletion layer and improved charge transfer, while UV activation enabled efficient electron–hole pair generation, thereby promoting the surface reactions involved in hydrogen sensing. The combination of these factors effectively addressed the challenge of achieving sufficient activation energy for hydrogen detection in ambient conditions.
In conclusion, we highlight the potential of TiO2 NR/Pt NP gas sensors for real-world applications in hydrogen safety monitoring and industrial gas detection. While this study demonstrates significant advancements in RT hydrogen sensing, further research is needed to enhance selectivity and long-term stability. Future work will focus on optimizing the sensor design and material properties to improve its practical applicability and reliability in diverse environments.

Supplementary Materials

The following supporting information can be downloaded at: https://www.mdpi.com/article/10.3390/chemosensors13050177/s1. Figure S1: Schematic diagram of the H2 gas-sensing measurement system. Table S1: The response values of gas sensors as a function of the hydrogen gas concentration. Figure S2: Cyclic hydrogen-sensing responses measured at a 1% H2 concentration over 10 cycles on Day 1 and Day 3 to evaluate the stability of the TiO2 NR/Pt NP gas sensor at RT.

Author Contributions

Conceptualization, J.-E.Y. and K.-K.K.; methodology, J.-E.Y., J.Y. and S.K.; formal analysis, J.-E.Y. and S.K.; investigation, J.L. and I.-K.P.; data curation, J.-E.Y. and J.Y.; validation, I.-K.P.; writing—original draft preparation, J.-E.Y. and S.K.; writing—review and editing, S.K. and K.-K.K.; supervision, K.-K.K. All authors have read and agreed to the published version of the manuscript.

Funding

This research was funded by a Korea Institute of Energy Technology Evaluation and Planning (KETEP) grant funded by the Korean government (MOTIE) (20224000000570; Semiconductor-based mobility solid oxide fuel cell technology), a Korea Environmental Industry & Technology Institute (KEITI) grant funded by the Korean government (Ministry of Environment) (Training DX-based carbon supply network environmental experts), and a Korea CCUS Association (K-CCUS) grant funded by the Korean government (MOE, MOTIE) (KCCUS20230001; Human resources program for the reduction of greenhouse gases).

Institutional Review Board Statement

Not applicable.

Informed Consent Statement

Not applicable.

Data Availability Statement

The original contributions presented in this study are included in the article/Supplementary Materials. Further inquiries can be directed to the corresponding author.

Conflicts of Interest

Authors declare no conflicts of interest.

Abbreviations

The following abbreviations are used in this manuscript:
EDSEnergy-dispersive X-ray spectroscopy
FE-SEMField-emission secondary electron microscope
FE-TEMField-emission transmission electron microscope
HRHigh resolution
LEDLight-emitting diode
NPNanoparticle
NRNanorod
RTRoom temperature
SAEDSelected-area electron diffraction
TFThin film
UVUltraviolet
XRDX-ray diffraction

References

  1. Singla, M.K.; Nijhawan, P.; Oberoi, A.S. Hydrogen fuel and fuel cell technology for cleaner future: A review. Environ. Sci. Pollut. Res. 2021, 28, 15607–15626. [Google Scholar] [CrossRef] [PubMed]
  2. Dawood, F.; Anda, M.; Shafiullah, G.M. Hydrogen production for energy: An overview. Int. J. Hydrogen Energy 2020, 45, 3847–3869. [Google Scholar] [CrossRef]
  3. Yuea, M.; Lamberta, H.; Pahonb, E.; Rocheb, R.; Jemeia, S.; Hissela, D. Hydrogen energy systems: Acritical review of technologies, applications, trends and challenges. Renew. Sustain. Energy Rev. 2021, 146, 111180. [Google Scholar] [CrossRef]
  4. Hübert, T.; Boon-Brett, L.; Black, G.; Banach, U. Hydrogen sensors—A review. Sens. Actuators B Chem. 2011, 157, 329–352. [Google Scholar] [CrossRef]
  5. Dhimish, M.; Vieira, R.G.; Badran, G. Investigating the stability and degradation of hydrogen PEM fuel cell. Int. J. Hydrogen Energy 2021, 46, 37017–37028. [Google Scholar] [CrossRef]
  6. Hua, Z.; Zheng, Z.; Pahon, E.; Péra, M.-C.; Gao, F. A review on lifetime prediction of proton exchange membrane fuel cells system. J. Power Sources 2022, 529, 231256. [Google Scholar] [CrossRef]
  7. Şakar, B.C. Influence of the Cu doping on the physical and H2 gas sensing properties of TiO2. Int. J. Hydrogen Energy 2024, 50, 1197–1208. [Google Scholar] [CrossRef]
  8. Galstyan, V.; Comini, E.; Faglia, G.; Sberveglieri, G. TiO2 Nanotubes: Recent Advances in Synthesis and Gas Sensing Properties. Sensors 2013, 13, 14813–14838. [Google Scholar] [CrossRef]
  9. Li, Z.; Yao, Z.; Haidry, A.A.; Plecenik, T.; Xie, L.; Sun, L.; Fatima, Q. Resistive-type hydrogen gas sensor based on TiO2: A review. Int. J. Hydrogen Energy 2018, 43, 21114–21132. [Google Scholar] [CrossRef]
  10. Vijaykumar, A.; Mondal, A.; Deb, S.; Ajitha, B.; Reddy, Y.A.K. Development of room-temperature operable TiO2−x-based hydrogen gas sensor with light irradiation. Appl. Surf. Sci. 2024, 670, 160664. [Google Scholar] [CrossRef]
  11. Kanth, S.; Domadiya, D.N.; Betty, C.A.; Kumar, S.; Choudhury, S. Highly selective hydrogen sensing by applying characteristic frequency at room temperature: Case study on TiO2–PdO hydrogen sensor. Int. J. Hydrogen Energy 2025, 106, 231–242. [Google Scholar] [CrossRef]
  12. Kumar, A.; Deep, A.; Kumar, P.; Singh, N.B. A room-temperature hydrogen sensor based on Pd nanoparticles decorated TiO2 nanotubes. Ceram. Int. 2014, 40, 12555–12560. [Google Scholar]
  13. Weyrauch, I.; Hefler, E.L.; Breuch, R.; Kaul, P.; Mathur, S.; Konstantynovski, K. Recent Developments in the Design of Photoactivated Metal Oxide Gas Sensors and Application of Plasmonic Nanoparticles in Hydrogen-Sensing Devices. Phys. Status Solidi A 2025, 240, 2400633. [Google Scholar] [CrossRef]
  14. Guo, Y.-Y.; Zheng, X.-H.; Bo, L.-B.; Gu, Z.-Q.; Zhang, C.; Liu, Y.-F. UV-activated Gas Sensor Based on Ordered Mesoporous ZnO–TiO2 Heterogeneous Composites for Trace NO2 Detection at Room Temperature. Talanta 2025, 285, 127415. [Google Scholar] [CrossRef] [PubMed]
  15. Thathsara, T.; Harrison, C.J.; Schönauer-Kamin, D.; Mansfeld, U.; Moos, R.; Malherbe, F.M.; Hocking, R.K.; Shafiei, M. Pd Nanoparticles Decorated Hollow TiO2 Nanospheres for Highly Sensitive and Selective UV-Assisted Hydrogen Gas Sensors. ACS Appl. Energy Mater. 2024, 7, 14. [Google Scholar] [CrossRef]
  16. Cui, S.; Sun, Y.; Chen, C.; Hong, H.; Huang, J. Preparation of Pd Nanoparticles Modified Hollow TiO2 Dodecahedrons for Highly Selective Hydrogen Detection. Sens. Actuators A Phys. 2025, 382, 116104. [Google Scholar] [CrossRef]
  17. Deb, S.; Mondal, A.; Kumar Reddy, Y.A. Review on Development of Metal-Oxide and 2-D Material-Based Gas Sensors under Light-Activation. Curr. Opin. Solid State Mater. Sci. 2024, 30, 101160. [Google Scholar] [CrossRef]
  18. Thathsara, T.; Harrison, C.J.; Hocking, R.K.; Shafiei, M. Pd- and PdO-Decorated TiO2 Nanospheres: Hydrogen Sensing Properties under Visible Light Conditions at Room Temperature. Chemosensors 2023, 11, 409. [Google Scholar] [CrossRef]
  19. Wang, J.; Shen, H.; Xia, Y.; Komarneni, S. Light-Activated Room-Temperature Gas Sensors Based on Metal Oxide Nanostructures: A Review on Recent Advances. Ceram. Int. 2021, 47, 7353–7368. [Google Scholar] [CrossRef]
  20. Lee, S.; Lee, G.H.; Choi, M.; Park, G.; Kim, D.; Lee, S.; Lee, J.-O.; Cho, D. Photoactivated Metal Oxide-Based Chemiresistors: Revolutionizing Gas Sensing with Ultraviolet Illumination. J. Sens. Sci. Technol. 2024, 33, 274–287. [Google Scholar] [CrossRef]
  21. Prathan, A.; Sanglao, J.; Wang, T.; Bhoomanee, C.; Ruankham, P.; Gardchareon, A.; Wongratanaphisan, D. Controlled structure and growth mechanism behind hydrothermal growth of TiO2 nanorods. Sci. Rep. 2020, 10, 8065. [Google Scholar] [CrossRef]
  22. Wang, C.; Yin, L.; Zhang, L.; Xiang, D.; Gao, R. Metal Oxide Gas Sensors: Sensitivity and Influencing Factors. Sensors 2010, 10, 2088–2106. [Google Scholar] [CrossRef]
  23. Qomaruddin, M.; Casals, O.; Wasisto, H.S.; Waag, A.; Prades, J.D.; Fàbrega, C. Visible-Light-Driven Room Temperature NO2 Gas Sensor Based on Localized Surface Plasmon Resonance: The Case of Gold Nanoparticle Decorated Zinc Oxide Nanorods (ZnO NRs). Chemosensors 2022, 10, 28. [Google Scholar] [CrossRef]
  24. Fan, S.-W.; Srivastava, A.K.; Dravid, V.P. UV-activated room-temperature gas sensing mechanism of polycrystalline ZnO. Appl. Phys. Lett. 2009, 95, 142106. [Google Scholar] [CrossRef]
  25. Lu, S.; Zhang, Y.; Liu, J.; Li, H.-Y.; Hu, Z.; Luo, X.; Gao, N.; Zhang, B.; Jiang, J.; Zhong, A.; et al. Sensitive H2 Gas Sensors Based on SnO2 Nanowires. Sens. Actuators B Chem. 2021, 345, 130334. [Google Scholar] [CrossRef]
  26. Fomekong, R.L.; Kelm, K.; Saruhan, B. High-Temperature Hydrogen Sensing Performance of Ni-Doped TiO2 Prepared by Co-Precipitation Method. Sensors 2020, 20, 5992. [Google Scholar] [CrossRef]
  27. Steinebach, H.; Kannan, S.; Rieth, L.; Solzbacher, F. H2 Gas Sensor Performance of NiO at High Temperatures in Gas Mixtures. Sens. Actuators B Chem. 2010, 151, 162–168. [Google Scholar] [CrossRef]
  28. Fang, T.; Mo, T.; Xu, X.; Tao, H.; Wang, H.; Yu, B.; Zhao, Z.-J. Pd-Decorated SnO2 Nanofilm Integrated on Silicon Nanowires for Enhanced Hydrogen Sensing. Sensors 2025, 25, 655. [Google Scholar] [CrossRef]
  29. Hussain, M.; Jeong, W.; Kang, I.-S.; Choi, K.-K.; Jaffery, S.H.A.; Ali, A.; Hussain, T.; Ayaz, M.; Hussain, S.; Jung, J. Highly Fast Response of Pd/Ta2O5/SiC and Pd/Ta2O5/Si Schottky Diode-Based Hydrogen Sensors. Sensors 2021, 21, 1042. [Google Scholar] [CrossRef]
  30. Stolarczyk, A.; Jarosz, T.; Procek, M. Room Temperature Hydrogen Gas Sensing via Reversible Hydrogenation of Electrochemically Deposited Polycarbazole on Interdigitated Pt Transducers. Sensors 2019, 19, 1098. [Google Scholar] [CrossRef]
  31. Girma, H.G.; Park, K.H.; Ji, D.; Kim, Y.; Lee, H.M.; Jeon, S.; Jung, S.-H.; Kim, J.Y.; Noh, Y.-Y.; Lim, B. Room-Temperature Hydrogen Sensor with High Sensitivity and Selectivity Using Chemically Immobilized Monolayer Single-Walled Carbon Nanotubes. Adv. Funct. Mater. 2023, 33, 2213381. [Google Scholar] [CrossRef]
  32. Barala, S.; Kumar, A.; Kwoka, M.; Gupta, A.; Kumar, M. Spillover Effect in Pd Anchored NiO-ZnO Nanostructures Improves Hydrogen Gas Sensor’s Performance. Sens. Actuators B Chem. 2025, 433, 137534. [Google Scholar] [CrossRef]
  33. Roland, U.; Hebestreit, A.; Taoussanis, A.; Eiserbeck, M.; Holzer, F.; Wotzka, A.; Wohlrab, S. Cost-effective Selective Hydrogen Sensor Based on the Combination of Catalytic Spillover Effect and Impedance Measurement. Int. J. Hydrogen Energy 2023, 48, 37550–37562. [Google Scholar] [CrossRef]
  34. Yao, Y.; Ji, F.; Yin, M.; Ren, X.; Ma, Q.; Yan, J.; Liu, S.F. Ag Nanoparticle-Sensitized WO3 Hollow Nanosphere for Localized Surface Plasmon Enhanced Gas Sensors. ACS Appl. Mater. Interfaces 2016, 8, 18165–18172. [Google Scholar] [CrossRef]
  35. Vaidyanathan, A.; Mondal, B.; Rout, C.S.; Chakraborty, B. Plasmonic Gas Sensors Based on Nanomaterials: Mechanisms and Recent Developments. J. Phys. D Appl. Phys. 2024, 57, 263002. [Google Scholar] [CrossRef]
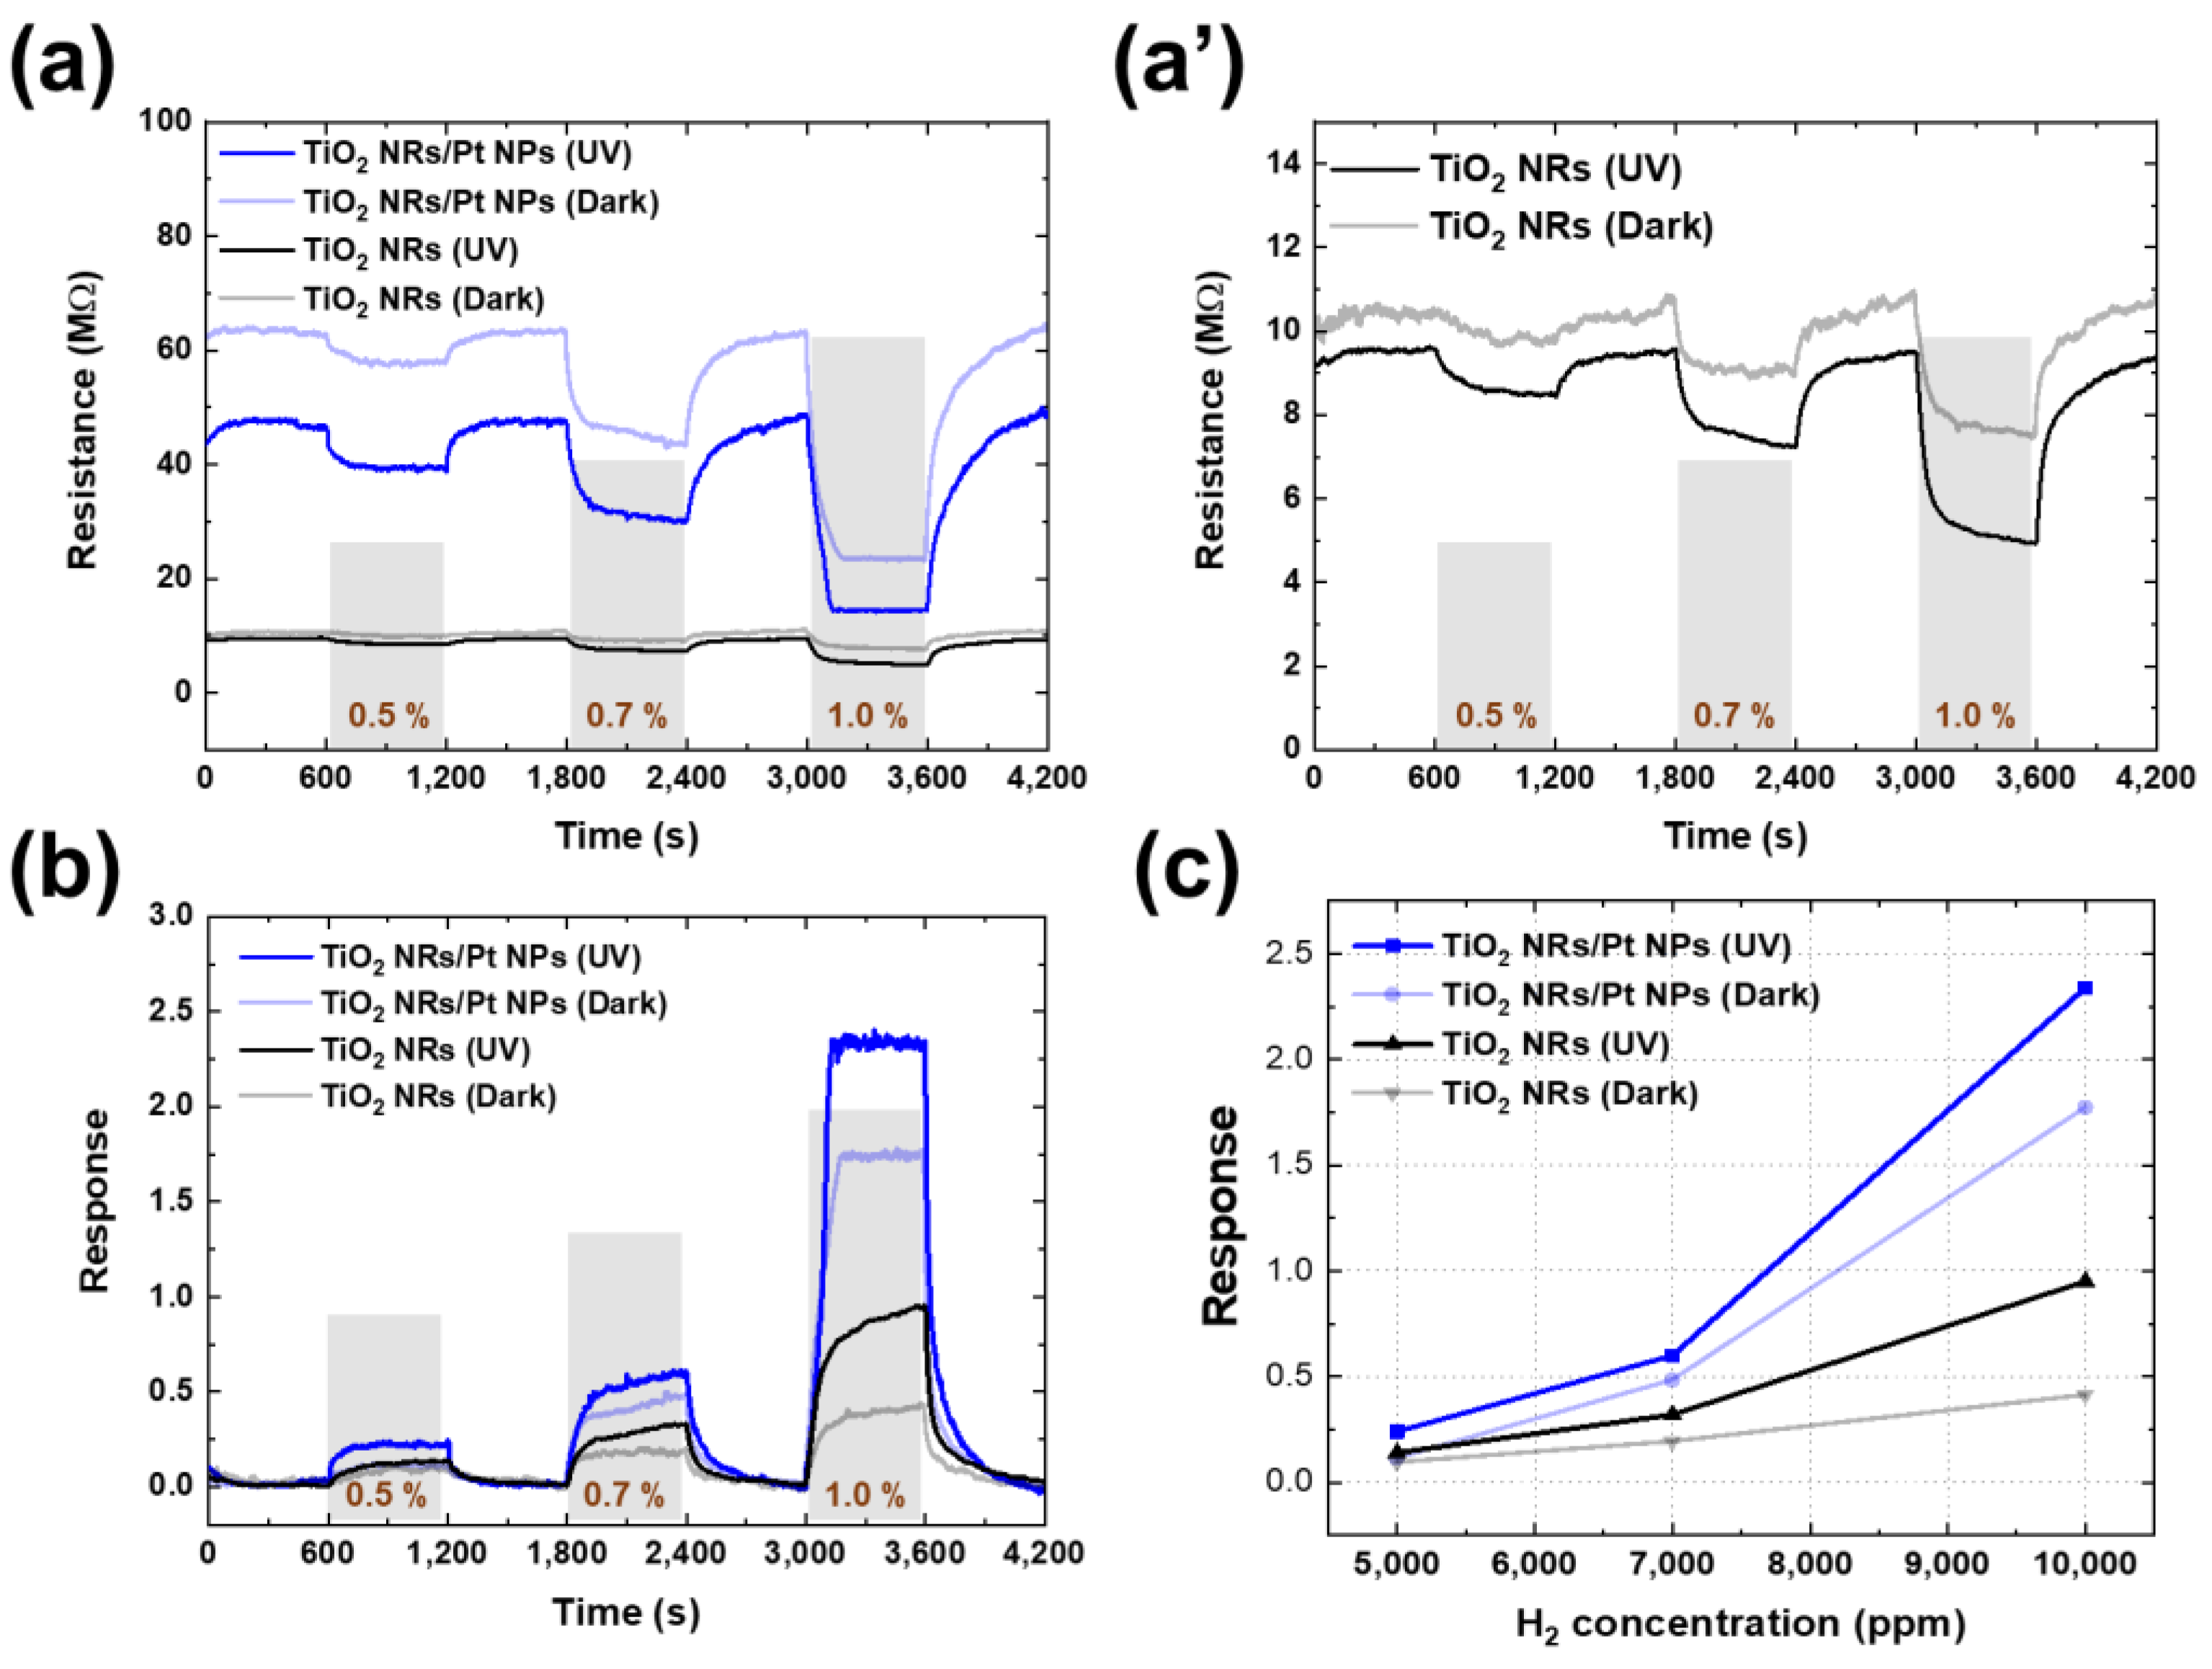
Figure 1. A schematic image of the process of fabricating a TiO2 NR/Pt NP gas sensor. TiO2 NRs were synthesized by a hydrothermal method. Following growth of the TiO2 NRs, Pt NPs were formed using sputtering deposition and a thermal annealing process. The gas sensors were fabricated using two types of structures: one consisting solely of TiO2 NRs and the other composed of TiO2 NRs decorated with Pt NPs (TiO2 NRs/Pt NP).
Chemosensors 13 00177 g001
Figure 2. The FE-SEM images of vertically aligned TiO2 NRs and TiO2 NRs/Pt NP. The cross-section images of (a) TiO2 NRs and (b) TiO2 NRs/Pt NP. The top view images of (a1) TiO2 NRs and (b1) TiO2 NRs/Pt NP. The tilted images of (a2) TiO2 NRs and (b2) TiO2 NRs/Pt NP. The tops and sidewalls of the TiO2 NRs were well covered by the Pt NPs.
Chemosensors 13 00177 g002
Figure 3. (a) FE-TEM image of a TiO2 NR and (a’) the high magnification image of the TiO2 NR. The TiO2 NRs grew in the [001] direction. (b) The SAED pattern of TiO2 NRs. The measured diffraction pattern confirms that the crystal structure is TiO2. (c) FE-TEM image of a TiO2 NR/Pt NP and (c’) the high magnification images of the TiO2 NR/Pt NP. Pt NPs were well formed on the TiO2 surface. (d) The EDS mapping image of the TiO2 NRs/Pt NP.
Chemosensors 13 00177 g003
Figure 4. The XRD results of TiO2 NRs and TiO2 NRs/Pt NP. In both types of gas sensors, the peaks confirmed the rutile-phase TiO2 crystal structure. For the TiO2 NR/Pt NP gas sensor, the peaks confirmed the cubic crystal structure of Pt, which is the same as that shown in the FE-TEM results.
Chemosensors 13 00177 g004
Figure 5. (a) Resistance data for the TiO2 NR and TiO2 NR/Pt NP gas sensors in response to hydrogen gas detection. Measurements were conducted under dark conditions (without UV) or under UV illumination. Hydrogen concentrations were set at 0.5, 0.7, and 1%, with gas exposure for 600 s followed by air injection for 600 s. (a’) Hydrogen-sensing results of the TiO2 NR gas sensor, showing significantly lower resistance changes compared with the TiO2 NR/Pt NP gas sensor. (b) Sensitivity results obtained by converting the resistance changes during hydrogen gas detection. (c) Response graph as a function of hydrogen gas concentration, sensing material type, and UV illumination.
Chemosensors 13 00177 g005
Figure 6. (a) Cyclic sensing response of the TiO2 NR/Pt NP gas sensor to 1% hydrogen at room temperature over 10 repeated cycles to evaluate its stability. (b) Relative error in the sensor response calculated from 10-cycle tests conducted on Day 1 and Day 3.
Chemosensors 13 00177 g006
Figure 7. Schematics of the mechanism explaining the effects of UV illumination and Pt NPs on sensitivity enhancement. (a) Energy-band diagram before the contact between Pt and TiO2. (a’) Energy-band diagram after contact, where a Schottky barrier forms at the Pt/TiO2 interface, preventing electron recombination with holes on the TiO2 surface and facilitating charge separation. (b) Schematic of the hydrogen-sensing enhancement mechanism via the spillover effect of Pt NPs. Pt NPs dissociate oxygen and hydrogen molecules into ions, facilitating their interaction with TiO2 and improving the gas-sensing performance.
Chemosensors 13 00177 g007
Table 1. The response values of gas sensors as a function of the hydrogen gas concentration.
Gas ConcentrationTiO2 NRs/Pt NP (UV)TiO2 NRs/Pt NP (Dark)TiO2 NRs
(UV)
TiO2 NRs
(Dark)
0.5%0.240.110.140.09
0.7%0.600.480.320.19
1.0%2.401.770.950.41
Table 2. Comparison of hydrogen gas-sensor performances for ~1% H2 detection.
No.MaterialOperating Temp.H2
Concentration
Sensitivity
(Response Formula)
CatalystUVRef.
1Ni-doped TiO2600 °C0.1%72%
((Ra − Rg)/Rg)
NoneNo[26]
2NiO film600 °C0.5%55
((Ra − Rg)/Rg)
NoneNo[27]
3SnO2 film/Pd300 °C1.5%9
(Ra/Rg)
PdNo[28]
4Pd/Ta2O5 diodes300 °C0.5%1000
(Ra/Rg)
PdNo[29]
5PCz/IDE-PtRT1%281%
((Ra − Rg)/Rg)
PtNo[30]
6PMMA-Pd-SWNTRT1%285
(Ra/Rg)
PdNo[31]
7TiO2 NRs/Pt NPsRT1%2.4
((Ra − Rg)/Rg)
PtYesThis work
Disclaimer/Publisher’s Note: The statements, opinions and data contained in all publications are solely those of the individual author(s) and contributor(s) and not of MDPI and/or the editor(s). MDPI and/or the editor(s) disclaim responsibility for any injury to people or property resulting from any ideas, methods, instructions or products referred to in the content.

