Article

Development of Polyphenol–Metal Film-Modified Colored Porous Microspheres for Enhanced Monkeypox Antigen Detection

by
Wei-Zhi Zhang
,
Chen-Fei Zhang
and
Shou-Nian Ding
*
School of Chemistry and Chemical Engineering, Southeast University, Nanjing 211189, China
*
Author to whom correspondence should be addressed.
Chemosensors 2025, 13(4), 142; https://doi.org/10.3390/chemosensors13040142
Submission received: 13 March 2025 / Revised: 8 April 2025 / Accepted: 9 April 2025 / Published: 12 April 2025
(This article belongs to the Special Issue Application of Luminescent Materials for Sensing, 2nd Edition)

Abstract

:
The Monkeypox virus (MPXV), a DNA virus classified under the Orthpoxvirus genus alongside variola virus, has recently garnered significant global health attention due to its increasing transmission and emerging genomic mutations. Point-of-care testing is essential for effective clinical response and outbreak mitigation. In this article, we developed a novel class of colored microspheres designed for application in a lateral flow immunoassay (LFIA) platform targeting MPXV-specific biomarkers. Polystyrene-maleic anhydride (SMA-MAA) microspheres were synthesized with a high-temperature soap-free emulsion polymerization optimized in our lab. Subsequent alkali and acid treatments were employed to introduce porosity into the microsphere matrix. Solvent Red 27 and Disperse Red 60 were incorporated via solvent-swelling and thermal-swelling methods, respectively, to generate high brightness (HB) carriers. A surface coating composed of a tannic acid–iron (TA–Fe3⁺) coordination complex was applied to form a stable metal–polyphenol film (MPF). This coating not only minimized dye leaching by establishing a robust shell but also improved dye distribution, thereby enhancing overall color intensity. The final HB-LFIA system, configured in a sandwich immunoassay format, demonstrated favorable sensitivity and linear detection range for Monkeypox antigen, indicating strong potential for clinical diagnostic use.

Graphical Abstract

1. Introduction

Colored nanospheres have garnered considerable attention owing to their distinctive physicochemical characteristics and their broad applicability across diverse domains, including molecular recognition and sensing [1,2,3], adsorption technologies [4], high-performance composites for coatings and ink formulations [5], immunodiagnostics [6,7], and biological labeling [8,9,10]. Despite these advancements, the fabrication of uniformly dyed microspheres with vivid and stable coloration remains a significant challenge. To address this, several synthetic strategies have been proposed, generally categorized into three principal approaches: physical adsorption [11], chemical bonding [12,13,14], and copolymerization [15,16]. While each technique presents specific merits and limitations, the swelling method has emerged as a particularly promising route, primarily due to its procedural simplicity, tunable parameters, and economic feasibility. Notably, Wang et al. achieved the synthesis of molecularly imprinted polymer (MIP) microspheres featuring an eccentric hollow architecture through a one-step swelling polymerization conducted in a microemulsion environment, facilitating the selective recognition of bisphenol A (BPA), a well-known endocrine disruptor [17]. In a similar vein, Zhao et al. applied the swelling method to incorporate varying concentrations of quantum dots into polycaprolactone microspheres, yielding monodisperse particles with robust fluorescence signals—thereby demonstrating the potential of this method for advanced fluorescent encoding applications [18].
In the synthesis of colored microspheres via the swelling technique, the efficiency of dye incorporation and the resulting coloration quality are closely governed by the dispersion behavior and aggregation tendencies of dye molecules within the system. A major challenge arises from the nature of commonly used microsphere substrates, which are typically hydrophobic—such as polystyrene (PS) and polymethyl methacrylate (PMMA) microspheres. Although hydrophilic microspheres dispersed in aqueous media generally exhibit improved colloidal stability, the significant polarity mismatch between the hydrophilic matrix and hydrophobic dye molecules impairs their affinity, thereby limiting dye penetration into the microsphere interior [19]. Consequently, water-soluble dyes often demonstrate inferior coloration performance compared to disperse dyes. Nevertheless, disperse dyes present their own limitations in aqueous systems due to their amphiphilic structures; they are prone to aggregation, which hampers uniform dispersion throughout the medium. Furthermore, despite the procedural simplicity and cost-effectiveness of the swelling method, it is frequently associated with the drawback of dye leaching [20]. This is primarily because most dye incorporation relies on physical adsorption and passive diffusion, rendering the dyes susceptible to environmental factors such as temperature fluctuations and mechanical stress, which can lead to dye desorption. The issue is particularly severe for highly polar dyes, which are more vulnerable to leakage during application. Extended storage in aqueous environments exacerbates this problem, often resulting in significant dye release. Hence, devising robust strategies to minimize dye leaching is essential for enhancing the long-term stability and functionality of colored microspheres.
Tannic acid (TA), a naturally occurring high-molecular-weight polyphenolic compound, is abundantly present in plant-derived materials such as leaves, bark, and fruits, with especially high concentrations found in oak, chestnut, and grape species [21]. Owing to its distinctive chemical structure and versatile reactivity, TA has been widely utilized across various sectors, including the food industry, pharmaceuticals, textiles, dye production, and biological sensing technologies [22]. Among its notable chemical properties, TA demonstrates a remarkable capacity to interact with a wide range of substrates through diverse mechanisms, such as electrostatic attraction, hydrogen bonding, and hydrophilic-hydrophobic interactions [23]. Furthermore, TA readily chelates with metal ions to form metal–polyphenol film (MPF) via sequential self-assembly processes. These robust, functional coatings have attracted significant interest for their broad application potential in areas such as nanotechnology, drug delivery, and biosensing [24].
In recent years, the global health concern has escalated due to the potential for widespread outbreaks of Monkeypox virus (MPXV) and the rapid increase in its incidence rates [25]. For this reason, it is essential to establish trustworthy, fast, and available diagnostic technologies for effective management and control of disease transmission. Currently, the primary methodologies for Monkeypox antigen detection are categorized into three types: traditional gold-based lateral flow assay (LFIA) strips [26], chemiluminescence immunoassays (CLIA) [27], and polymerase chain reaction (PCR) [28]. While the lateral flow assay exhibits operational simplicity, it is characterized by relatively high sensitivity, significant background interference, and poor stability. Conversely, chemiluminescence and PCR, despite their lower analytical sensitivity, are hindered by complex procedural requirements, limiting their large-scale application in rapid clinical diagnostic settings. Therefore, the development of a novel diagnostic test strip with enhanced sensitivity and improved stability has become an urgent priority. Colored microsphere-based flow immunochromatographic assays not only exhibit the characteristics of low detection limits and high stability but also offer the advantage of no need for UV light illumination compared to fluorescent tracers. This eliminates the requirement for specialized equipment such as UV lamps, thereby further streamlining both the workflow and reducing costs in clinical diagnostic procedures.
In this study, we first introduced a porosity modification process for microspheres. By employing an alkaline-acid treatment approach, we successfully synthesized SMA-MAA microspheres with porous characteristics. The high specific surface area of the porous material provides additional binding sites for subsequent dye loading [29]. To further address the challenges associated with the preparation of colored microspheres, we incorporated TA into the swelling system to enhance dye dispersion. Simultaneously, an alkaline treatment was applied to the microspheres to break the hydrogen bonds between carboxyl groups on their surface, facilitating the deeper penetration of dye molecules into the microspheres. This approach improved the uniformity and stability of microsphere coloration during the swelling process. Moreover, TA readily adsorbed onto the polystyrene microsphere surface due to the hydrophobic action. By forming a TA-Fe(III) complex coating on the microsphere surface, we effectively prevented dye leakage during subsequent processing. Furthermore, the inherent properties of the MPF provided a significant advantage in antibody conjugation, simplifying the immunodetection process.

2. Materials and Methods

2.1. Chemicals and Materials

Methacrylic acid, potassium persulfate, sodium dodecyl sulfate, sodium hydroxide, sodium dihydrogen phosphate dihydrate, disodium hydrogen phosphate dodecahydrate, Tween 20, and dichloromethane were purchased from China National Pharmaceutical Group Chemical Reagents Co., Ltd. (Shanghai, China). Bovine albumin, 1-ethyl-3-(3-dimethylaminopropyl) carbodiimide hydrochloride, N-hydroxy succinimide sodium salt, and 2-morpholinoethanesulfonic acid (MES) were purchased from Shenggong Biotechnology Co., Ltd. (Shanghai, China). Styrene, sucrose, and maleic anhydride were obtained from Shanghai Aladdin Biochemical Technology Co., Ltd. (Shanghai, China). Solvent Red 27 and Disperse Red 60 was obtained from Hubei Chujian Biopharmaceutical Co., Ltd. (Wuhan, China).

2.2. Instrumentation and Apparatus

The particle size distribution and zeta potential of the nanospheres were measured using Malvern Zetasizer (Malvern Panalytical Ltd, Shanghai, China). Fluorescence spectra were recorded using FluoroMax-4 (HORIBA Scientific, Shanghai, China). The surface carboxyl group content of the microspheres was quantified using DLS-11A (Shanghai Lei Magnetics Co., Shanghai, China). The morphological changes of the microspheres were observed using Talos F200X (Thermo Fisher Scientific, Shanghai, China). The ultraviolet-visible spectrum test was performed using(Shimadzu Co. LTD., Shanghai, China).

2.3. Synthesis of SMA-MAA Copolymer Microspheres

Polystyrene–maleic anhydride (SMA-MAA) copolymer microspheres were synthesized via a high-temperature, soap-free emulsion polymerization process, as illustrated in Scheme 1. Prior to polymerization, styrene monomer was purified using a 10% sodium hydroxide solution to eliminate stabilizing agents present in the commercial reagent. The purified styrene was then combined with 30 mL of deionized water and transferred to a three-neck round-bottom flask. A predetermined quantity of maleic anhydride was subsequently added, and the mixture was subjected to mechanical stirring at 300 rpm. The temperature of the reaction system gradually increased until the solution reached its boiling point, which was maintained for 15 min to facilitate the removal of dissolved oxygen. Following deoxygenation, potassium persulfate was introduced as an initiator to trigger the polymerization reaction. The system was continuously stirred for an additional 3 h to ensure a complete reaction. After cooling to room temperature, the product was thoroughly washed to yield monodisperse SMA-MAA microspheres.

2.4. Preparation of Porous Microspheres

The latex microsphere stock solution (5 mL) was first diluted with deionized water to a final concentration of 0.5%. Subsequently, 5 mL of 2-butanone and 0.1 g of sodium dodecyl sulfate (SDS) were added to the system. The pH of the solution was then adjusted to approximately 12 using a 2.5 M NaOH solution. The reaction flask was immersed in an oil bath at 90 °C, and the mixture was stirred for 3 h at 450 rpm, yielding the alkali-treated microspheres. After the alkaline treatment, the latex solution was cooled to room temperature. The pH was then adjusted to approximately 2.2 using a 2.5 M HCl solution. The system was subjected to an acidic treatment at 90 °C for 3 h. After cooling to room temperature, the solution was neutralized to pH 7 using a 2.5 M NaOH solution.

2.5. Staining of Microspheres

Red-27@SMA-MAA microspheres pretreatment and staining: The SMA-MAA solution from the previous step was dispersed into a latex solution with a mass fraction of 1%. 2.5 M NaOH solution was added to adjust the pH of the solution to 13. The solution was then transferred to a flask and heated at 85 °C for 3 h to terminate the reaction. The resulting microspheres were purified by washing with deionized water, yielding SMA-MAA microspheres with a rough surface morphology. The microspheres were then re-dispersed in 10 mL deionized water, followed by the addition of 2 mL of 10 mg/mL Solvent Red-27 ethanol solution. The mixture was heated for 3 h. Upon completion of the reaction, the product was purified by centrifugal washing, resulting in monodisperse Red-27@SMA-MAA functionalized microspheres.
C.I. 60@SMA-MAA microspheres pretreatment and staining: To modify the staining agent, a similar staining process was performed as follows: 1. The microspheres underwent the same pretreatment steps as described in Section 3.2, resulting in SMA-MAA microspheres with a rough surface morphology. 2. The resulting microspheres were re-dispersed in 10 mL of water, and then 30 mg of C.I.-60 was added. An appropriate amount of tannic acid was introduced into the flask, and the mixture was heated for 3 h. Afterward, anhydrous ferric chloride was added to the solution, and the reaction continued for an additional 5 min. The product was purified by centrifugal washing, resulting in C.I.-60@SMA-MAA functionalized microspheres.

2.6. Encapsulation of Metal-Colored Microspheres

The synthesized microspheres were re-dispersed in deionized water to obtain a 4% colored microsphere solution. A 10 mL of this microsphere solution was taken, followed by the addition of 1.5 mL tannic acid solution (27 mg/mL). The mixture was subjected to ultrasonication to ensure thorough mixing and then transferred to a 50 mL three-neck flask. The temperature was raised to 45 °C and maintained for 30 min. Subsequently, 500 μL of FeCl3 aqueous solution (8 mg/mL) was added, and the reaction was allowed to proceed for another 10 min at the same temperature. Upon completion of the reaction, the obtained product was purified by centrifugation with deionized water, removing the supernatant. This purification process was repeated three times, yielding the successfully encapsulated MPF@Red-27@SMA-MAA and MPF@C.I.-60@SMA-MAA microspheres.

2.7. Conjugation of Colored Microspheres with Antibodies and LFIA Detection

The colored microspheres were dried and then re-dispersed in 1 mL of 10 mM PBS buffer (pH = 7.4), followed by ultrasonic dispersion to achieve uniform suspension. Next, 20 μL of Monkeypox-labeled antibody (MPVX-Ab2, 9.97 mg/mL) was added to the activated microsphere solution, and the mixture was incubated at room temperature with shaking for 2.5 h. Subsequently, the microsphere-antibody conjugates were treated with 500 μL of a mixed solution containing 5 mM boric acid, 11.2 mM sodium tetraborate decahydrate, 0.05% Tween-20, 1% BSA, and 0.24% ethanolamine for 30 min to remove excess antibodies and prevent nonspecific adsorption. Prior to testing, the sample pad was pretreated with 0.1% Tween-20, 1% BSA, and 0.1% boric acid solution, followed by drying for later use. A 2 mg/mL solution of MPVX capture antibody and goat anti-mouse IgG was dispensed onto the NC membrane to form the test (T) line and control (C) line, respectively. The membrane was then dried in an incubator at 37 °C. Subsequently, the prepared NC membrane, sample pad, and absorbent pad were assembled onto a PVC backing. The assembled components were cut into 10 mm-wide test strips using a strip cutter and stored in a refrigerator for future use. The target antigen was diluted in 0.01 M PBS to different concentrations. A mixture of 20 μL antigen solution and 60 μL antibody-microsphere conjugate solution was incubated for 10 min. The test strip was then inserted into a test tube, and after 15 min, an image was captured using an iPhone. The acquired image was analyzed quantitatively using ImageJ2.x software.

3. Results and Discussion

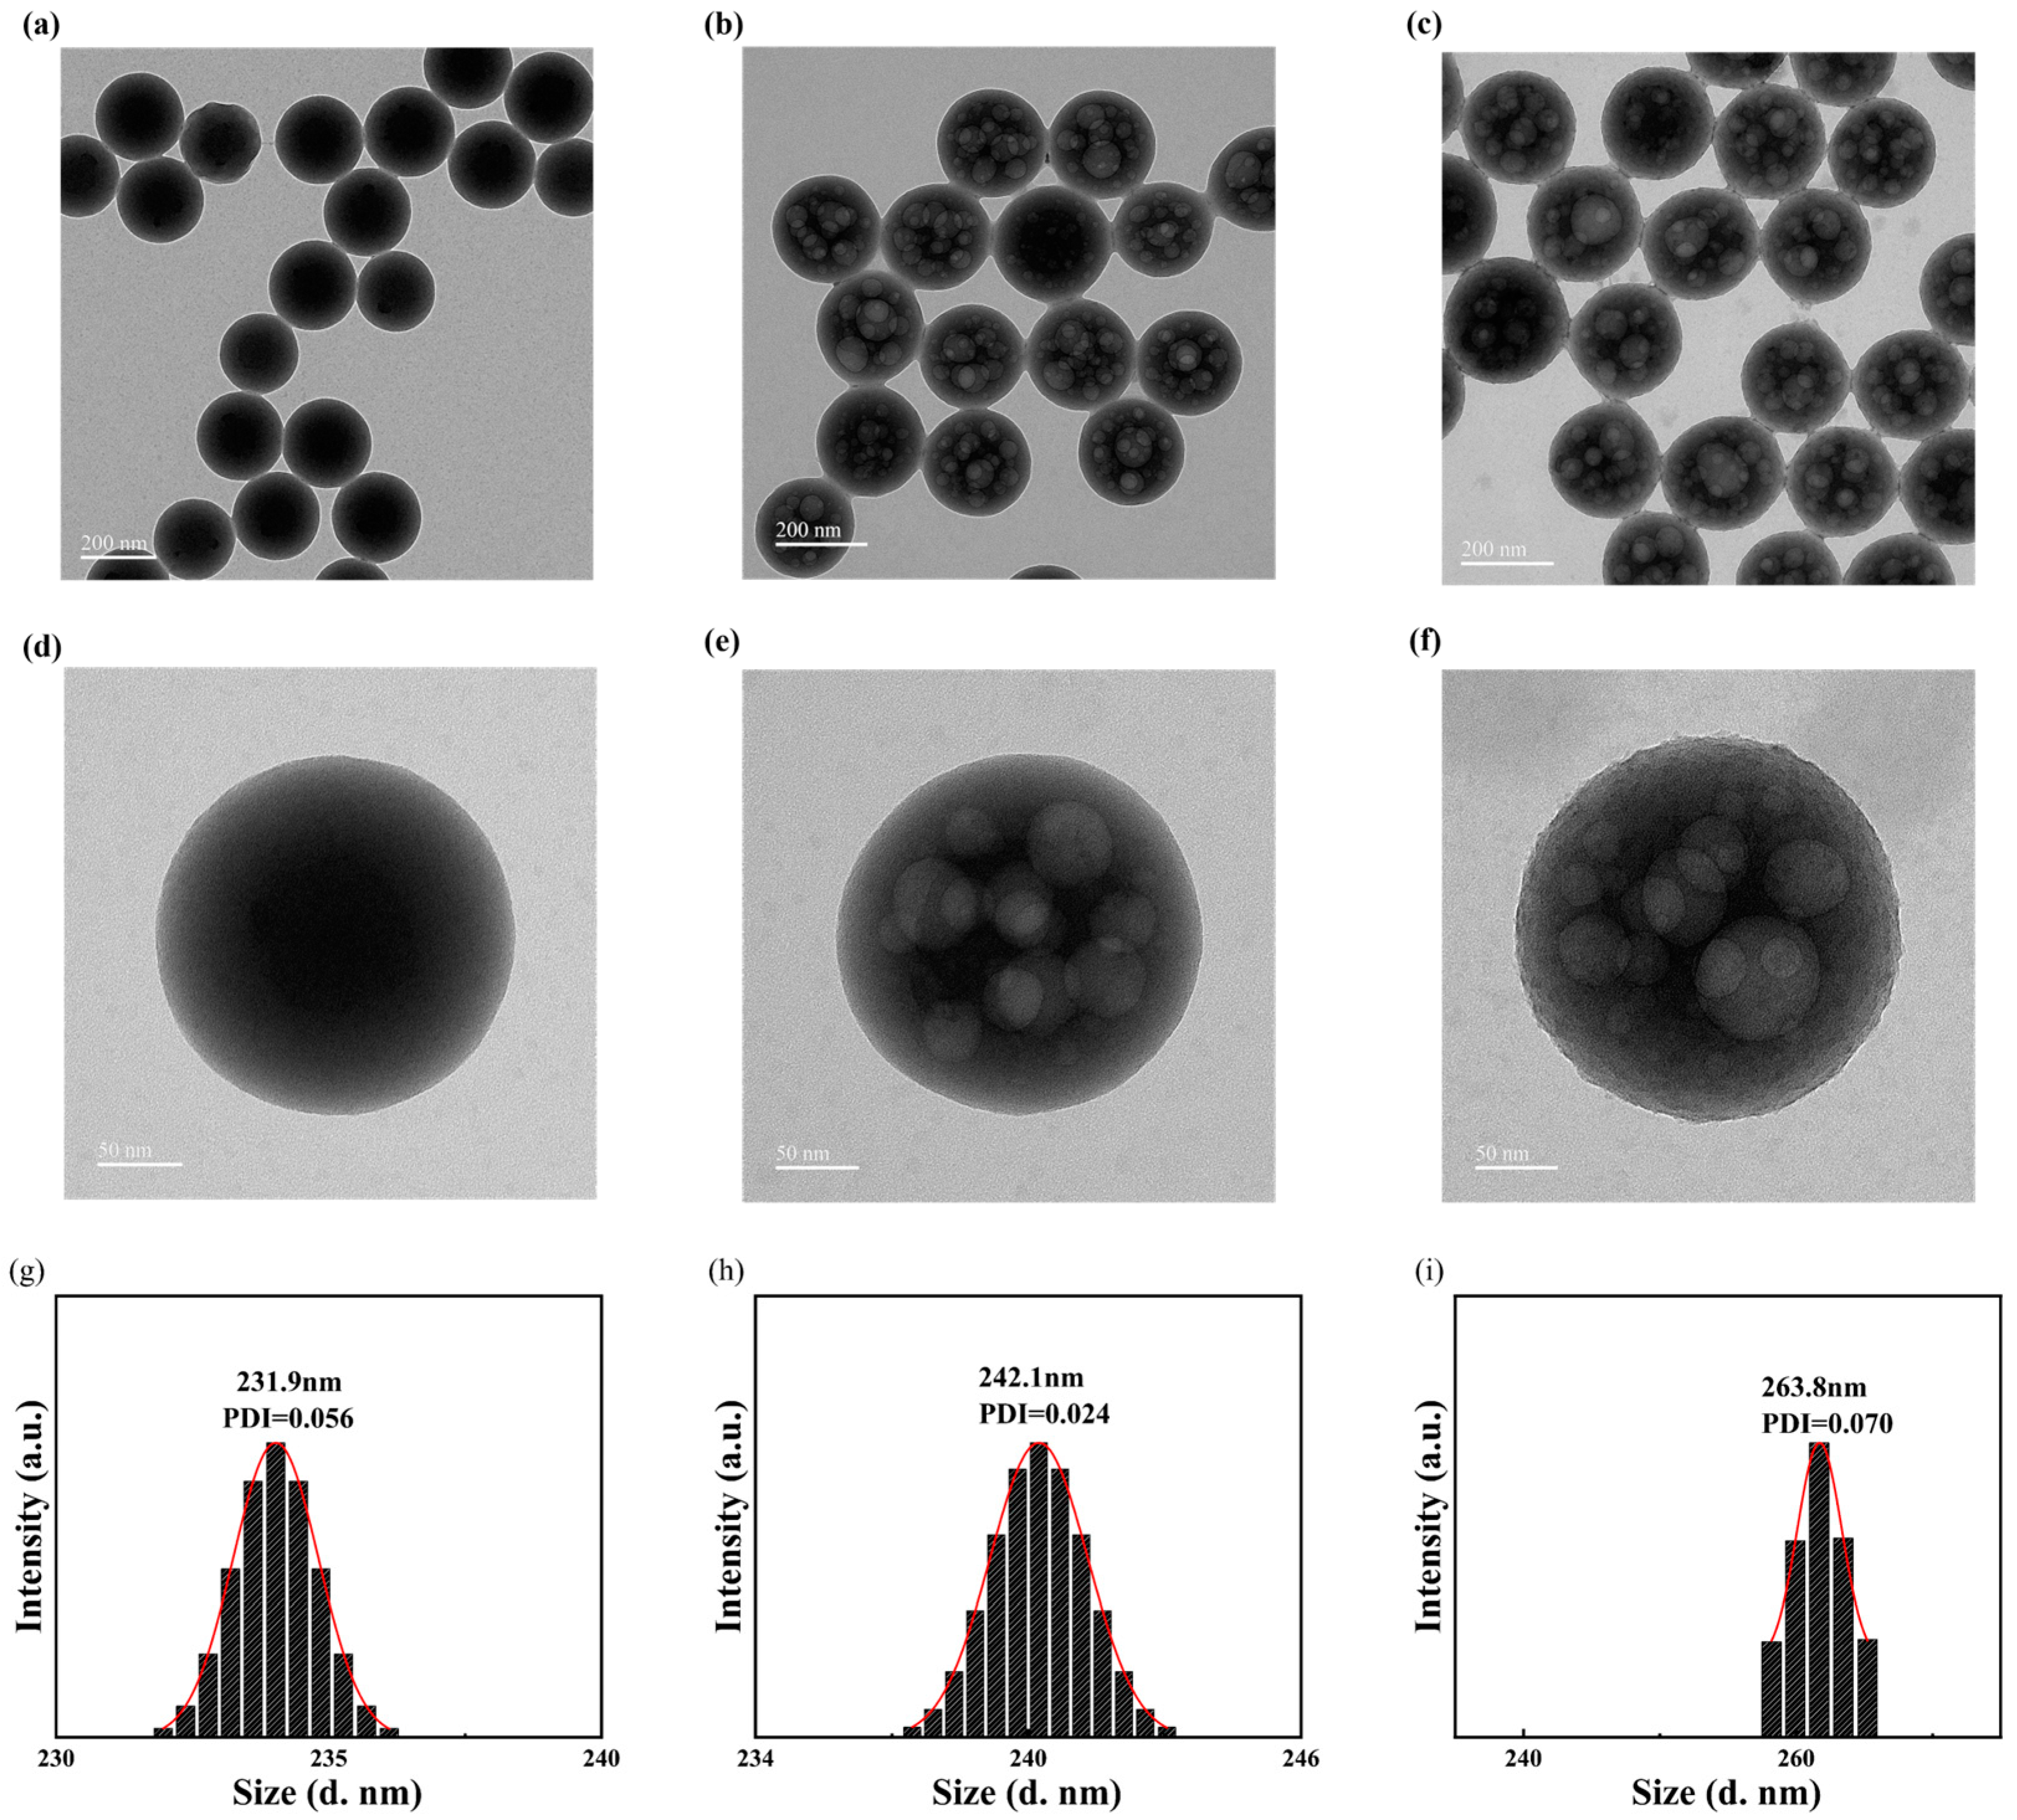
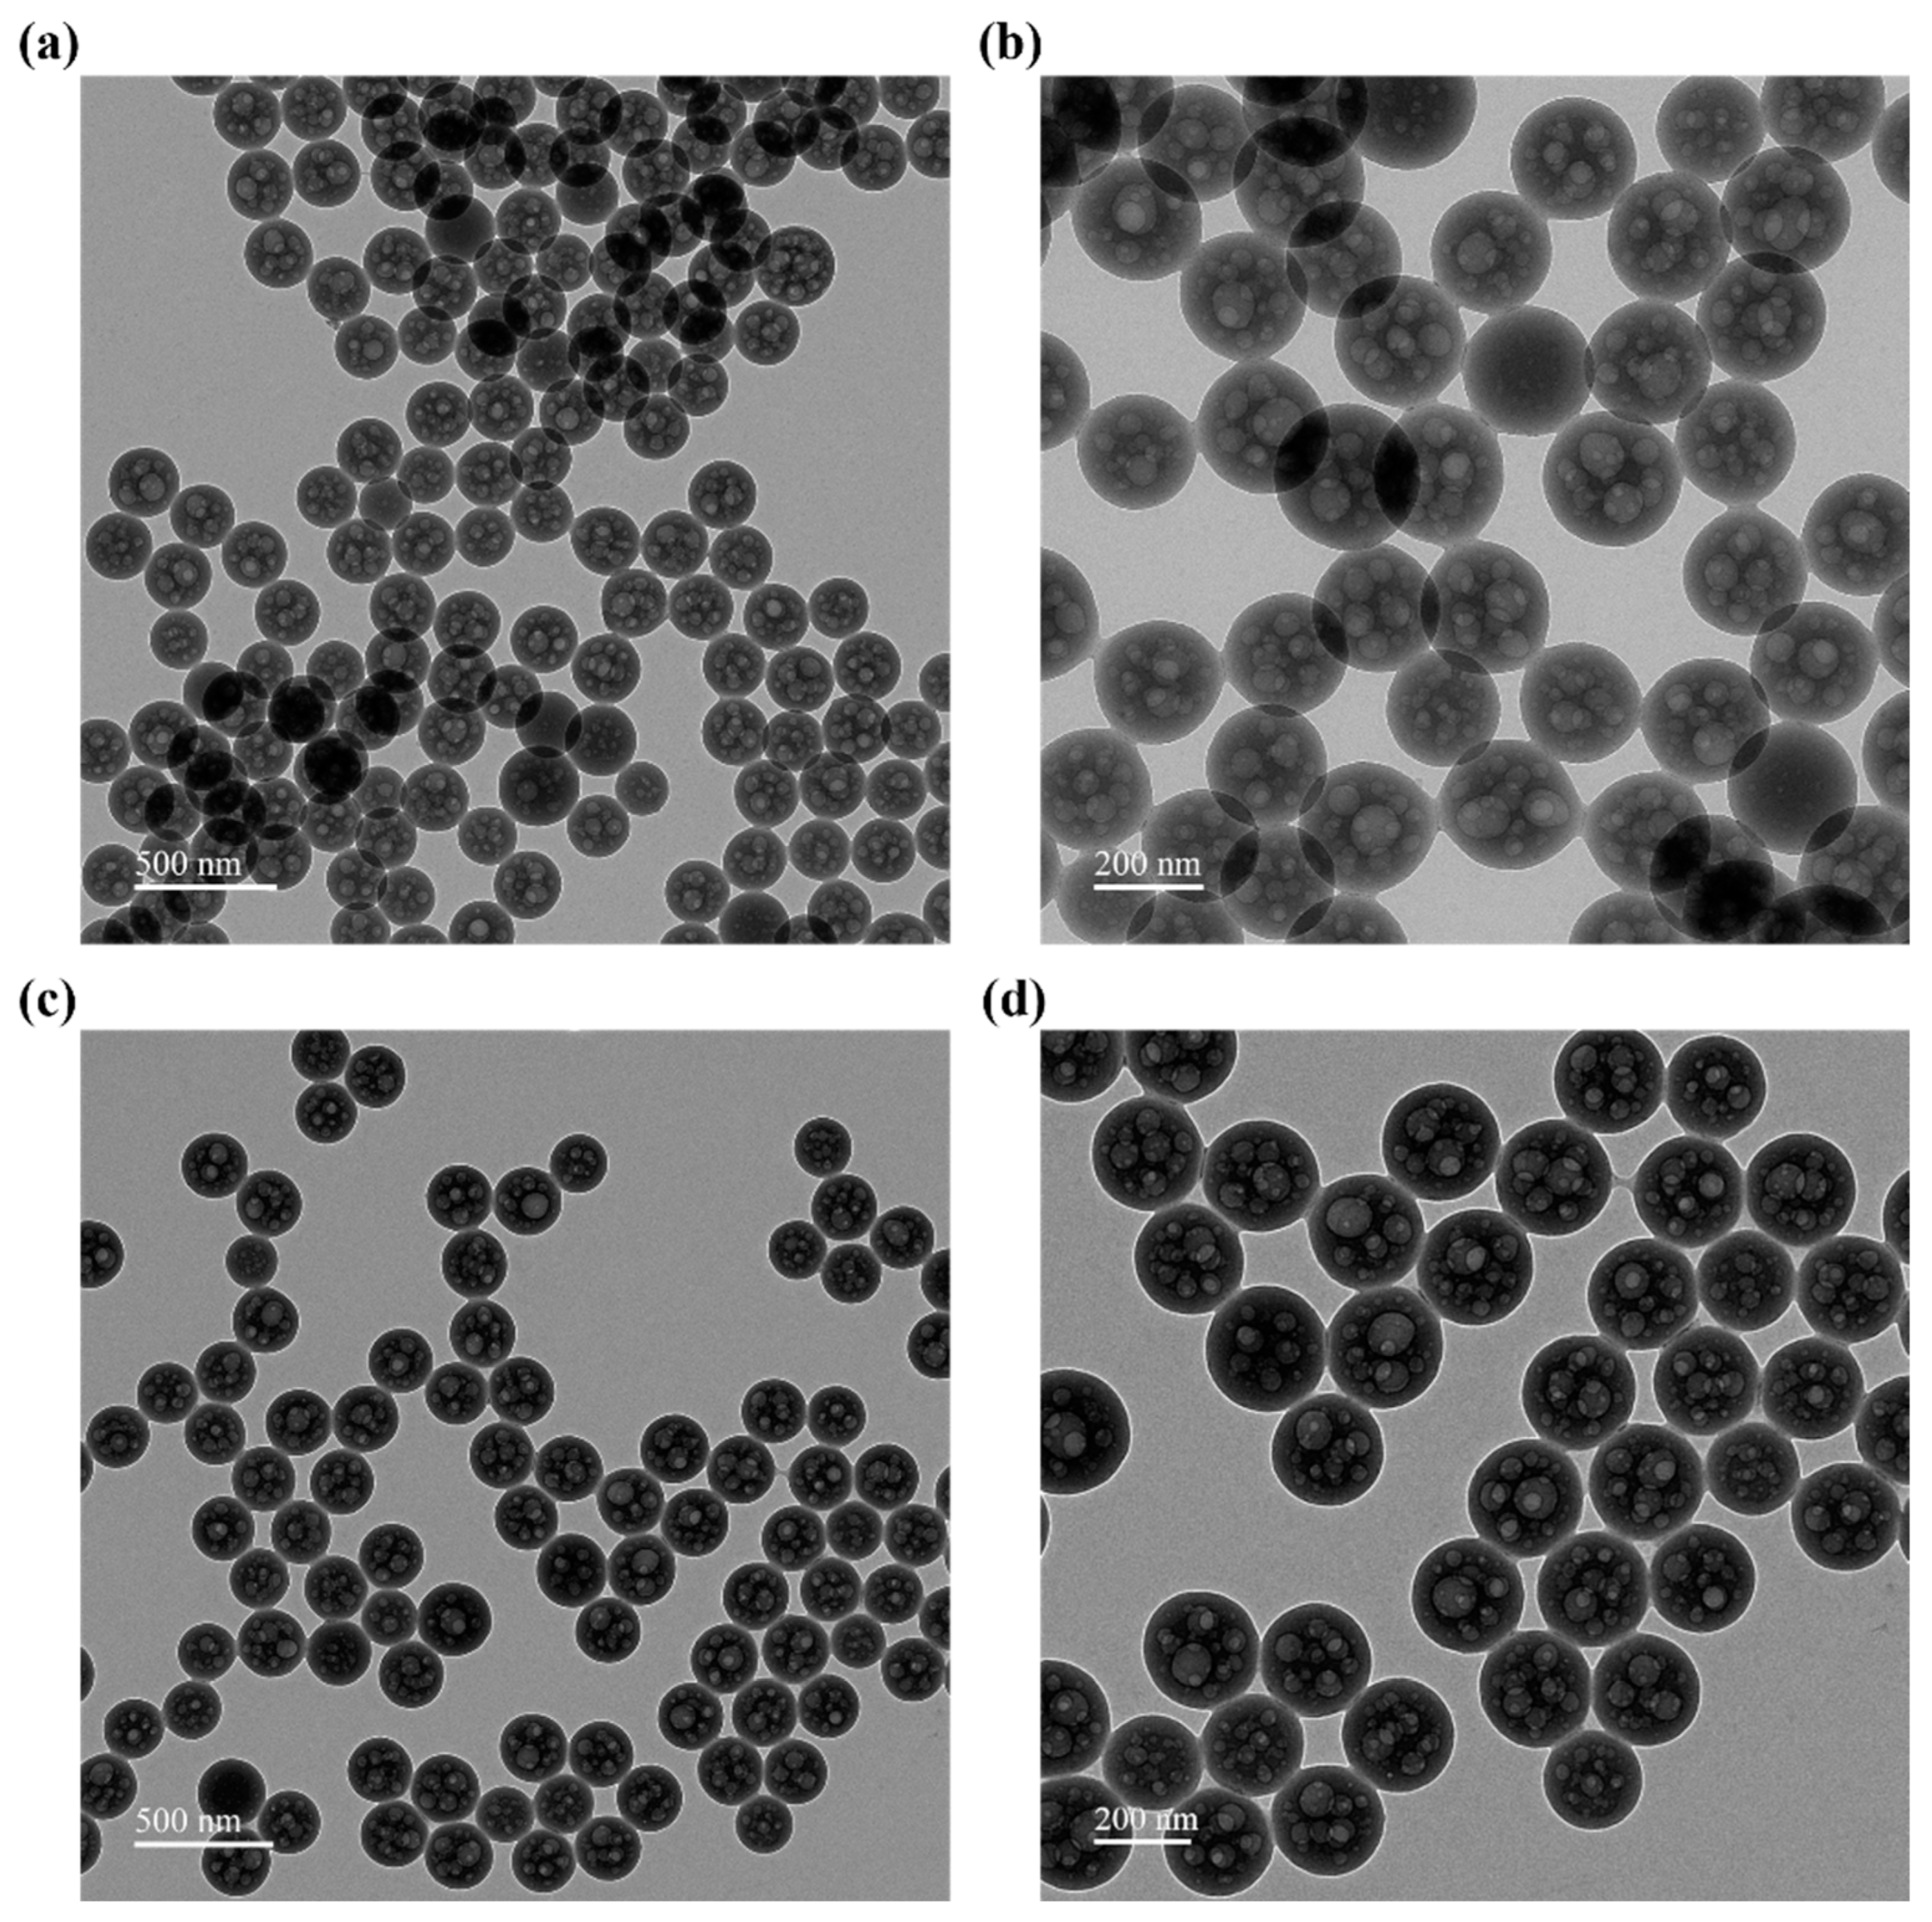
3.1. Characterization of SMA-MAA Microspheres

As illustrated in Figure 1, TEM images revealed the morphological evolution of SMA-MAA microspheres at various stages of processing. In Figure 1a, microspheres synthesized via high-temperature soap-free emulsion polymerization exhibited a smooth surface, uniform particle size, and good dispersibility, confirming the reproducibility of this polymerization method in the preparation of SMA-MAA microspheres.
Figure 1b presents the TEM image of microspheres subjected to sequential alkaline and acidic treatments, clearly demonstrating the formation of numerous internal pores of varying sizes. Although the precise mechanism responsible for pore formation remains uncertain, it is hypothesized that this porosity is associated with the swelling behavior of the microspheres during acid-base treatment. During the initial alkaline treatment, the carboxyl groups within the microspheres enhance hydrophilicity, leading to progressive water absorption and subsequent swelling. This swelling induced polymer chain rearrangement due to swelling-induced stress. The originally dense crosslinked network might undergo segmental motion, generating localized voids that eventually evolve into a porous structure. Additionally, the presence of weakly crosslinked oligomeric regions within the microspheres could not be excluded. Under acid-base treatment, these weakly crosslinked domains might be unable to withstand the swelling stress, leading to structural deformation and ultimately contributing to the observed porous morphology. Furthermore, hydrolysis might accentuate the polarity contrast between the hydrophobic styrene monomer and the hydrophilic methacrylic acid and maleic anhydride, potentially inducing phase separation. This phase segregation between hydrophobic polystyrene segments and hydrophilic carboxylate groups may further promote pore formation [30].
Following the encapsulation of microspheres with TA and ferric chloride, Figure 1c and its magnified inset indicate that the initially smooth microsphere surface becomes rough upon coating. This transformation confirmed the successful formation of a thin yet rough metal-polyphenol film on the microsphere surface. The mechanism governing MPF formation was well understood, with extensive research dedicated to its formation principles, application scope, and system development. The ability of TA and Fe3⁺ to form a coating on the microspheres’ surface primarily arose from the multiple phenol hydroxyl groups in TA, which served as strong ligands coordinating with Fe3⁺ to establish a stable complex. Due to the high charge density and available d-orbitals of Fe3⁺, each ion could coordinate with multiple phenol hydroxyl groups, forming a crosslinked network. In addition to coordination interactions, the TA-Fe complex underwent further crosslinking via hydrogen bonding, π-π stacking, and secondary interactions, resulting in a stable three-dimensional network [31]. The spontaneous assembly of the MPF on the microspheres’ surface was governed by the synergistic effects of hydrophobic interactions, electrostatic adsorption, and hydrogen bonding.
Figure 1d–f illustrates the particle size distribution of pristine microspheres, acid-base-treated microspheres, and encapsulated microspheres, respectively. It was evident that after acid-based treatment, the microsphere size increased from 231.9 nm to 242.1 nm. This observation was consistent with the hypothesis regarding porous structure formation, where the increased polarity contrast induced by acid-base treatment led to phase separation, resulting in overall swelling and an increase in effective microsphere diameter. Subsequent encapsulation with the metal-polyphenol complex further increased the microsphere size to 263.8 nm, providing additional confirmation of the successful coating of the microspheres by the complex. The Polydispersity Index (PDI) is a dimensionless index derived from dynamic light scattering (DLS) analysis, typically ranging from 0 to 1, though some instruments may report values beyond this range. A lower PDI value indicates a narrower particle size distribution (greater homogeneity), while a higher value reflects a broader distribution (greater heterogeneity in particle sizes). It is generally considered that a PDI below 0.08 represents highly monodisperse particles with excellent size uniformity. As demonstrated in the figure, the synthesized microspheres exhibit excellent size uniformity.
The elemental composition of MPF@SMA-MAA porous microspheres was characterized via EDS analysis to determine qualitative and quantitative features, with results presented in Figure 2 and Figure S1. As illustrated in these figures, carbon (C) exhibited the highest atomic fraction (94.26%), primarily derived from the carbon skeletons of styrene and maleic anhydride monomers, as well as contributions from tannic acid and dye molecules. Among the remaining elements, oxygen (O) displayed the next highest abundance (5.23% atomic fraction), originating predominantly from maleic anhydride monomers and minor contributions from tannic acid. Nitrogen (N) ranked third with an atomic fraction of 0.35%, which originated solely from dye molecules. The detection of N in the EDS spectra confirms successful dye loading into the microsphere matrix and validates the penetration of dye molecules into the internal structure, thereby corroborating the successful execution of the dyeing process. Iron (Fe) exhibited the lowest abundance (0.16% atomic fraction). Despite its minimal content, the presence of Fe in the spectra unambiguously indicates the successful assembly of MPF with the microspheres, thereby confirming the synthesis of the target composite material. These findings collectively validate the structural integrity and compositional uniformity of the MPF@SMA-MAA microspheres as designed.

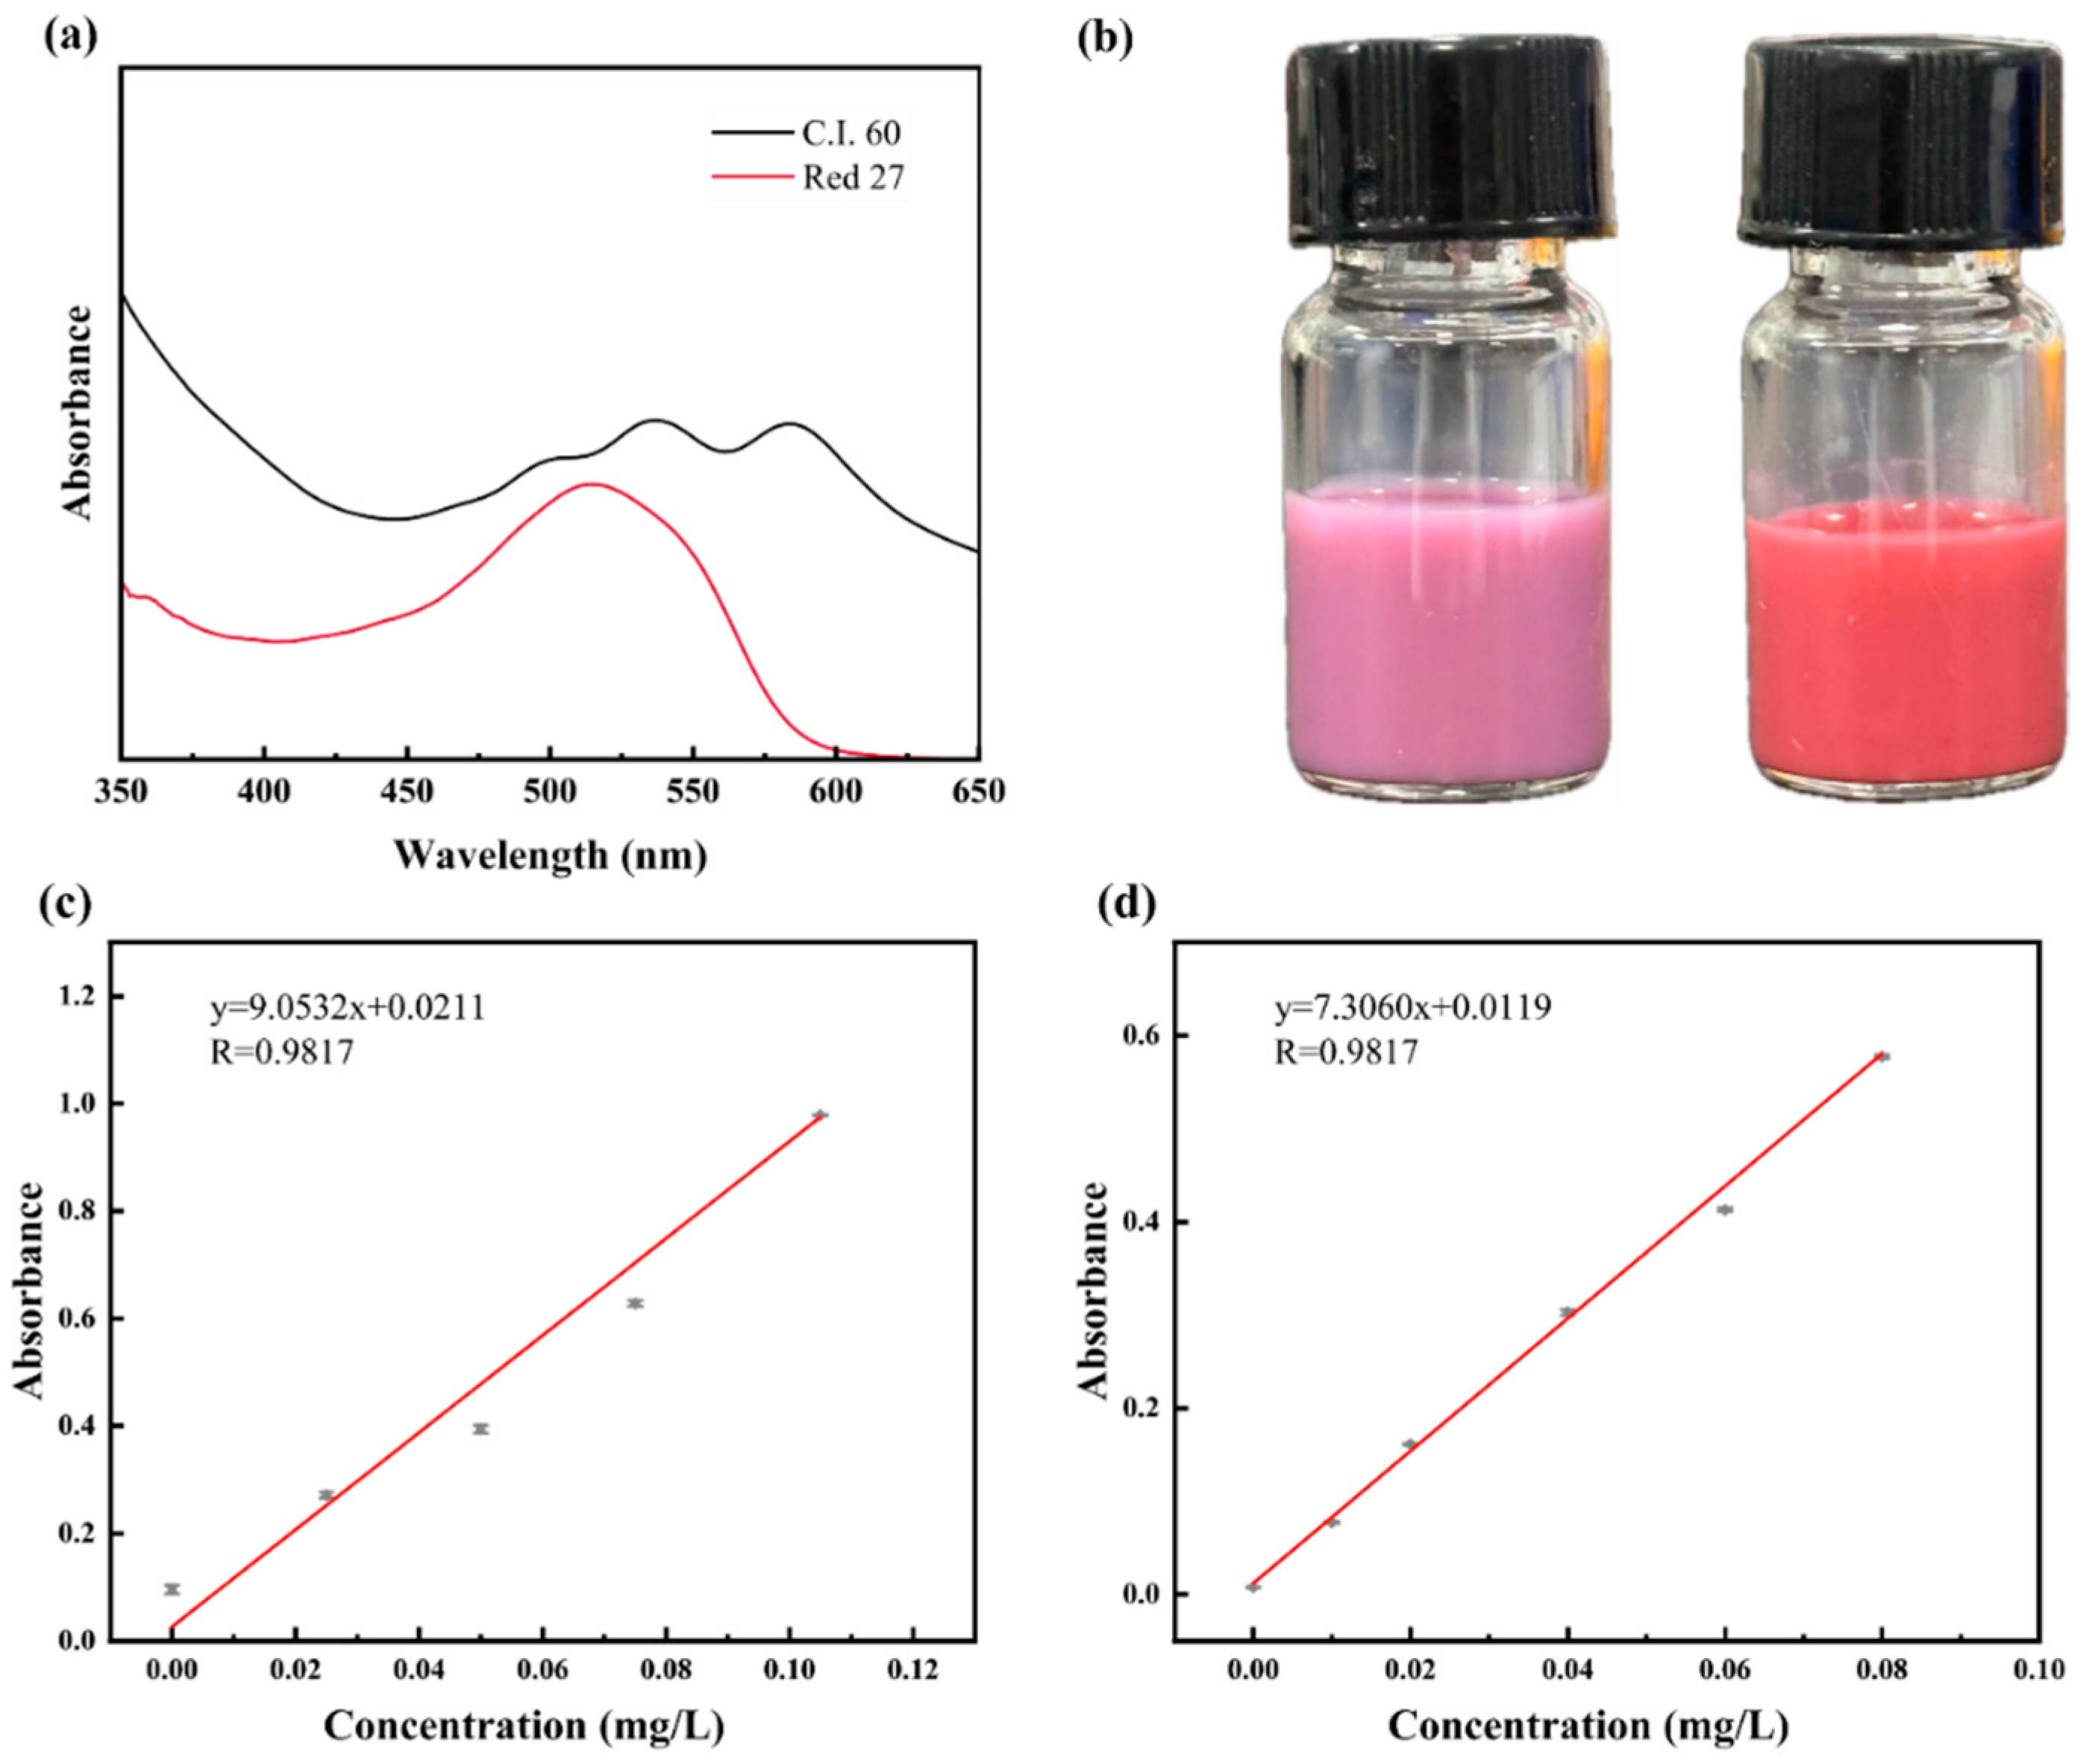
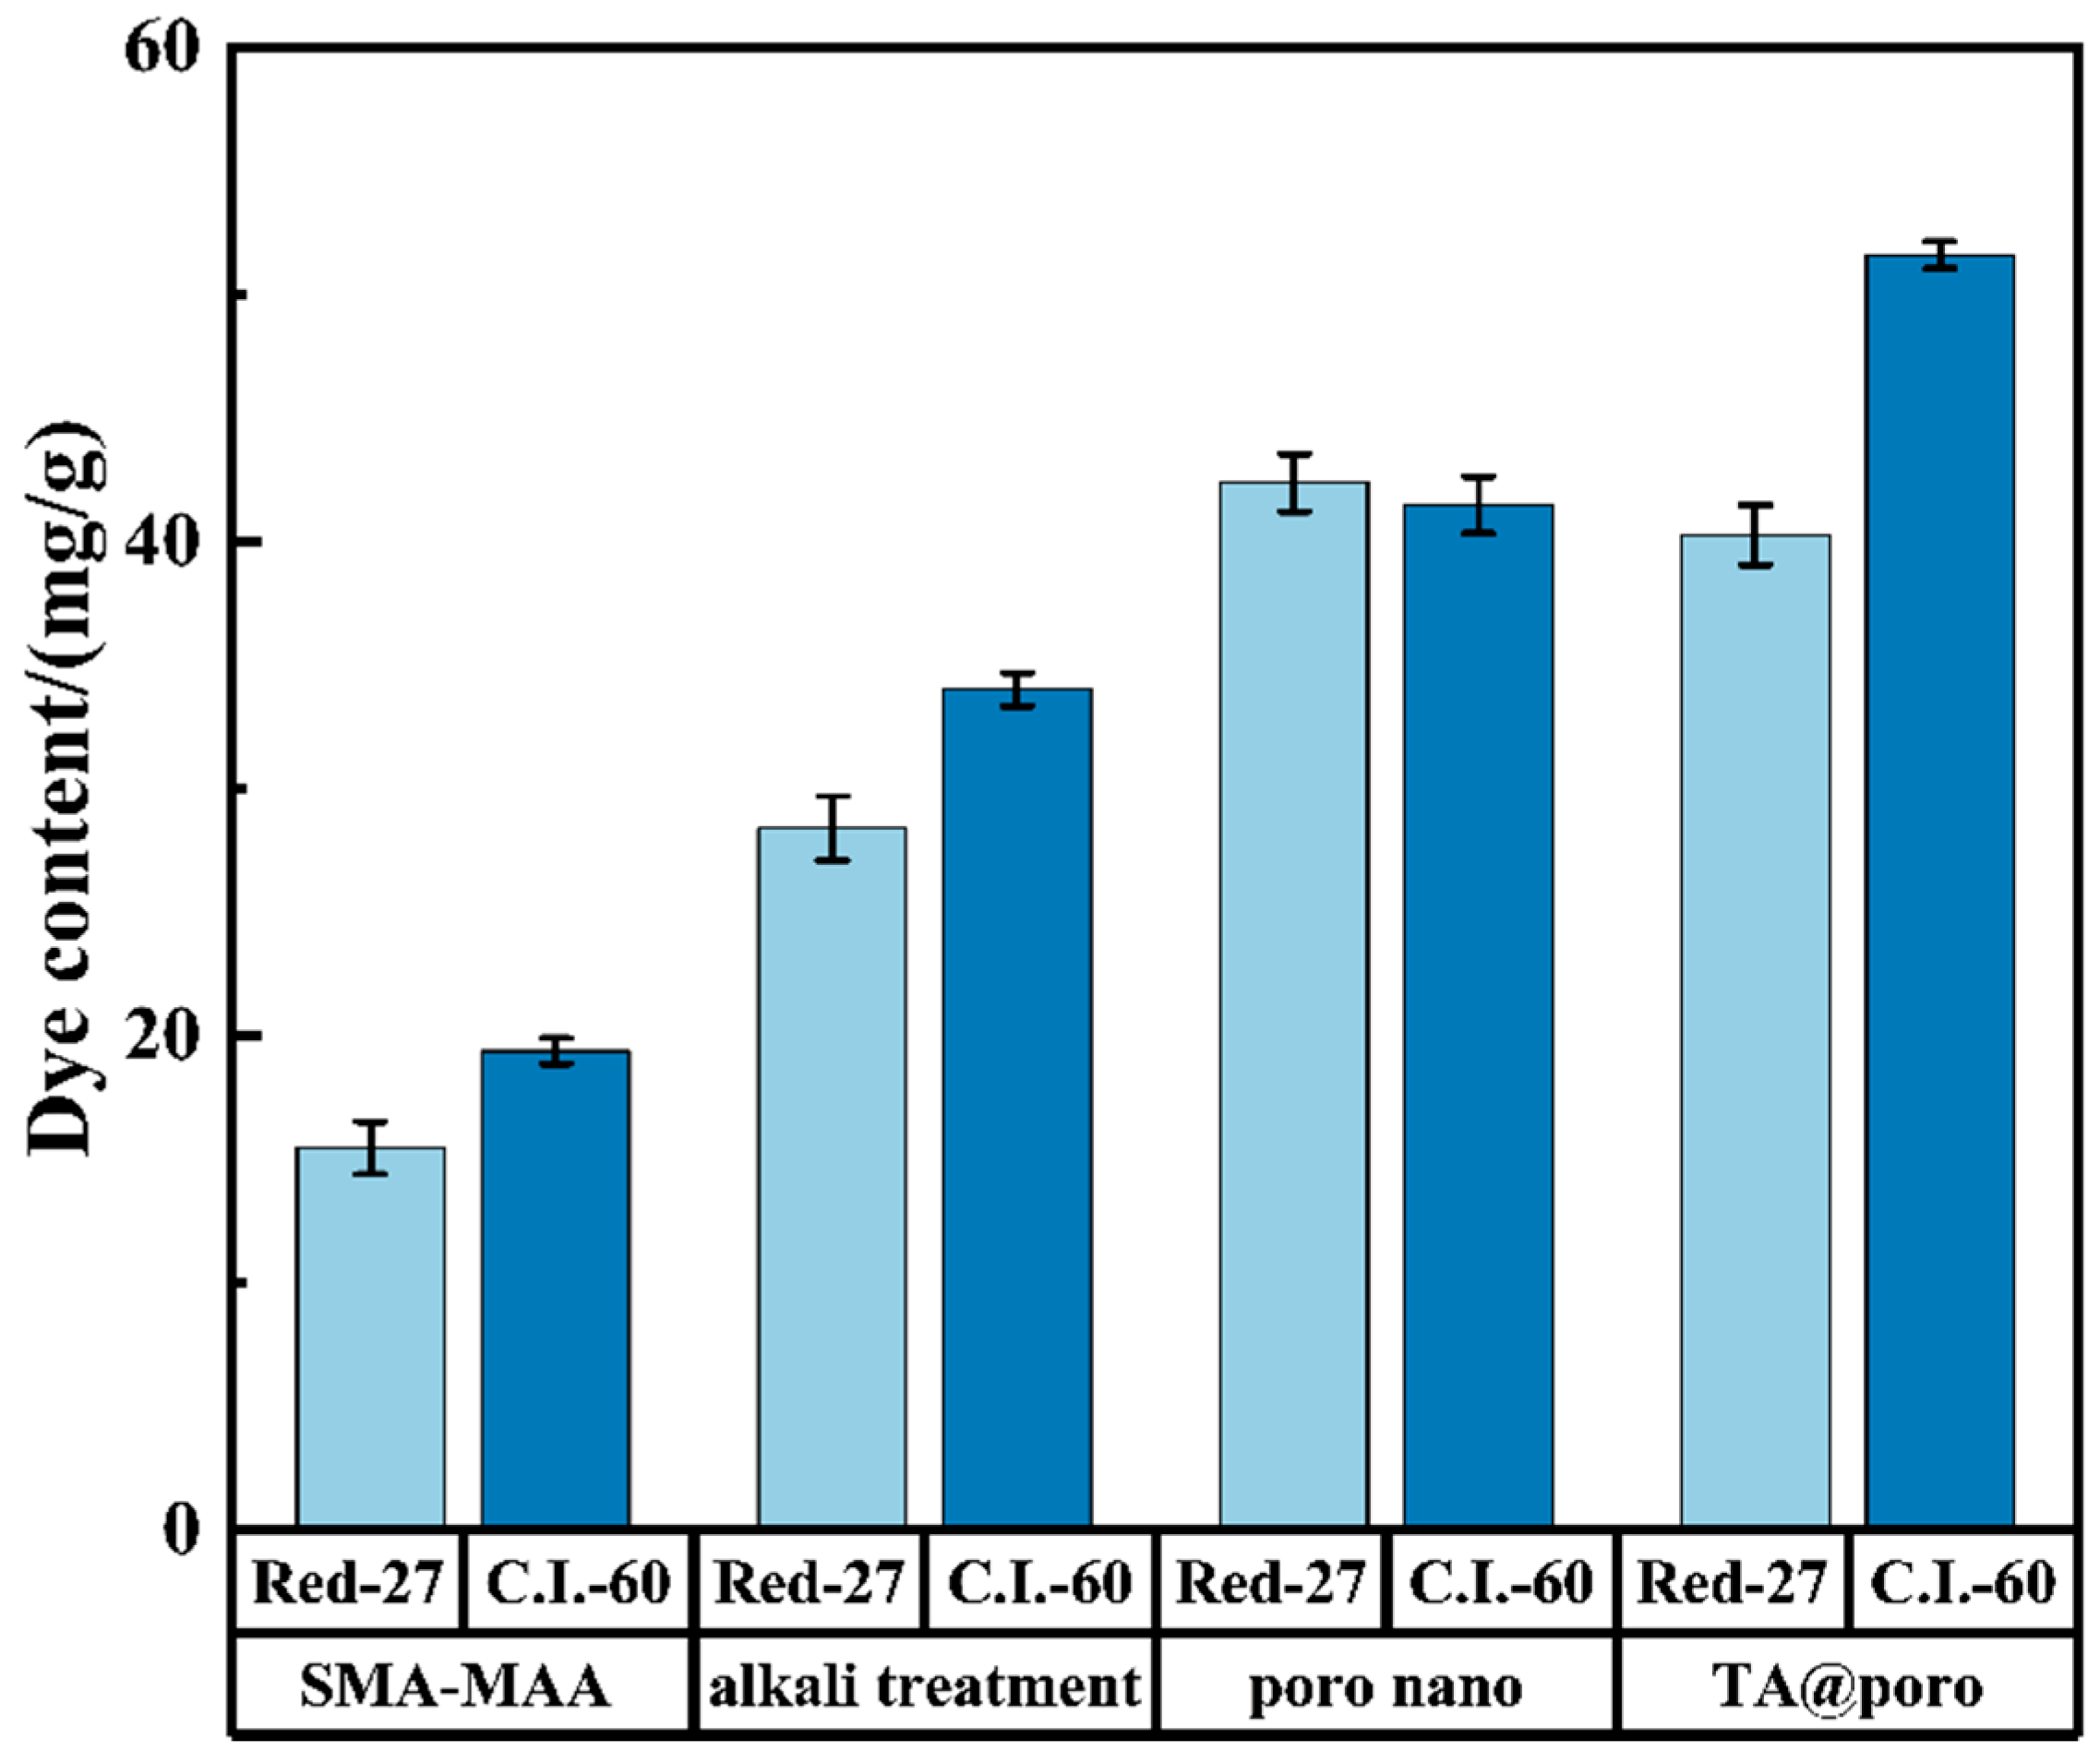
3.2. Dye Content of Colored Microspheres

The dye loading capacities were determined using a UV-visible spectrophotometer for qualitative and quantitative analysis of various samples [32]. Figure 3a presents the UV-visible absorbance spectra for C.I.-60 and Red-27. Based on the peak values in the curves, C.I.-60 exhibited two primary absorbance peaks at wavelengths of 548 nm and 592 nm, with a maximum absorbance at 548 nm, whereas Red-27 displayed a single distinct absorbance peak at 513 nm. Utilizing 548 nm and 513 nm as the characteristic absorption peaks for C.I.-60 and Red-27, respectively, spectrophotometric measurements were conducted to establish the absorbance-concentration standard curves presented in Figure 3c,d. The correlation equation describing the relationship between Red-27 absorbance and dye concentration is y = 9.0532x + 0.0211, whereas for C.I.-60, it is y = 7.3060x + 0.0119. These equations enabled the quantitative assessment of dye loading in the microsphere samples.
The TEM images provided in Figure 4 revealed notable morphological differences between the two samples. As observed in Figure 4a, the microspheres underwent significant structural modifications, including the formation of multiple internal pathways that facilitated interconnection among microspheres. In contrast, Figure 4b did not exhibit such structural alterations, maintaining a morphology similar to that of undyed porous microspheres. The primary factor contributing to this discrepancy was the variation in the dyeing mechanisms of the two dyes. As previously noted, Red-27 demonstrated poor water solubility, whereas C.I.-60 exhibited greater solubility in aqueous environments. Consequently, the dyeing process for Red-27 necessitated the inclusion of a swelling agent to enhance dye penetration, whereas C.I.-60 could be directly dispersed in an aqueous bath for staining. Given the low polarity of Red-27, the selected swelling agent must also possess low polarity. Upon entering the microspheres, the swelling agent interacted with the internal styrene chains within the microspheres, adhering to the “like dissolves like” principle and resulting in partial dissolution. In densely structured microspheres, robust chemical interactions and secondary forces within the internal structure counteracted dissolution effects, thereby preventing morphological changes. However, in porous microspheres synthesized through acid-base treatment, the internal interactions were inherently weaker than those in conventional microspheres. As a result, they were unable to withstand the dissolution effects induced by the swelling agent, ultimately leading to morphological transformations and the formation of internal pathways.
Figure 5 compares the dye content of porous microspheres before and after being coated with the TA@Fe composite, showing variations over different ultrasonic treatment durations. The comparison revealed a significant reduction in dye leakage after coating with the TA@Fe composite, further validating the success and rationality of the experimental design. The primary mechanism by which the TA@Fe composite prevents dye leakage is its abundant phenol hydroxyl (-OH) functional groups. These hydroxyl groups interacted with the functional groups on Red-27 and C.I.-60 dye molecules through hydrogen bonding, π-π interactions, and hydrophobic forces. These interactions enhanced the physical adsorption of dyes onto the microspheres, thereby increasing binding strength and reducing dye leakage or detachment [33,34].

3.3. Effect of Microsphere Treatment and TA on Dye Loading

To evaluate the influence of various microsphere modification steps on dye-loading efficiency, a quantitative dye uptake analysis was conducted for microspheres stained with Red-27 and C.I.-60, as presented in Figure 6. The study compared pristine SMA-MAA microspheres, alkali-treated microspheres, porous microspheres obtained through sequential alkali and acid treatments, and porous microspheres coated with TA. The results demonstrated that alkali treatment enhanced the internal accessibility of the microspheres, facilitating dye molecule penetration and thereby increasing dye loading. Further acid treatment, which generated a porous microstructure, significantly boosted dye-loading capacity. This improvement was largely attributed to the increased specific surface area and internal pore volume of the porous microspheres. In contrast to the dense structures of untreated or solely alkali-treated microspheres—where dyes tended to localize on the outer surfaces—the porous matrix provided additional adsorption sites and allowed for deeper dye entrapment. Furthermore, the interconnected pore network accelerated molecular diffusion, promoting more efficient dye incorporation. Interestingly, the impact of TA on dye uptake differed markedly between Red-27 and C.I.-60, a phenomenon likely rooted in the distinct dyeing methodologies employed. Red-27, which exhibited poor water solubility, was applied using a dual-swelling technique that combined solvent and thermal swelling. The dye was first dissolved in diethoxyethanol, an organic solvent, and then mixed with the microsphere suspension. During dyeing, both solvent and dye molecules were absorbed into the microspheres. However, the introduction of TA interfered with this process. Specifically, TA’s carboxyl groups formed hydrogen bonds with the amine functionalities in Red-27, thereby redistributing part of the dye into the aqueous phase. This effectively reduced the concentration of Red-27 within the swelling solvent, leading to a decrease in dye incorporation into the microspheres.
Conversely, the dyeing behavior of C.I.-60 responded positively to the presence of TA. As a more water-soluble dye, C.I.-60 did not require an organic solvent for dispersion and could be directly incorporated into aqueous systems. The polyphenolic TA coating, rich in hydroxyl and carboxyl groups, interacted synergistically with the polar functional groups in C.I.-60, enhancing the dye’s dispersion through hydrogen bonding. It was well established that the molecular size and dispersion quality of dye particles critically influenced their uptake by nanoscale and submicron carriers. Smaller, well-dispersed dye molecules typically exhibited superior penetration and loading efficiency. Therefore, TA enhanced the dyeing performance of water-soluble disperse dyes like C.I.-60 but impairs the efficiency of oil-soluble, less polar dyes such as Red-27.

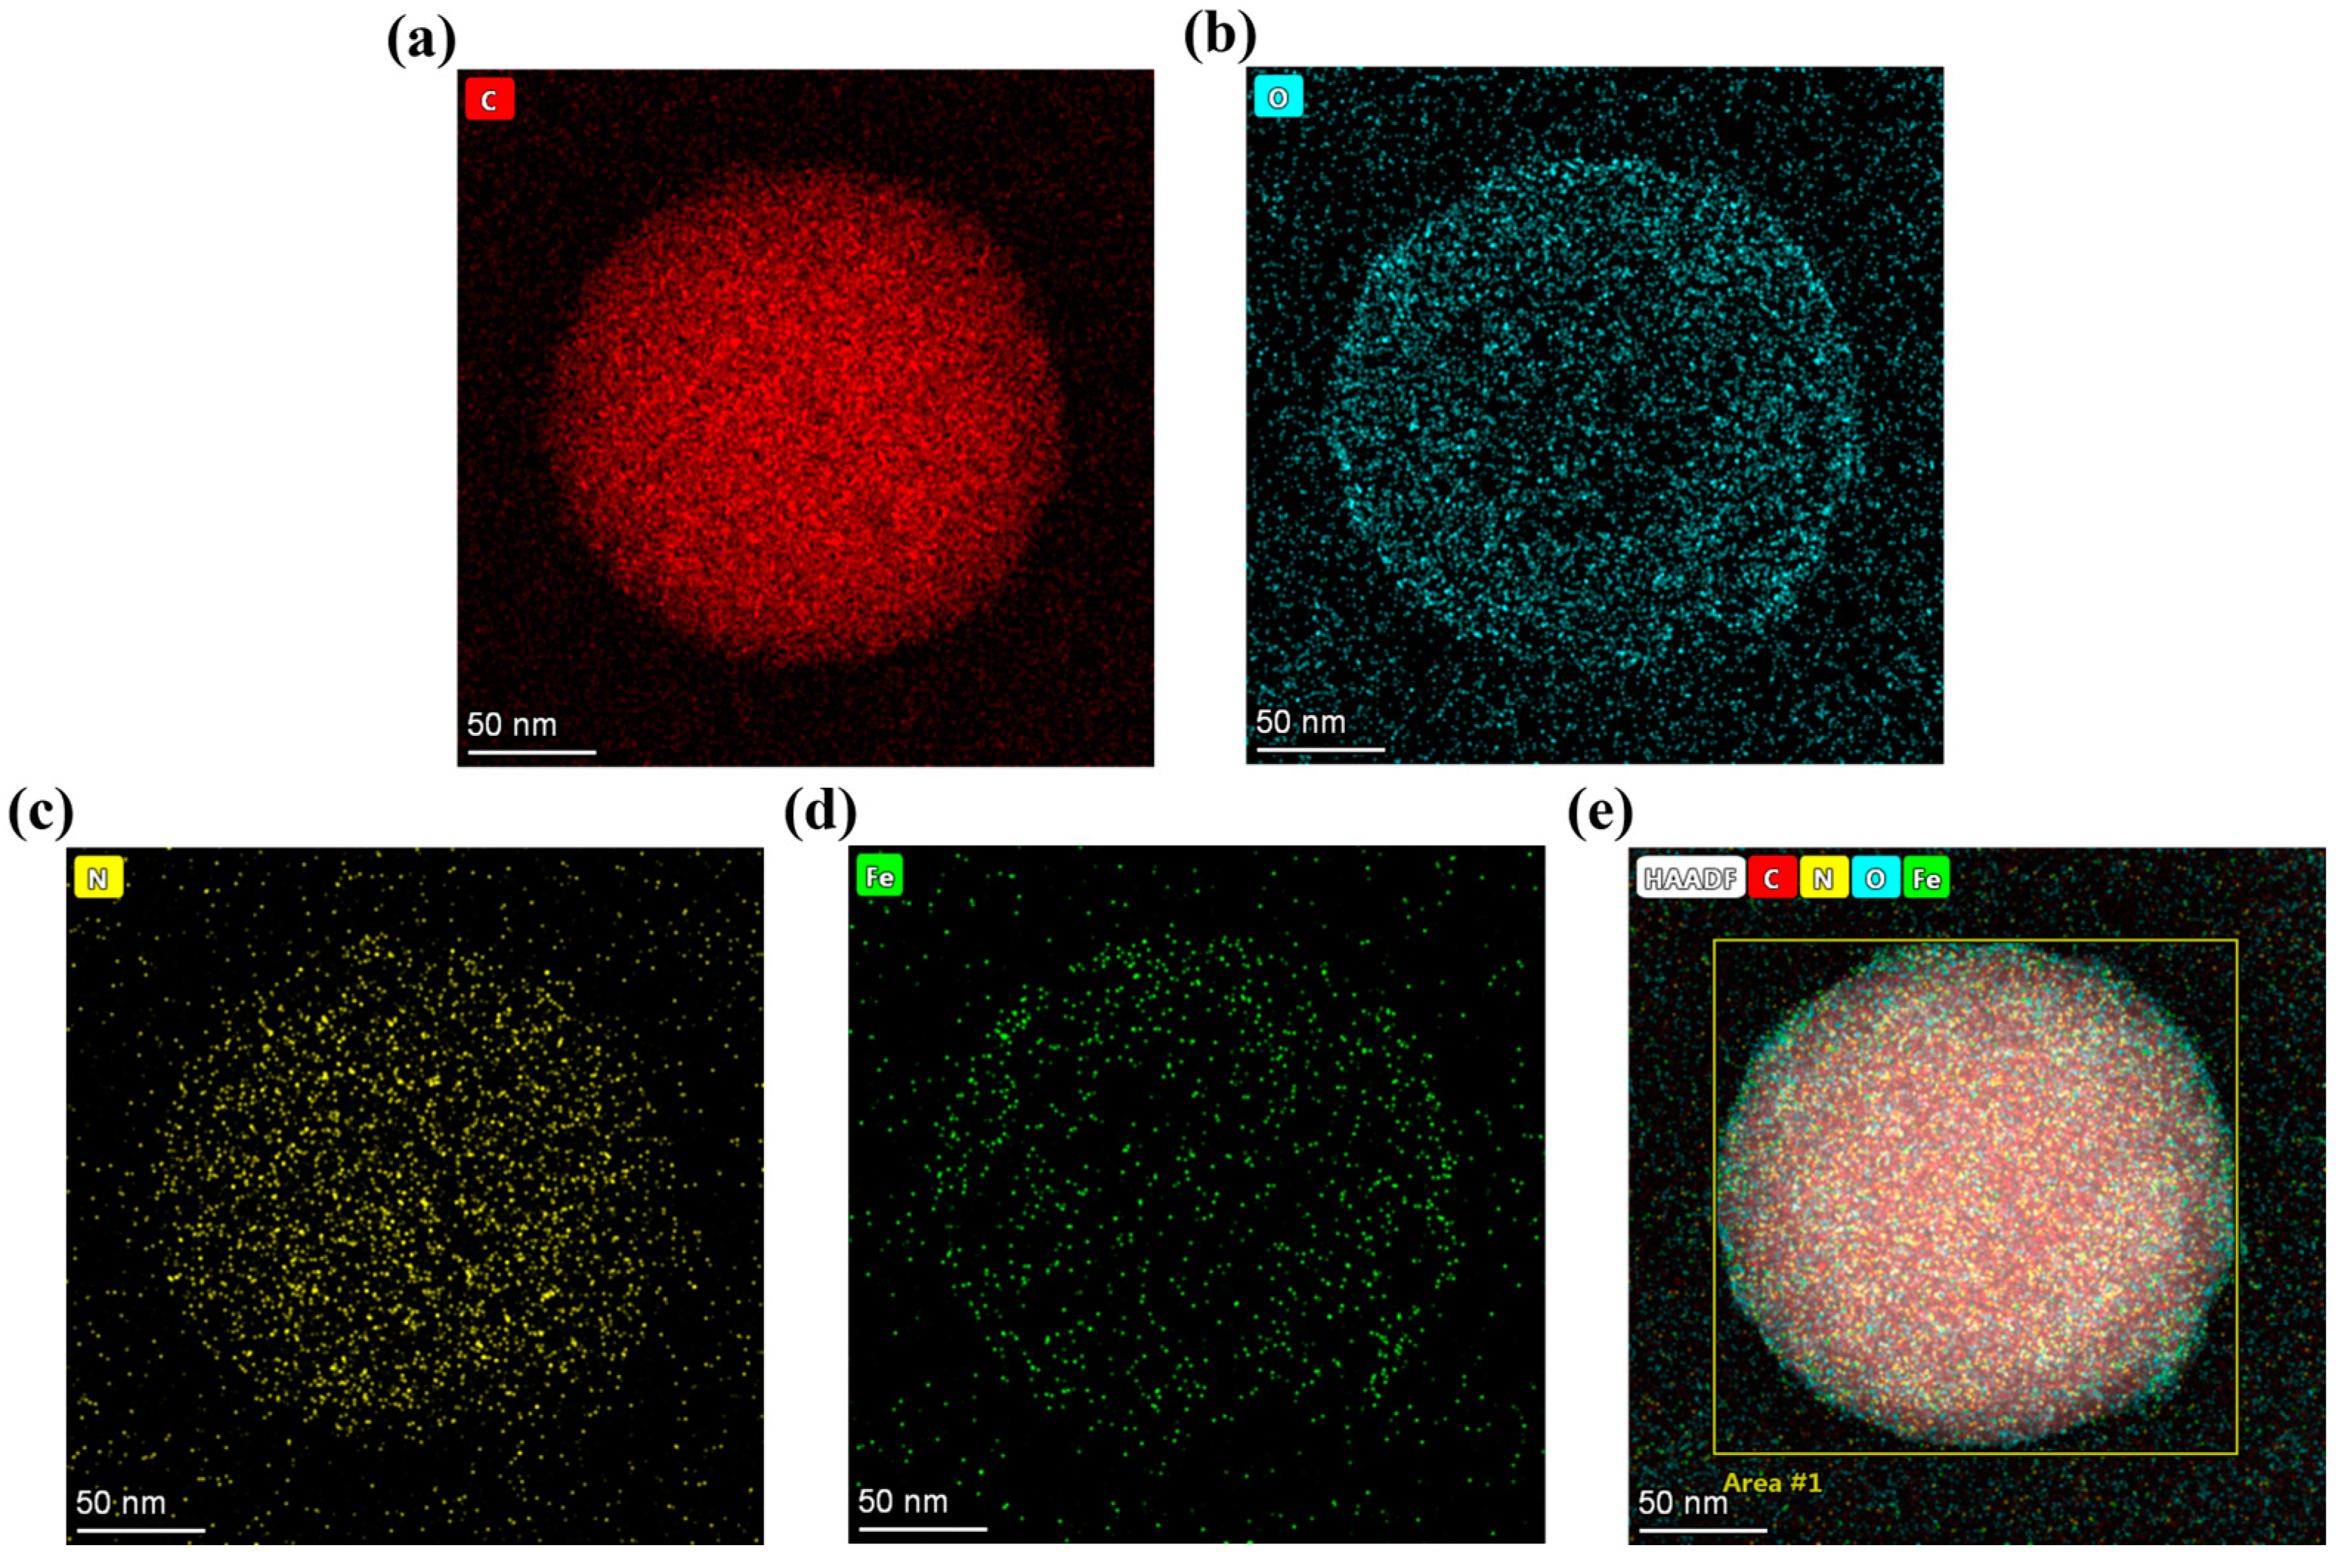
3.4. Effects of Iron Ion and TA Introduction on the System

Iron ions (Fe3⁺) played a crucial structural role in the formation of MPF. In this system, however, Fe3⁺ not only formed coordination complexes with TA but also interacted directly with SMA-MAA microspheres. TEM characterization of microspheres treated solely with Fe3⁺ was presented in Figure 7a,b, revealing a pronounced tendency toward aggregation. This behavior was primarily attributed to the effect of Fe3⁺ on the surface charge of the microspheres. Upon introduction, Fe3⁺ ions and their positively charged hydrolysis products were electrostatically adsorbed onto the negatively charged microsphere surfaces, leading to charge neutralization. This resulted in a shift in zeta potential toward neutrality, compression of the electrical double layer, diminished electrostatic repulsion, and a lowered energy barrier for particle interaction, collectively facilitating aggregation. Moreover, Fe3⁺ ions, as transition metal species with vacant d-orbitals, could form coordination bonds with electron-donating groups such as carboxyl (-COOH) moieties on the microsphere surface. These chemical interactions further strengthened the Fe3⁺–microsphere binding and reduced interparticle energy barriers, thus exacerbating the aggregation phenomenon [35].
In contrast, the addition of TA alone did not induce significant aggregation, as shown in Figure 7c,d. The microsphere morphology remained largely unchanged, and no evident agglomeration was observed. This was because, although TA also adsorbed onto the microsphere surface, it did not carry a strong positive charge and therefore did not neutralize the microsphere’s negative surface potential. As a result, the integrity of the electric double layer was preserved, maintaining colloidal stability. Beyond modifying surface charge and colloidal behavior, the incorporation of Fe3⁺ and TA also affected the optical properties of the microspheres. As depicted in Figure 7, the addition of TA and FeCl3 caused a visible darkening of C.I.-60@SMA-MAA and Red-27@SMA-MAA microsphere suspensions. This effect arose from the intrinsic black coloration of the TA–Fe3⁺ complex. The deposition of this complex onto the microspheres intensified their color, thereby enhancing signal contrast. In the context of lateral flow immunoassays (LFIAs), such heightened color intensity improved the visibility of test lines, facilitating signal amplification and contributing to increased sensitivity for target analyte detection.

3.5. Optimization of Dyeing Parameters

The dyeing parameters for C.I.-60 and Red-27 were systematically optimized. In Figure 8a, a bar graph depicts the relationship between dyeing duration and the C.I.-60 content incorporated into the microspheres. The results indicated a progressive increase in dye uptake with time, reaching a saturation point at 3 h. Beyond this duration, no further enhancement in dye loading was observed, thereby identifying 3 h as the optimal dyeing time for C.I.-60. Figure 8b presents the influence of dye and TA concentrations on dyeing efficiency. The data revealed that the most effective concentration of C.I.-60 is 0.25 mg/mL, while the optimal TA concentration is 8 mg/mL. Notably, a further increase in TA content negatively affected the dyeing outcome. This was likely due to excessive TA interacting with dye molecules, promoting their aggregation, and thereby reducing the overall dyeing efficiency. Figure 8c,d explores the dyeing behavior of Red-27. Figure 8c demonstrates that dye uptake plateaus at approximately 2.5 h, suggesting that this was the optimal reaction time for Red-27. In Figure 8d, the relationship between dye concentration and dyeing efficiency is examined. The data showed that increasing the concentration of Red-27 beyond 20 mg/mL did not yield additional dye uptake. This phenomenon was attributed to the limited solubility of Red-27 in the swelling agent, diethoxyethanol. When the solubility threshold was exceeded, excess dye tended to aggregate rather than penetrate the microspheres effectively. Therefore, the optimal dye concentration for Red-27 in the swelling solution was determined to be 20 mg/mL.

3.6. Monkeypox Antigen Immunoassay

Compared to the traditional carboxyl activation-based antibody conjugation methods commonly used with conventional biomaterials, MPF-based composites exhibited greater potential in the field of biosensing. The abundant hydroxyl groups present in TA endow TA-derived nanomaterials with a certain degree of negative surface charge. Moreover, TA was considered a highly effective protein enrichment compound, capable of achieving antibody labeling through simple mixing with signal tracers (such as the primary antibody in sandwich immunoassays). This simplified conjugation approach avoids redundant experimental steps and minimizes the risk of antibody activity loss, which might occur with conventional organic crosslinkers such as EDC/NHS or glutaraldehyde. In this paper, sandwich immunoassay-based antibody conjugation detection of MPVX was carried out using the previously synthesized colored microspheres.
As shown in Figure 9, LFIA was employed to detect Monkeypox antigen samples of varying concentrations. The results demonstrated that the fluorescence signal intensity at the test (T) line is positively correlated with the antigen concentration. With increasing antigen concentrations, the T line signal intensity gradually increases, showing a clear linear relationship. Figure 9b,d present standard curves plotting the logarithm of T line intensity versus the logarithm of Monkeypox antigen concentration, both displaying linear trends. The linear regression equation for the MPF@Red-27@SMA-MAA-LFIA detection system is y = 0.5195x + 1.2923, with a correlation coefficient (R2) of 0.9828; for the MPF@C.I.-60@SMA-MAA-LFIA system, the corresponding equation is y = 0.3178x + 1.5038, with a correlation coefficient of 0.9884. These results indicated good linearity at low concentration ranges, with detection limits of 0.171 ng/mL and 0.192 ng/mL, respectively. As demonstrated in Table S1, the colorimetric microspheres developed in this study exhibit superior LOD and broader linear ranges compared to conventional counterparts reported in the literature, thereby underscoring their promising potential for translational application in clinical diagnostics.
To assess the specificity of the MPF@Red-27@SMA-MAA-LFIA and MPF@C.I.-60@SMA-MAA-LFIA test strips in the detection process, three sets of control experiments were performed. In addition to the MPVX antigen, HCG and AFP biomarkers were added as interference factors for comparison. As illustrated in Figure S2a,c, signals were detected solely in the test line for the target analyte MPVX antigen, but signals were not detected in the other test strips. This result demonstrated that the proposed immunoassay system has excellent detection specificity, with clear identification of the target substance. In order to evaluate the stability of the MPF@Red-27@SMA-MAA-LFIA and MPF@C.I.-60@SMA-MAA-LFIA test strips during detection, the colored latex microspheres were aged for a period before the assay was carried out using the test strips, and experimental results were compared. Figure S2b,d demonstrates the aging study of the fluorescent microspheres. As indicated in the figure, after three-month storage, both microspheres were still functional and bioactive, and were ready for application in immunoassays. Unlike fluorescent dyes, colored latex microspheres did not lose their fluorescence intensity with long storage periods.

4. Conclusions

This study is focused on the synthesis of novel color latex microspheres and their application in LFIA for the determination of Monkeypox antigens. The SMA-MAA microspheres were first synthesized by the method of soap-free emulsion polymerization. Porous surface structures were introduced by alkaline and acidic treatment for the enhancement of the ability to load dyes and binding stability. The microspheres were also coated with a TA–Fe complex. The complex provided a stable coating on the surface of the microsphere, improving the dispersibility of the particles and the uniformity of the distribution of the dye in aqueous mediums. It also provided strong binding of the dye molecules through secondary interaction, reducing the leakage of the dye during storage and detection and thereby enhancing the signal intensity and stability. Red-27 and C.I.-60 were employed respectively as colorants during the dye process for the purpose of improving coloration efficiency and visual performance. The color latex microspheres thus obtained were ultimately employed for the rapid detection of Monkeypox antigens with good colorimetric responsiveness and high sensitivity. This provided a new material basis for improving the visualization and accuracy of lateral flow immunoassays. The new method has the advantages of easy operation, good stability, and strong adaptability. It has great potential for application in the areas of clinical diagnostics, early disease detection, and rapid testing, and also for textile dyeing, where the color microspheres can function as good colorants.

Supplementary Materials

The following supporting information can be downloaded at: https://www.mdpi.com/article/10.3390/chemosensors13040142/s1, Figure S1: EDS distribution of MPF@SMA-MA porous microspheres; Figure S2: (a) Study on the immunity of different markers on MPF@Red-27@PSMA-LIFA test strip (physical figure at upper left corner); (b) MPF@Red-27@PSMA-LFIA test paper T-wire strength and storage time diagram; (c) Study on immunity of different markers in MPF@C.I-60@PSMA-LFIA test strip; (d) MPF@C.I-60@SMA-MAA-LFIA test paper T-wire strength and storage time diagram; Table S1: Properties of fluorescent materials based on flow measurement immunochromatographic assays [26,29,36,37].

Author Contributions

W.-Z.Z.: Conceptualization, investigation, methodology, data curation, writing—original draft, formal analysis; C.-F.Z.: writing—review and editing, data curation, conceptualization; S.-N.D.: conceptualization, supervision, writing—review and editing, project administration, resources. All authors have read and agreed to the published version of the manuscript.

Funding

This work was supported by the National Natural Science Foundation of China (22174015).

Institutional Review Board Statement

Not applicable.

Informed Consent Statement

Not applicable.

Data Availability Statement

The data that support the findings of this study are available from the corresponding author upon reasonable request.

Conflicts of Interest

The authors declare that they have no known competing financial interests or personal relationships that could have appeared to influence the work reported in this paper.

Abbreviations

The following abbreviations are used in this manuscript:
SMA-MAApolystyrene-maleic anhydride microspheres
C.I.-60Disperse Red 60
Red-27Solvent Red 27
TATannic acid
MPFMetal–polyphenol film

References

  1. Wu, Y.; Xiao, Y.; Ju, Y.; Sun, Y.; He, J.; Liu, T.; He, M.; Wang, K.; Yang, Y. Multi-Mode Sensing Platform for Gallic Acid Determination Based on the Peroxidase-like Activity of Magnetic Fe3O4@Co/Ni/Al-LDH Nanospheres. LWT 2024, 203, 116366. [Google Scholar] [CrossRef]
  2. Xu, J.; Wang, Y.; Li, Z.; Liu, F.; Jing, W. Machine Learning Assisted Multi-Signal Nanozyme Sensor Array for the Antioxidant Phenolic Compounds Intelligent Recognition. Food Chem. 2025, 471, 142826. [Google Scholar] [CrossRef]
  3. Liu, Q.; Gao, Z.; Zhang, X.; Duan, Q.; Zhang, Y.; Midgley, A.C.; Jiao, L.; Liu, R.; Zhu, M.; Kong, D.; et al. Assembly of Genetically Engineered Ionizable Protein Nanocage-Based Nanozymes for Intracellular Superoxide Scavenging. Nat. Commun. 2025, 16, 1123. [Google Scholar] [CrossRef]
  4. Yang, B.; Zhao, J.; Zhang, C.; Guo, S.; Chen, Y.; Wang, Y.; Huang, X.; Zeng, Q. Ultra-High Capacity and Selectivity for Uranium Fixation by Carbon Nanosphere Supported Hydroxyapatite Nanorod Adsorbent. J. Colloid Interface Sci. 2025, 688, 478–489. [Google Scholar] [CrossRef]
  5. Ma, Y.; Remón, J.; Luo, L.; Ding, W.; Jiang, Z.; Shi, B. Natural-Based UV-Shielding Additives to Protect Photosensitive Pesticides: Production of Nanoparticles from the Co-Self-Assembly of Lignin and Tannin. Nano Today 2025, 60, 102550. [Google Scholar] [CrossRef]
  6. Zhang, J.; Zhao, H.; Wang, M.; Fang, K.; Song, Y.; Liu, Q.; Chen, W. Controlled Micro-Scale Ink Droplet Spreading on Cotton Fabrics via Cellulose-Based Coatings for Greener Textile Inkjet Printing. Ind. Crops Prod. 2024, 213, 118488. [Google Scholar] [CrossRef]
  7. Zhang, S.; Fang, K.; Liu, X.; Liu, D.; Qiao, X.; Wang, J.; Sun, F. Enhanced Hydrophobicity and UV Resistance of Cotton Fabrics through the Synergistic Effect of Raspberry-Shaped Colored Nanoparticles and Polymethylhydrosiloxane. Appl. Surf. Sci. 2023, 637, 157849. [Google Scholar] [CrossRef]
  8. Dong, T.; Sun, G.; Yang, Z.; Jiao, Y.; Li, J.; Lin, Z.; Zhang, X.; Bian, Z.; Liu, A. Sensitive Dual-Channel Lateral Flow Immunoassay Tagged with High Brightness Latex Microsphere for Simultaneous Detection of Respiratory Viral Antigens. Chem. Eng. J. 2024, 497, 154826. [Google Scholar] [CrossRef]
  9. Chen, Z.; Lai, K.; Wang, A.; Ji, H.; Yu, S.; Fang, Z.; Liu, D.; Peng, J.; Lai, W. Electron Transfer-Driven Nanozymes Boost Biosensor Sensitivity via a Synergistic Signal Amplification Strategy. ACS Nano 2025, 19, 9282–9291. [Google Scholar] [CrossRef]
  10. Cai, Y.; Dong, T.; Bian, Z.; Liu, H.; Liu, X.; Liu, A. Metal-organic frameworks based fluorescent sensing: Mechanisms and detection applications. Coord. Chem. Rev. 2025, 529, 216470. [Google Scholar] [CrossRef]
  11. Xie, S.; Zhao, S.; Jiang, X.; Zhu, Y.; Liu, J.; Zhang, B.; Zhao, H. Adsorption Plasticizer by Nanosphere Adsorbent of Persimmon Tannin Binding Bovine Serum Protein. Food Chem. 2025, 464, 141653. [Google Scholar] [CrossRef] [PubMed]
  12. Huang, L.; Guan, T.; Su, H.; Zhong, Y.; Cao, F.; Zhang, Y.; Xia, X.; Wang, X.; Bao, N.; Tu, J. Synergistic Interfacial Bonding in Reduced Graphene Oxide Fiber Cathodes Containing Polypyrrole@sulfur Nanospheres for Flexible Energy Storage. Angew. Chem. Int. Ed. 2022, 61, e202212151. [Google Scholar] [CrossRef] [PubMed]
  13. Lin, X.; Ye, S.; Kong, C.; Webb, K.; Yi, C.; Zhang, S.; Zhang, Q.; Fourkas, J.T.; Nie, Z. Polymeric Ligand-Mediated Regioselective Bonding of Plasmonic Nanoplates and Nanospheres. J. Am. Chem. Soc. 2020, 142, 17282–17286. [Google Scholar] [CrossRef]
  14. Tan, L.; He, C.; Chu, X.; Chu, Y.; Ding, Y. Charge-Reversal ZnO-Based Nanospheres for Stimuli-Responsive Release of Multiple Agents towards Synergistic Cancer Therapy. Chem. Eng. J. 2020, 395, 125177. [Google Scholar] [CrossRef]
  15. Fernandes, R.D.V.; Gomes, P.; Zille, A.; Souto, A.P. The Influence of Chemical Reaction Conditions upon Poly(Styrene-methyl Methacrylate-acrylic Acid) Synthesis: Variations in Nanoparticle Size, Colour and Deposition Methods. Color. Technol. 2020, 136, 101–109. [Google Scholar] [CrossRef]
  16. Li, S.; Xiao, Y.; Shan, G.; Jia, L. A New Strategy for Structural Color Fabrics: Transfer of Photonic Crystal Coatings from Slides to Fabrics. Dye. Pigment. 2024, 226, 112119. [Google Scholar] [CrossRef]
  17. Wang, Z.; Zhang, X.; Li, Z.; Wang, G.; Wang, Y.; Li, P.; Yue, X. Facile Fabrication of Eccentric Hollow Molecularly Imprinted Polymers Microspheres via Miniemulsion One-Step Seed Swelling Polymerization. J. Environ. Chem. Eng. 2024, 12, 113405. [Google Scholar] [CrossRef]
  18. Zhao, X.; Cui, Y.; He, Y.; Wang, S.; Wang, J. Synthesis of Multi-Mode Quantum Dots Encoded Molecularly Imprinted Polymers Microspheres and Application in Quantitative Detection for Dopamine. Sens. Actuators B Chem. 2020, 304, 127265. [Google Scholar] [CrossRef]
  19. Du, W.; Wu, P.; Zhao, Z.; Zhang, X. Facile Preparation and Characterization of Temperature-Responsive Hydrophilic Crosslinked Polymer Microspheres by Aqueous Dispersion Polymerization. Eur. Polym. J. 2020, 128, 109610. [Google Scholar] [CrossRef]
  20. Zhan, Y.; Fu, W.; Xing, Y.; Ma, X.; Chen, C. Advances in Versatile Anti-Swelling Polymer Hydrogels. Mater. Sci. Eng. C 2021, 127, 112208. [Google Scholar] [CrossRef]
  21. Chen, H.; Zhan, J.; Man, L.; Deng, H.; Zhou, H.; Hao, L.; Zhou, X. High Foliar Retention Tannic Acid/Fe3+ Functionalized Ti-Pillared Montmorillonite Pesticide Formulation with pH-Responsibility and High UV Stability. Appl. Surf. Sci. 2023, 620, 156838. [Google Scholar] [CrossRef]
  22. Gusain, R.; Kumar, N.; Ray, S.S. Recent Advances in Carbon Nanomaterial-Based Adsorbents for Water Purification. Coord. Chem. Rev. 2020, 405, 213111. [Google Scholar]
  23. Zhang, W.; Roy, S.; Ezati, P.; Yang, D.-P.; Rhim, J.-W. Tannic Acid: A Green Crosslinker for Biopolymer-Based Food Packaging Films. Trends Food Sci. Technol. 2023, 136, 11–23. [Google Scholar] [CrossRef]
  24. Rahim, M.A.; Ejima, H.; Cho, K.L.; Kempe, K.; Müllner, M.; Best, J.P.; Caruso, F. Coordination-Driven Multistep Assembly of Metal–Polyphenol Films and Capsules. Chem. Mater. 2014, 26, 1645–1653. [Google Scholar] [CrossRef]
  25. Adler, H.; Gould, S.; Hine, P.; Snell, L.B.; Wong, W.; Houlihan, C.F.; Osborne, J.C.; Rampling, T.; Beadsworth, M.B.; Duncan, C.J.; et al. Clinical features and management of human monkeypox: A retrospective observational study in the UK. Lancet Infect. Dis. 2022, 22, 1153–1162. [Google Scholar] [CrossRef]
  26. Ye, L.; Lei, X.; Xu, X.; Xu, L.; Kuang, H.; Xu, C. Gold-Based Paper for Antigen Detection of Monkeypox Virus. Analyst 2023, 148, 985–994. [Google Scholar] [CrossRef]
  27. Stefano, J.S.; Silva, L.R.G.E.; Kalinke, C.; Oliveira, P.R.D.; Crapnell, R.D.; Brazaca, L.C.; Bonacin, J.A.; Campuzano, S.; Banks, C.E.; Janegitz, B.C. Human Monkeypox Virus: Detection Methods and Perspectives for Diagnostics. TrAC Trends Anal. Chem. 2023, 167, 117226. [Google Scholar] [CrossRef]
  28. Qu, J.; Zhang, X.; Liu, K.; Li, Y.; Wang, T.; Fang, Z.; Chen, C.; Tan, X.; Lin, Y.; Xu, Q.; et al. A Comparative Evaluation of Three Diagnostic Assays for the Detection of Human Monkeypox. Viruses 2024, 16, 1286. [Google Scholar] [CrossRef]
  29. Guo, J.; Chen, S.; Tian, S.; Liu, K.; Ma, X.; Guo, J. A Sensitive and Quantitative Prognosis of C-Reactive Protein at Picogram Level Using Mesoporous Silica Encapsulated Core-Shell up-Conversion Nanoparticle Based Lateral Flow Strip Assay. Talanta 2021, 230, 122335. [Google Scholar] [CrossRef]
  30. Yan, R.; Zhang, Y.; Wang, X.; Xu, J.; Wang, D.; Zhang, W. Synthesis of Porous Poly(Styrene-Co-Acrylic Acid) Microspheres through One-Step Soap-Free Emulsion Polymerization: Whys and Wherefores. J. Colloid Interface Sci. 2012, 368, 220–225. [Google Scholar] [CrossRef]
  31. Zhou, Z.; Rui, Z.; Feng, Y.-N.; Wang, Q.; Lu, T.-D. Alkali-Assisted Metal-Phenolic Network Assembly for Structural Regulation of Nanofiltration Membranes. J. Membr. Sci. 2025, 720, 123771. [Google Scholar] [CrossRef]
  32. Song, Y.; Fang, K.; Bukhari, M.N.; Zhang, K.; Tang, Z. Improved Inkjet Printability of Dye-Based Inks through Enhancing the Interaction of Dye Molecules and Polymer Nanospheres. J. Mol. Liq. 2021, 324, 114702. [Google Scholar] [CrossRef]
  33. Zheng, Q.; Fang, K.; Song, Y.; Wang, L.; Hao, L.; Ren, Y. Enhanced Interaction of Dye Molecules and Fibers via Bio-Based Acids for Greener Coloration of Silk/Polyamide Fabric. Ind. Crops Prod. 2023, 195, 116418. [Google Scholar] [CrossRef]
  34. Wu, L.; Wang, Y.; Zheng, Q.; Wu, J.; Zhang, H.; Fu, R.; Ren, Y. Color and Functionality Construction of Cellulose Towels with Biological Monascus Pigment Based on a Nano-Suspension System. Int. J. Biol. Macromol. 2024, 282, 137351. [Google Scholar] [CrossRef] [PubMed]
  35. Gong, Y.; Bai, Y.; Zhao, D.; Wang, Q. Aggregation of Carboxyl-Modified Polystyrene Nanoplastics in Water with Aluminum Chloride: Structural Characterization and Theoretical Calculation. Water Res. 2022, 208, 117884. [Google Scholar] [CrossRef] [PubMed]
  36. Wu, R.; Zhou, S.; Chen, T.; Li, J.; Shen, H.; Chai, Y.; Li, L.S. Quantitative and rapid detection of C-reactive protein using quantum dot-based lateral flow test strip. Anal. Chim. Acta 2018, 1008, 1–7. [Google Scholar] [CrossRef]
  37. Yang, X.; Zhang, P.; Xing, X.; Lv, Q.; Jiang, Y.; Jiang, Y.; Wang, Z. Improving the fluorescence intensity of lanthanide-doped microspheres via incorporation of lauryl methacrylate: Synthesis and their application in C-reactive protein detection. Colloids Surf. A: Physicochem. Eng. Asp. 2022, 653, 130065. [Google Scholar] [CrossRef]
Scheme 1. Preparation of SMA-MAA microspheres.
Chemosensors 13 00142 sch001
Figure 1. TEM of (a) initial SMA-MAA microspheres; (b) acid-base treatment microspheres; (c) MPF@SMA-MA porous microspheres; (df) correspond to the particle size distributions of (ac), respectively; (gi) correspond to enlarged TEM of (a), (b), and (c), respectively.
Chemosensors 13 00142 g001
Figure 2. EDS mapping images of MPN@SMA-MAA porous microspheres: (a) C element; (b) O element; (c) N element; (d) Fe element; and (e) all elements.
Chemosensors 13 00142 g002
Figure 3. (a) UV spectroscopy of Red-27 and C.I.-60; (b) physical drawings of dispersed red microspheres and Solvent Red microspheres (dispersed red microspheres on the left and Solvent Red on the right); (c) absorption value of Red-27 and standard curve of dye concentration; and (d) absorption value of C.I.-60 and standard curve of dye concentration (The black dots in (c,d) are data points and the red line is the regression curve corresponding to the data).
Chemosensors 13 00142 g003
Figure 4. TEM of (a) Red-27 porous microsphere; (b) C.I.-60 porous microsphere.
Chemosensors 13 00142 g004
Figure 5. Change of dye content in microspheres with ultrasonic time (ultrasound at room temperature using 300 W power).
Chemosensors 13 00142 g005
Figure 6. Dye content of different microspheres after dyeing.
Chemosensors 13 00142 g006
Figure 7. TEM of (a,b) after Fe3+ was introduced into microspheres; (c,d) after TA was introduced into microspheres.
Chemosensors 13 00142 g007
Figure 8. (a) The relationship between dye content and reaction time of C.I.-60 microspheres; (b) the relationship between TA content and C.I.-60 staining concentration and microsphere dye content; (c) the relationship between dye content and reaction time of Red-27 microspheres; and (d) relationship between Red-27 staining concentration and microsphere dye concentration (the error bar is the result of five repeated tests).
Chemosensors 13 00142 g008
Figure 9. (a) MPF@Red-27@SMA-MAA-LFIA test paper test photos; (b) linear response curve of MPF@Red-27@SMA-MAA-LFIA test paper; (c) MPF@C.I.-60@SMA-MAA-LFIA test paper test photos; and (d) linear response curve of MPF@C.I.-60@SMA-MAA-LFIA test paper (The error bar is the result of five repeated tests. The black dots in (b,d) are data points and the red line is the regression curve corresponding to the data).
Chemosensors 13 00142 g009
Disclaimer/Publisher’s Note: The statements, opinions and data contained in all publications are solely those of the individual author(s) and contributor(s) and not of MDPI and/or the editor(s). MDPI and/or the editor(s) disclaim responsibility for any injury to people or property resulting from any ideas, methods, instructions or products referred to in the content.

