Article

Sensitive Detection of Aflatoxin B1 in Foods Using Aptasensing Based on FGO-Mediated CdTe QDs

by
Puye Liang
,
Sihan Liu
,
Qinqing Han
,
Kaixuan Zhou
,
Tiange Li
,
Xianqing Huang
,
Lianjun Song
* and
Tianlin Wang
*
College of Food Science and Technology, Henan Agricultural University, Zhengzhou 450002, China
*
Authors to whom correspondence should be addressed.
Chemosensors 2025, 13(4), 141; https://doi.org/10.3390/chemosensors13040141
Submission received: 4 March 2025 / Revised: 1 April 2025 / Accepted: 9 April 2025 / Published: 11 April 2025
(This article belongs to the Special Issue Advanced Biosensors for Point-of-Care Testing in Analytical Chemistry)

Abstract

:
Aflatoxin B1 (AFB1) exhibits high toxicity and has the potential to induce cancer, deformities, and mutations. It is therefore highly desirable that sensitive and straightforward methods for detecting AFB1 be developed. In this study, due to the high specific adsorption capacity of AFB1 aptamers, we applied a sensing strategy based on quantum dots (QDs) and carboxyl-functionalized graphene oxide (FGO) to construct a simple fluorescence quenching platform. FGO and CdTe QDs modified with AFB1 aptamers cause a FRET effect that produces CdTe QDs with yellow-green fluorescence quenching. When AFB1 is present, aptamers form complexes with it and CdTe QDs leave the quenching platform, resulting in fluorescence recovery. In this study, we used a fluorescence aptasensor with a wide detection range of 0.05 to 150 ng/mL and a low limit of detection (LOD) of 8.2 pg/mL. The average recoveries of AFB1 in peanut and pure milk samples ranged from 94.5% to 107.0%. The aptasensor also exhibited the advantages of simple operation, low cost, and good stability. The sensing strategy reported here can thus serve as a potential candidate for the rapid detection of AFB1.

1. Introduction

Aflatoxin B1 (AFB1) is a type of harmful substance generated by Aspergillus flavus and Aspergillus parasiticus. It is easy for agricultural products to be contaminated by AFB1 [1,2], which has been closely associated with immunosuppression, kidney disease, and even cancer [3,4,5,6]; indeed, AFB1 is recognized by the International Organization for Cancer as a Class I carcinogen. Contamination of food by AFB1 is now a major global issue, and the development of effective and user-friendly AFB1 detection strategies is now highly anticipated.
Today, HPLC, TLC, and LC-MS are the most widely used conventional AFB1 detection methods [7,8,9]. These approaches have advantages in terms of detection sensitivity and accuracy. However, their application in rapid detection is constrained by several limitations; these include cumbersome measurement procedures, high costs, and the unsuitability of such methods for screening large samples. In recent years, immunological methods have been developed for the simple and rapid detection of AFB1, primarily including electrochemical immunoassay, ELISA, and antigen microarray [10,11,12]. However, the high cost of antibodies used in immunological methods is a concern that cannot be overlooked. Compared with antibodies, aptamers are easier and cheaper to produce [13]. Consequently, aptamers are now widely used as excellent candidates for the detection of AFB1. Yao et al. employed a high-efficiency magnetic chain graphene oxide-based SELEX to generate circular aptamers that bind AFB1 with high affinity and selectivity [14]. Sun et al. reported an AFB1 detection method based on a real-time quantitative polymerase chain reaction (PCR) with a detection limit of 0.03 pg/mL [15]. Undoubtedly, this technology delivers ultra-high sensitivity, yet its potential is greatly hindered by the requirement for sophisticated real-time PCR instruments and various complex PCR reagents. There is, therefore, an urgent need for the development of aptamer-based strategies that enable the simple and rapid monitoring of AFB1 in foods.
With continuous progress in nanotechnology, fluorescent nanomaterials are now widely applied in sectors such as biosensing, bioimaging, and drug delivery, owing to their small size, their high specific surface areas, and their versatile functional characteristics [16,17,18,19,20]. In addition, some recognition elements such as aptamers can be easily modified on the surfaces of nanomaterials, enabling the construction of fluorescent probes that specifically recognize target molecules [21]. Fluorescent quantum dots (QDs), as a typical representative of fluorescent nanomaterials, possess a range of remarkable advantages, including narrow and symmetrical fluorescence emission peaks, large Stokes shifts, excellent photostability, and good water solubility. QDs therefore play an important role in rapid visual detection [22,23,24]. In addition, graphene oxide (GO) is known as a quenching agent with broad-spectrum absorption. GO delivers excellent fluorescence quenching performance in detection fields, assisted by the fluorescence resonance energy transfer (FRET) effect [25,26]. GO is therefore well suited for use in the construction of an aptamer-based fluorescence response system.
In this study, we sought to construct an aptasensor with enhanced biocompatibility, tailored to suit the intricate detection environments found in food. A GO surface was modified with carboxyl functional groups (FGO) to increase its water solubility. In addition, an aptasensor was prepared for the detection of AFB1 based on FRET between FGO and CdTe QDs modified with the AFB1 aptamer. An aptamer with specificity for AFB1 was first coupled with yellow-green CdTe QDs. Upon exposure to AFB1, the fluorescence of CdTe QDs was quenched because of the interaction of the aptamer with FGO. After the recognition of the AFB1, the strong binding between AFB1 and its aptamer increased the distance between the quantum dots and FGO, thereby blocking the FRET effect. Finally, the fluorescence intensity of CdTe QDs was found to be positively correlated with AFB1 concentrations.

2. Materials and Methods

2.1. Reagents

Aptamer (5′–NH2–(CH2)6–CACGTGTTGTCTCTCTCTGTGTCTCGTG–3′) was synthesized by Shanghai Shenggong Biotechnology Co., Ltd. AFB1, aflatoxin M1 (AFM1), fumonisin B1 (FB1), zearalenone (ZEN), patamycin (PAT), and deoxynivalenol (DON) were purchased from Aladdin Co. Ltd. (Shanghai, China). All other chemicals used in the study were analytical grade. Aqueous solutions were obtained from ultrapure water (18.2 MΩ·cm).

2.2. Instruments

Raman spectra were obtained using a DXR2xi Raman imaging microscope system (Thermo, Waltham, MA, USA). Fourier-transform infrared (FTIR) spectra were recorded on a TENSOR 27 FT-IR spectrometer (Bruker, Karlsruher, Germany). Morphology was observed using a JEM-2100 Pro transmission electron microscope (JEOL, Amagasaki, Japan). Fluorescence spectra were recorded using a LUMINA fluorescence spectrometer (Thermo, Waltham, MA, USA). UV absorption spectra were measured using a UV-2600 spectrophotometer (Shimadzu, Tokyo, Japan).

2.3. Experimental Procedures

2.3.1. Preparation of GO and FGO

GO and FGO were prepared according to our previous study [27]. A 2 g amount of graphite powder and a 2 g amount of NaNO3 were dissolved in 80 mL of H2SO4 (98%) and stirred vigorously at 1500 rpm for 20 min to obtain a uniform dispersion in an ice bath. Next, 12 g of KMnO4 was slowly added to the mixture. The mixture was then continuously stirred at 40 °C for 2 h to obtain a dark green solution. Next, 80 mL of deionized water was added. The mixture was then heated up to 90 °C and stirred for another 1 h. The unreacted KMnO4 was removed using H2O2 (30%). By repeating the centrifugation and filtration process, the sediment was washed with HCl (5%) and deionized water several times, then dried at 60 °C for 24 h to obtain GO. To obtain FGO, GO was dispersed in deionized water until a final concentration of 1 mg/mL was obtained. Then, 1.5 g of NaOH and 1 g of chloroacetic acid were added to the GO solution and continuously stirred for 2 h. After centrifugation, the FGO was obtained after drying at 60 °C for 24 h.

2.3.2. Preparation of CdTe QDs

On the basis of previous research, with some minor modifications [28], 2 g of trisodium citrate, 0.5 g of cadmium chloride (CdCl2), 0.5 g of mercaptosuccinic acid, 0.35 g of sodium tellurite (Na2TeO3), and 0.1 g of sodium borohydride (NaBH4) were dispersed in 100 mL of deionized water. After stirring for 30 min, the mixture was transferred to a stainless-steel autoclave and heated at 160 °C for 6 h. The cooled solution was centrifuged at 12,000 rpm for 15 min and filtered using a 0.22 μm filter. Finally, the CdTe QDs were obtained after freeze-drying under vacuum.

2.3.3. Ligation of CdTe QDs with AFB1 Aptamer

A 5 mL amount of 1.0 mg/mL CdTe QDs solution was added to the mixture containing EDC (5 mL, 0.02 M) and NHS (5 mL, 0.2 M) and treated with ultrasound for 2 h. Then, 5 mL of 1.6 μM AFB1 aptamer was added to the above mixed solution and incubated at 4 °C for 24 h. The CdTe-Apt QDs were collected after centrifugation at 12,000 rpm for 15 min. The CdTe-Apt QDs were suspended in phosphate-buffer solution (0.01 M, pH 7.4) for AFB1 detection.

2.4. CdTe-Apt/FGO Aptasensing System for Detection of AFB1

FGO and CdTe-Apt QDs were added to phosphate-buffer solution (PBS, 0.01 M, pH 7.4) until the final concentrations were 0.1 mg/mL and 0.6 mg/mL, respectively. The CdTe-Apt/FGO aptasensing system was obtained after shaking for 2 min. Next, AFB1 standards of different concentrations (0.02 ng/mL, 0.05 ng/mL, 0.1 ng/mL, 0.5 ng/mL, 1 ng/mL, 5 ng/mL, 10 ng/mL, 50 ng/mL, 100 ng/Ml, 150 ng/mL, 200 ng/mL, and 250 ng/mL) were added to the aptasensing system. The fluorescence spectra were recorded to evaluate the fluorescence recovery ability of the developed aptasensor in the presence of AFB1.

2.5. Specificity and Anti-Interference Ability

The prepared aptasensor was used to detect the samples with interference toxins (FB1, ZEN, DON, and PAT) and AFB1. The concentrations of interference toxins were 5 times higher than the concentration of AFB1. Changes in the fluorescence signal response caused by AFB1 and interference toxins were studied to evaluate the anti-interference ability.

2.6. Detection of AFB1 in Real Samples

Pure milk and peanut powder were purchased from a local supermarket for use as actual samples. A 2 mL amount of pure milk and a 1 g amount of peanut powder were each dispersed in 50 mL of methanol–water (7:3, v/v). After 10 min of ultrasound treatment, the standard AFB1 solution (0 ng/mL, 0.1 ng/mL, 1.0 ng/mL, and 10 ng/mL) was added to the samples and continuously stirred for 30 min. The supernatant was first collected after centrifugation at 12,000 rpm for 15 min and then filtered using a 0.22 μm organic filter membrane. The treated samples were then subjected to evaluation by the aptasensor and HPLC.

3. Results

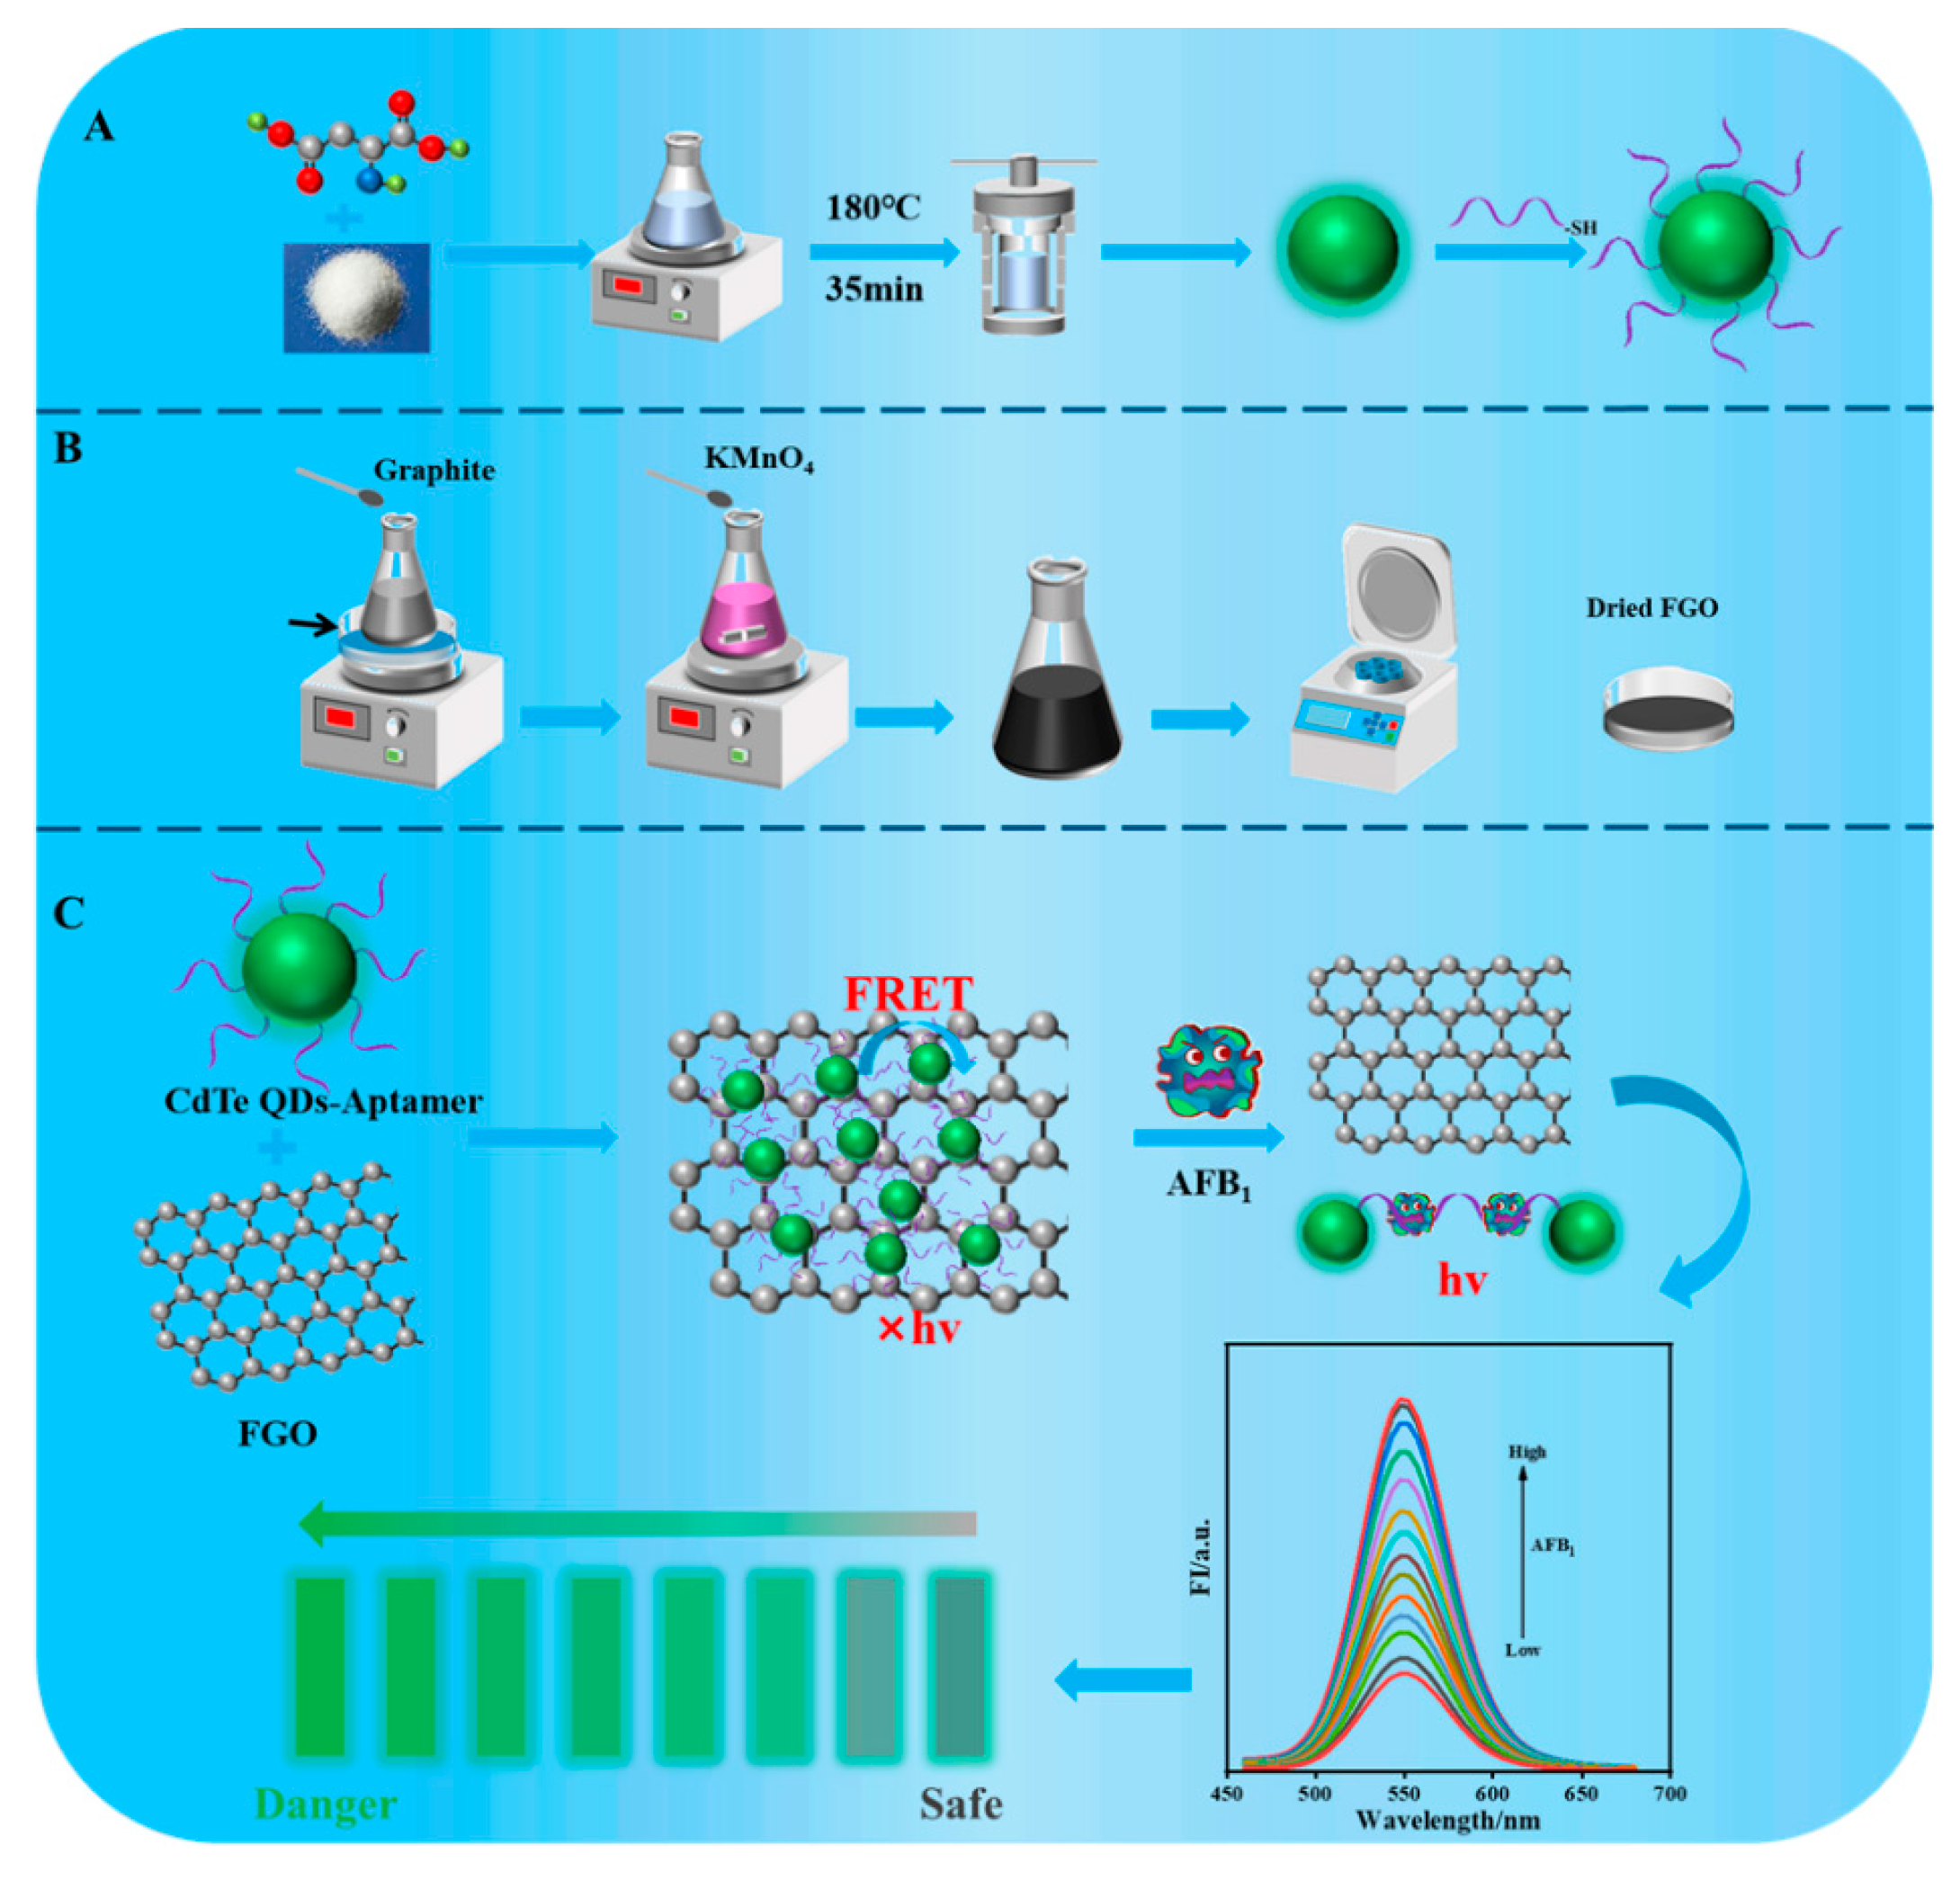
3.1. Construction of CdTe-Apt/FGO Fluorescent Aptasensor

CdTe QDs were obtained using a one-pot hydrothermal method (Scheme 1A). The synthesis processes used for GO and FGO were based on graphene as a precursor and KMnO4 as an oxidant (Scheme 1B). The principle of an aptasensing system based on CdTe-Apt/FGO is that CdTe QDs fluorescence quenching is caused by strong absorption through noncovalent π-π stacking interaction at the interface between the aptamer modified on CdTe QDs and the FGO layer [29] (Scheme 1C). Because complexes of CdTe-Apt/FGO are in a ground state, CdTe QDs may achieve fluorescence quenching mainly through FRET [30,31]. We found that, upon exposure to AFB1, a stronger combination occurred between AFB1 and its aptamer, weakening the interaction between the aptamer and FGO and hindering the FRET effect. The fluorescence of CdTe QDs was restored as the AFB1 concentration increased. The aptasensor demonstrated significant advantages in terms of speed, sensitivity, and selectivity. Moreover, it provided a new theoretical reference for the visualization and rapid detection of AFB1 in actual samples.

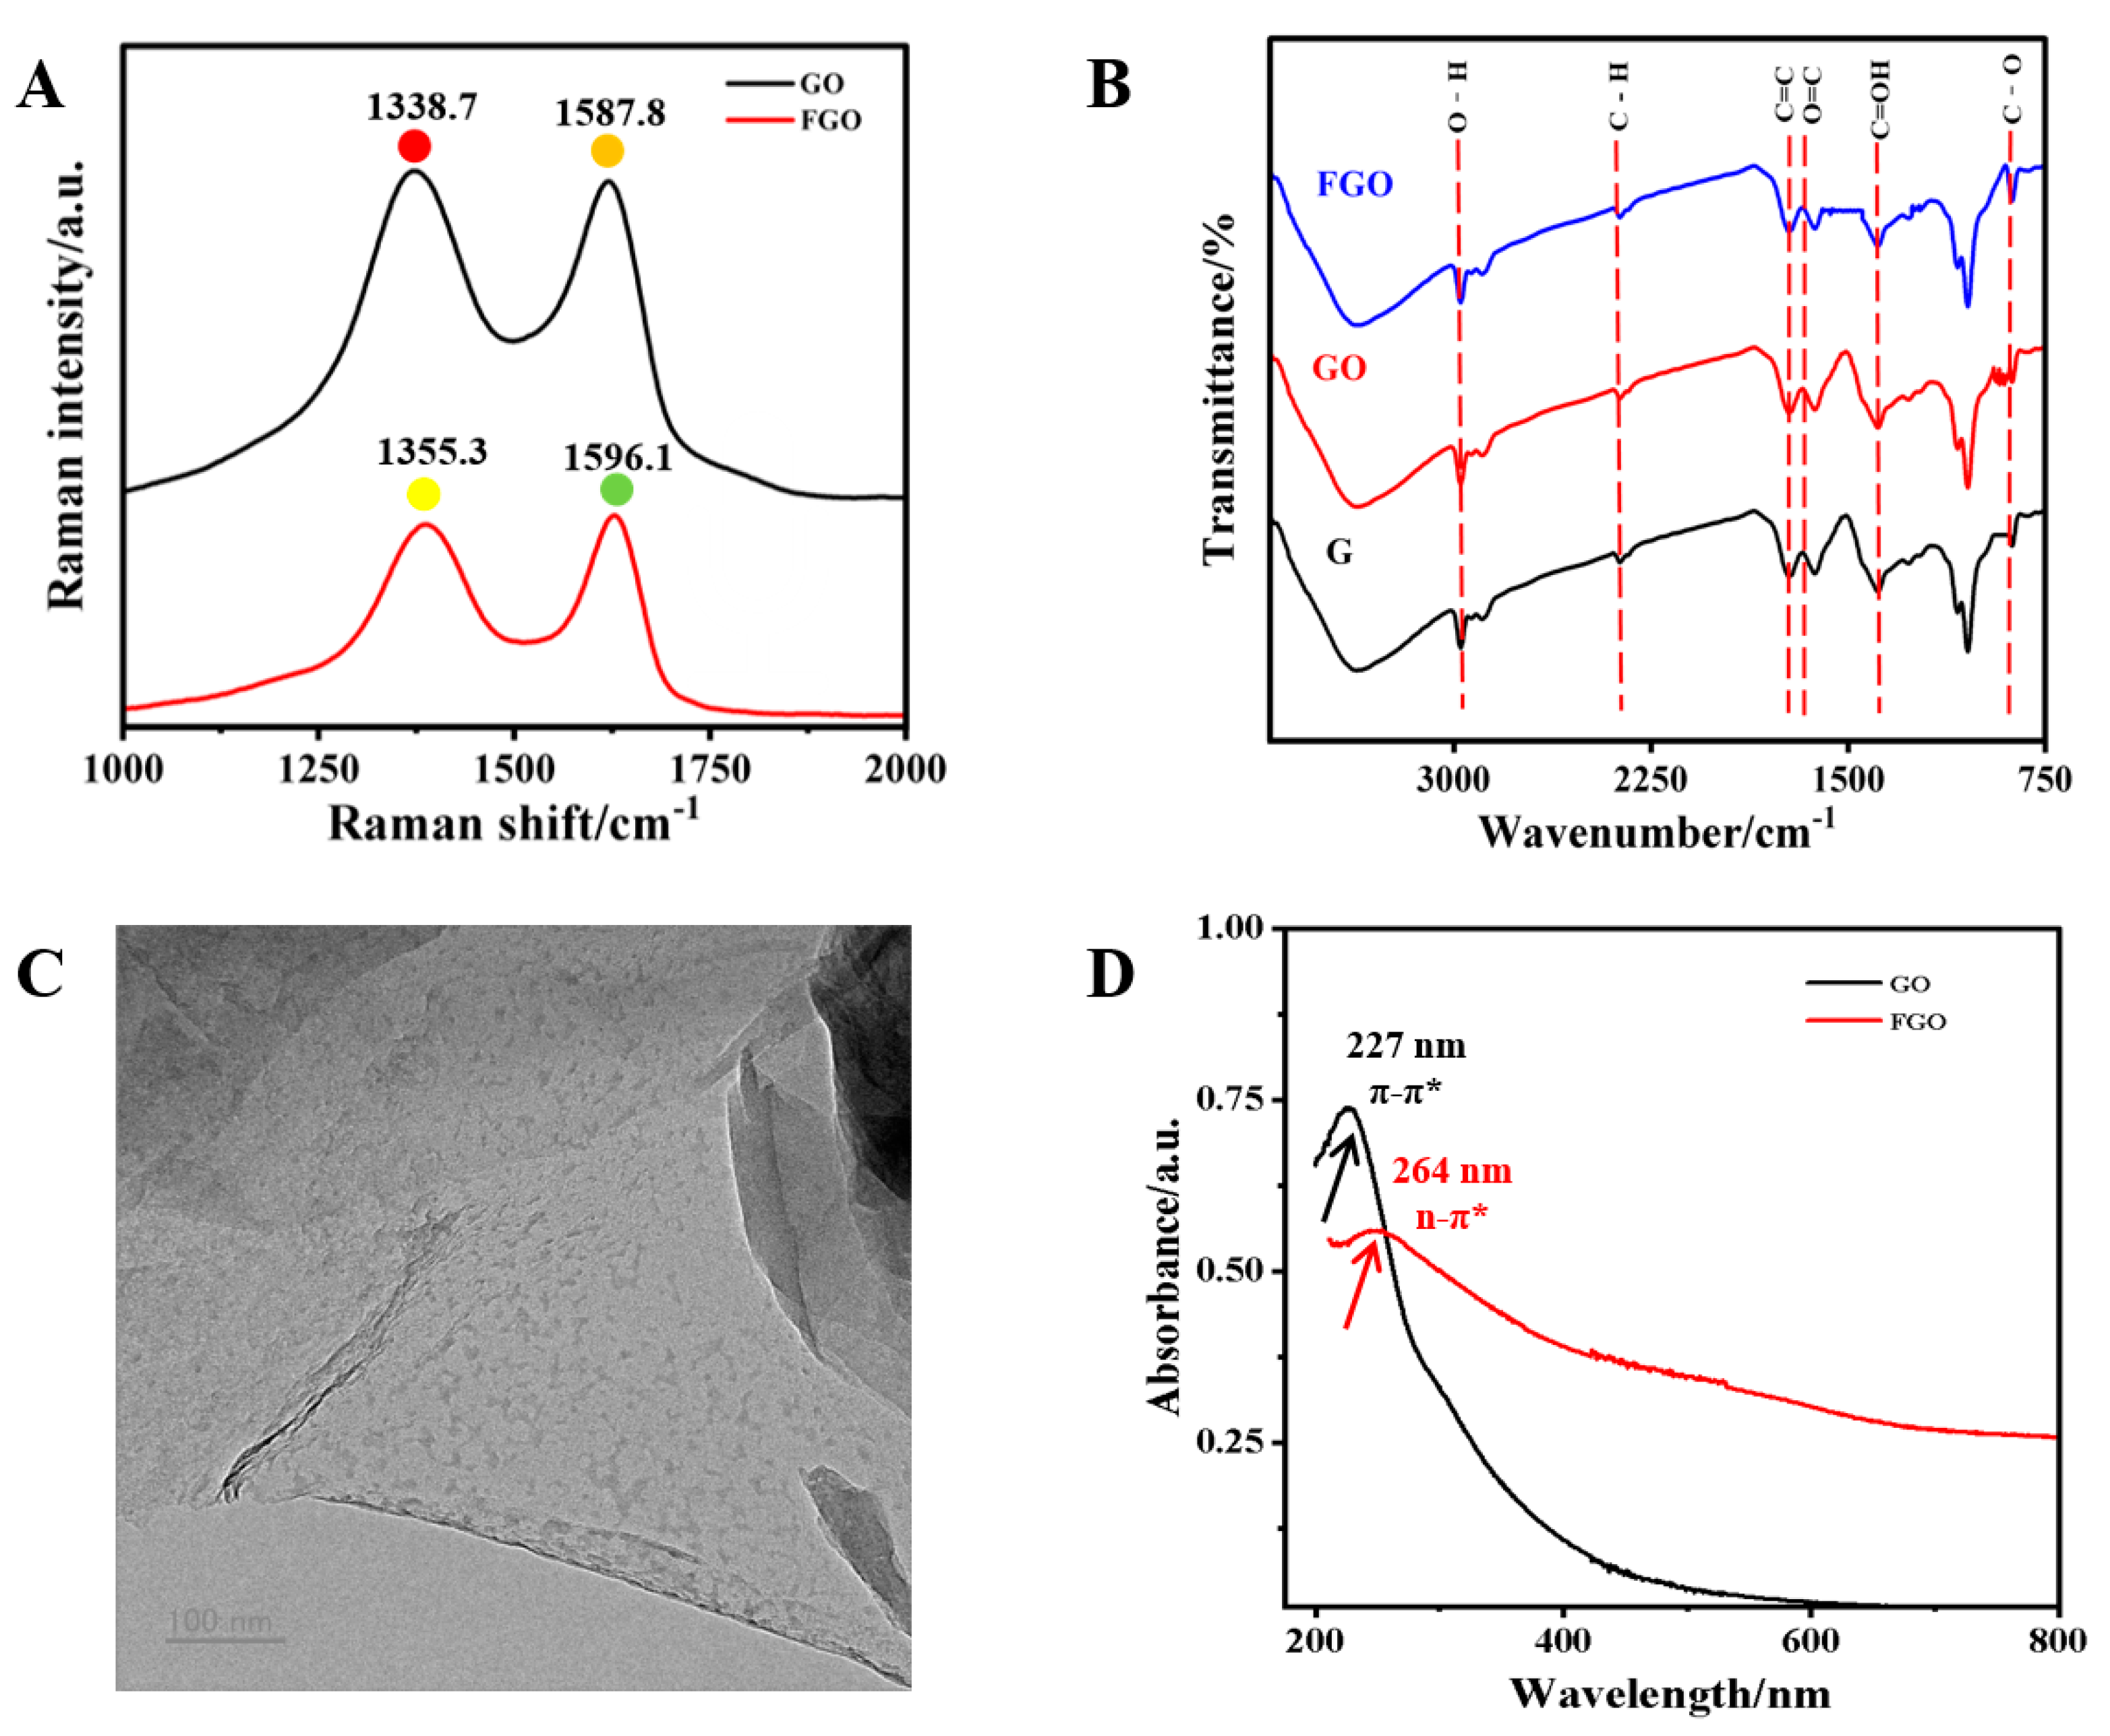
3.2. Characterization of FGO and CdTe QDs

Raman spectrum analysis clearly determined the proportion of graphite carbon in FGO. The Raman spectra of GO and FGO were both measured (Figure 1A). The vibration of graphite carbon induced a characteristic peak in the G band at around ~1596 cm−1, while the vibration of disordered/oxidized carbon caused a distinct characteristic peak in the D band at around ~1355 cm-1 [32,33]. The ID/IG ratios of GO and FGO were obtained using G/D-band calculation. A higher ID/IG value in FGO indicated that carboxylation increased the carbon content of sidewall defects or edges. In the FT-IR spectra of GO (Figure 1B), hydroxyl stretching caused a strong peak at around 3429 cm−1. The asymmetric and symmetric stretching vibrations of C–H bonds caused two characteristic peaks to appear at 2920 and 2850 cm−1. The peaks at 1622 cm−1, 1373 cm−1, and 992 cm−1 were attributed to the stretching vibrations of the C=O band, the C–OH and C–O bonds, and the C–O bond, respectively. In addition, the peak at 1728 cm−1 belonged to the C=C bond of the Sp2 hybrid [34]. The FT-IR spectrum of FGO revealed that, in addition to containing functional groups similar to those of GO, it was also functionalized with oxygen-containing groups. As illustrated in Figure 1C, FGO displayed a distinct two-dimensional sheet-like structure. Its larger specific surface area facilitated the better adsorption of small molecules [35]. UV absorption spectra are displayed in Figure 1D. Based on the π → π* conjugated transition effect of aromatic C=C bonds, an absorption peak at around 227 nm belonged to GO. However, due to the abundant carboxyl functional groups in FGO, its peak position redshifted to 264 nm. Additionally, FGO displayed a broad absorption band from 200 nm to 800 nm, demonstrating its excellent quenching ability.
The morphologies of CdTe QDs were observed using TEM, which revealed simple, monodispersive, near-spherical shapes with a particle size distribution of 2–3 nm (Figure 2A,B). CdTe QDs exhibited narrow and sharp emission spectrum with a peak at 550 nm and emitted bright green fluorescence under excitation at 300 nm (Figure 2C). The transparent homogeneous solution of CdTe QDs was stable after 3 months, with no precipitation being evident. To confirm that CdTe-Apt had been successfully obtained, the fluorescence spectra, FTIR spectra, and zeta potentials of CdTe QDs and CdTe-Apt QDs were measured. Due to the existence of phosphate groups in the aptamer, the spectrum of CdTe-Apt QDs exhibited a slight red shift; however, this had minimal impact on fluorescence characteristics (Figure 2D). These results were obtained with reference to our previous study [36]. CdTe QDs and CdTe-Apt had 3412 cm−1 O–H and 2864 cm−1 C–H stretching vibrations; this was judged to be responsible for the increase in carboxyl content on the synthesized CdTe-Apt surface (Figure 2E). In addition, the stretching vibration peaks of –NH, C–N, C=O, and N–C=O also appeared at 3065, 1654, 1568, and 1075 cm−1, respectively, of CdTe-Apt, indicating that the –NH2 of the aptamer reacted with the –COOH of the CdTe QDs. As can be seen from Figure 2F, the CdTe-Apt had a higher potential, further indicating that aptamer and CdTe QDs can be coupled through electrostatic interaction.

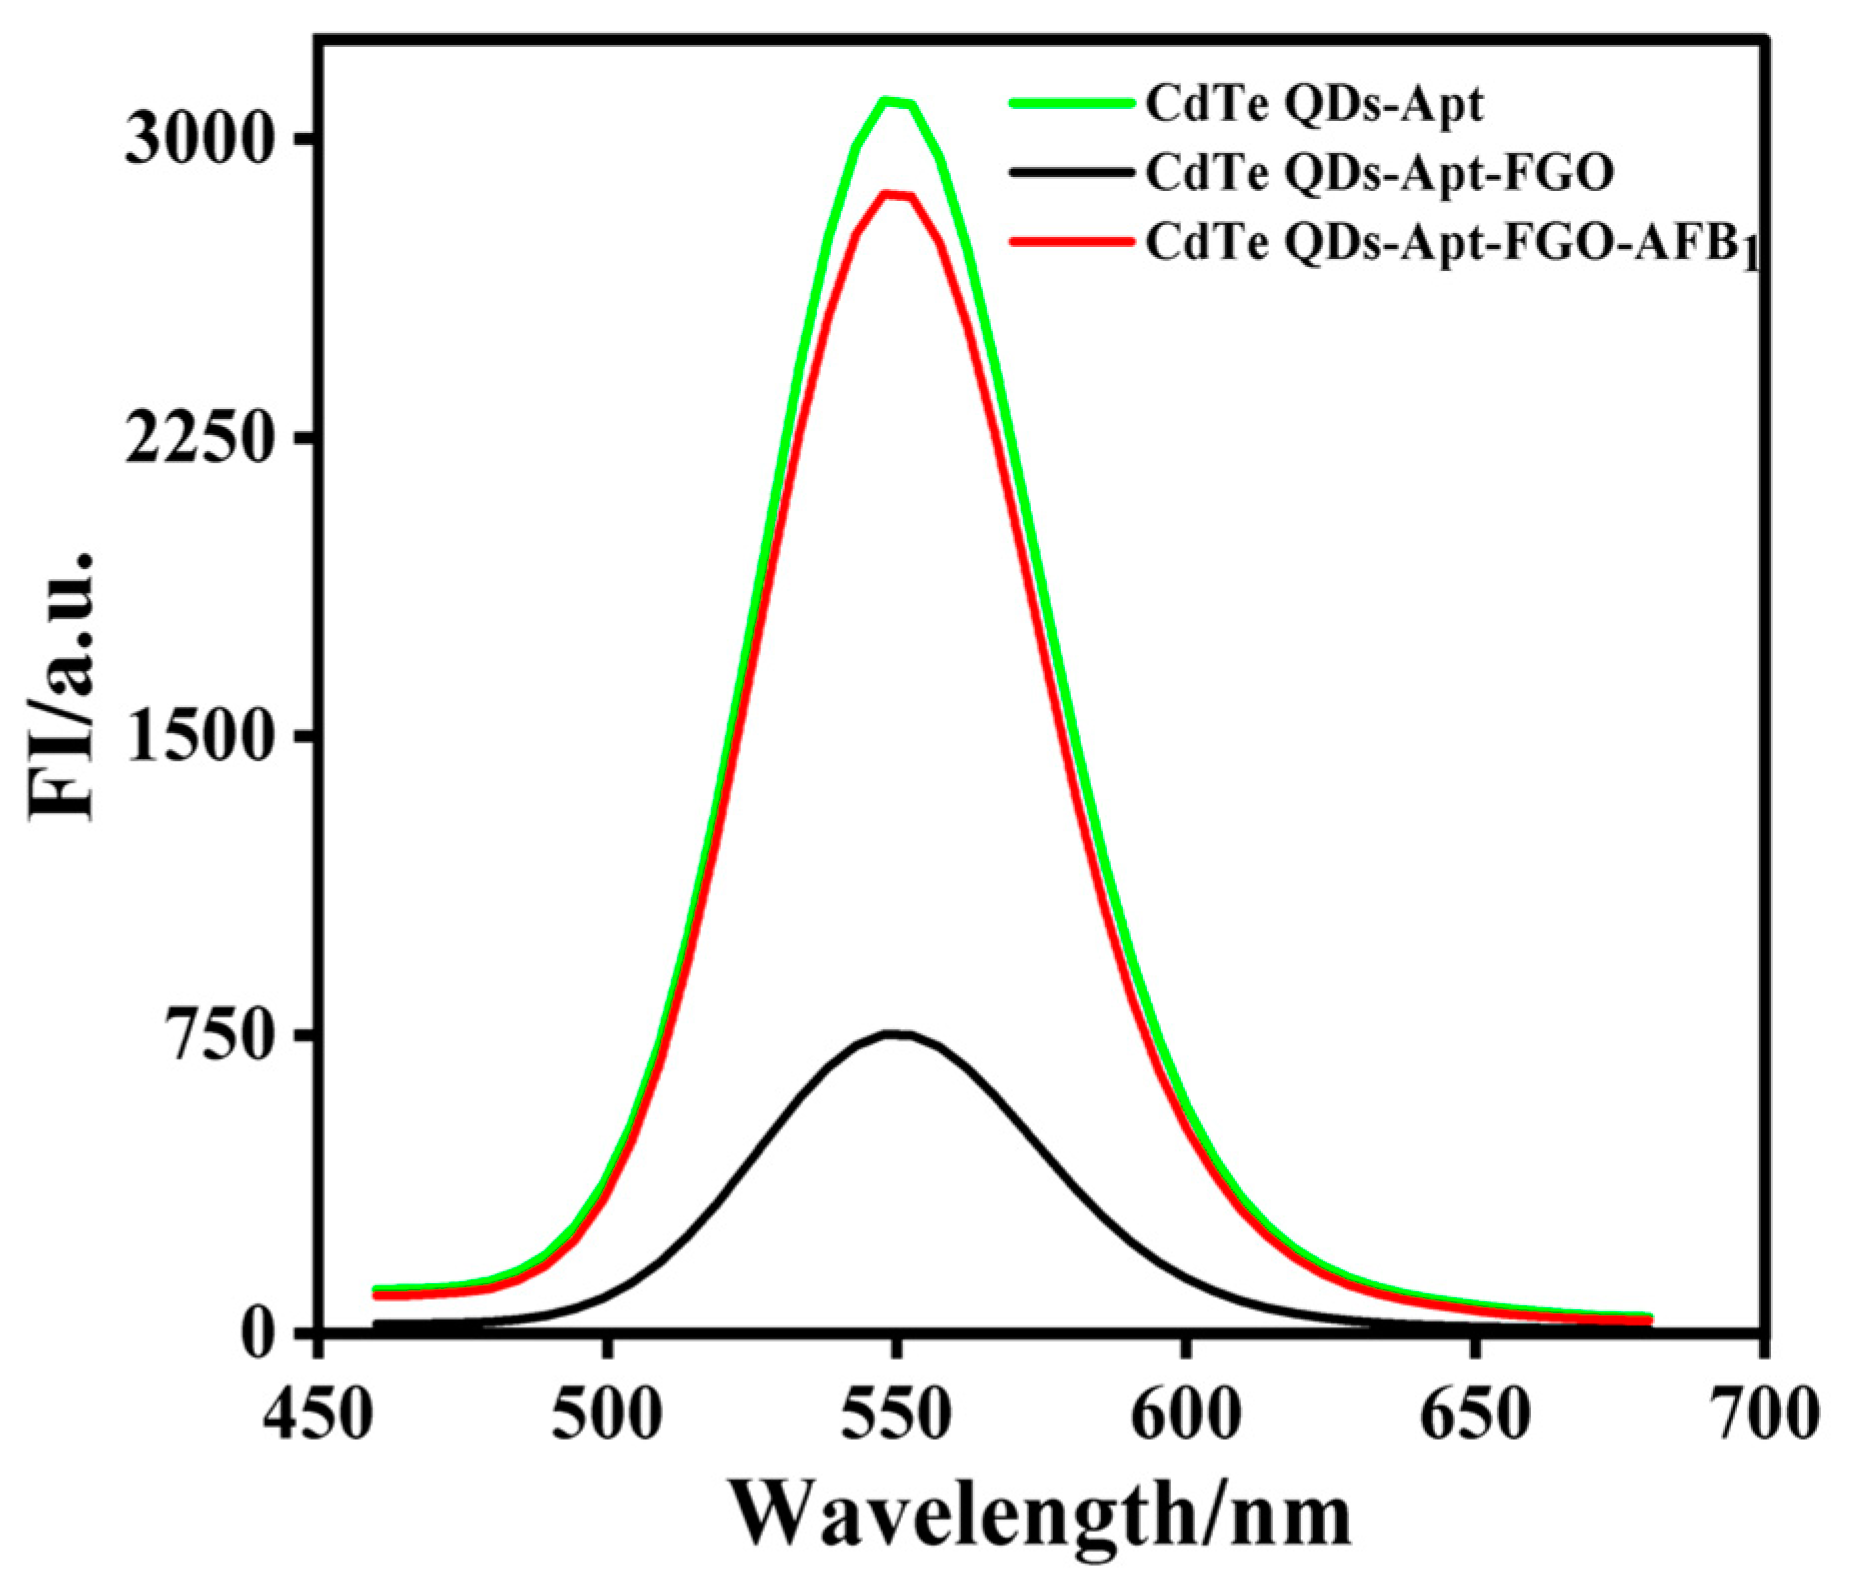
3.3. Feasibility Assessment of FGO/CdTe-Apt Aptasensor for AFB1 Detection

The results of a feasibility assessment for the aptasensor detection of AFB1 are shown in Figure 3. When there was no AFB1 in the reaction system, the fluorescence signal of CdTe-Apt was as high as 3095 (a.u.) (green line). However, the addition of FGO significantly reduced its fluorescence intensity (black line) due to the π-π stacking interaction of FGO with aptamer modified on CdTe QDs, which led to the formation of complexes in the ground state and also to the FRET effect, resulting in the lower fluorescence signal value measured by CdTe QDs fluorescence quenching. After the addition of AFB1, the fluorescence value (red line) quickly increased to 2764 (a.u.), indicating that the AFB1 aptamer could specifically bind to AFB1, thus weakening the interaction between the aptamer and FGO, and recovering the fluorescence of CdTe QDs. Therefore, the fluorescence signal was high. The above results show that the aptasensor constructed for the present study can be used to successfully detect AFB1.

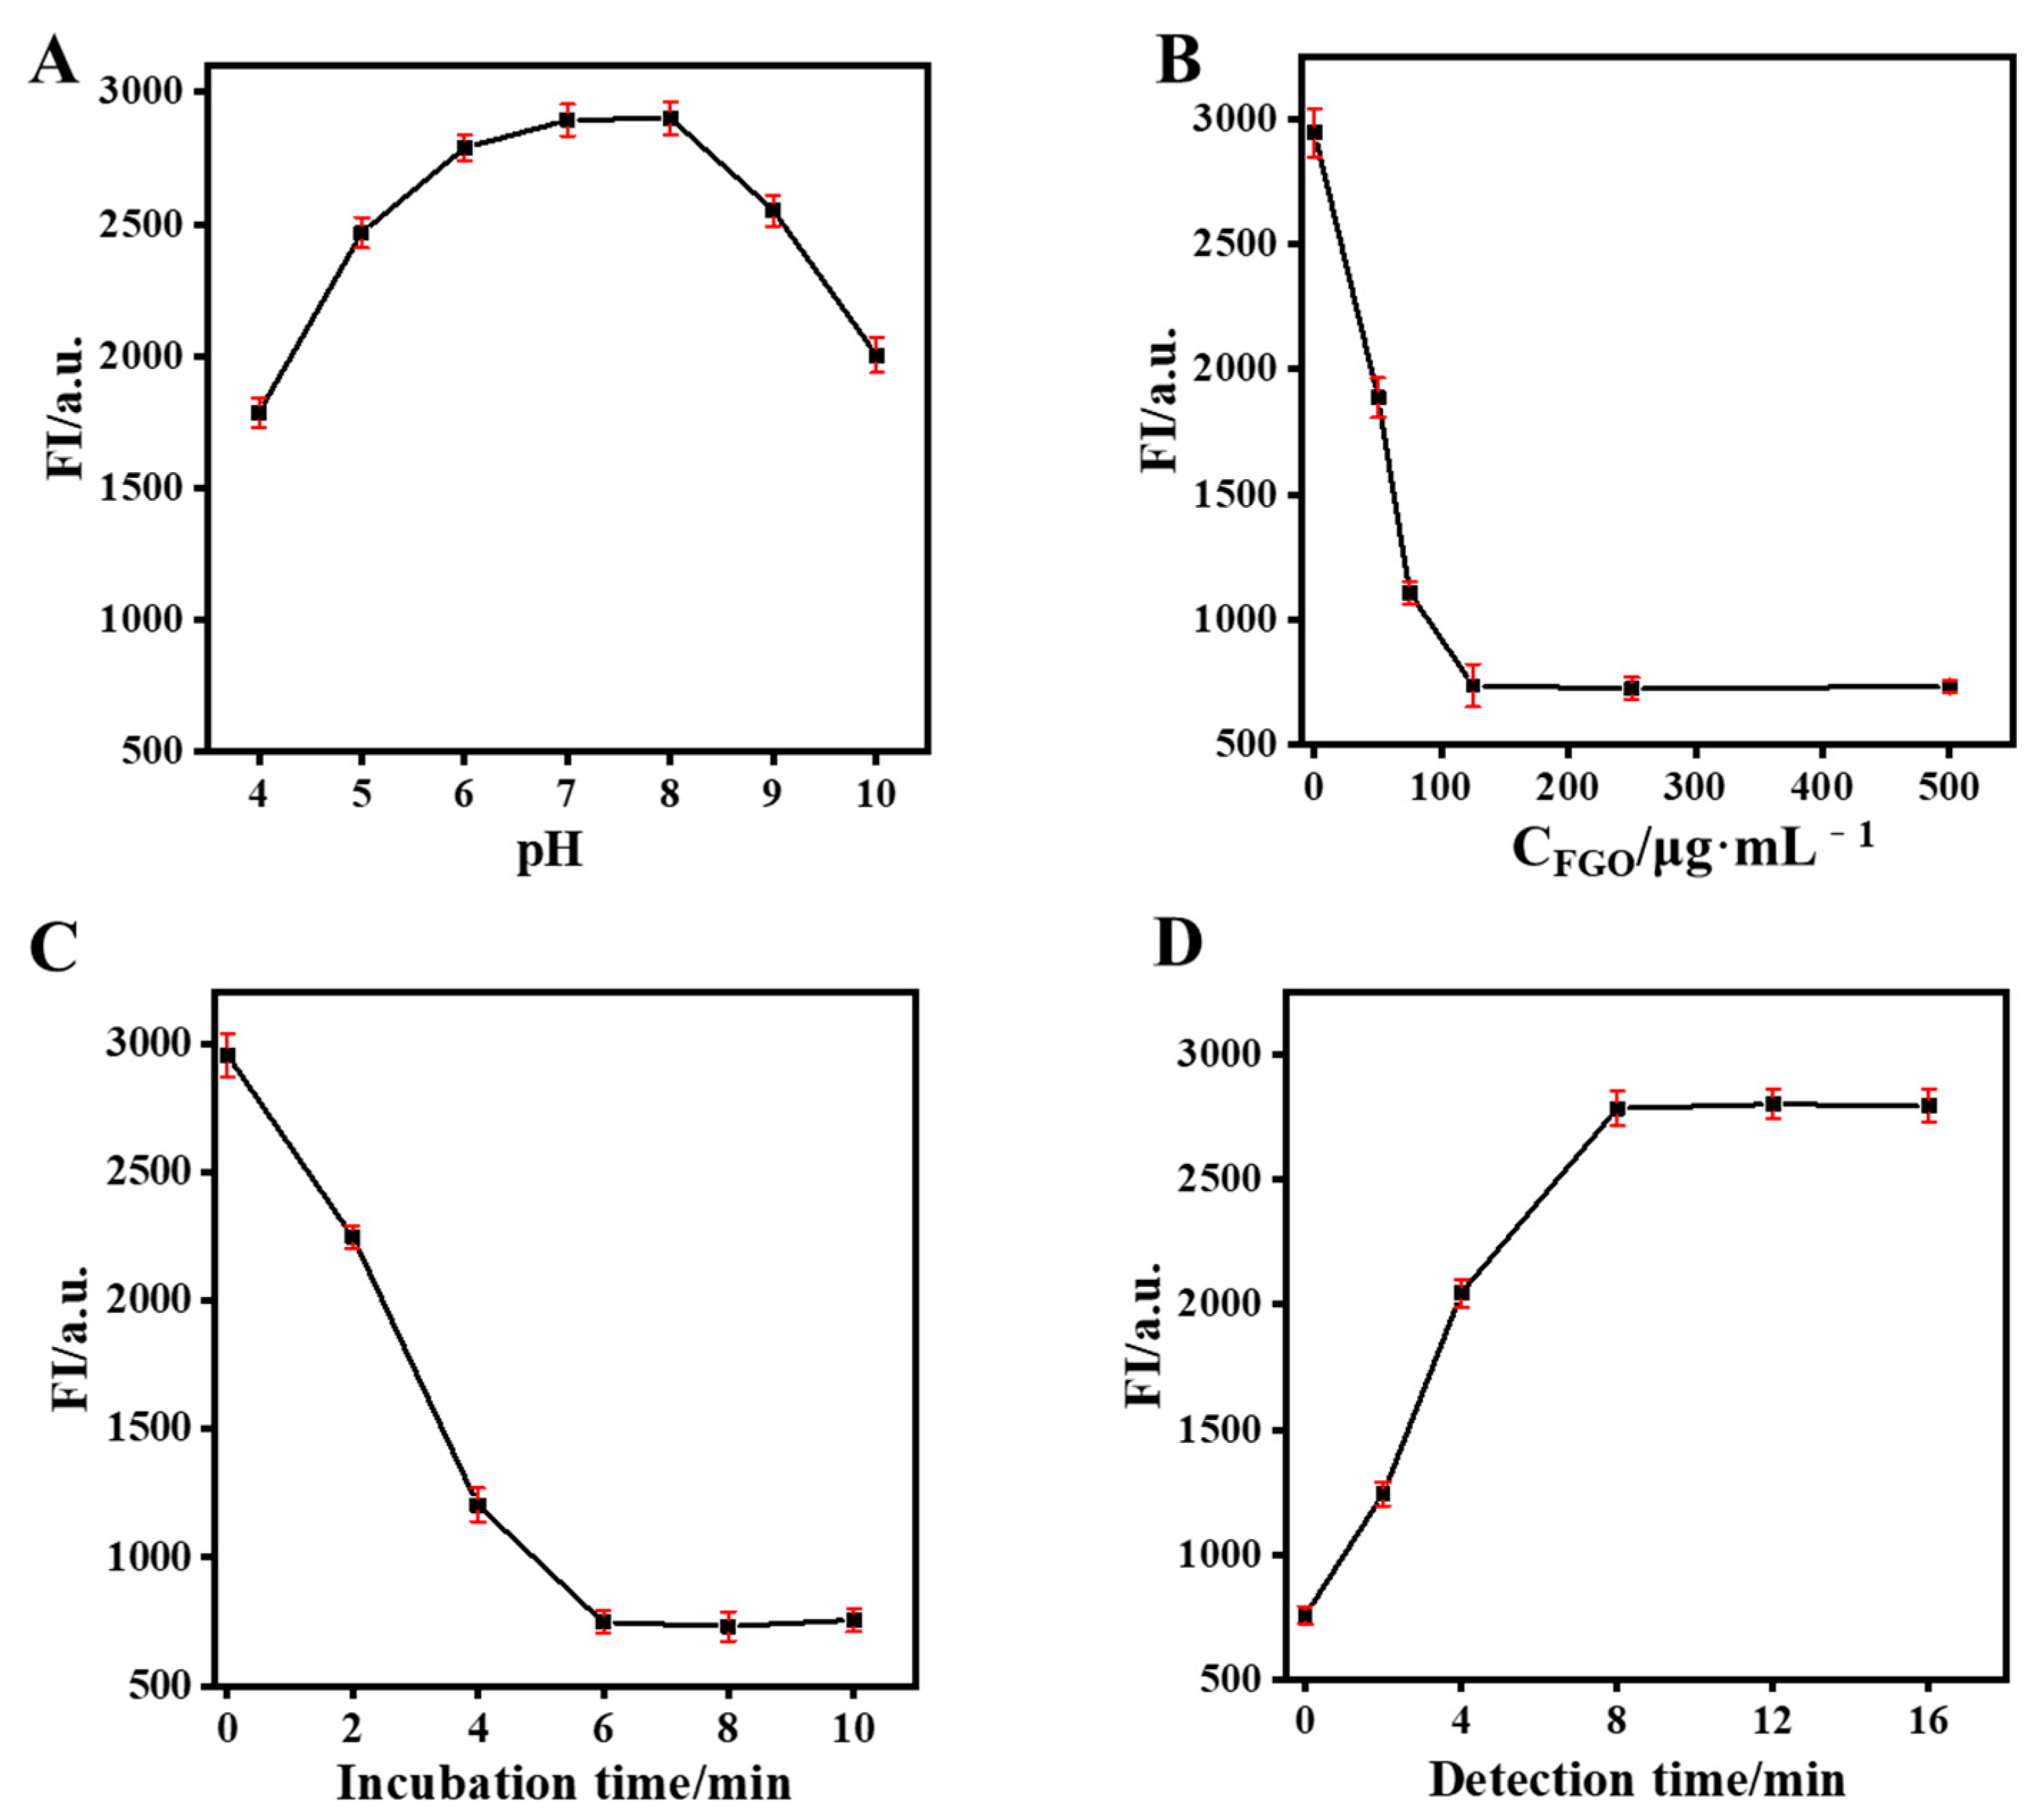
3.4. Optimization Conditions of Aptasensing System

To obtain accurate detection results, relevant variables such as solution pH, incubation time, FGO concentration, and detection time were optimized. As can be seen in Figure 4A, CdTe-Apt fluorescence was affected by solution pH. Its fluorescence was relatively stable at pH values of 7–8 in the solution. The fluorescence attenuation of CdTe-Apt was attributed to the protonation of surface-bound carboxyl groups in acidic media or the protonation of hydroxide ions in alkaline media, leading to the destruction of the protective layer on the quantum dots [37]. PBS with pH 7.4 was selected because fluorescence attenuation of CdTe QDs was positively correlated with FGO content. As can be seen in Figure 4B, the fluorescence quenching ability of CdTe QDs was improved with FGO concentrations of up to 125 μg/mL. A 125 μg/mL concentration of FGO was therefore selected. To achieve the best FRET process, incubation times between FGO and CdTe-Apt were explored. CdTe-Apt fluorescence was almost completely quenched at 6 min (Figure 4C). After the addition of AFB1, its fluorescence returned to the maximum value after 8 min. Hence, the detection time was determined to be 8 min.

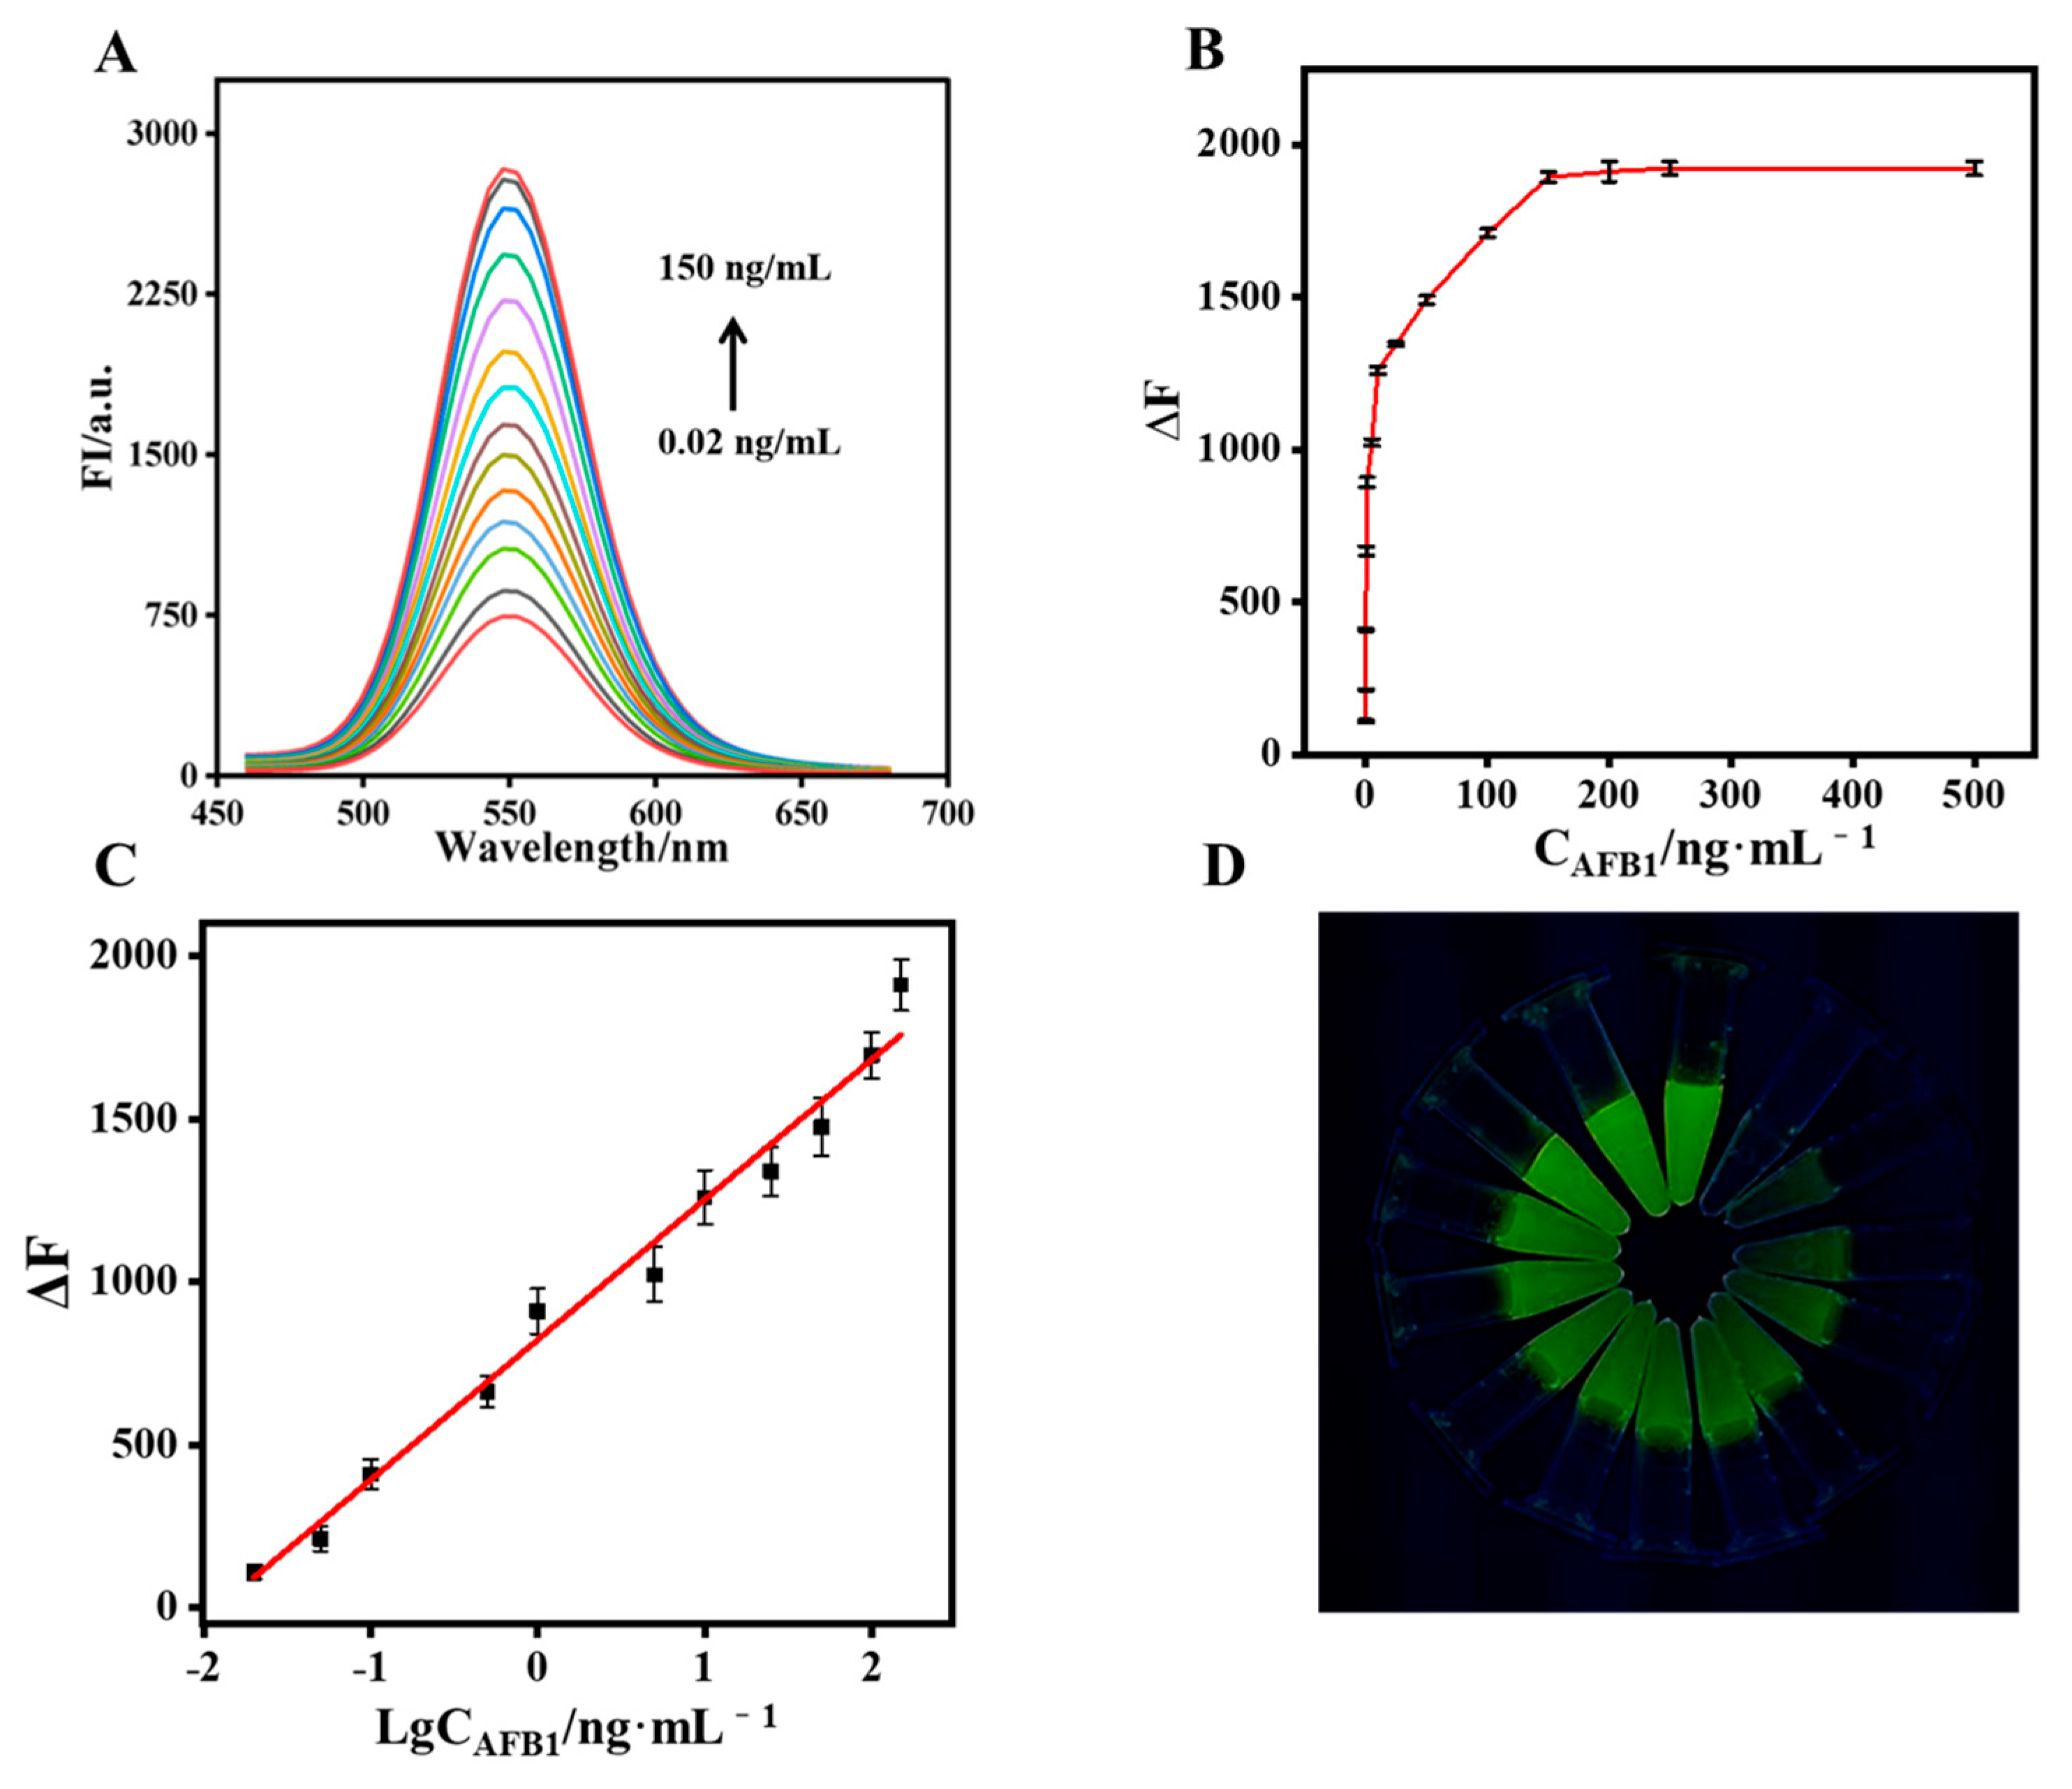
3.5. Performance of the Aptasensing System in AFB1 Detection

The performance of the CdTe-Apt/FGO aptasensor in detecting AFB1 was studied. In the optimal aptasensing system, the fluorescence intensity of CdTe-Apt returned to its highest value when the concentration of AFB1 reached 150 ng/mL (Figure 5A,B). Values of ΔF (fluorescence response before and after the addition of AFB1 into the aptasensor) and concentrations of AFB1 in a range of 0.02–150 ng/mL exhibited a good linear relationship (Figure 5C). The equation was y = 430.2 logCAFB1 + 822.3 with a regression coefficient (R2) of 0.992, and the limit of detection (LOD) was 8.2 pg/mL. In addition, the green fluorescence of CdTe-Apt/FGO was observed to gradually increase under a UV lamp (Figure 5D). Table 1 summarizes recently reported methods for detecting AFB1 based on aptasensors. The CdTe-Apt/FGO aptasensor was easy to obtain and operate, and it exhibited a great advantage with respect to LOD.

3.6. Selectivity and Stability of the Aptasensor

To verify the specificity of the aptasensor, fluorescence responses of CdTe-Apt/FGO in the presence of possible interferents, including AFM1, FB1, ZEN, DON, and PAT, were studied (Figure 6A). The selectivity of the aptasensor was evaluated by comparing the effects of different interfering substances on its fluorescence under the same detection conditions. The interferents barely affected the fluorescence of the aptasensor, even at concentrations five times higher than that of AFB1. In addition, the fluorescence responses of the aptasensor were similar to those of AFB1 alone and the mixed components of AFB1 and interferents. This was due to the high affinity of the AFB1 aptamer with AFB1. The results indicated that the aptasensor had excellent selectivity for AFB1 detection. The stability of the aptasensor was also evaluated. In Figure 6B, the aptasensor prepared in the same batch was stored at 4 °C and tested for AFB1 every 5 days. It can be seen that the aptasensor still responded well after 25 days of storage.
Pure milk and peanut powder were brought from a local supermarket for use as actual samples. The actual detection capability of the aptasensor was evaluated based on the standard addition method by adding AFB1 into the treatment samples. The recovery rates of AFB1 (0, 0.1, 1, and 10 ng/mL) after adding peanut or pure milk ranged from 94.5 to 107.0%, with the relative standard deviation (RSD) being less than 4.9%. These results were verified using HPLC standard methods (Table 2).

4. Conclusions

In this study, a CdTe-Apt/FGO aptasensor was constructed for the purpose of AFB1 detection. CdTe QDs modified with the AFB1 aptamer (CdTe-Apt) were used as an energy donor, while FGO was used as an energy receptor. The π-π stacking interaction of FGO with CdTe-Apt led to the formation of complexes in the ground state. The CdTe-Apt strongly absorbed at the interface with the FGO layer, resulting in a FRET effect that quenched the fluorescence of CdTe QDs. Upon exposure to AFB1, the aptamer modified on CdTe QDs formed a complex with the AFB1; this weakened the adsorption between aptamer and FGO and assisted in restoring the fluorescence of CdTe QDs. This aptasensor exhibited a good linear range (0.02–150 ng/mL) and a low LOD (8.2 pg/mL) in detecting AFB1. It also showed excellent selectivity and sensitivity in monitoring AFB1 in pure milk and peanut samples, with recovery rates between 94.5% and 107.0%. In summary, the method introduced in the present study offers a new means of detecting AFB1 in foods. The potential practical applications of this method are considerable; however, the potential impact on the environments and ecosystems of the release and degradation of quantum dots cannot be ignored. By enhancing research and development efforts, refining regulations, and elevating public awareness, we can effectively mitigate the potential risks associated with quantum dot technology, thereby bolstering its safe and efficient use in the rapid detection of food toxins.

Author Contributions

Conceptualization, X.H., T.W. and L.S.; methodology, P.L., S.L., K.Z. and L.S.; formal analysis, Q.H. and T.L.; investigation, Q.H. and X.H.; resources, K.Z., T.W. and L.S.; data curation, P.L., S.L. and T.L.; writing—original draft preparation, P.L; writing—review and editing, T.W. All authors have read and agreed to the published version of the manuscript.

Funding

This work was supported by the National Natural Science Foundation of China (NO. 32101966) and the URCIP project of the School of Food Science and Technology, Henan Agricultural University.

Institutional Review Board Statement

Not applicable.

Informed Consent Statement

Not applicable.

Data Availability Statement

The data presented in this study are available on request from the corresponding author.

Conflicts of Interest

The authors declare no conflict of interest.

References

  1. Cai, Q.; Zhu, L.; Chen, P. Effective Physical Methods for Aflatoxin B1 Removal in Food: A Comprehensive Review. Food Control 2025, 173, 111215. [Google Scholar] [CrossRef]
  2. Damphathik, C.; Prakobkij, A.; Jarujamrus, P. Colorimetric sensor comprising metal-organic frameworks and molecularly imprinted polymers for aflatoxin B1 detection in agricultural commodities. Food Chem. 2025, 474, 143105. [Google Scholar] [CrossRef]
  3. Ren, L.; Hong, F.; Wen, J. High-throughput colorimetry immunoassay for aflatoxin B1 detection using the synergistic regulation of click chemistry by polydopamine and metal-organic framework. Food Chem. 2025, 475, 143344. [Google Scholar] [CrossRef] [PubMed]
  4. Eaton, D.L.; Williams, D.E.; Coulombe, R.A. Species differences in the biotransformation of aflatoxin B1: Primary determinants of relative carcinogenic potency in different animal species. Toxins 2025, 17, 30. [Google Scholar] [CrossRef] [PubMed]
  5. Wang, R.; Zhang, Q.; Chen, G. Mechanistic insights into ferroptosis and apoptosis pathways: Synergistic effects of multi-organ toxicity and transgenerational effects induced by co-exposure of epoxiconazole and aflatoxin B1 in zebrafish. J. Adv. Res. 2025; in press. [Google Scholar] [CrossRef] [PubMed]
  6. Zhao, L.; Yan, W.; Zhang, H. Antifungal and anti-aflatoxigenic mechanisms of dielectric barrier discharge cold plasma on Aspergillus flavus spores. Innov. Food Sci. Emerg. Technol. 2025, 102, 103964. [Google Scholar] [CrossRef]
  7. Saini, S.S.; Abdel-Rehim, M. Integrated extraction approach for trace analysis of aflatoxin B1 in domestic water tanks using HPLC. Sep. Sci. Plus 2020, 3, 167–174. [Google Scholar] [CrossRef]
  8. Teixeira, T.R.; Hoeltz, M.; Einloft, T.C. Determination of ochratoxin A in wine from the southern region of Brazil by thin layer chromatography with a charge-coupled detector. Food Addit. Contam. Part B 2011, 4, 289–293. [Google Scholar] [CrossRef]
  9. Tonon, K.M.; Savi, G.D.; Scussel, V.M. Application of a LC–MS/MS method for multi-mycotoxin analysis in infant formula and milk-based products for young children commercialized in Southern Brazil. J. Environ. Sci. Health Part B 2018, 53, 685–691. [Google Scholar] [CrossRef]
  10. Zhang, T.N.; Bai, W.J.; Zhao, K. Detection of aflatoxin B1 by a magnetic capture separator with time-resolved fluorescent microspheres. Microchem. J. 2024, 199, 110040. [Google Scholar] [CrossRef]
  11. Han, S.; Yang, Y.; Chen, T. Quantitative Determination of Aflatoxin B1 in Maize and Feed by ELISA and Time-Resolved Fluorescent Immunoassay Based on Monoclonal Antibodies. Foods 2024, 13, 319. [Google Scholar] [CrossRef]
  12. Hong, F.; Zhao, Y.; Pan, S. Click reaction-mediated fluorescent immunosensor based on Cu-MOF nanoparticles for ultrasensitive and high-throughput detection of aflatoxin B1 in food samples. J. Agric. Food Chem. 2024, 72, 5975–5982. [Google Scholar] [CrossRef]
  13. Askari, A.; Kota, S.; Ferrell, H. UTexas Aptamer Database: The collection and long-term preservation of aptamer sequence information. Nucleic Acids Res. 2023, 52, 351–359. [Google Scholar] [CrossRef]
  14. Yao, L.; Liu, T.; Sun, L. Selection of High-Affinity and Selectivity AFB1 Circular Aptamer for Biosensor Application. J. Agric. Food Chem. 2025, 73, 3222–3231. [Google Scholar] [CrossRef]
  15. Sun, J.; Ning, X.; Cui, L. Sensitive detection of aflatoxin B1 in foods by aptasensing-based qPCR. Food Chem. 2024, 432, 137240. [Google Scholar] [CrossRef]
  16. Quesada-González, D.; Merkoçi, A. Quantum dots for biosensing: Classification and applications. Biosens. Bioelectron. 2025, 273, 117180. [Google Scholar] [CrossRef]
  17. Zhang, X.; Liu, C.; Liu, Z. Bioengineered two-dimensional nanomaterials (Bio-2DNMs) for cancer diagnosis and therapy: A comprehensive review. Chem. Eng. J. 2025, 507, 160430. [Google Scholar] [CrossRef]
  18. Zheng, J.; Lian, Z.; Liu, T. A review for carbon dots-based fluorescent sensing tools for antibiotic and pesticide residues progress, challenge and perspective. Food Control 2025, 172, 111201. [Google Scholar] [CrossRef]
  19. Zhang, H.; Yang, M.; Wu, Q. Engineering Two-Dimensional Nanomaterials for Photothermal Therapy. Adv. Healthc. Mater. 2024, 64, e202424768. [Google Scholar]
  20. Mei, Y.; Cao, Y.; Wang, W. Emerging Violet Phosphorus Nanomaterial for Biomedical Applications. Adv. Healthc. Mater. 2015, 14, e2403576. [Google Scholar] [CrossRef]
  21. Wang, T.; Zhang, K.; Jiang, M. Bone tumor diagnosis: A FRET-based fluorescent osteocalcin sensor using palladium nanoparticles. Alex. Eng. J. 2025, 120, 87–94. [Google Scholar] [CrossRef]
  22. Chen, J.; Wu, H.; Zhang, W. Silica Coated Perovskite Quantum Dots with Single-Particle Level for Dual-Mode and Smartphone-Assisted Detection of Glutathione. Sens. Actuators B 2025, 432, 137489. [Google Scholar] [CrossRef]
  23. Qin, Z.; Xu, J.; Cao, Y. Visual detection of glyphosate by Al3+-regulated carbon dots/CdTe quantum dots ratiometric fluorescent sensing platform. Food Chem. 2025, 473, 143070. [Google Scholar] [CrossRef]
  24. Kong, W.C.; Wu, X.H.; Li, C.C. A Label-Free Fluorescence Aptasensor for the Detection of Ciprofloxacin in Actual Samples. ChemistrySelect 2025, 10, e202405539. [Google Scholar] [CrossRef]
  25. Lu, M.; Wang, T.; Li, T. Aptamer based ratiometric determination of DON by exploiting the FRET between carbon dots and graphene oxide. J. Food Compos. Anal. 2025, 141, 107384. [Google Scholar] [CrossRef]
  26. Zeng, Z.; Li, W.; Zhang, J. Highly sensitive and specific graphene oxide-based FRET aptasensor for quantitative detection of human soluble growth stimulating gene protein 2. Talanta 2024, 271, 125629. [Google Scholar] [CrossRef]
  27. Cai, Y.; Guo, G.; Fu, Y. A fluorescent aptasensor based on functional graphene oxide and FRET strategy simultaneously detects aflatoxins B1 and aflatoxins M1. Chin. J. Anal. Chem. 2024, 52, 100408. [Google Scholar] [CrossRef]
  28. Chen, J.; Wang, C.; Huang, X. Quantum Dots-Engineered Flexible Hydrogel as Plant-Wearable Sensor for on-Site Profiling Dynamic Pesticide Degradation. Adv. Funct. Mater. 2025, 2423643. [Google Scholar] [CrossRef]
  29. Cui, W.; Hu, C.; Zhu, R. Low-background fluorescent biosensor based on graphene oxide and aptamer biorecognition for sensitive detection of kanamycin. J. Food Compos. Anal. 2024, 131, 106261. [Google Scholar] [CrossRef]
  30. Fu, Z.; Chen, Z.; Yan, L. A RhB@ Tb-MOF sensor for selective detection of malachite green and leucomalachite green. J. Food Compos. Anal. 2025, 140, 107311. [Google Scholar] [CrossRef]
  31. Xue, Y.; Bao, C.; Liu, H. BSA-Assisted Synthesis of Au Nanoclusters/MnO2 Nanosheets for Fluorescence “Switch-On” Detection of Alkaline Phosphatase. Biosensors 2025, 15, 49. [Google Scholar] [CrossRef] [PubMed]
  32. Goud, K.Y.; Hayat, A.; Satyanarayana, M. Aptamer-based zearalenone assay based on the use of a fluorescein label and a functional graphene oxide as a quencher. Mikrochim. Acta 2017, 184, 4401. [Google Scholar] [CrossRef]
  33. Yoo, J.; Cho, Y.; Kim, D.H. Unraveling the role of Raman modes in evaluating the degree of reduction in graphene oxide via explainable artificial intelligence. Nano Today 2024, 57, 102366. [Google Scholar] [CrossRef]
  34. Singh, G.; Devi, S.; Singh, A. Organosilane Functionalized Graphene Oxide Nanocomposite as Fluorescent Chemosensor for the Detection of Tyrosine in Aqueous Medium. Appl. Organomet. Chem. 2025, 39, e70081. [Google Scholar] [CrossRef]
  35. Wang, B.; Liu, S.; Gao, M. A highly sensitive tapered fiber biosensor modified by PDMS combustion product and graphene oxide for MUC1 detection. Sens. Actuators Rep. 2025, 9, 100287. [Google Scholar] [CrossRef]
  36. Liu, Z.; Zhou, J.; Wang, X. Graphene oxide mediated CdSe quantum dots fluorescent aptasensor for high sensitivity detection of fluoroquinolones. Spectrochim. Acta Part A 2024, 305, 123497. [Google Scholar] [CrossRef]
  37. Yu, W.; Hao, A.; Mei, Y. A turn-on fluorescent aptasensor for ampicillin detection based on gold nanoparticles and CdTe QDs. Microchem. J. 2022, 179, 107454. [Google Scholar] [CrossRef]
  38. Jia, Y.; Zhou, G.; Wang, X. A metal-organic framework/aptamer system as a fluorescent biosensor for determination of aflatoxin B1 in food samples. Talanta 2020, 219, 121342. [Google Scholar] [CrossRef]
  39. Sabet, F.S.; Hosseini, M.; Khabbaz, H. FRET-based aptamer biosensor for selective and sensitive detection of aflatoxin B1 in peanut and rice. Food Chem. 2017, 220, 527–532. [Google Scholar] [CrossRef]
  40. Jia, Y.; Wu, F.; Liu, P. A label-free fluorescent aptasensor for the detection of Aflatoxin B1 in food samples using AIEgens and graphene oxide. Talanta 2019, 198, 71–77. [Google Scholar] [CrossRef]
  41. Setlem, K.; Mondal, B.; Shylaja, R. Dual Aptamer-DNAzyme based colorimetric assay for the detection of AFB1 from food and environmental samples. Anal. Biochem. 2020, 608, 113874. [Google Scholar]
  42. Li, Y.; Sun, Q.; Chen, X. Simultaneous detection of AFB1 and aflD gene by “Y” shaped aptamer fluorescent biosensor based on double quantum dots. Anal. Bioanal. Chem. 2023, 416, 223–893. [Google Scholar]
Scheme 1. The synthesis process of CdTe-Apt (A) and (B). Preparation of CdTe-Apt/FGO aptasensor and its detection principle for AFB1 (C).
Chemosensors 13 00141 sch001
Figure 1. (A) Raman of GO and FGO; (B) FTIR spectra of G, GO, and FGO; (C) TEM image of FGO; (D) UV absorption spectra of GO and FGO.
Chemosensors 13 00141 g001
Figure 2. TEM image (A), particle size distribution (B), and fluorescence spectra (C) of CdTe QDs (illustration: fluorescence image); (D) fluorescence spectra of CdTe and CdTe-Apt QDs; (E) FT-IR spectra of CdTe and CdTe-Apt QDs; (F) zeta potentials of CdTe and CdTe-Apt QDs.
Chemosensors 13 00141 g002
Figure 3. Feasibility of aptasensor for detecting AFB1: fluorescence spectra of CdTe-Apt (green line), CdTe-Apt/FGO (black line), and CdTe-Apt/FGO + AFB1 (red line).
Chemosensors 13 00141 g003
Figure 4. Effect of solution pH (A) and FGO concentration (B) on the fluorescence intensity of CdTe-Apt; effect of incubation (C) and detection (D) time on fluorescence intensity of CdTe-Apt/FGO and CdTe-Apt/FGO + AFB1.
Chemosensors 13 00141 g004
Figure 5. Fluorescence spectra (A) and fluorescence intensity (B) of the CdTe-Apt/FGO aptasensor for various concentrations of AFB1; (C) relationship between ΔF and AFB1 concentrations (0.02–150 ng/mL); (D) fluorescence changes in the Apt/FGO aptasensor under the UV lamp.
Chemosensors 13 00141 g005
Figure 6. (A) Effect of the aptasensor on selectivity of AFB1; (B) stability evaluation of the aptasensor at 4 °C over 25 days.
Chemosensors 13 00141 g006
Table 1. Comparison of the aptasensor with methods used in previous studies for AFB1 detection.
MycotoxinMethodDetection RangeLODReference
AFB1UiO-66-NH2/TAMRA/Apt180 ng/mL0.35 ng/mL[38]
QDs/AuNPs/Apt10–400 nM3.4 nM[39]
Ammonium Tetrastyrene/GO/Apt0–3 ng/mL0.25 ng/mL[40]
DNase/streptavidin magnetic beads/biotin/apt0–200 ng/mL22.6 ng/mL[41]
Si CDs/CdTe QDs/BHQ1/BHQ3/Apt0.5–500 ng/mL0.64 ng/mL[42]
CdTe-Apt/FGO0.05–150 ng/mL8.2 pg/mLThis work
Table 2. Determination of AFB1 in peanut and milk by aptasensor and HPLC (n = 3).
AptasensorHPLC
Added (ng/mL)Found (ng/mL)Recovery (%)RSD (%, n = 3)Found (ng/mL)
Peanut0----
0.10.95 ± 0.0394.54.9-
11.03 ± 0.11103.42.71.02 ± 0.04
109.76 ± 0.3997.64.410.22 ± 0.12
Pure milk0----
0.10.11 ± 0.04107.04.7-
10.98 ± 0.1698.11.71.03 ± 0.03
1010.48 ± 0.33104.82.39.99 ± 0.11
Disclaimer/Publisher’s Note: The statements, opinions and data contained in all publications are solely those of the individual author(s) and contributor(s) and not of MDPI and/or the editor(s). MDPI and/or the editor(s) disclaim responsibility for any injury to people or property resulting from any ideas, methods, instructions or products referred to in the content.

