Article

Design, Fabrication and Validation of Chemical Sensors for Detecting Hydrocarbons to Facilitate Oil Spillage Remediation

by
Perpetual Eze-Idehen
* and
Krishna Persaud
*
Department of Chemical Engineering, The University of Manchester, Manchester M13 9PL, UK
*
Authors to whom correspondence should be addressed.
Chemosensors 2025, 13(4), 140; https://doi.org/10.3390/chemosensors13040140
Submission received: 2 January 2024 / Revised: 26 March 2025 / Accepted: 31 March 2025 / Published: 11 April 2025

Abstract

:
To address the environmental hazards posed by oil spills and the limitations of conventional hydrocarbon monitoring techniques, a cost-effective and user-friendly gas sensor system was developed for the real-time detection and quantification of hydrocarbon contaminants in soil. This system utilizes carbon black (CB)-filled poly(methyl methacrylate) (PMMA) and poly(vinyl chloride) (PVC) nanocomposites to create chemoresistive sensors. The CB-PMMA and CB-PVC composites were synthesized and deposited as thin films onto interdigitated electrodes, with their morphologies characterized using scanning electron microscopy. The composites, optimized at a composition of 10% w/w CB and 90% w/w polymer, exhibited a sensitive response to hydrocarbon vapors across a tested range from C20 (99 ppmV) to C8 (8750 ppmV). The sensor’s response mechanism is primarily attributed to the swelling-induced resistance change of the amorphous polymer matrix in hydrocarbon vapors. These findings demonstrate the potential use of CB–polymer composites as field-deployable gas sensors, providing a rapid and efficient alternative to traditional gas chromatography methods for monitoring soil remediation efforts and mitigating the environmental impact of oil contamination.

1. Introduction

Numerous environmental agencies have set limits for total petroleum hydrocarbon (TPH) concentrations in soil at approximately 50 mg/kg [1,2,3], a threshold adopted by countries such as Nigeria [4], Spain [1], and the United States [5]. In the United States and other nations [6,7], TPH is widely used for site monitoring as it provides empirical values that help in establishing remediation criteria. TPH quantification is crucial for assessing pollution levels in affected areas relative to regulatory standards, typically determined using gas chromatography (GC) for characterization. Identifying the source of oil spills is essential for evaluating environmental damage to ecosystems [8,9]. While site-specific risk assessments and remediation protocols play a critical role in managing contaminated soil, it is equally important to develop standardized methodologies for effective remediation.
GC presents several limitations, including the requirement for toxic solvents during sample extraction, high energy consumption, lengthy analysis times, and the reliance on laboratory facilities for measurement. The sample preparation process can introduce errors, and certain hydrocarbons may degrade due to high inlet temperatures [10,11,12]. While gas detection tubes offer real-time field quantification, they lack the sensitivity of GC and require time-intensive extraction [12]. Advancements in field-deployable sensors now focus on optimizing electrical, optical, and mechanical properties to enhance real-time hydrocarbon detection, providing a more efficient and accurate alternative to conventional GC methods [13].
Chemical sensors offer portability, ease of fabrication, and the potential for miniaturization using microelectronic techniques. However, existing devices, including Petrosense [14,15,16,17], Remscam [17], Ecoprobe [18], and Cyranose 320 [19], face limitations including low sensitivity, poor selectivity, and high cost [20]. This study focuses on the design and fabrication of a chemical sensor utilizing conducting polymer nanocomposites comprising polymethylmethacrylate (PMMA) and polyvinyl chloride (PVC) with carbon black as a filler. Effective sensing materials require hydrophobicity for hydrocarbon absorption, high permeability for analyte diffusion, and chemical inertness to prevent unwanted interactions [21]. PMMA, characterized by its hydrophobic properties in humid environments due to the absence of ionizable functional groups [22,23], provides a stable sensing platform. Conversely, PVC contains both crystalline and amorphous phases influencing its hydrophobicity and mechanical behavior [23]. Liu [24] used PVC as a matrix for composite materials, while Rotaru et al. [25] examined the conductivity of carbon black-PVC composites at varying weight percentages. Increasing the weight, size, and cross-sectional area of the penetrant decreases the diffusion coefficient in polymeric materials [26,27,28,29,30,31]. Material characteristics for effective sensing include hydrophobicity for absorbing hydrocarbons, high permeability and porosity to accommodate molecules [32,33,34,35], and inertness to prevent chemical interactions with the targeted analytes.
The electrical conductivity of CB–polymer composites depend on CB concentration and structure. CB consists of 90–99% carbon with trace oxygen, sulfur, and ash, and its surface functionalities enhance interactions with polymer matrices [35,36,37,38,39,40,41]. CB incorporation improves mechanical properties while achieving electrical conductivities from 1 S/cm to 100 S/cm, dictated by filler concentration and distribution [42,43,44,45,46]. The dibutyl phthalate absorption (DBPA) method assesses CB structure, where higher DBPA values indicate a more developed conductive network [47]. Sisk and Lewis [48] found that low CB fractions (1–12 wt. %) enhance sensor response with percolation thresholds observed at 3–15 wt. % [49]. Nanocomposite films are fabricated using solvent systems influencing their electrical properties [50]. Anisole with solubility parameters closely matching PMMA and PVC is an effective solvent for uniform film deposition [51,52]. The Hildebrand and Hansen solubility parameters serve as predictive tools for polymer–solvent interactions, particularly for non-polar and slightly polar polymer systems [53,54,55]. PMMA and PVC, with Hildebrand solubility parameters of 9.3 (cal/cm3)1/2 and 9.5 (cal/cm3)1/2, respectively, are likely to be soluble in anisole, which has a solubility parameter of 9.7 (cal/cm3)1/2 [53,56,57,58].
This research explores CB-PMMA and CB-PVC nanocomposites as cost-effective, user-friendly materials for developing pattern-based signatures to detect, classify, and analyze hydrocarbon analytes. These nanocomposites facilitate the development of technology for the environmental monitoring and analysis of hydrocarbon analytes, surpassing the performance of exiting sensors [59,60]. The proposed sensor leverages the swelling and conductive properties of the nanocomposite to detect hydrocarbon concentrations in the field, enhancing accessibility for local communities, farmers, and industries impacted by oil spills. Through this innovative approach, this research contributes to environmental monitoring and hydrocarbon analysis, providing practical solutions for contamination assessment and remediation efforts. The following sections are featured in the study: Section 2 covers the theoretical and empirical background, Section 3 details the materials and methods, Section 4 presents the experimental results, Section 5 discusses the findings, Section 6 conclusion and future research recommendations.

2. Theoretical and Empirical Background

2.1. Theory of Swelling Mechanism

Sensor films can be composite material containing a conductor dispersed within a swellable organic insulator. The swelling process is the primary mechanism responsible for the change in resistance of the sensing material [60]. Theoretically, an increase in the electrical resistance of the film, induced by the swelling mechanism triggered by vapors, varies with the nature of the sensing material. Swelling distorts the number of connected pathways of the conducting component within the composite material. Upon removal of the vapor, the film completely reverts to its original unexpanded state. The relative change in resistance during exposure is mathematically by Equation (1). This process causes changes in carrier density and mobility, thereby inducing alterations in conductivity (σ), which is the reciprocal of resistivity ( ρ ), as expressed in Equation (2).
R = R 0 R e x p o s u r e R 0
Here, the resistivity ( ρ ) is related to the measured resistance (R) by:
ρ = R A L
where R 0 represents resistance before exposure, R   symbolizes resistance, A denotes sensing area and L signifies thickness.
Changes in film electrical resistance depend on Fick’s law of diffusion, as molecules migrate from regions of higher concentration to regions of lower concentration within a medium, to eventually reach chemical homogeneity. In this research, Ficks theory is implied because the sorption and desorption of hydrocarbon vapor into the polymeric nanocomposites were tracked over time at the vapor pressure of the target analyte. Theoretically, the change in resistance is directly proportional to the vapor pressure of chemicals present in the atmosphere, allowing these sensors to translate chemical concentrations into measurable electrical signals over time [61]. Conductive polymer composite films undergo swelling when exposed to analyte vapors, and this is linearly correlated with the analyte concentration in contact with the chemiresistors [52,60,62,63,64,65,66]. Prager and Long’s study [66] established that the diffusion of hydrocarbon vapor into polymeric systems obeys Fick’s law, and that the diffusion rate correlates with the compositional gradient. Fick’s second law, which postulated that the concentration changes over time in response to variations in flux concerning position, can be represented mathematically by the differential equation in Equation (3),
d C d t = D d 2 C d x 2
where t represents time in seconds, x denotes the position or distance from the source, D signifies the diffusion coefficient of the vapor in the porous media–polymer, and C(x,t) expresses vapor concentration as a function of distance (x) into the film at time (t). The porosity of the composite system influences the analyte’s structure within the polymer matrix through diffusion and sorption processes. The interactions between analytes and sensing materials exhibit multifaceted dynamics [67]; the sensor response undergoes variations upon exposure to different analytes, contingent upon the active materials utilized [68]. Additionally, Van der Waals forces, the morphology of the sorption material, dipole interactions, and partial electron transfer influence the polymer work function upon interaction with vapor molecules [69,70]. Nevertheless, a thorough grasp of this mechanism continues to evade us.

2.2. Mechanism of Electrically Conducting Polymer Nanocomposites

The process of incorporating fillers such as carbon black into an insulating polymer result in a conductive polymer composite (CPCs), where conductivity depends on filler concentration, dispersion, and interconnectivity. CPCs exhibit conductivities from 10−14 to 10−17 S/cm, while CB ranges from 102 to 105 S/cm [71,72,73,74], with resistivities of ~10 Ω/cm suitable for nanocomposite applications [74]. Janzen [75] developed a percolation model using an average contact number of 1.5 to predict the transition from insulating to conductive behavior in CB–polymer systems, optimizing their electrical properties for sensing and electronics.
V C = 1 1 + 4 ρ v
where V C is the critical filler volume fraction above which conductivity occurs suddenly, ρ is the density of the filler and v is the readily measurable specific void space in a random dense packed bed of the filler.
Conduction in CPCs occurs through percolation and quantum tunneling. Above the percolation threshold, conductive pathways form, enabling electron transport, while below it, the composite remains insulating [76]. A single conductive path with a tunneling distance under 1.8 nm can facilitate conduction [77] with nanoscale reinforcements dominating electrical properties beyond the threshold [78]. Quantum tunneling enables electrons to hop between closely spaced conductive fillers within an insulating matrix, facilitating conductivity below the percolation threshold. This occurs through the tunneling current across narrow gaps, influenced by barrier width (s), applied voltage (V), and potential barrier height. As gas molecules interact with a polymer composite sensor, tunneling paths contract (s to s − Δs), enhancing electron flow and increasing conductivity, a principle observed in semiconductors and superconducting devices [77,79]. The system’s three-dimensional wave function, governed by Hamiltonian equations, encapsulates all interactions and represents the total energy of a particle, as expressed in Equation (5). In quantum mechanics, tunneling occurs when a particle traverses a potential barrier of height V(x) and width s. Leonel Paredes-Madrid et al. [80] formulated the time-independent Schrödinger equation to describe the wave function ψ(x) in a quantum system. The system’s three-dimensional wave function, governed by Hamiltonian equations, encapsulates all interactions and represents the total energy of a particle, as expressed in Equation (5):
H ψ x = ħ 2 2 m * d 2 d x 2 + V x ψ x = E / ψ ( x )
where H is the Hamiltonian constant, ℏ is the reduced Planck constant, m is the mass of the particle, V(x) is the potential barrier, and E is the energy of the particle. This formulation underpins the tunneling conductivity observed in composite materials, especially when the concentration of the conductive filler is below the percolation threshold. Sanjay et al. [81] developed polyvinyl alcohol (PVA)–carbon black composites with varying sensitivities to different chemicals demonstrating broad potential. Fox [82] analyzed the conductivity of carbon black–polyvinyl chloride (PVC) composites as a function of weight percent loading, while Katarzyna et al. [83] investigated their resistivity and conduction mechanisms. Lewis et al. [84] fabricated chemically sensitive resistors using carbon black and non-polymeric sorption phases to enhance vapor discrimination. Commercially, Caltech’s electronic nose, based on conductive composite materials, has been deployed for airborne vapor tracking, exhibiting near-real-time detection and linear sensor responses to analyte concentrations [59,85,86,87].

3. Materials and Methods

PMMA with an average molecular weight of 120,000 and PVC with an average molecular weight of 80,000 were obtained from Sigma Aldrich and used without further modification. Anisole (purity of 99%) was also sourced from Sigma Aldrich. Carbon black, consisting of particles smaller than 100 nm with a surface area exceeding 100 m2/g, was acquired from Sigma Aldrich (referred to as furnace carbon black). The interdigitated electrode substrate, measuring L 22.8 mm × W 7 mm × H 0.175 mm, with line/gap dimensions of 100 µm, was procured from Metrohm, Runcorn, UK. The instrumentation utilized included a profilometer (DektakXT UPB-6055A from Bruker, Coventry, UK), a potentiostat (Auto Lab instrument operating NOVA 2.1.4 software), and a Scanning Electron Microscope (FEI Quanta 250 FEG) by Thermo Fisher Scientific, Wilsonville, OR, USA.

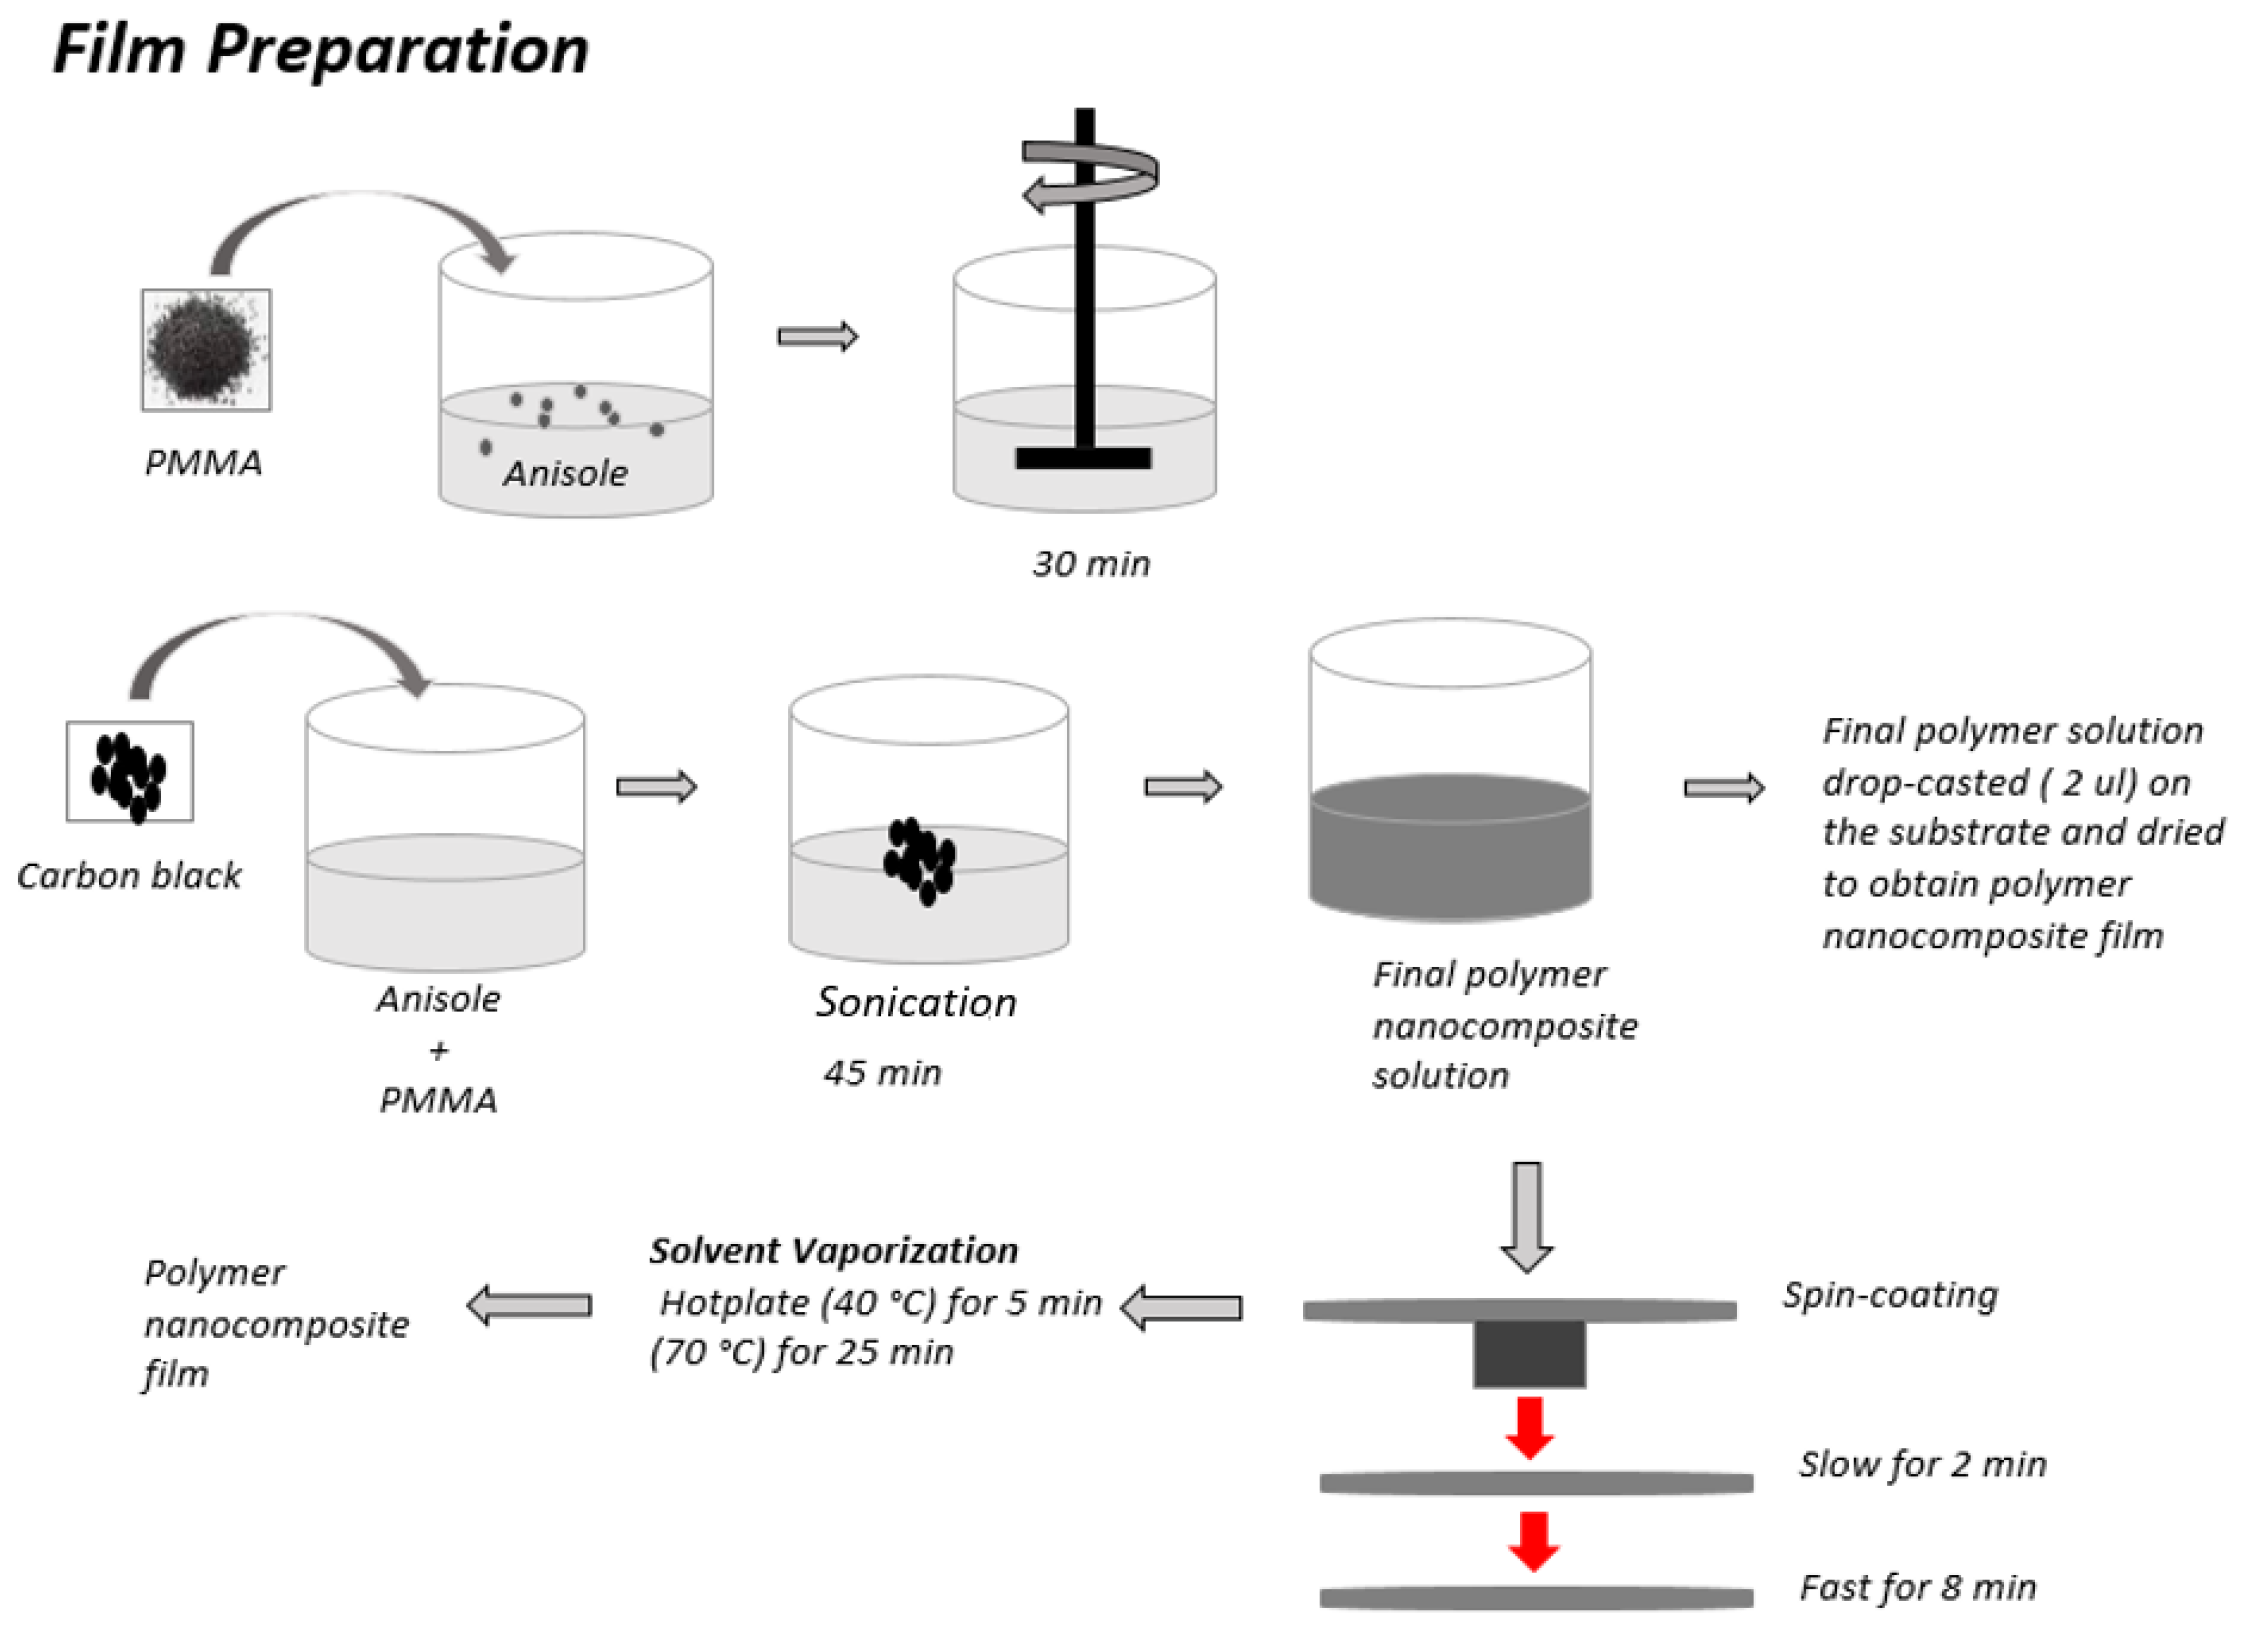
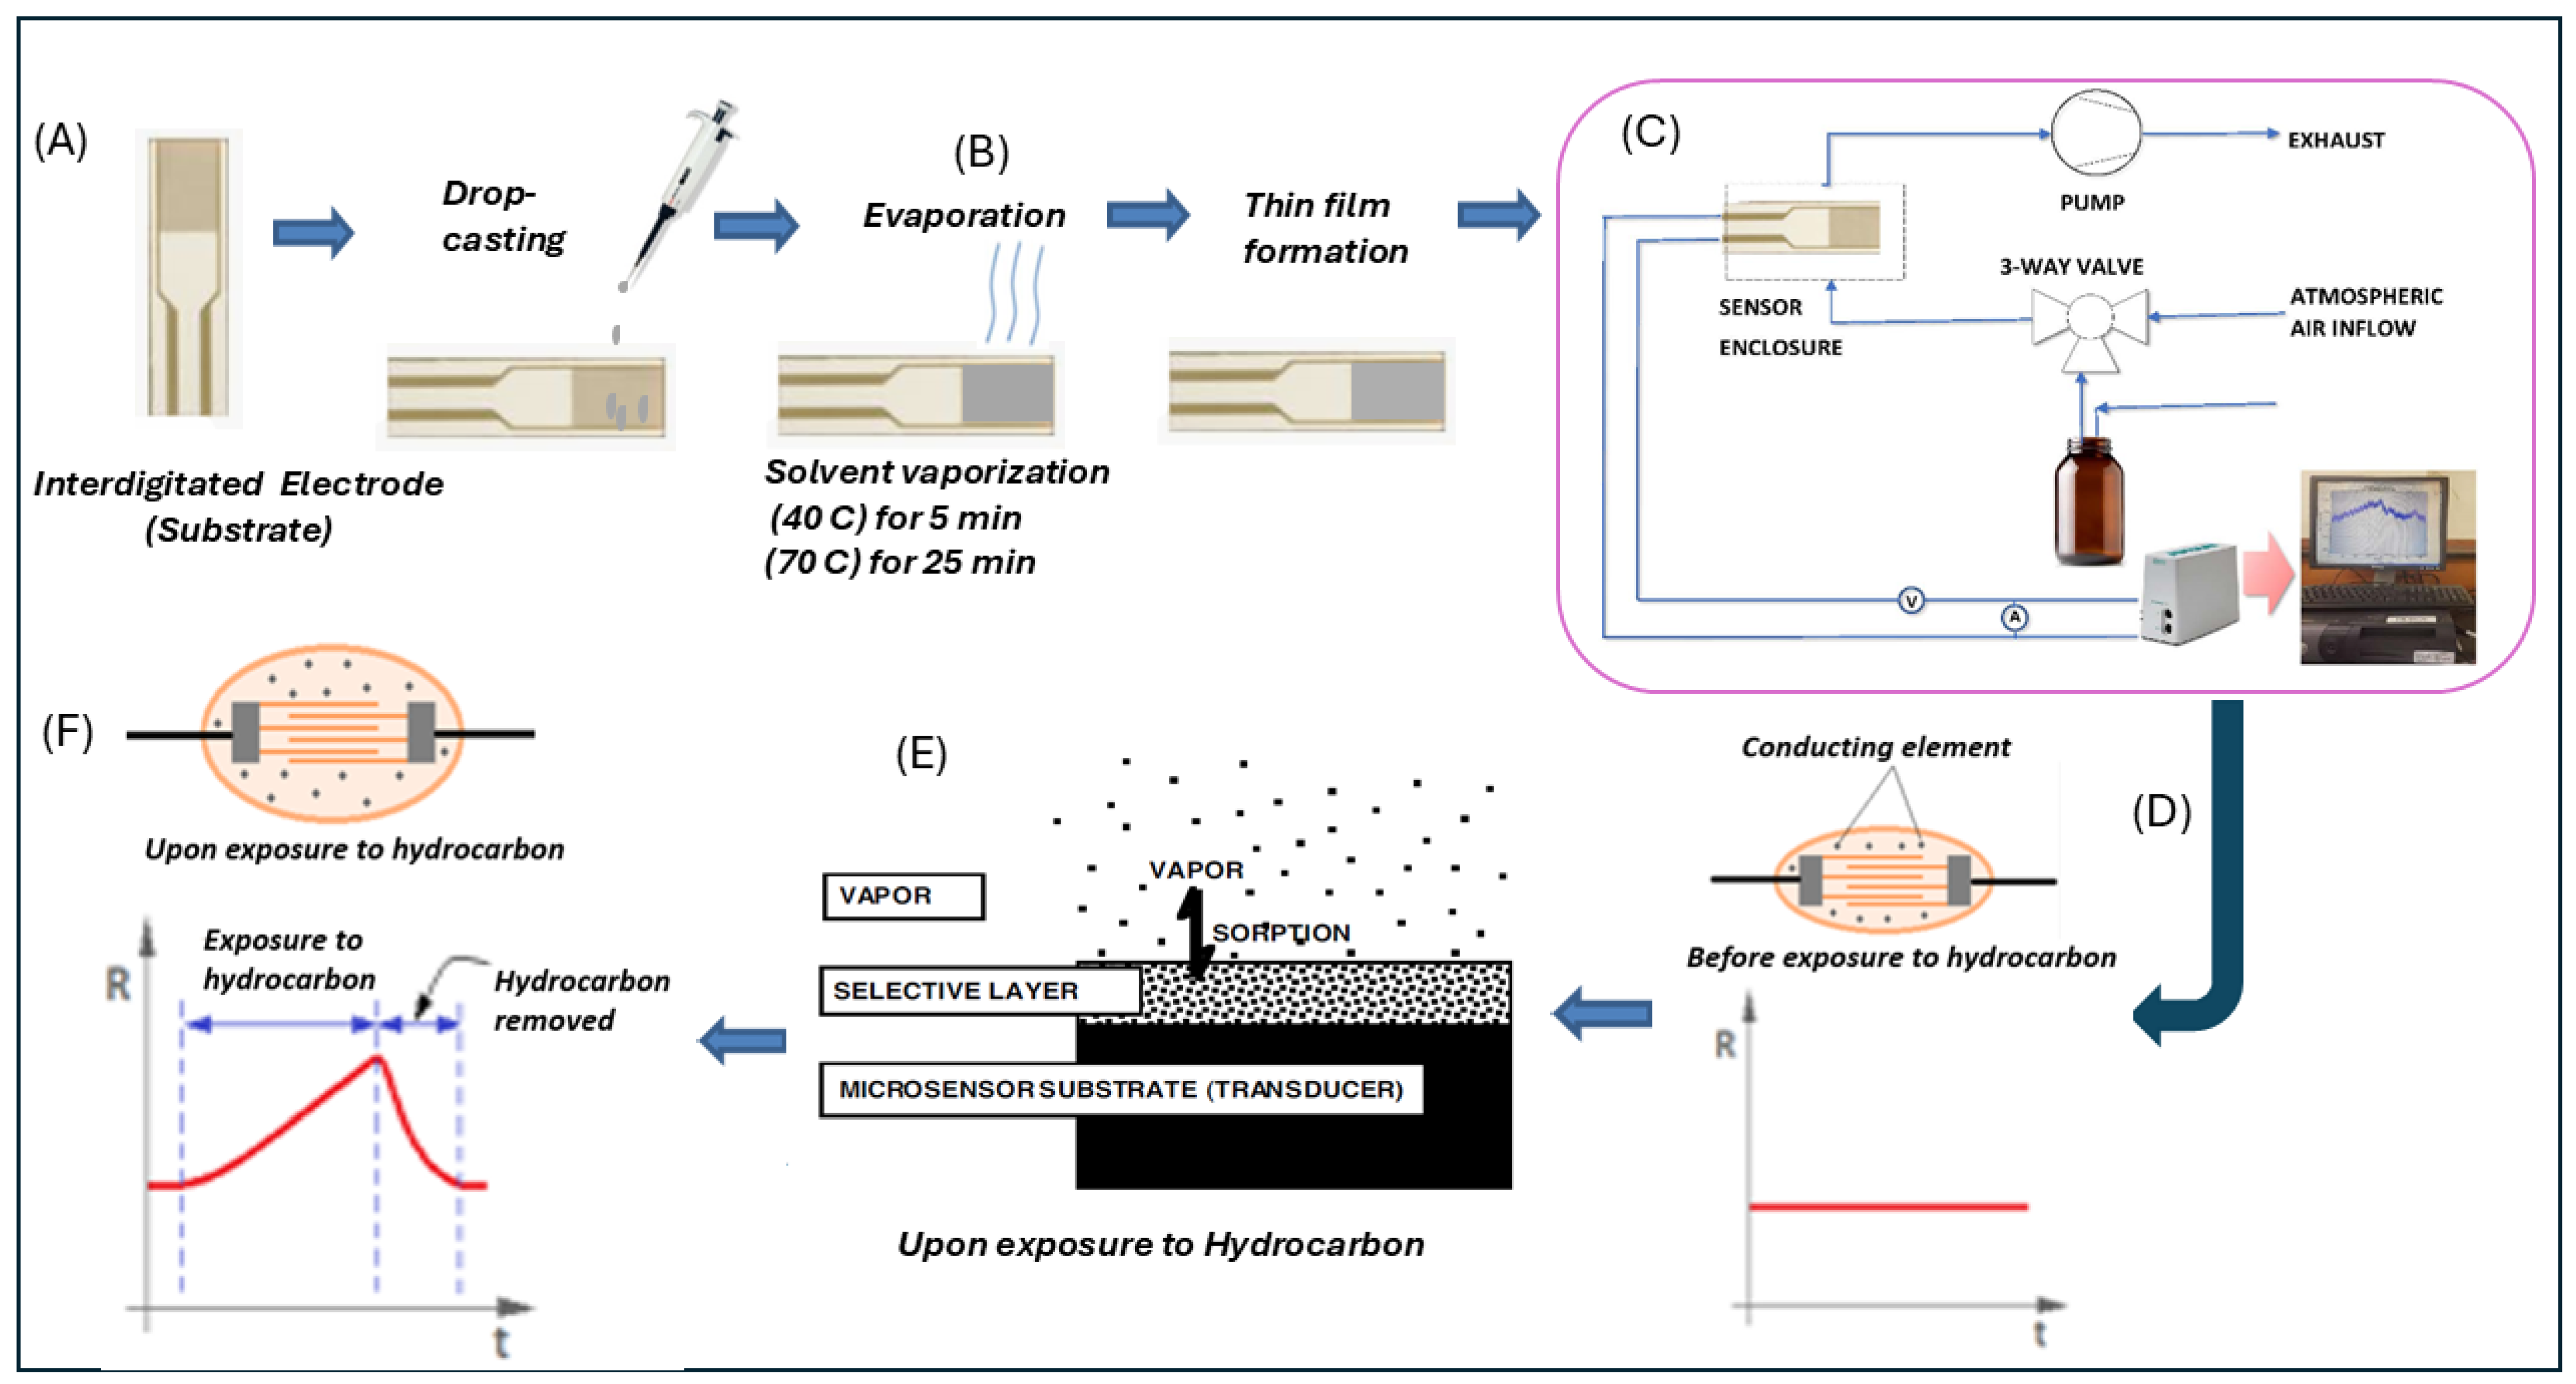
3.1. Preparation of Conducting Polymer Composite

Figure 1 illustrates the fabrication process of the sensor film. A composite solution was prepared by dissolving 90 mg of polymer in 5 mL of anisole, followed by 30 min of sonication. Subsequently, 10 mg of carbon black was added and further sonicated for 45 min to ensure uniform dispersion, reducing agglomerated particles to ~18 nm in radius [69]. The solution was then deposited onto an interdigitated electrode substrate using a Cole–Parmer adjustable pipette and spin-coated at 500 rpm for 2 min, followed by 1500 rpm for 8 min to achieve a uniform film. Solvent evaporation was carried out in two stages—40 °C for 5 min to prevent cracking and 70 °C for 25 min for complete removal. Film thicknesses were measured using a surface profilometer, with CB-PMMA and CB-PVC films averaging 150 nm and 178 nm, respectively. Sensor resistance was recorded over time at 0.5 V using a potentiostat.

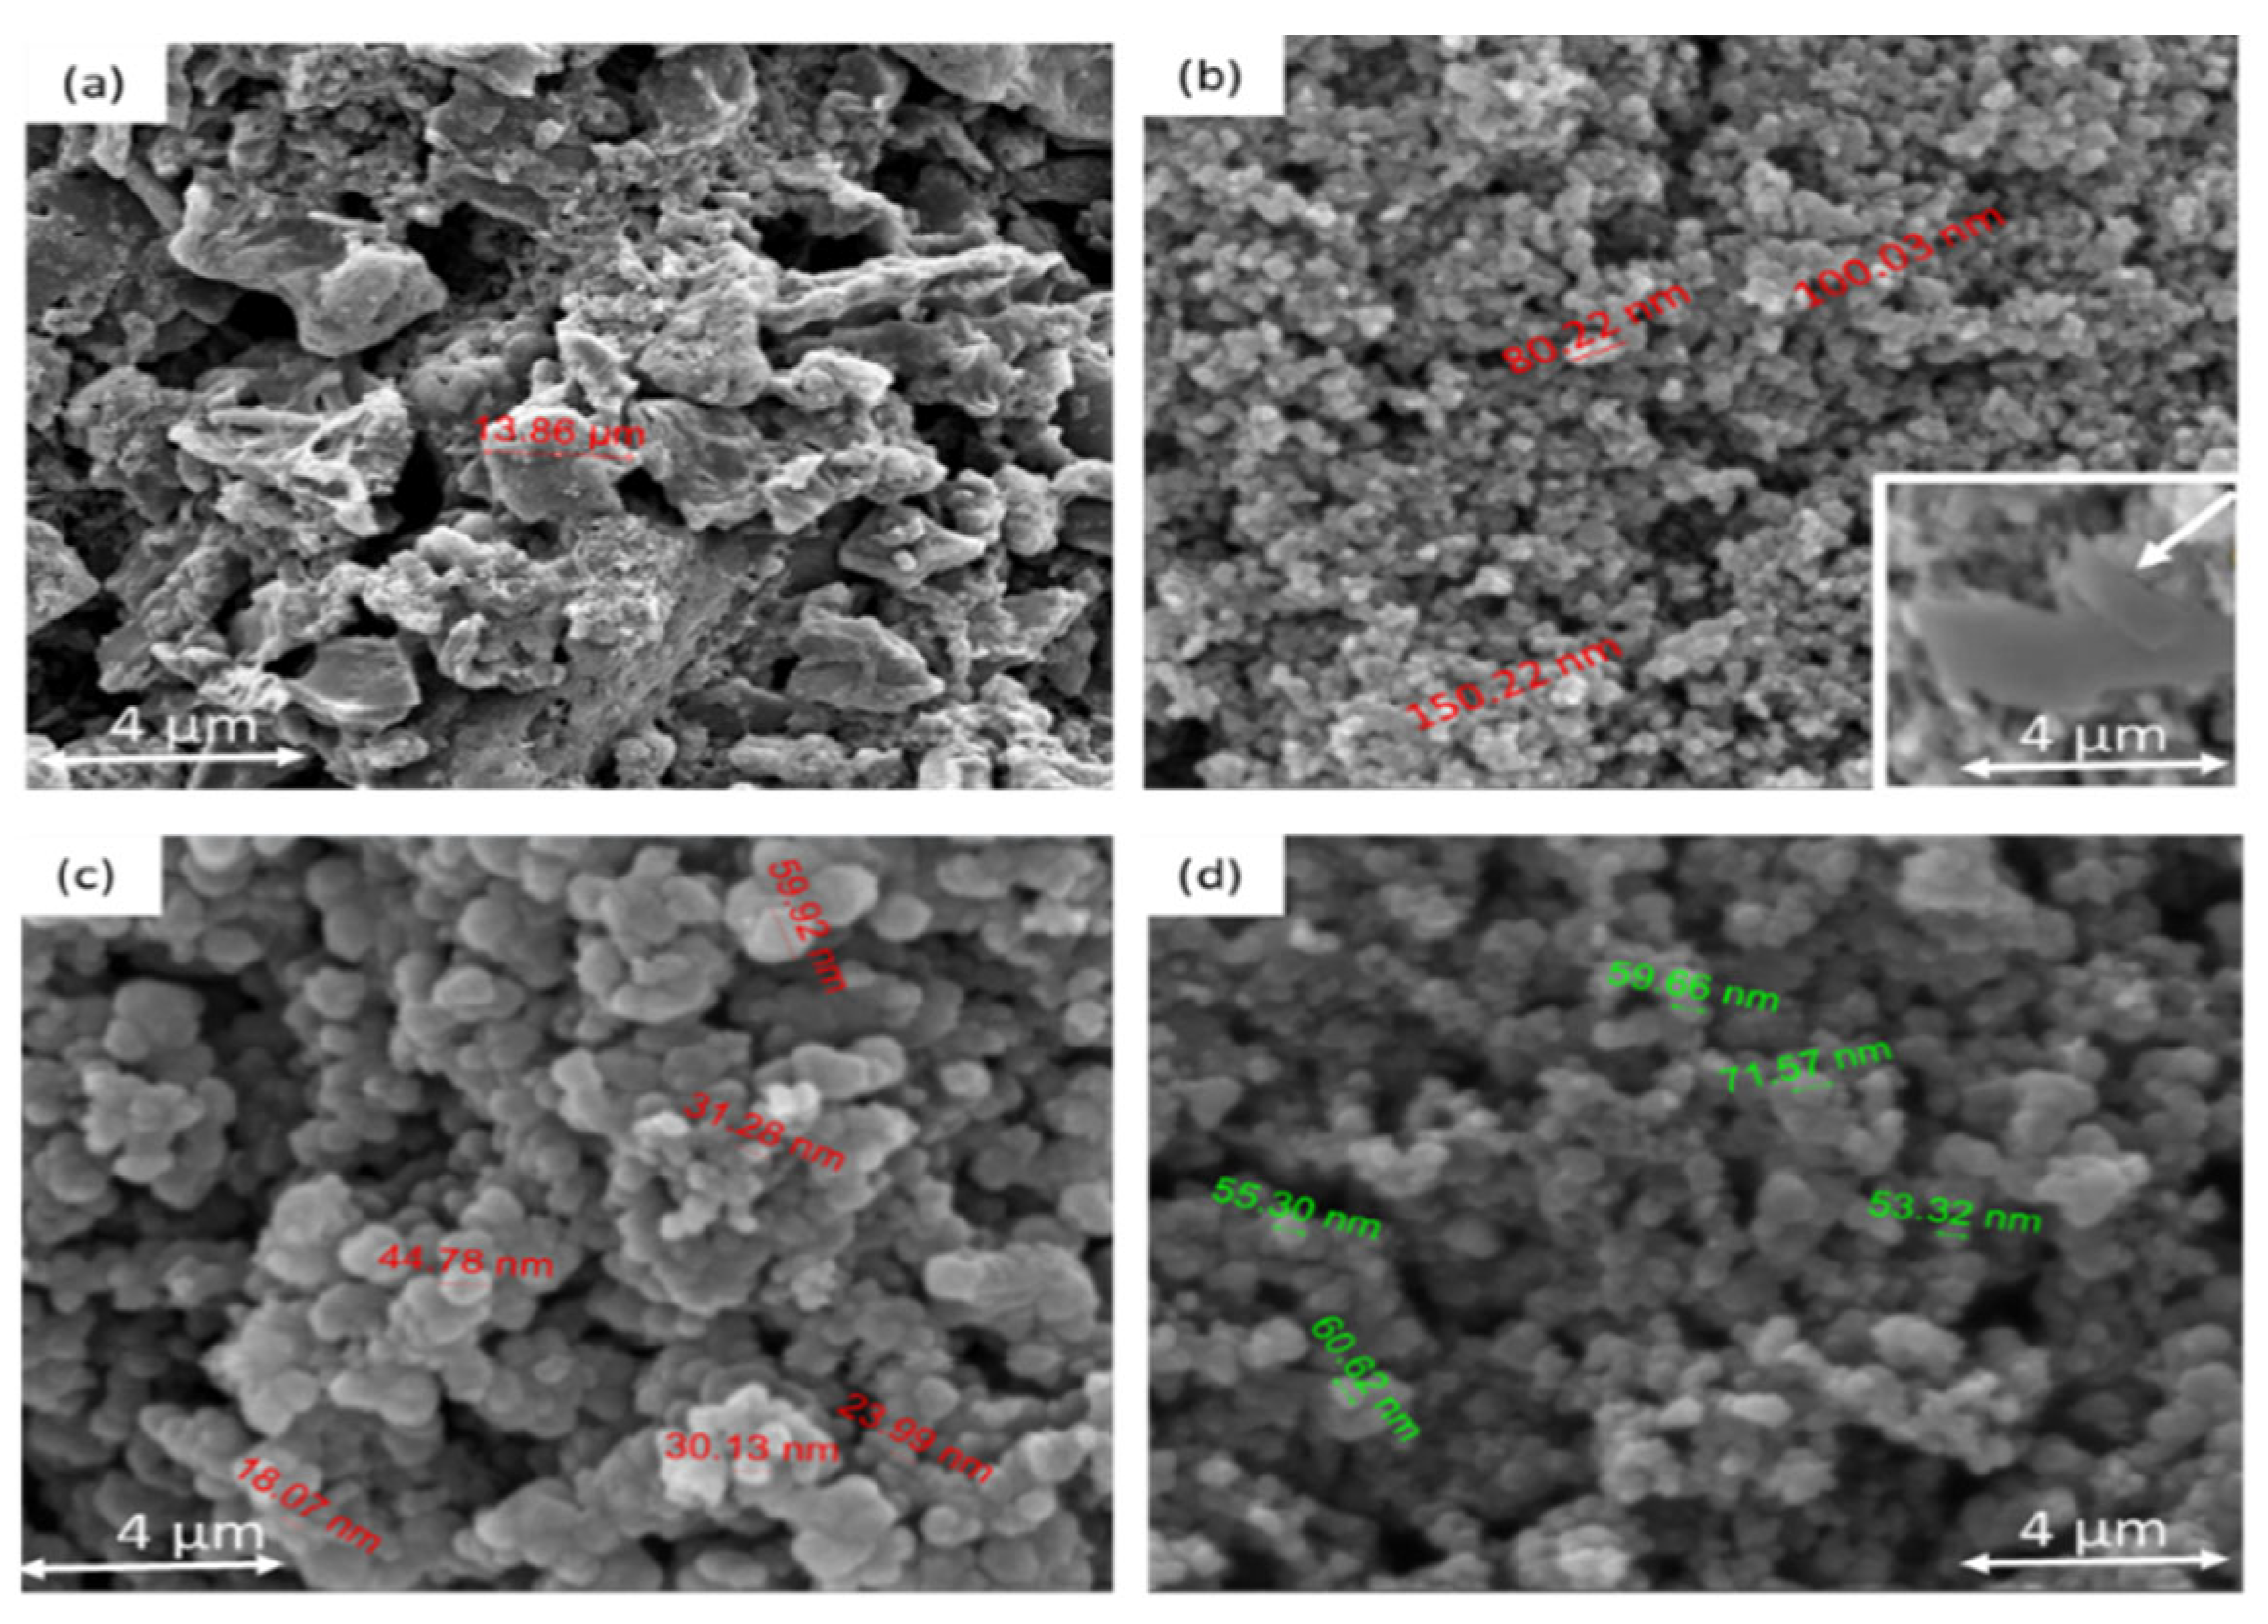
3.2. Investigation of the Morphology of the Composites Using SEM

The morphologies of the CB-PMMA/CB-PVC nanocomposites (sourced from Sigma Aldrich, St. Louis, MO, USA) were examined using optical and electron microscopy, considering prior studies highlighting the impact of nanoparticle distribution on electrical properties [88,89,90,91]. Surface morphology was analyzed at the microscale using an FEI Quanta 250 FEG scanning electron microscope (purchased from Thermo Fisher Scientific) within a pressure range of 0.005–150 Pa. Imaging was conducted at a working pressure of 10 Pa, with an accelerating voltage of 5 kV and a beam current of 2 A. The experimental setup, illustrated in Figure 2, involved preparing a solution of PMMA, PVC, and carbon black in anisole (99%), followed by sonication and drop-casting onto an interdigitated electrode substrate (A). Spin-coating (B) was performed at 2000 rpm for 10 min, and solvent evaporation (40 °C) was achieved using a hot plate. The electrode was then enclosed in a sensor casing (C) and electrically connected to a potentiostat, applying a constant 0.5 V to the gas sensor. Current responses were recorded upon exposure to either clean air or hydrocarbon vapors. The hydrocarbon sample was incubated in a 70 °C water bath, and an automated three-way solenoid valve alternated between saturated hydrocarbon vapor and atmospheric air. The sensor chamber featured three outlets—one for potentiostat connection, another linked to the three-way valve directing hydrocarbon-saturated air, and the third operating as an exhaust via a pump.
To initiate an experiment, 0.002 kg of soil was measured and placed into a 2.5 L Winchester bottle (C) to establish a representative matrix. Hydrocarbon equilibration was achieved using EPA Method 5021, elevating the sample temperature to 70 °C in a water bath. This step ensured that hydrocarbon vapors reached a stable concentration in the headspace before measurement. Hydrocarbons were introduced at varying concentrations and allowed to equilibrate over different timeframes, ranging from hours to weeks. During this process, diffusion and volatilization facilitated the partitioning of hydrocarbons between the solid (adsorbed) and gas phases. The equilibration rate depended on soil porosity, moisture content, hydrocarbon volatility, molecular weight, and temperature. During measurement, a switched pump directed saturated hydrocarbon vapors from the bottle to the sensor chamber. The exposure process consisted of three steps, as follows: 60 s of clean air to establish a baseline resistance, 60 s of hydrocarbon vapor introduction, and another 60 s of clean air for baseline recovery. A gold interdigitated electrode substrate with 100-micron lines and gaps was used to maximize surface interaction and conductivity [92]. CB-PMMA and CB-PVC composite films were deposited via drop-casting onto the electrodes following the fabrication process outlined in Figure 2B. A sensor flow chamber made of PEEK with Viton seals was employed to improve hydrocarbon measurement, and the sensors were installed within this chamber. The measurement procedure in this study is similar to the procedure reported in [85,93]. Resistance measurements were conducted using a four-point probe technique, with a potentiostat monitoring the CB-PMMA and CB-PVC responses to hydrocarbons. The resistance change relative to the baseline resistance was calculated for each analyte exposure. Periodic verification ensured steady-state conditions, confirming that hydrocarbon vapor levels accurately reflected the soil contamination state. The equilibration period was optimized to balance efficiency and accuracy, ensuring the reproducible and reliable detection of hydrocarbon vapors.

4. Results and Discussion

Figure 3 illustrates the surface particle morphological examination of sensor films composed of PMMA and PVC materials, augmented with diverse particle sizes at a 10% w/w CB loading. Under ambient conditions, the characterization process unveiled a uniform dispersion of carbon black particles and the presence of an interconnected network within the composites, as depicted in Figure 4c,d. This observed uniformity contrasts with composites featuring larger particle sizes, as evidenced in Figure 4a,b. SEM imagery reveals that the CB agglomerated in the 500 nm composite, Figure 3b, potentially due to the grinding process aimed at reducing particle diameter. This could impede the continuous flow of electrons through the composite. The close examination of the SEM micrographs with 100 nm (CB-PMMA) (see Figure 3c) demonstrated the absence of agglomeration in smaller diameter sizes (18 to 59 nm). Informed by this observation, CB-PVC was fabricated, and its morphology was examined to reveal material diameter sizes ranging from 53 to 71 nm in Figure 3d. The measured average film thicknesses of CB-PMMA and CB-PVC composites were 150 nm and 178 nm, respectively. The time–response measurements of the detectors were recorded at less than 1 s, consistent with findings from a similar study [59].
Structural characterization at room temperature revealed a well-dispersed carbon black (CB) phase within the polymer matrix, forming an interconnected conductive network. This is evident from the SEM micrographs (Figure 3b,d), where a uniform dispersion of CB with nanoscale features (~100 nm) was observed. In contrast, composites with larger CB particle sizes (Figure 3a,b) exhibited reduced homogeneity, potentially leading to inconsistencies in sensor performance. The observed morphology aligns with predictions from the quantum tunneling theory, which suggests that the formation of a percolated conductive network in polymer nanocomposites is critical for effective sensing applications. The influence of the CB mass fraction on sensor response was systematically evaluated, with compositions ranging from 5% to 40%. A direct correlation was observed between CB loading and sensor response magnitude, consistent with prior literature. However, beyond 20% CB loading, the response became irreversible, as the sensors failed to return to their baseline resistance following hydrocarbon exposure. This suggests that an excessive CB concentration may hinder polymer matrix elasticity, leading to permanent morphological changes upon analyte adsorption. Consequently, such high-loading composites were deemed unsuitable for practical sensor applications. The most optimal sensor performance was recorded at 10% CB loading, where the sensors demonstrated a strong and reversible response toward the targeted hydrocarbon vapors. This reversibility is a crucial criterion for chemical sensors, ensuring long-term operational stability and reproducibility [88].

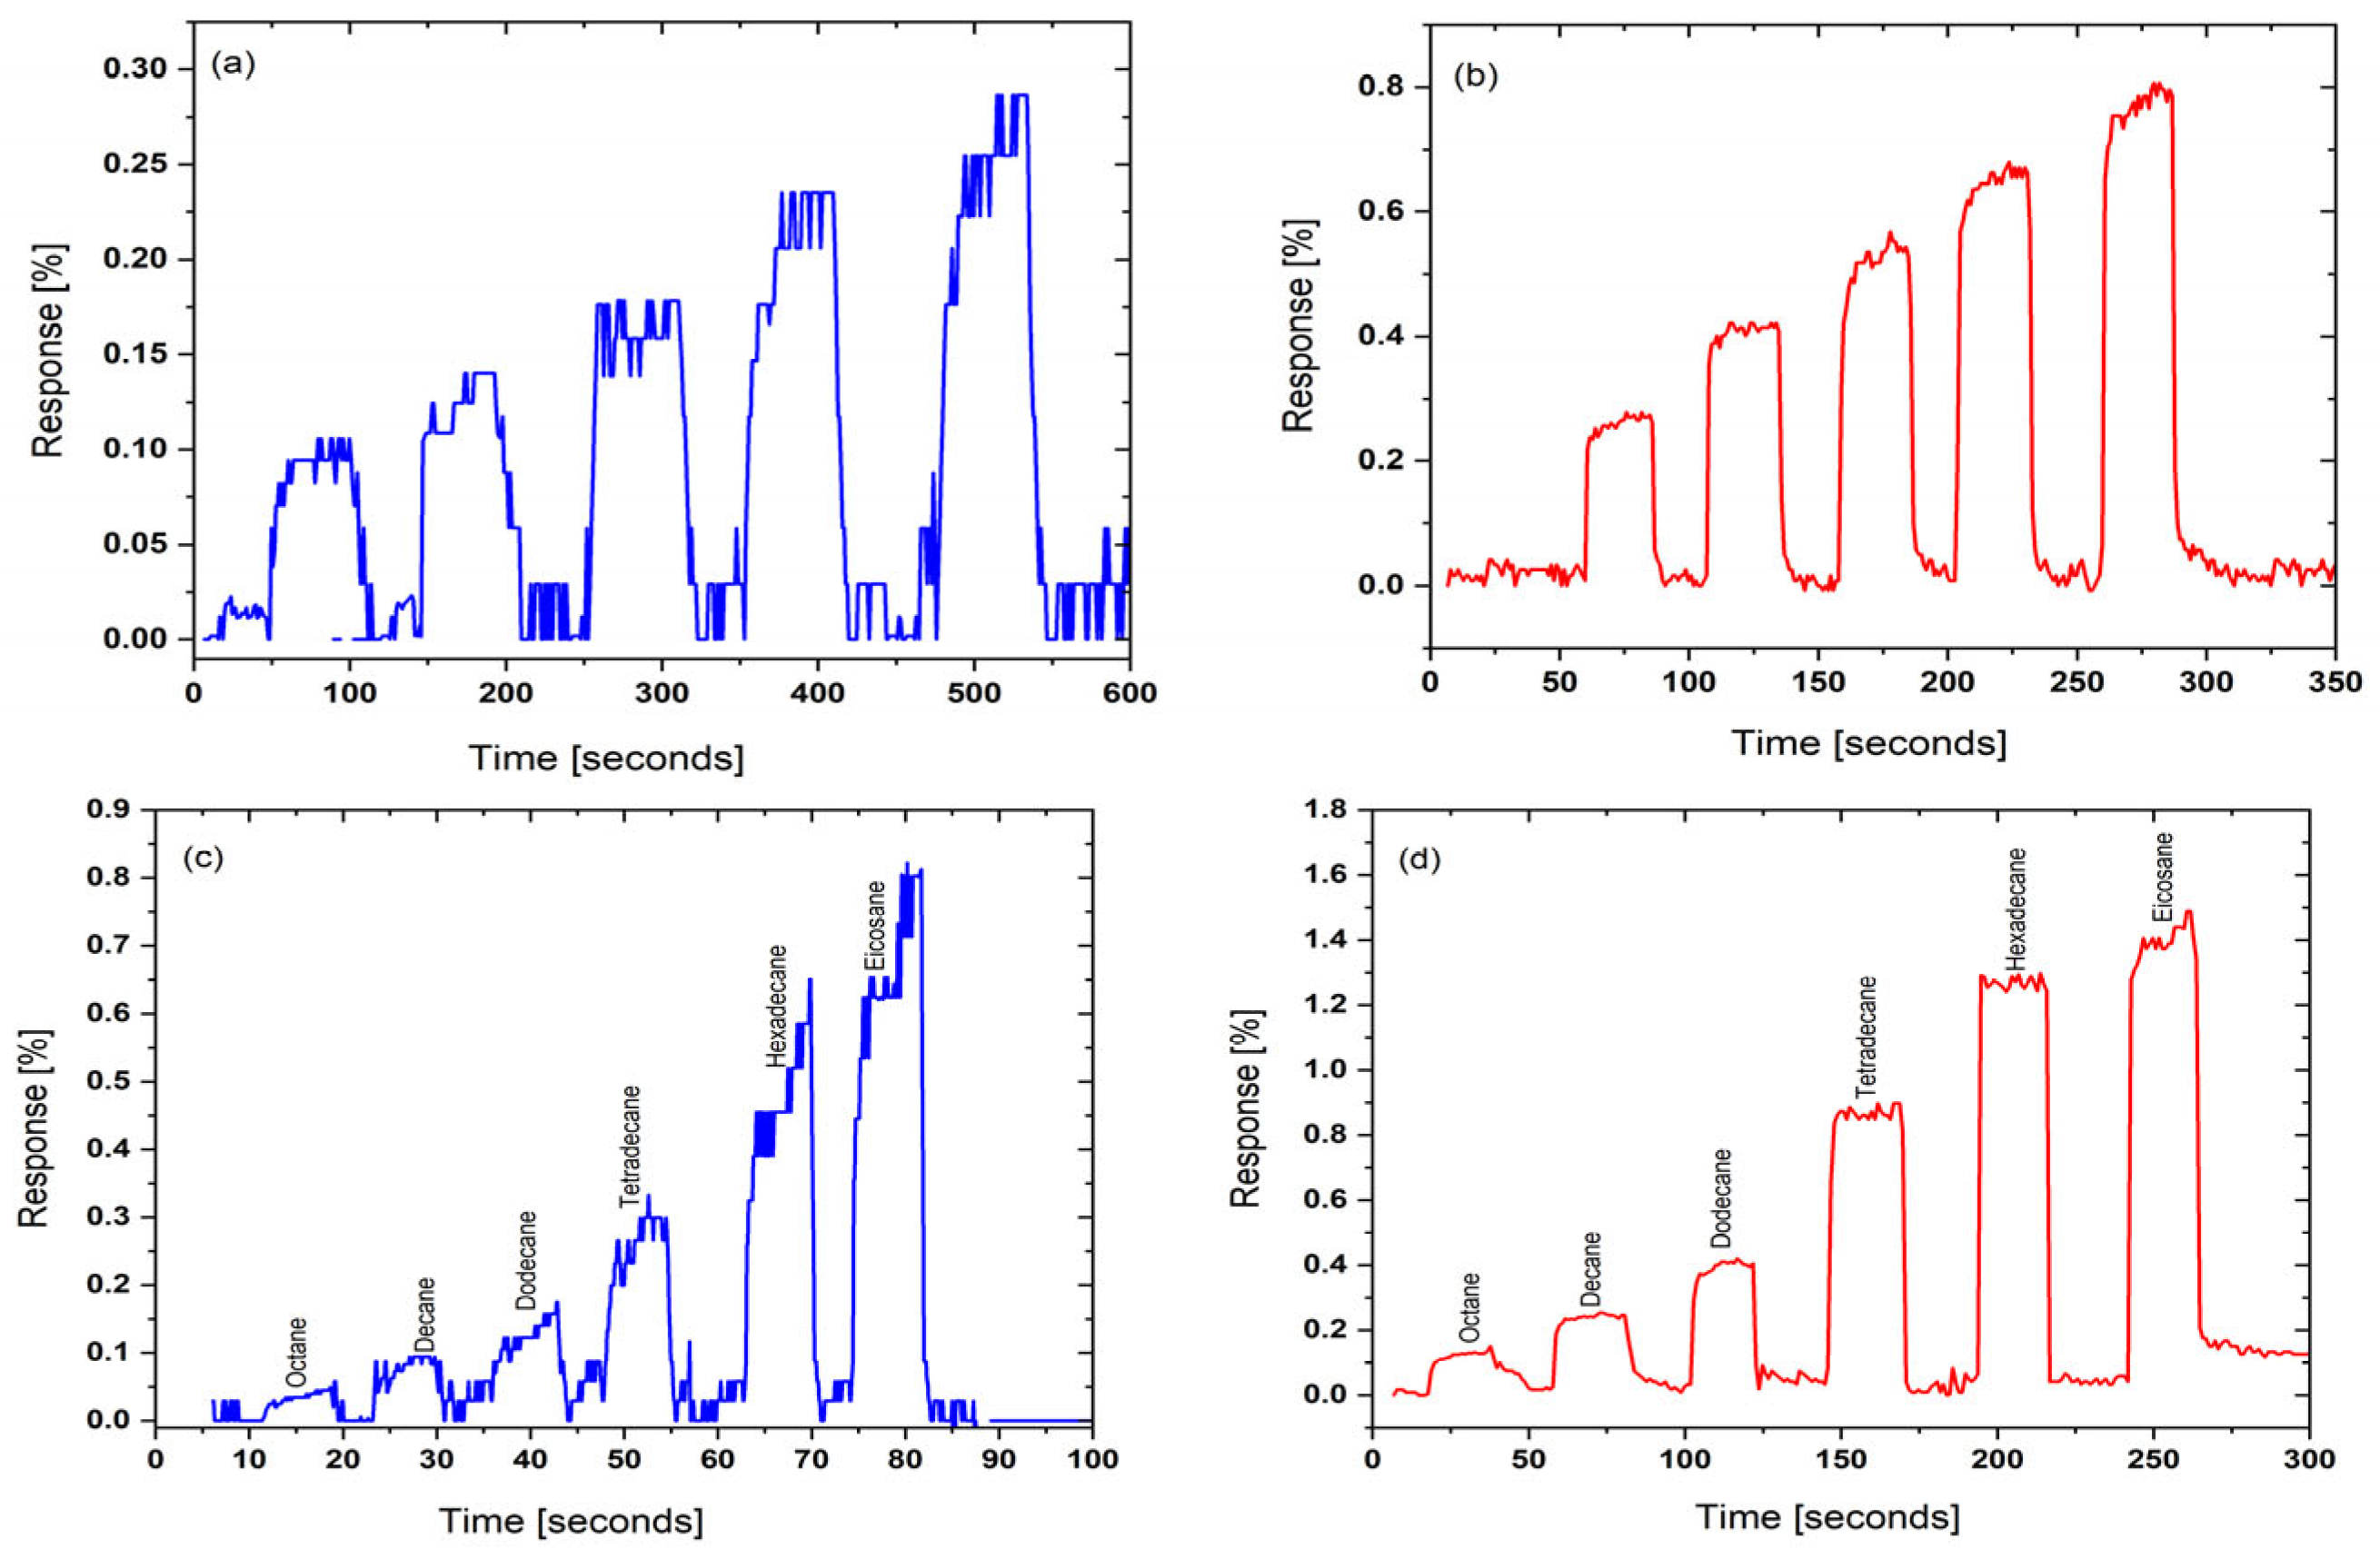
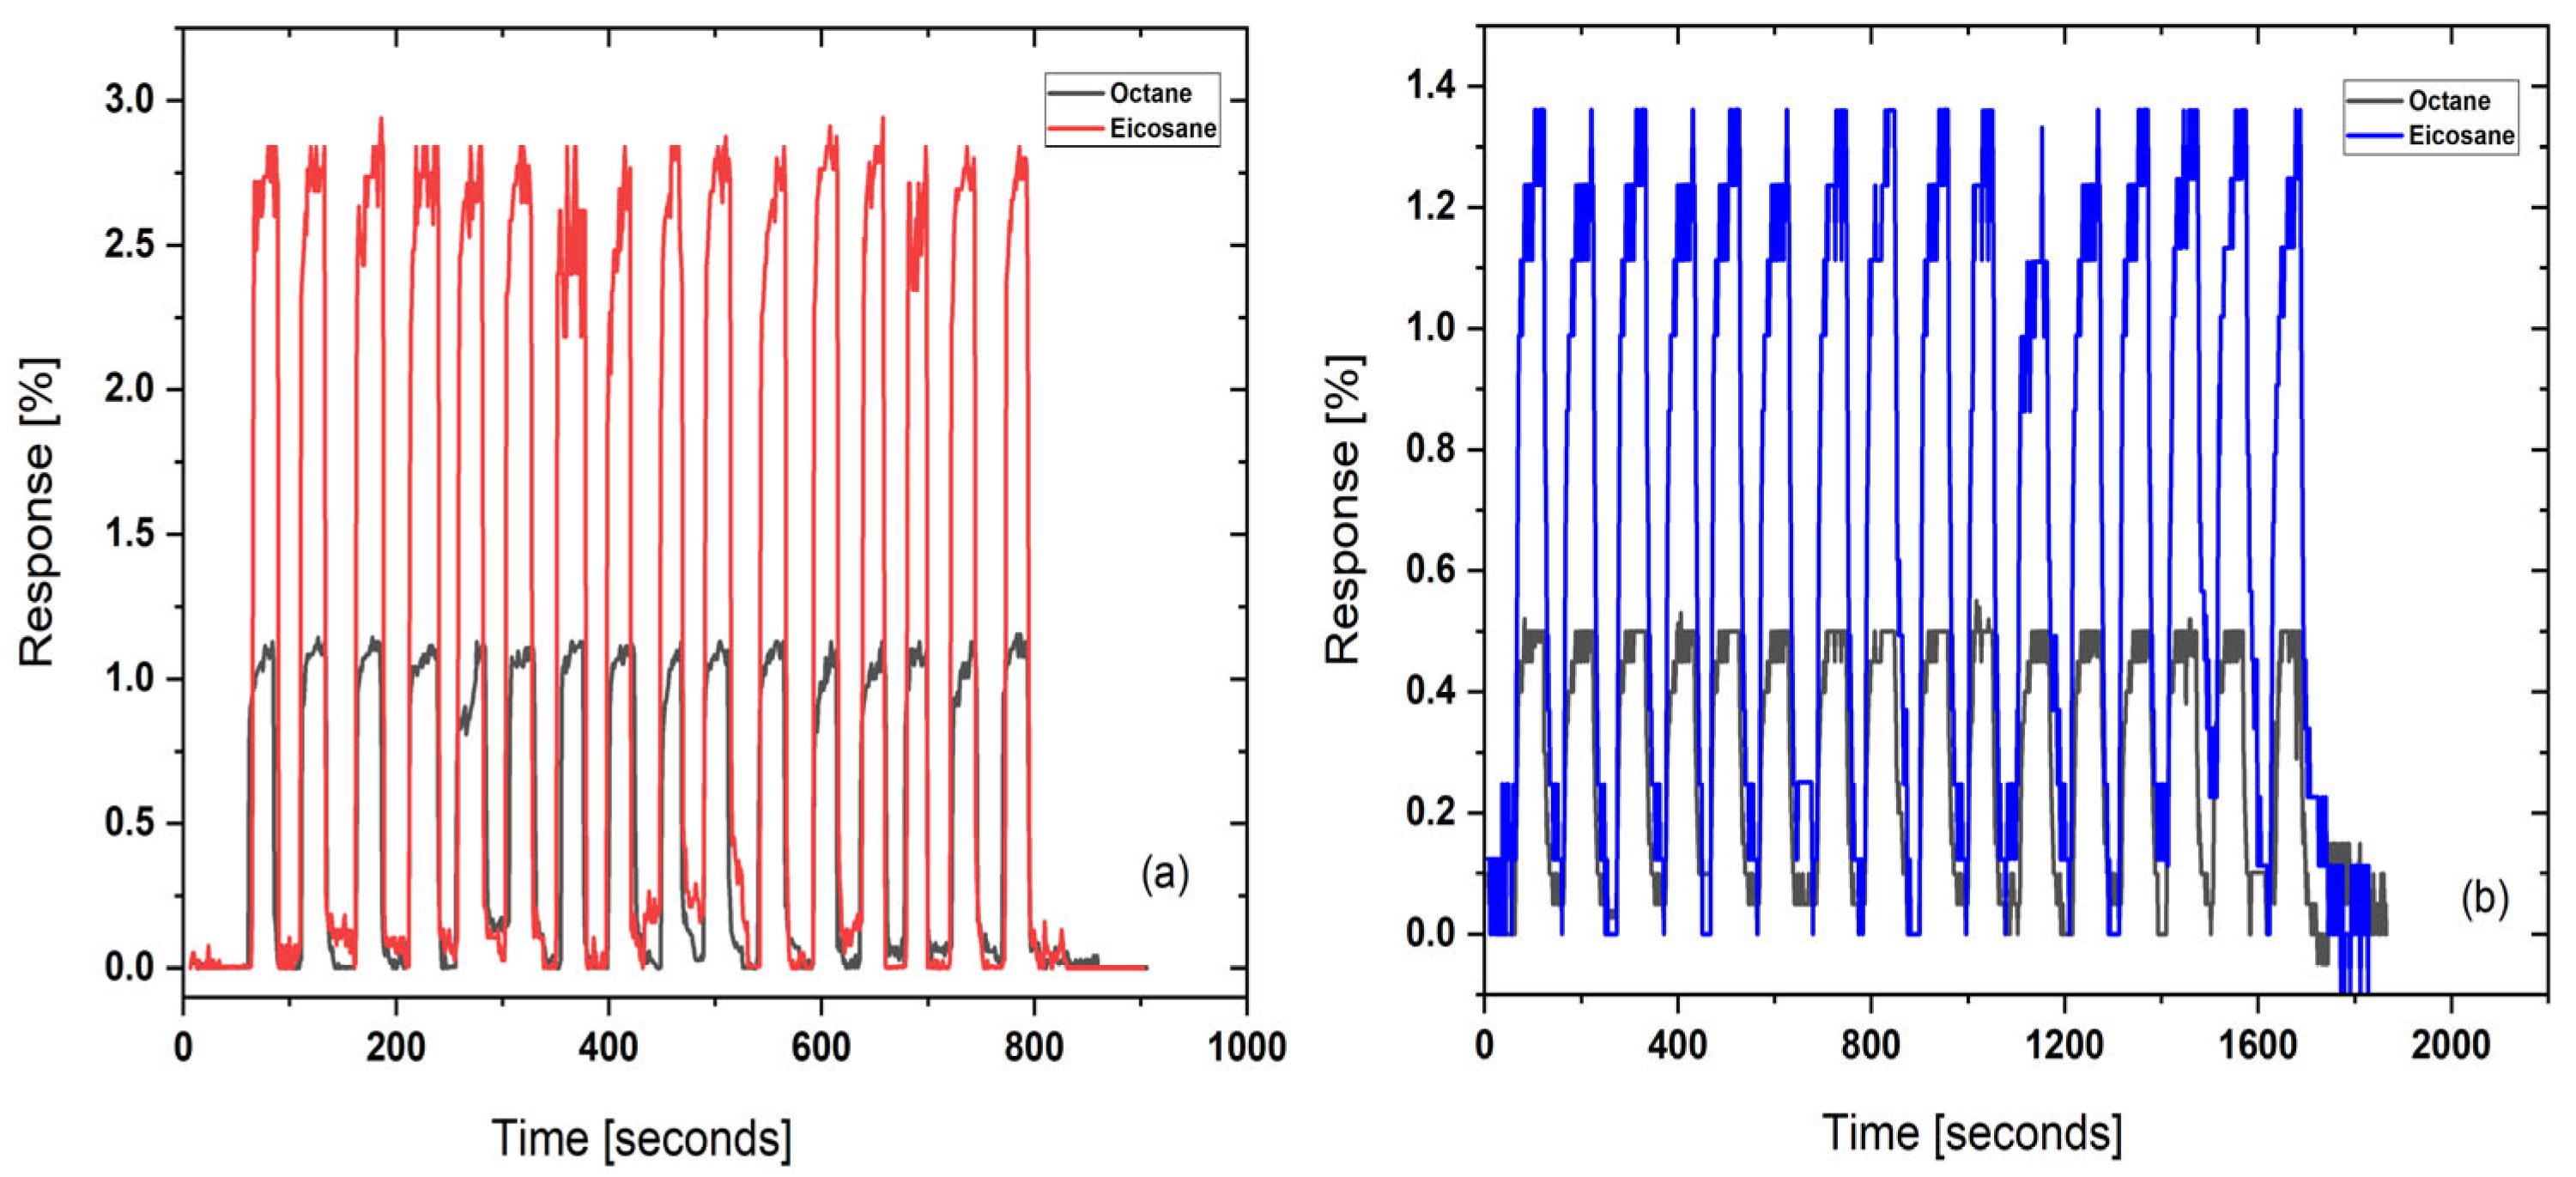
4.1. Sensor Performance

Before measurement, the sensors were exposed to water-contaminated soil (4 mL) in a 70 °C water bath to assess hydrophobic properties. While a slight drift in the CB-PMMA sensor response was observed after 40 s, sensitivity remained unchanged between dry and wet contaminated soil (Figure 4a,b). Similarly, baseline measurements in ambient air showed minimal resistance variation (Figure 4a–d). The measured water vapor concentration in the headspace was 0.197 g/L at 70 °C, closely matching the theoretical Moisture Carrying Capacity of air (0.1968 g/L). These results confirm that water vapor did not interfere with sensor performance, making it suitable for deployment in humid environments such as oil refineries.
CB-PMMA and CB-PVC nanocomposites demonstrated effective sensor performance in detecting hydrocarbon contamination in soil. The comparison of sensor responses between contaminated and uncontaminated soil conditions revealed consistent signal outputs, as illustrated in Figure 4. This confirms the suitability of these nanocomposites as hydrocarbon sensor materials. The rapid swelling of the polymer upon exposure to hydrocarbon analytes necessitated the real-time monitoring of resistance variations. The sensors exhibited a proportional relationship with analyte concentration, expressed in ppmV, and this illustrates the fundamental sensing mechanism governing CB-PMMA and CB-PVC composite-based chemiresistors, emphasizing the role of polymer swelling in hydrocarbon absorption. The observed increase in electrical resistance upon hydrocarbon exposure is attributed to the volumetric expansion of the polymer matrix, which disrupts the conductive percolation pathways established by carbon black (CB) fillers. The sensor’s significant hydrophobic nature is evidenced by the minimal resistance alteration in Figure 4a,b when exposed to water-contaminated soils. This characteristic enhances their suitability for field applications, where environmental humidity variations often compromise sensor reliability. Furthermore, the reversible response observed in Figure 4c,d upon exposure to eicosane-contaminated soils is notable. The rapid response time (~1 s) and the complete recovery of baseline resistance upon analyte desorption suggest a well-balanced polymer–filler interaction, facilitating efficient adsorption–desorption kinetics. To the best of the authors’ knowledge, this study marks the first report of a CB-PMMA and CB-PVC sensor demonstrating a response to eicosane, thereby expanding the potential application scope of these composite materials.
Fabricating highly selective sensors for a single analyte using CB–polymer chemiresistors remains inherently challenging. However, the distinct response patterns exhibited by the nanocomposites toward different hydrocarbons suggest the possibility of tuning selectivity through polymer engineering. The diffusion rates of hydrocarbons varied based on the polymer matrix, indicating that the polymer–hydrocarbon interaction plays a critical role in sensor performance. This differential sensitivity underscores the potential for designing sensor arrays capable of distinguishing hydrocarbon species based on their molecular interactions with PMMA and PVC. The response variations observed in Figure 4c,d highlight the influence of polymer swelling on sensor performance, with distinct response fingerprints attributed to differences in film–hydrocarbon interactions. The correlation between signal amplitude and vapor concentration confirms that the sensing mechanism is governed by swelling-induced resistance changes rather than electrochemical reactions, reinforcing the suitability of CB-PMMA and CB-PVC for hydrocarbon detection. Figure 5a,b further demonstrate the differential sensitivity of CB-PMMA and CB-PVC to dodecane vapor, with CB-PMMA exhibiting a 2- to 6-fold higher response across the hydrocarbon series. This enhanced sensitivity suggests that CB-PMMA provides a more favorable diffusion and adsorption environment, likely due to its polymer matrix properties.
The sensor response trends indicate a gradual increase for lower-molecular-weight hydrocarbons (octane, decane, dodecane), followed by a pronounced surge for higher-molecular-weight compounds (tetradecane, hexadecane, eicosane). This behavior aligns with analyte-induced polymer swelling, which disrupts conductive pathways, leading to increased resistance as the composite reaches the percolation threshold [48,59,64]. The linear concentration–response relationship confirms that swelling governs the conduction mechanism by reducing available pathways. Variations in response arise from differential hydrocarbon–polymer interactions, consistent with expected sorption effects in ideal sorbent–solute systems [94,95]. The ability to detect low concentrations of small hydrocarbons and higher concentrations of larger ones is thermodynamically driven, with low-vapor-pressure hydrocarbons exhibiting higher partition coefficients within the polymer matrix [96,97]. Hydrophobicity significantly influences sensor behavior, as molecular similarity between the polymer and hydrocarbons enhances sorption, particularly for larger analytes [98,99,100]. The two sets of sensors were subjected to a multicycle test (16 cycles) to assess their repeatability in detecting eicosane hydrocarbons at both the lowest and highest concentrations, as shown in Figure 6. The results indicate that the sensors consistently responded to the analyte, aligning with the repeatability criteria outlined in ISO3534-1 [101]. To evaluate sensor stability and potential degradation over time, response measurements were conducted weekly, demonstrating that the polymer films maintained reproducible operation throughout the study.
The statistical analysis of the CB-PMMA sensor’s performance exhibited low standard deviations (0.040 for eicosane and 0.032 for octane), indicating minimal variability around their mean response values (2.86 for eicosane and 1.12 for octane). In contrast, CB-PVC sensors displayed slightly greater variability, with a standard deviation of 0.061 for eicosane relative to its mean of 1.303. However, CB-PVC sensors for octane maintained a low standard deviation of 0.019, demonstrating stability around its mean response of 0.513. These findings confirm that the sensors provided reliable and consistent responses across multiple cycles, with minimal variation, highlighting their potential for continuous hydrocarbon monitoring applications in industrial environments where stability and reproducibility are critical. The results demonstrate the high repeatability and stability of CB-PMMA and CB-PVC sensors for hydrocarbon detection, confirming their suitability for long-term deployment. The observed reversible swelling of the polymer matrix upon hydrocarbon exposure, followed by a return to baseline resistance upon desorption, indicates that the sensing mechanism is governed by a well-defined adsorption–desorption equilibrium. This behavior aligns with the established principles of chemiresistive polymer nanocomposites, where volumetric expansion disrupts conductive pathways, leading to measurable resistance changes. The ability of the sensors to reset autonomously without performance degradation highlights their robustness and potential for continuous monitoring applications. Sensor stability is a key consideration for practical applications, and the findings suggest that CB-PMMA and CB-PVC maintain consistent performance over multiple cycles with minimal baseline drift. The hydrophobicity of the polymer matrix likely contributes to this stability by mitigating the influence of moisture, a common source of interference in environmental sensing. However, external factors such as prolonged exposure to air, heat, and light pose potential risks of polymer degradation, which could lead to structural changes affecting sensor response. This highlights the importance of material optimization to enhance durability and long-term functionality. Additionally, minor deviations in response at higher hydrocarbon concentrations suggest that excessive polymer swelling may induce irreversible morphological alterations, impacting sensor recovery. Such effects are consistent with those seen in previous studies on conducting polymer composites, where high analyte exposure can lead to hysteresis in response behavior. Addressing this challenge through tailored polymer formulations and optimized filler dispersion could further improve sensor reversibility and response uniformity.

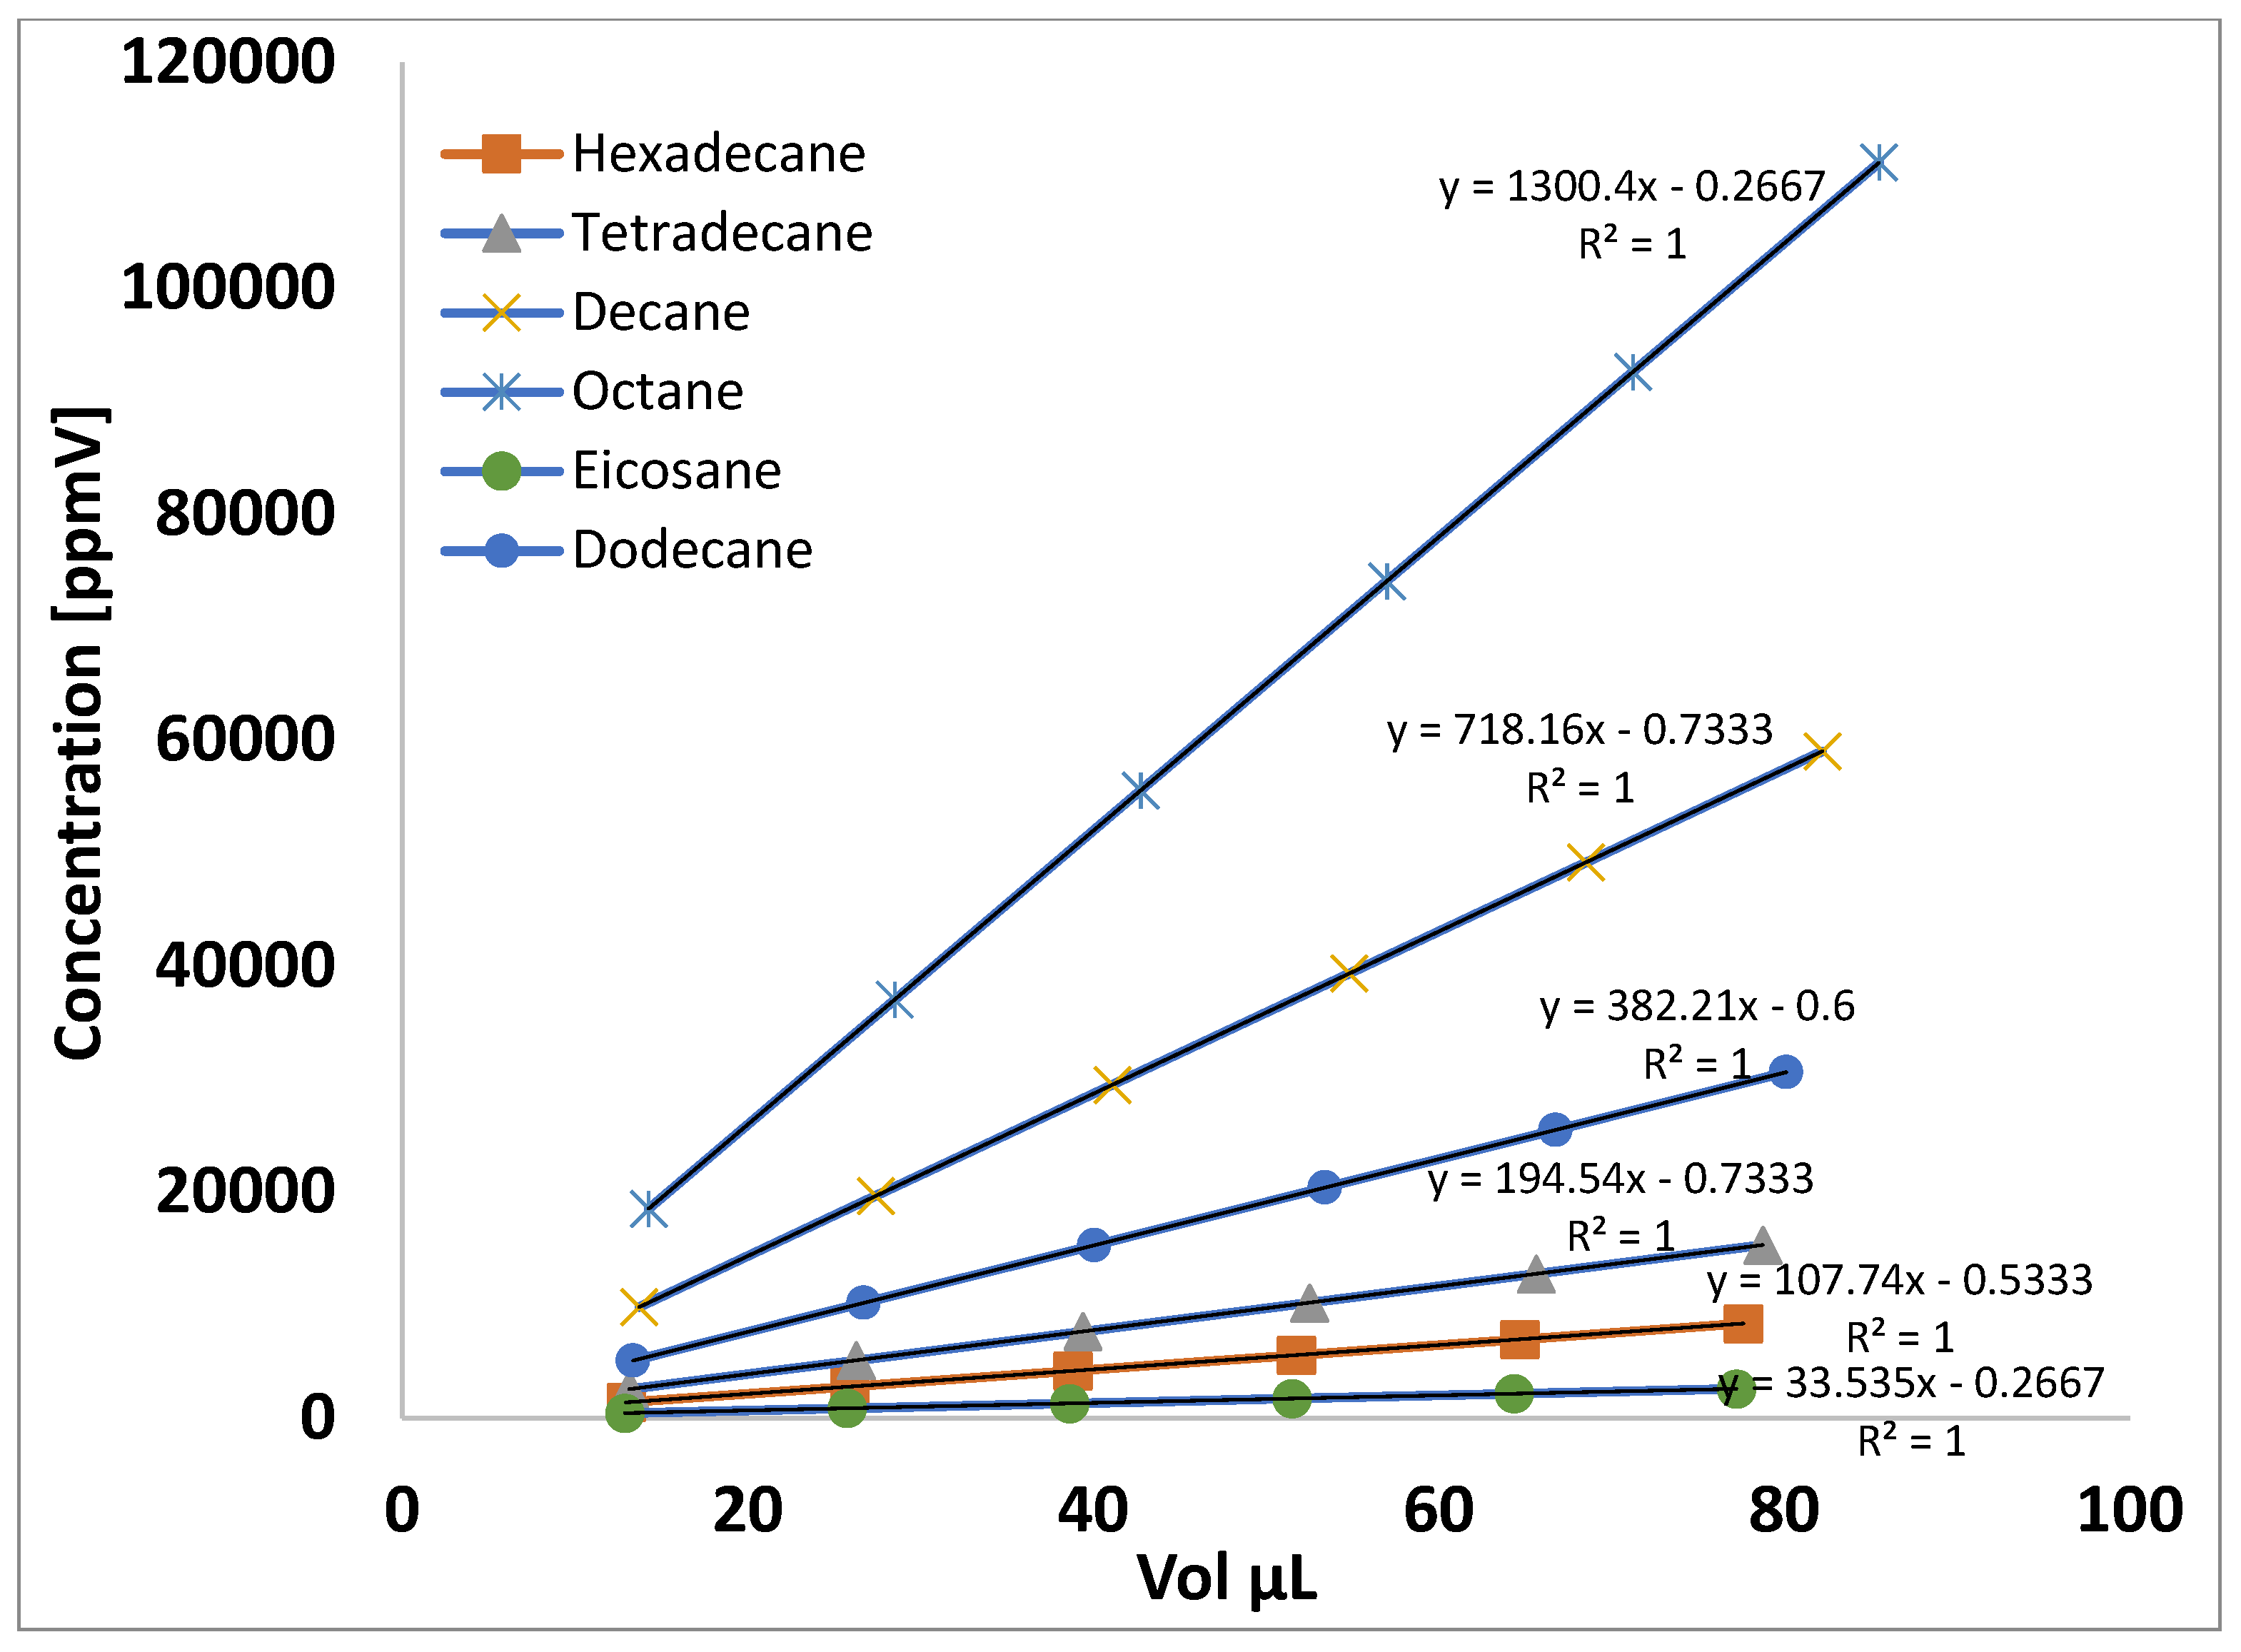
4.2. Calculation of Concentration Using the Antoine Equation

The concentration of the vapor phase was calculated using the Antoine equation, given by
Log10 (P) = A − (B/(T + C)
where P represents the vapor pressure in mmHg, T denotes the temperature in Kelvin, and A, B and C are the targeted hydrocarbons. The constants for the hydrocarbons are taken from the Iranian Chemical Engineering Website (www.IrChe.com) and are presented in Table 1.
The experiment was conducted at 70 °C and the vapor pressures of the targeted compounds were determined using the Antoine equation. These pressures were subsequently converted to concentrations using the ideal gas law in the form C = P/RT, where R represents the gas constant (0.0821 L·atm·K−1·mol−1) and T denotes the absolute temperature in Kelvin. Table 2 presents the calculated vapor pressure of the target compounds at 70 °C while Figure 7 illustrates the corresponding concentrations. The uncertainties associated with temperature measurements were ±0.1 °C, resulting in an estimated ±2% uncertainty in the calculated concentrations.

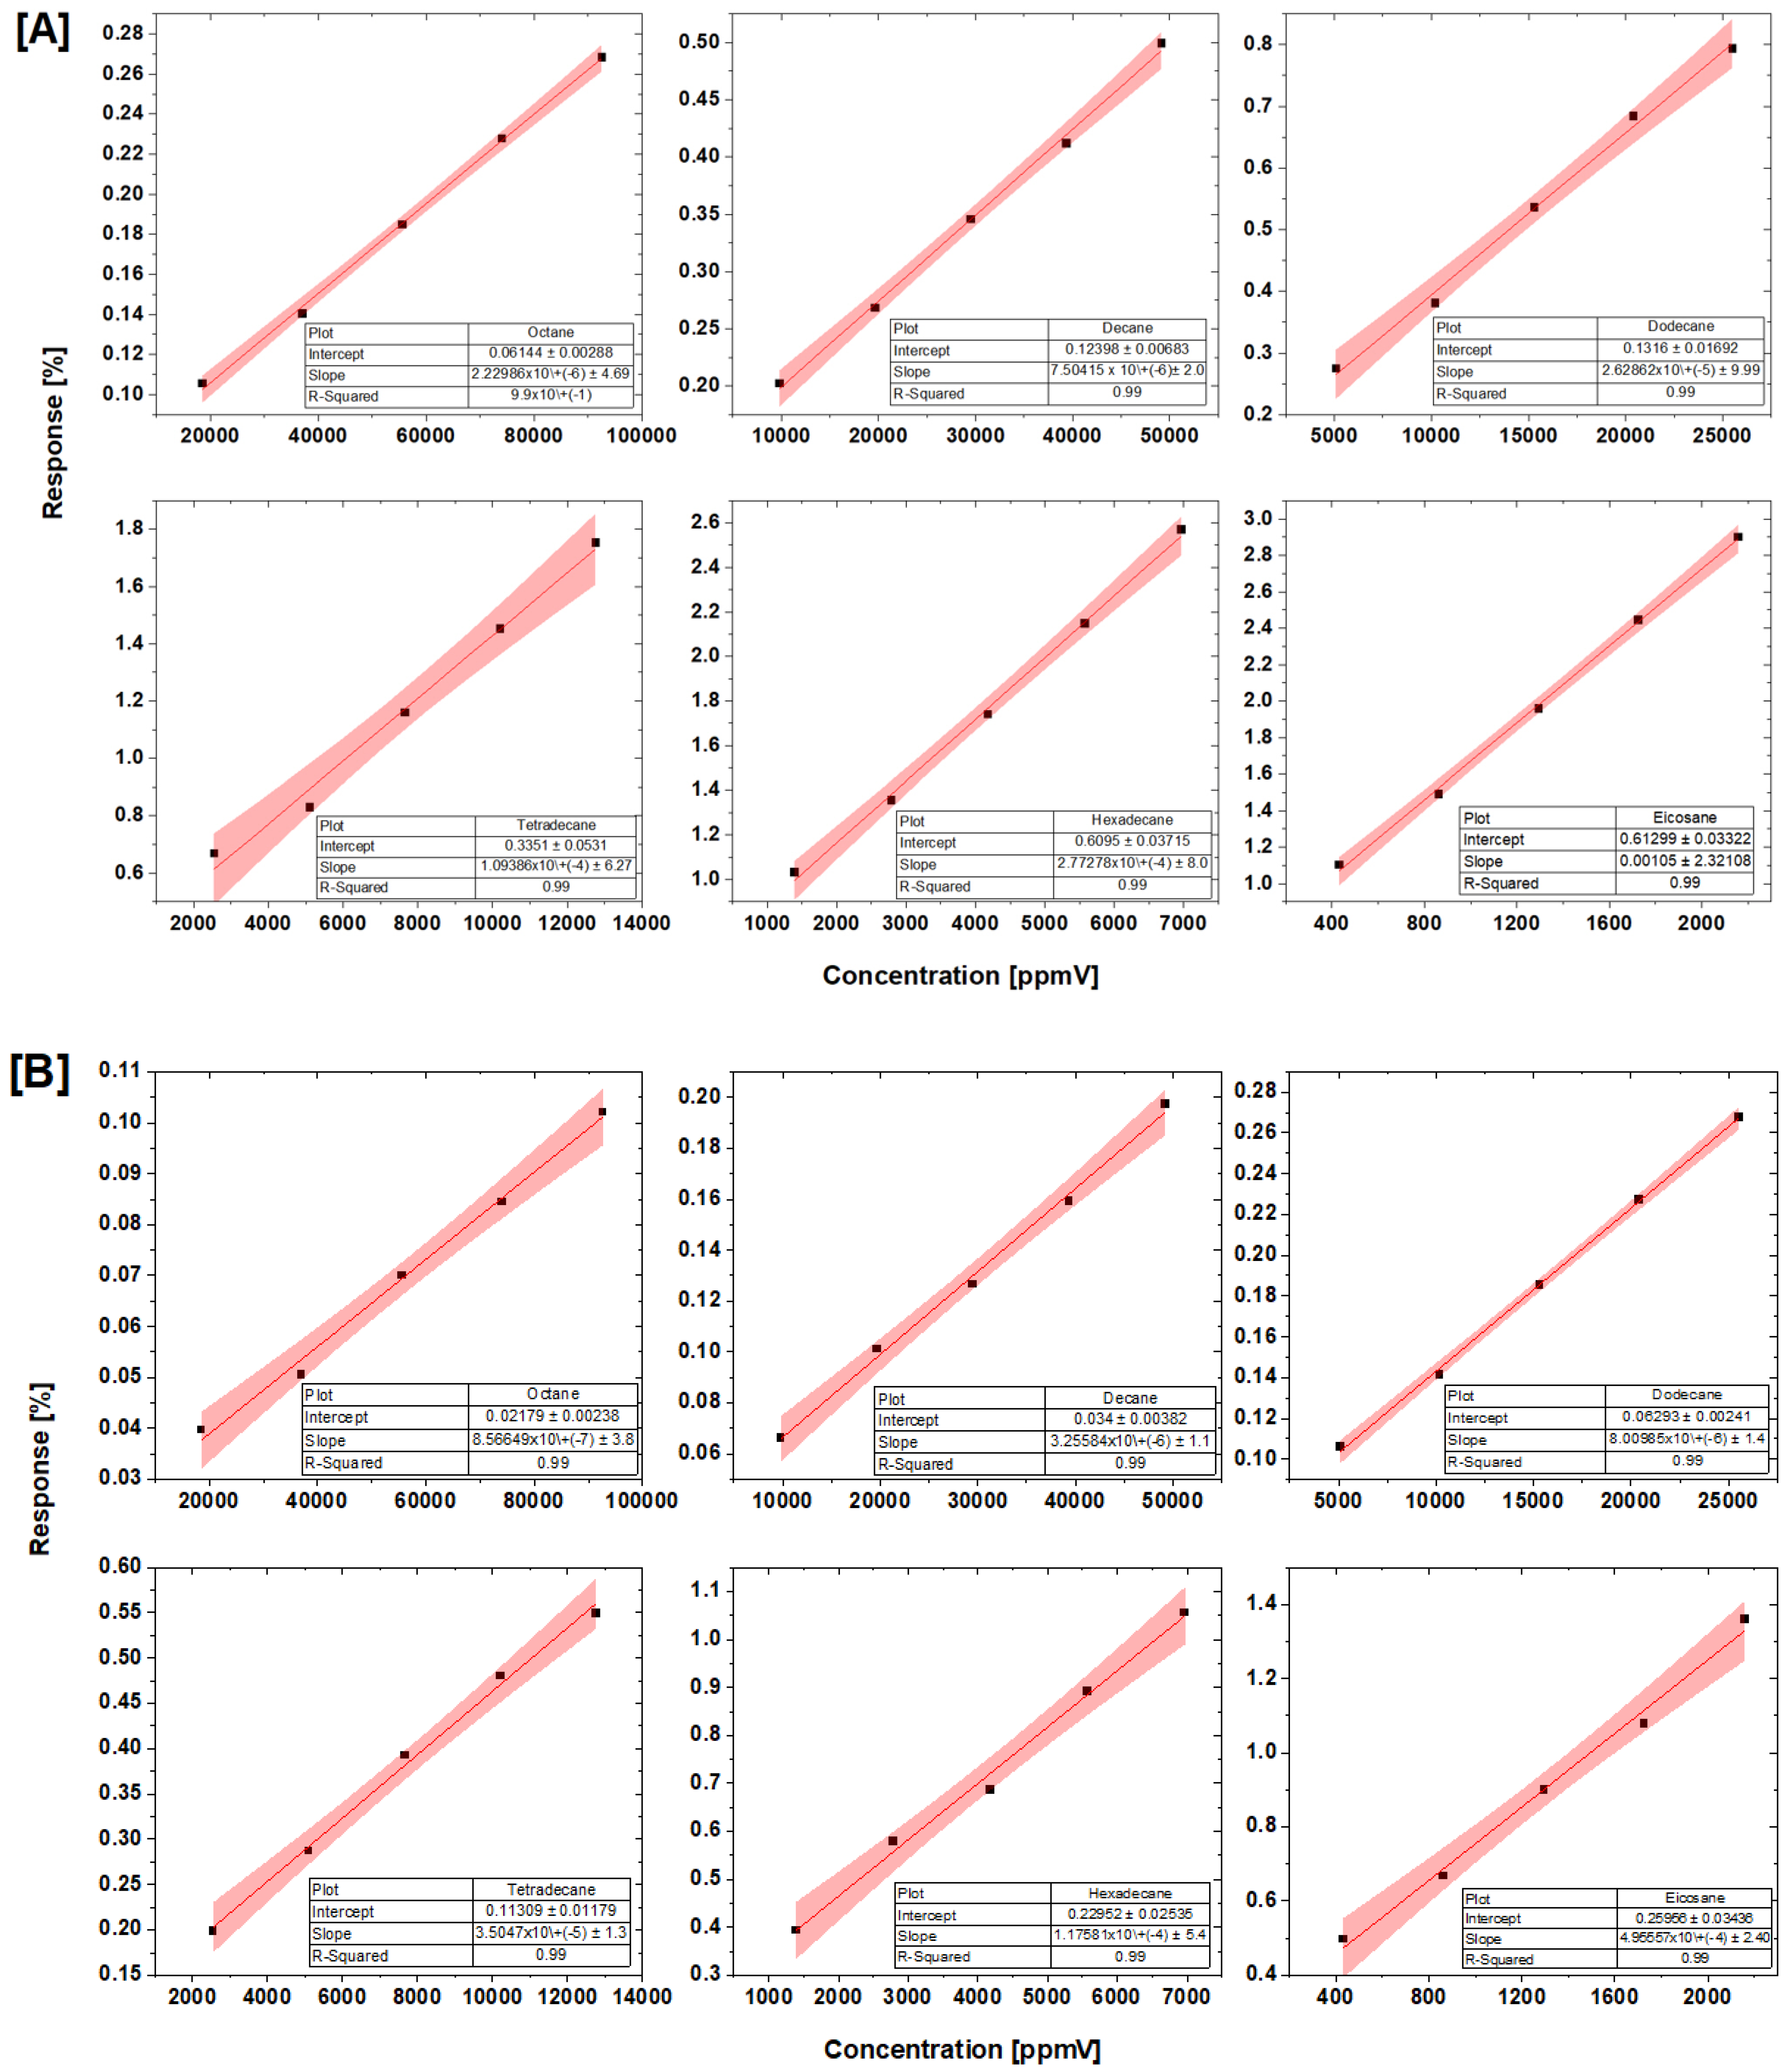
4.3. Concentration–Response Analysis

Figure 8A,B illustrate the linear concentration–response profiles of CB-PMMA and CB-PVC sensors when exposed to hydrocarbon vapors. The variations within the sample matrix systems exerted measurable effects on the relative sensor responses, with each sensor exhibiting distinct behavior towards the targeted analytes. The conducting polymer composite films were subject to swelling upon exposure to hydrocarbons, a phenomenon that displayed a direct linear correlation with analyte concentration in contact with the chemiresistor. This observation is consistent with those from previously reported studies on polymer composite-based chemiresistors [51,59,62,63,64,65]. The proportional response observed across different analyte concentrations confirms the suitability of CB-PMMA and CB-PVC sensors for quantitative hydrocarbon detection. The distinct sensor response characteristics suggest that the nature of the polymer matrix and its interaction with the conductive filler significantly influence the sensing mechanism.
In addition, as shown in Figure 8, the response profiles of CB-PMMA (A) and CB-PVC (B) sensors to varying concentrations of the hydrocarbon compounds (C8–C20) demonstrate a strong linear correlation (R2 ≈ 0.99) for both sensor types. The high correlation coefficient indicates that CB-PMMA and CB-PVC sensors exhibit highly consistent and proportional responses across the tested concentration range, confirming their effectiveness in detecting hydrocarbons of varying chain lengths. It is clear that CB-PVC exhibits slightly lower precision compared to CB-PMMA; however, it maintains robustness across broader operational conditions, suggesting potential for further refinement through calibration and material optimization. Enhancing the accuracy of concentration generation and environmental control during measurements could significantly reduce the variability in CB-PVC sensor responses, thereby narrowing its confidence bands. While such improvements may not directly enhance the sensor’s intrinsic performance, they would increase data reliability, allowing for more precise evaluations and comparisons with CB-PMMA. These results help us to evaluate the significance of targeted sensor design and systematic optimization in tailoring performance for specific applications.

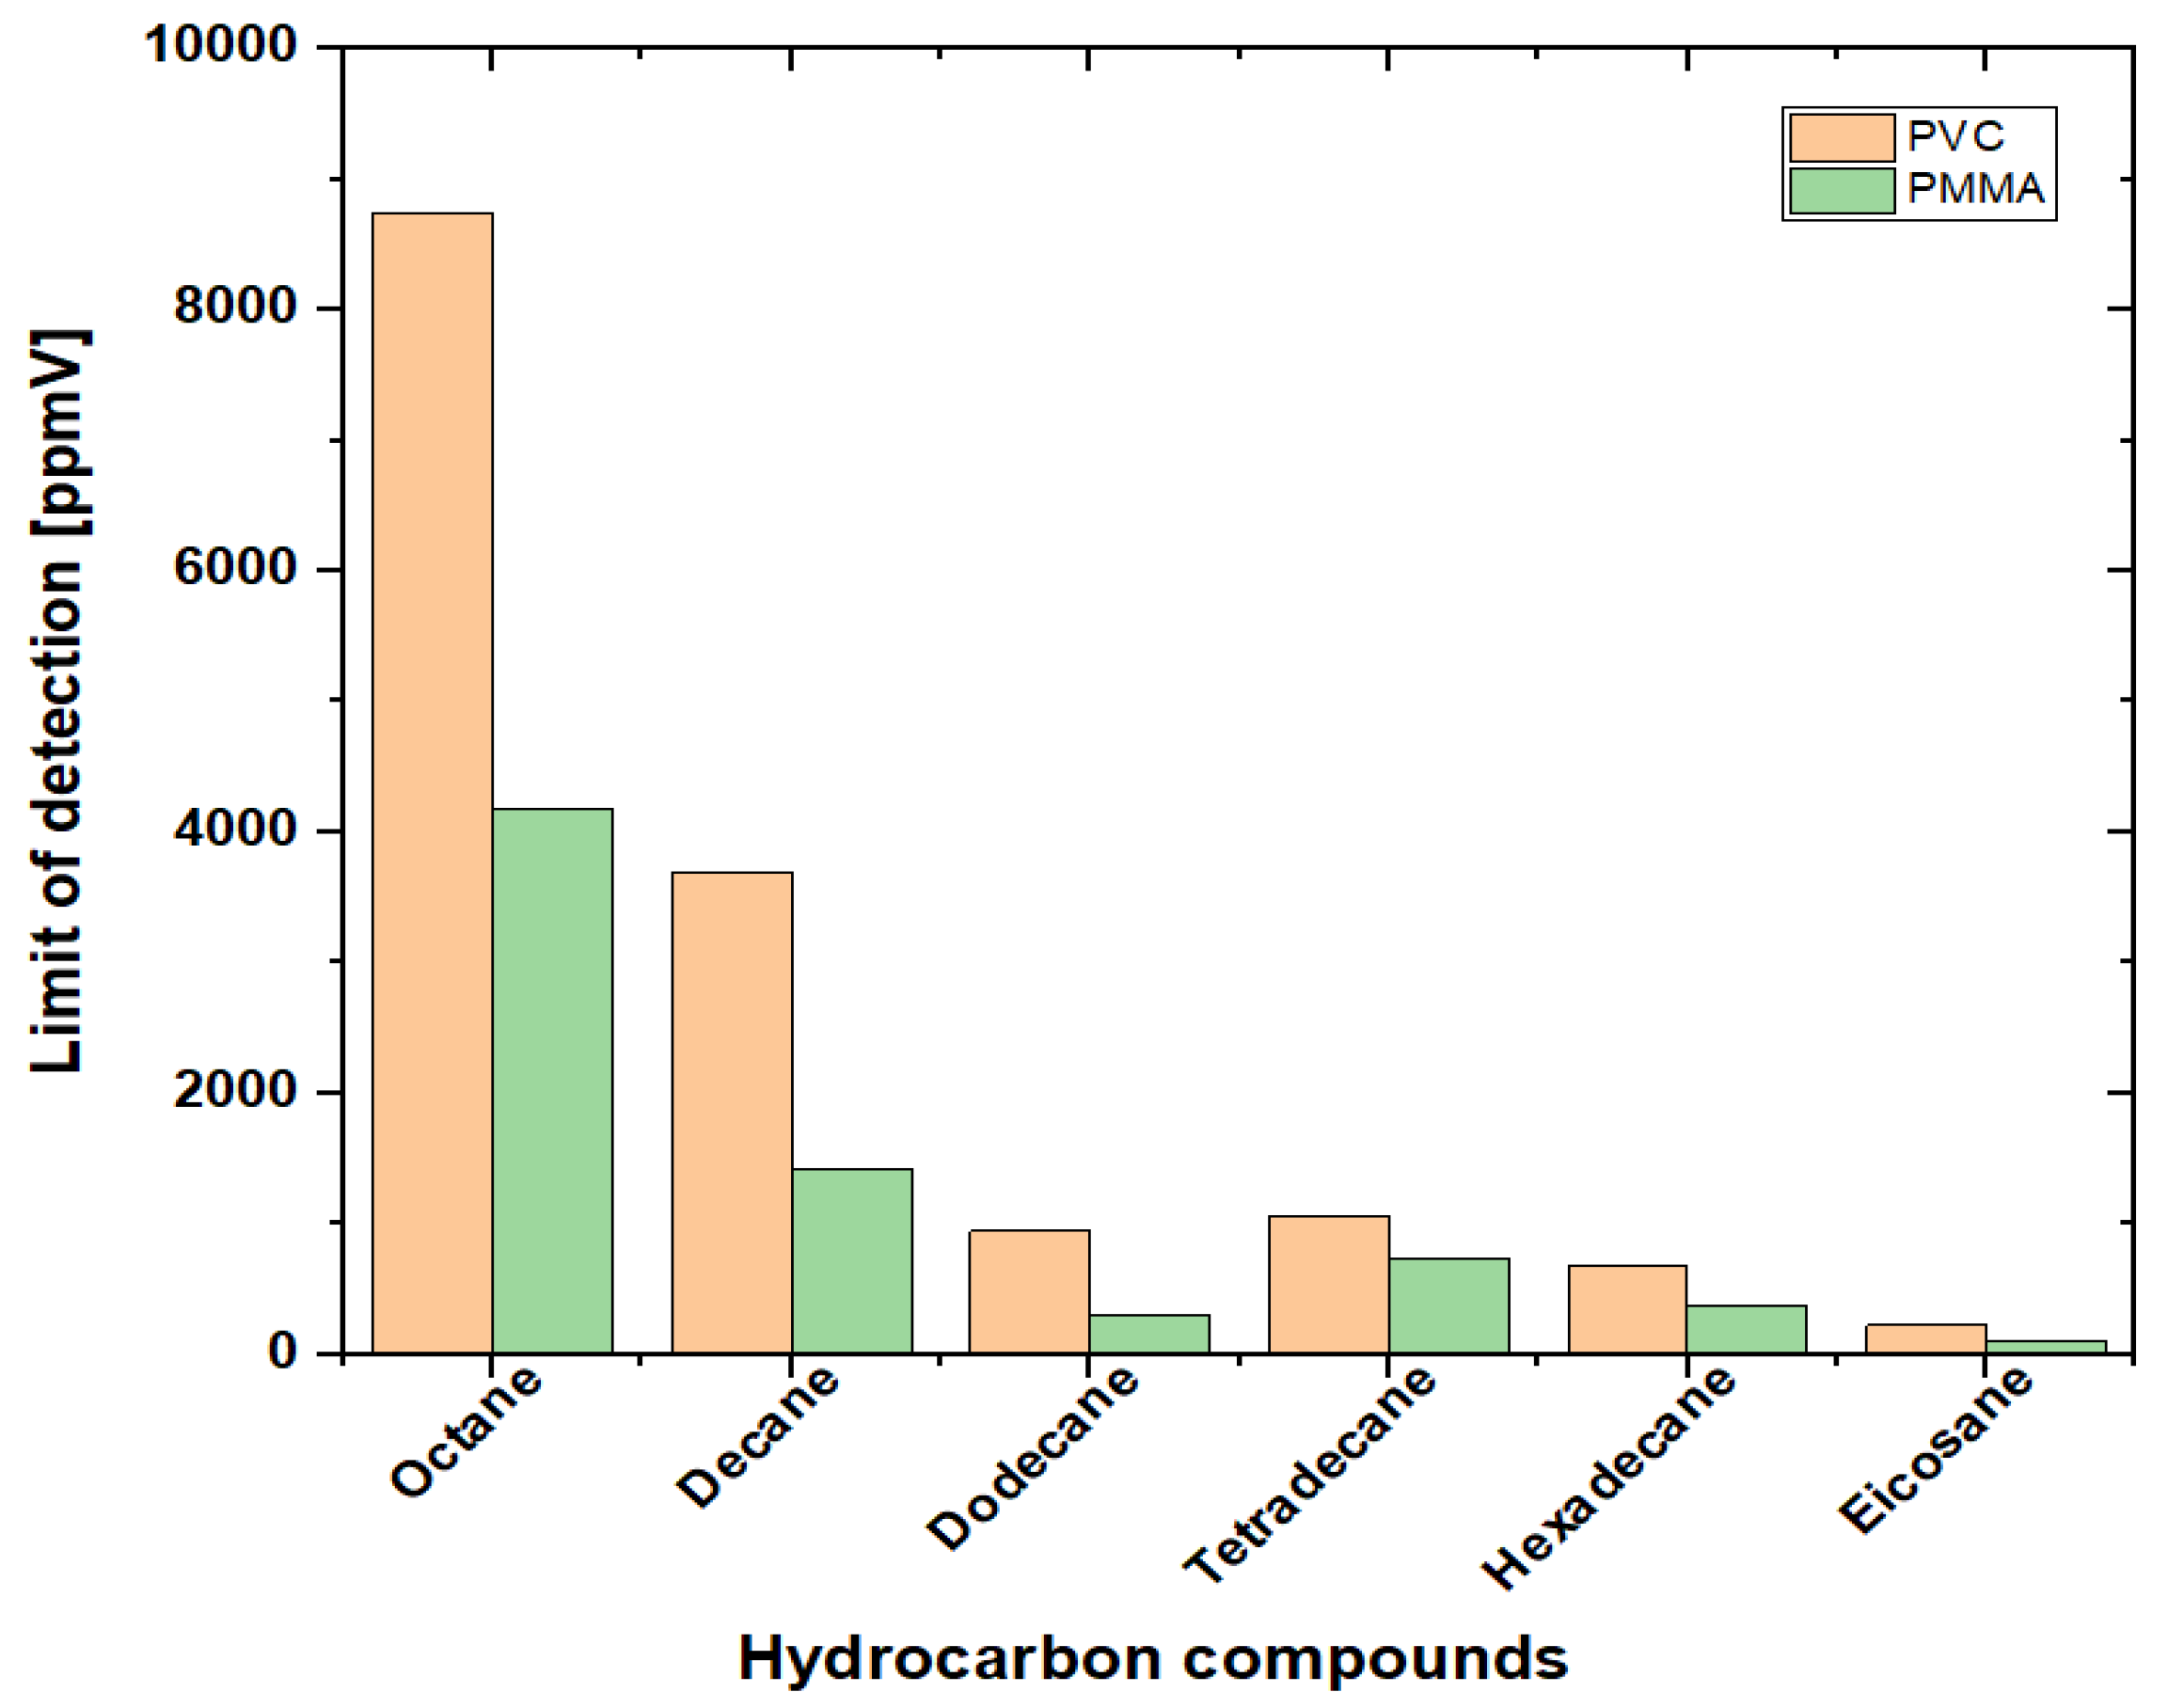
4.4. Limit of Detection (LOD)

The limit of detection (LOD) for the CB-PMMA and CB-PVC chemical sensors was determined based on the calibration curve data (Figure 8), employing a statistical approach that incorporates the slope (m) of the regression model and the standard error of the estimate (STEYX). The limit of detection (LOD) was calculated using the formula LOD = (3 × STEYX/m), where m represents the slope of the calibration curve, and STEYX quantifies the variability of the sensor response relative to the fitted regression model, thereby providing an accurate estimation of detection sensitivity.
The experimental results demonstrate rapid response times for both CB-PMMA and CB-PVC sensors, ranging from 30 to 90 s, which can be attributed to the efficient diffusion of hydrocarbon vapors into the polymer matrices. The LOD values, as illustrated in Figure 9, confirm that both sensor systems exhibit adequate sensitivity for the detection of hydrocarbons at concentrations relevant to environmental monitoring applications, particularly for soil contamination assessment. Furthermore, the stability of baseline responses under varying humidity conditions reinforces the robustness and practical applicability of these sensors in real-world settings. The observed performance characteristics suggest that CB-PMMA and CB-PVC sensors possess significant potential for deployment in environmental sensing applications, where rapid and reliable hydrocarbon detection is critical.

5. Conclusions

This research investigated a simple and cost-effective approach for developing conducting polymer composite sensors that can detect petroleum hydrocarbons. Two sets of sensors were fabricated from CB-PMMA and CB-PVC films and then used to detect the presence of different hydrocarbons in a contaminated soil. The results show that optimal sensor performance was achieved with a composition of 10% w/w carbon black and 90% w/w polymer, whereas the limit of detection for the tested range of hydrocarbons was from C20 (99 ppmV) to C8 (8750 ppmV), which was sufficient for detecting traces of hydrocarbons in soil. The experimental data clearly demonstrate that the targeted hydrocarbon vapors were robustly detected and differentiated from each other with both CB-PVC and CB-PMMA chemiresistors. This indicates that the polymer–hydrocarbon interaction was reversible. A significant finding of this study was the detection of eicosane vapors by CB-PMMA and CB-PVC sensors, representing a novel contribution to the field, as this interaction has not been previously reported in the literature. Additionally, the reusability of the sensors enhances their cost-effectiveness, making them suitable for prolonged application, which represents a major contribution to knowledge in this field and the first time this result has been reported in literature, to the best of the authors’ knowledge. The results show that the CB-PMMA and CB-PVC sensors are reuseable, which makes them very economical during application. Overall, this research establishes that CB–polymer-based chemiresistors provide an efficient and low-cost solution for detecting and monitoring petroleum hydrocarbon contaminants in soil while achieving regulatory detection limits. These sensors offer a promising platform for low-power environmental monitoring technologies, particularly in regions prone to oil spills, such as the Niger Delta.

6. Future Research Opportunities

The following are potential areas for future research seeking to enhance the capabilities of the sensors under study:
  • The integration of chemiresistors within an automated multisensor array system. This will allow sensor probes to be electrically connected to chambers deployed at different depths for real-time monitoring;
  • Fickian diffusion models can be used for analyzing the responses of films with parallel arrangements of swellable resistors, as well as statistical techniques like Fisher linear discriminant analysis, principal component analysis, and artificial neural network algorithms to facilitate discriminations between mixtures;
  • The integration of automated GPS loggers can facilitate the precise positioning and mapping of large sites, whilst automatic re-zeroing before each measurement could ensure baseline stability and the accuracy of measurements;
  • For practical applications, a single sensor may not adequately discriminate between the wide range of hydrocarbons in contaminated soils. Thus, there might be a need for further research into chemiresistors within a multisensor array environment, utilizing electronic nose technology for petroleum hydrocarbon detection and classification.

Author Contributions

Conceptualization, P.E.-I. and K.P.; methodology, P.E.-I. and K.P.; software, P.E.-I. and K.P.; validation, P.E.-I.; formal analysis, P.E.-I.; investigation, P.E.-I.; resources, P.E.-I.; data curation, P.E.-I.; writing—original draft preparation, P.E.-I.; writing—review and editing, P.E.-I. and K.P.; visualization, P.E.-I.; supervision, K.P.; project administration, P.E.-I. and K.P.; funding acquisition, P.E.-I. All authors have read and agreed to the published version of the manuscript.

Funding

Faculty for the Future Fellowship Program of the Schlumberger foundation, The Netherlands, No 41167008.

Institutional Review Board Statement

Not applicable.

Informed Consent Statement

Not applicable.

Data Availability Statement

The data presented in this study are available on request from the corresponding author.

Acknowledgments

Perpetual Eze-Idehen was funded through the Faculty for the Future Fellowship Program of the Schlumberger foundation, The Netherlands.

Conflicts of Interest

The authors declare no conflict of interest.

References

  1. Presidency Ministry (Spain). Royal Decree 9/2005 of 14 January Which Establishes a List of Potentially Soil Contaminating Activities and Criteria and Standards for Declaring That Sites Are Contaminated; Official State Bulletin: Madrid, Spain, 2005; pp. 1833–1843. [Google Scholar]
  2. Weisman, W. Analysis of Petroleum Hydrocarbons in Environmental Media. Total Petroleum Hydrocarbon Criteria Working Group (TPHCWG) Series, 1; Amherst Scientific Publishers: Amherst, MA, USA, 1998; Available online: https://books.google.co.uk/books?id=CckOAQAAMAAJ (accessed on 10 April 2025).
  3. Dutch Ministry of Housing Spatial Planning and the Environment (VROM). Soil Remediation Circular 2009. Staatscourant 3 April 2012, Nr. 6563; Ministry of Housing Spatial Planning and the Environment: The Hague, The Netherlands, 2012. [Google Scholar]
  4. Alinnor, I.J.; Ogukwe, C.E.; Nwagbo, N.C. Characteristic Level of Total Petroleum Hydrocarbon in Soil and Groundwater of Oil Impacted Area in the Niger Delta Region, Nigeria. J. Environ. Earth Sci. 2014, 4, 188–195. [Google Scholar]
  5. Lieutenant, C.; Ross, N.M.; USAF, BSC for The Air Force Center For Environmental Excellence. Using Risk-Based Standards Will Shorten Cleanup Time At Petroleum Contaminated Sites; 1994. Available online: https://hero.epa.gov/hero/index.cfm/reference/details/reference_id/2860096 (accessed on 1 April 2025).
  6. Falih, K.T.; Razali, S.F.M.; Maulud, K.N.A.; Rahman, N.A.; Abba, S.I.; Yaseen, Z.M. Assessment of petroleum contamination in soil, water, and atmosphere: A comprehensive review. Int. J. Environ. Sci. Technol. 2024, 21, 8803–8832. [Google Scholar] [CrossRef]
  7. Mitkidou, S.; Kokkinos, N.; Emmanouilidou, E.; Yohannah, Y.; Spanos, T.; Chatzichristou, C.; Ene, A. Investigation of Petroleum Hydrocarbon Fingerprints of Water and Sediment Samples of the Nestos River Estuary in Northern Greece. Appl. Sci. 2022, 12, 1636. [Google Scholar] [CrossRef]
  8. Mace, G.B.; Deborah, N.V.; Ron, A.H.; Yim, U.H. Long-Term Ecological Impacts from Oil Spills: Comparison of Exxon Valdez, Hebei Spirit, and Deepwater Horizon. Environ. Sci. Technol. 2020, 54, 6456–6467. [Google Scholar] [CrossRef]
  9. Response to Oil Spills. Understanding Oil Spills and Oil Spill Response; United States Environmental Protection Agency: Washington, DC, USA, 1999; Volume 7, pp. 37–44.
  10. Majors, R.E. Sample Preparation Fundamentals for Chromatography; Agile Technology: Aliso Viejo, CA, USA, 2013; p. 5991-3326EN. [Google Scholar]
  11. Almeida, C.M.M. Overview of sample preparation and chromatographic methods to analysis pharmaceutical active compounds in waters matrices. Separations 2021, 8, 16. [Google Scholar] [CrossRef]
  12. Yin, J.; Wu, M.; Lin, R.; Li, X.; Ding, H.; Han, L.; Yang, W.; Song, X.; Li, W.; Qu, H. Application and development trends of gas chromatography–ion mobility spectrometry for traditional Chinese medicine, clinical, food and environmental analysis. Microchem. J. 2021, 168, 106527. [Google Scholar] [CrossRef]
  13. Tovar-Lopez, F.J. Recent Progress in Micro- and Nanotechnology-Enabled Sensors for Biomedical and Environmental Challenges. Sensors 2023, 23, 47–49. [Google Scholar] [CrossRef]
  14. Petrosense. Portable Hydrocarbon Analyzer PHA-100Plus. Available online: https://www.petro-online.com/news/analytical-instrumentation/11/petrosense/chile-selects-portable-hydrocarbon-analyser-to-improve-environmental-performance/30813 (accessed on 5 April 2025).
  15. PETROSENSE® PHA-100Plus—Portable Hydrocarbon Analyzer Training Guide. Environ. Protect. 2011, 75243, 1–48.
  16. FCI Environmental Inc. PetroSense® CMS-4000 Continuous Monitoring System. Brochure 2005. p. 2. Available online: https://www.airmet.com.au/assets/documents/product/165/file_1438308455_752.pdf (accessed on 4 April 2024).
  17. Khudur, L.S.; Ball, A.S. RemScan: A tool for monitoring the bioremediation of Total Petroleum Hydrocarbons in contaminated soil. MethodsX 2018, 5, 705–709. [Google Scholar] [CrossRef]
  18. Chýlková, J.; Cuhorka, J.; Mikulášek, P. The effect of surfactants upon spectrophotometric monitoring of the efficiency of removal of crude petroleum products from waste water by means of pressure-driven membrane processes. Wseas Trans. Environ. Dev. 2014, 10. [Google Scholar]
  19. Arrieta, M.; Swanson, B.; Fogg, L.; Bhushan, A. Review of linear and nonlinear models in breath analysis by Cyranose 320. J. Breath Res. 2023, 17, 36005. [Google Scholar] [CrossRef]
  20. Yaqoob, U. Chemical Gas Sensors: Recent Developments, Challenges. Sensors 2021, 21, 2877. [Google Scholar] [CrossRef] [PubMed]
  21. Wei, Y.; Shi, X.; Yao, Z.; Zhi, J.; Hu, L.; Yan, R.; Shi, C.; Yu, H.-D.; Huang, W. Fully paper-integrated hydrophobic and air permeable piezoresistive sensors for high-humidity and underwater wearable motion monitoring. NPJ Flex Electron 2023, 7, 13. [Google Scholar] [CrossRef]
  22. Farzi, G.; Gheysipour, M. Encapsulation with Polymers; Elsevier: Amsterdam, The Netherlands, 2023; Volume 2. [Google Scholar] [CrossRef]
  23. Zhang, Y.; Wang, D.; Xu, Y.; Wen, L.; Dong, J.; Wang, L. Enhancement of the Surface Hydrophilicity of Poly (Vinyl Chloride). Using Hyperbranched Polylysine with Polydopamine. Coatings 2024, 1, 103. [Google Scholar] [CrossRef]
  24. Liu, X.M. Mechanical response of composite materials prepared with polyurethane elastomers and polyvinyl chloride films. J. Mech. Behav. Biomed. Mater. 2023, 146, 106006. [Google Scholar] [CrossRef]
  25. Rotaru, I.M.; Dobrotă, D.; Miriţoiu, C.M.; Dimulescu, C.S. Optimization of the composition of polyvinyl chloride based composite materials with rubber matrices and fly ash additions respectively. Polym. Test. 2023, 129, 108280. [Google Scholar] [CrossRef]
  26. Vergadou, N.; Theodorou, D.N. Molecular modeling investigations of sorption and diffusion of small molecules in Glassy polymers. Membranes 2019, 9, 98. [Google Scholar] [CrossRef]
  27. Saleem, M.; Asfour, A.A.; De Kee, D.; Harison, B. Diffusion of organic penetrant through lowdensity polyethylene (LDPE) films: Effect of size and shape of the penetrant molecules. J. Appl. Polym. Sci. 1989, 37, 617–625. [Google Scholar] [CrossRef]
  28. Park, J.K.; Nibras, M. Mass flux of organic chemicals through polyethylene geomembranes. Water Environ. Res. 1993, 65, 227–237. [Google Scholar] [CrossRef]
  29. Tammaro, D.; Lombardi, L.; Scherillo, G.; Di Maio, E.; Ahuja, N.; Giuseppe, M. Modelling sorption thermodynamics and mass transport of n-hexane in a propylene-ethylene elastomer. Polymers 2021, 13, 1157. [Google Scholar] [CrossRef]
  30. Aminabhavi, T.M.; Naik, H.G. Chemical compatibility testing of geomembranes- Sorption/desorption, diffusion and swelling phenomena. Geomembr. Geotext. 1998, 16, 333–354. [Google Scholar] [CrossRef]
  31. Frisch, H.L. Diffusion in Polymers. In Jounal of Applied Polymer Science; Crank, J., Park, G.S., Eds.; Academic Press: London, UK, 1968; Volume 14, p. 452. [Google Scholar]
  32. Crank, J. The Mathematics of Diffusion; Clarendon Press: Oxford, UK, 1975. [Google Scholar]
  33. Comyn, J. Polymer Permeability; Elsevier: Essex, UK, 1985. [Google Scholar]
  34. Neogi, P. Diffusion in Polymers; Marcel Dekker: New York, NY, USA, 1996. [Google Scholar]
  35. Kang, M.J.; Heo, Y.J.; Jin, F.L.; Park, S.J. A review: Role of interfacial adhesion between carbon blacks and elastomeric materials. Carbon Lett. 2016, 18, 1–10. [Google Scholar] [CrossRef]
  36. Jovanović, V.; Samaržija-Jovanović, S.; Budinski-Simendić, J.; Marković, G.; Marinović-Cincović, M. Composites based on carbon black reinforced NBR/EPDM rubber blends. Compos. Part B Eng. 2013, 45, 333–340. [Google Scholar] [CrossRef]
  37. Araby, S.; Meng, Q.; Zhang, L.; Zaman, I.; Majewski, P.; Ma, J. Elastomeric composites based on carbon nanomaterials. Nanotechnology 2015, 26, 112001. [Google Scholar] [CrossRef]
  38. Griffini, G.; Suriano, R.; Turri, S. Correlating mechanical and electrical properties of filler-loaded polyurethane fluoroelastomers: The influence of carbon black. Polym. Eng. Sci. 2012, 52, 2543–2551. [Google Scholar] [CrossRef]
  39. Korai, Y.; Wang, Y.G.; Yoon, S.H.; Ishida, S.; Mochida, I.; Nakagawa, Y.; Matsumura, Y. Effects of carbon black addition on preparation of meso-carbon microbeads. Carbon 1997, 35, 875–884. [Google Scholar] [CrossRef]
  40. Kanno, K.; Yoon, K.; Fernandez, J.; Mochida, I.; Fortin, F.; Korai, Y. Modifications to carbonization of mesophase pitch by addition of carbon blacks. Carbon 1997, 35, 1627–1637. [Google Scholar] [CrossRef]
  41. Ulfah, I.M.; Fidyaningsih, R.; Rahayu, S.; Fitriani, D.A.; Saputra, D.A.; Winarto, D.A.; Wisojodharmo, L.A. Influence of carbon black and silica filler on the rheological and mechanical properties of natural rubber compound. Procedia Chem. 2015, 16, 258–264. [Google Scholar] [CrossRef]
  42. Kim, J. Conductive carbon black filled composite (I): The effect of carbon block on the conductivity. Elastomers Compos 1998, 33, 355–362. [Google Scholar]
  43. Wang, J.; Vincent, J.; Quarles, C.A. Review of positron annihilation spectroscopy studies of rubber with carbon black filler. Nucl. Instrum. Methods Phys. Res. 2005, 241, 271–275. [Google Scholar] [CrossRef]
  44. Tzounis, L.; Debnath, S.; Rooj, S.; Fischer, D.; Mäder, E.; Das, A.; Stamm, M.; Heinrich, G. High performance natural rubber composites with a hierarchical reinforcement structure of carbon nanotube modified natural fibers. Mater. Des. 2014, 58, 1–11. [Google Scholar]
  45. Omnès, B.; Thuillier, S.; Pilvin, P.; Grohens, Y.; Gillet, S. Effective properties of carbon black filled natural rubber: Experiments and modeling. Compos. Part A Appl. Sci. Manuf. 2008, 39, 1141–1149. [Google Scholar]
  46. Askeland, D.; Fulay, P.; Wright, W. The Science of Engineering and Materials, 6th ed.; Cengage Learning: Boston, MA, USA, 2011; Volume 26. [Google Scholar] [CrossRef]
  47. Murphy, J. Chapter 7—Modifying Specific Properties: Appearance—Black and White Pigmentation. In Additives for Plastics Handbook, 2nd ed.; Murphy, J., Ed.; Elsevier: Amsterdam, The Netherlands, 2001; pp. 73–92. Available online: https://api.semanticscholar.org/CorpusID:138851324 (accessed on 1 April 2025).
  48. Sisk, B.C.; Lewis, N.S. Vapor sensing using polymer/carbon black composites in the percolative conduction regime. Langmuir 2006, 22, 7928–7935. [Google Scholar] [CrossRef]
  49. Li, J.; Ma, P.C.; Chow, W.S.; To, C.K.; Tang, B.Z.; Kim, J.K. Correlations between percolation threshold, dispersion state, and aspect ratio of carbon nanotubes. Adv. Funct. Mater. 2007, 17, 3207–3215. [Google Scholar] [CrossRef]
  50. Parnian, P.; D’Amore, A. Investigating the Electrical and Mechanical Properties of Polystyrene (PS)/Untreated SWCNT Nanocomposite Films. J. Compos. Sci. 2024, 8, 49. [Google Scholar] [CrossRef]
  51. Doleman, B.J.; Lonergan, M.C.; Severin, E.J.; Vaid, T.P.; Lewis, N.S. Quantitative Study of the Resolving Power of Arrays of Carbon Black Polymer Composites in Various Vapor Sensing Tasks. Anal. Chem. 1998, 70, 4177–4190. [Google Scholar] [PubMed]
  52. Welker, R.W. Basics and Sampling of Particles for Size Analysis and Identification; Elsevier: Amsterdam, The Netherlands, 2012; Volume 4. [Google Scholar] [CrossRef]
  53. Lapuerta, M.; Canoira, L. The Suitability of Fatty Acid Methyl Esters (FAME) as Blending Agents in Jet A-1; Elsevier: Amsterdam, The Netherlands, 2016. [Google Scholar] [CrossRef]
  54. Fink, J. Dispersions, Emulsions, and Foams. In Petroleum Engineer’s Guide to Oil Field Chemicals and Fluids, Gulf Professional Publishing; Fink, J.K., Ed.; Gulf Professional Publishing: Houston, TX, USA, 2012; pp. 663–694. [Google Scholar] [CrossRef]
  55. Frisch, K.C.; Klempner, D. Advances in Interpenetrating Polymer Networks. Polym. Int. 1995, 38, 105–106. [Google Scholar]
  56. Burke, J. Part 2—The Hildebrand Solubilty Parameter; American Institute for Conservation: Washington, DC, USA, 2020; pp. 12–24. [Google Scholar]
  57. Synovec, R. Chemical Separation Techniques, Angel Kelley. Available online: https://slideplayer.com/slide/11702144/ (accessed on 12 October 2022).
  58. Freund, M.S.; Lewis, N.S. A chemically diverse conducting polymer-based electronic nose. Proc Natl. Acad. Sci. USA 1995, 92, 2652–2656. [Google Scholar]
  59. Lonergan, M.C.; Severin, E.J.; Doleman, B.J.; Beaber, S.A.; Grubbs, R.H.; Lewis, N.S. Array-based vapor sensing using chemically sensitive, carbon black-Polymer resistors. Chem. Mater. 1996, 8, 2298–2312. [Google Scholar] [CrossRef]
  60. Brighenti, R.; Cosma, M.P. Swelling mechanism in smart polymers responsive to mechano-chemical stimuli. J. Mech. Phys. Solids 2020, 143, 104011. [Google Scholar] [CrossRef]
  61. Dobrokhotov, V.; Larin, A.; Sowell, D. Vapor trace recognition using a single nonspecific chemiresistor. Sensors 2013, 137, 9016–9028. [Google Scholar] [CrossRef]
  62. Tierney, M.; Kim, H. Electrochemical gas sensor with extremely fast response times. Anal. Chem. 1993, 65, 3435–3440. [Google Scholar] [CrossRef]
  63. Stetter, J.; Li, J. Amperometric gas sensors—A review. Chem. Rev. 2008, 108, 352–366. [Google Scholar] [CrossRef] [PubMed]
  64. Severin, E.; Doleman, B.; Lewis, N. An investigation of the concentration dependence and response to analyte mixtures of carbon black/insulating organic polymer composite vapor detectors. Anal.Chem. 2000, 72, 658–668. [Google Scholar]
  65. Ho, C.; Hughes, R. In-Situ Chemiresistor Sensor Package for Real-Time Detection of Volatile Organic Compounds in Soil and Groundwater. Sensors 2002, 2, 23–34. [Google Scholar] [CrossRef]
  66. Prager, S.; Long, F.A. Diffusion of Hydrocarbons in Polyisobutylene. J. Am. Chem. Soc. 1951, 73, 4072–4075. [Google Scholar] [CrossRef]
  67. Bai, H.; Shi, G. Gas sensors based on conducting polymers. Sensors 2007, 7, 267–307. [Google Scholar] [CrossRef]
  68. Gardner, J.; Bartlett, P.N. Sensors and Sensory Systems for an Electronic Nose, 1st ed.; Springer: Berlin/Heidelberg, Germany, 1992. [Google Scholar] [CrossRef]
  69. Janata, J.; Josowicz, M. Chemical Modulation of Work Function as a Transduction Mechanism for Chemical Sensors. Acc. Chem. 1998, 31, 241–248. [Google Scholar] [CrossRef]
  70. Clingerman, M.L. Development and Modeling of Electrically Conductive Composite Materials, Michigan Technological University. 2001. Available online: http://www.chem.mtu.edu/org/ctc/pdf/mlcdissertation.pdf (accessed on 24 July 2022).
  71. Demain, A.; Issi, J. The Effect of Fiber Concentration on the Thermal Conductivity of a Polycarbonate/Pitch-Based Carbon Fiber Composite. Compos. Mater. 1993, 27, 668–683. [Google Scholar]
  72. Donnet, J.-B.; Bansal, R.C.; Wang, M.-J. Carbon Black, 2nd ed.; Marcel Dekker: New York, NY, USA, 1993. [Google Scholar]
  73. Chung, K.T.; Sabo, A.; Pica, A.P. Electrical permittivity and conductivity of carbon black-polyvinyl chloride composites. J. Appl. Phys. 1982, 53, 6867–6879. [Google Scholar]
  74. Sichel, E.K. Carbon Black-Polymer Composites: The Physics of Electrically Conducting Composites; Marcel Dekker: New York, NY, USA, 1982. [Google Scholar]
  75. Janzen, J. On the critical conductive filler loading in antistatic composites. J. Appl. Phys. 1975, 46, 966–969. [Google Scholar] [CrossRef]
  76. Liu, H.; Thostenson, E.T. 6.11 Conductive Nanocomposites for Multifunctional Sensing Applications; Comprehensive Composite Materials II; Elsevier: Amsterdam, The Netherlands, 2018; Volume 65. [Google Scholar] [CrossRef]
  77. Li, C.; Thostenson, E.T.; Chou, T.W. Dominant role of tunneling resistance in the electrical conductivity of carbon nanotube-based composites. Appl. Phys. Lett. 2007, 91, 223114:1–223114:3. [Google Scholar]
  78. Natarajan, B.; Orloff, N.D.; Ashkar, R.; Doshi, S.; Twedt, K.; Krishnamurthy, A.; Davis, C.; Forster, A.M.; Thostenson, E.; Obrzut, J.; et al. Multiscale metrologies for process optimization of carbon nanotube polymer composites. Carbon 2016, 108, 381–393. [Google Scholar] [CrossRef]
  79. Oskouyi, A.B.; Sundararaj, U.; Mertiny, P. Tunneling conductivity and piezoresistivity of composites containing randomly dispersed conductive nano-platelets. Materials 2014, 7, 2501–2521. [Google Scholar] [CrossRef]
  80. Dalven, R. Introduction to Applied Solid State Physics; Plenum Press: New York, NY, USA, 1980. [Google Scholar]
  81. Paredes-Madrid, L.; Palacio, C.A.; Matute, A.; Vargas, C.A.P. Underlying physics of conductive polymer composites and force sensing resistors (FSRs) under static loading conditions. Sensors 2017, 10, 1334. [Google Scholar] [CrossRef]
  82. Patel, S.V.; Yelton, G.W.; Hughes, R.C. Effect of hydroxyl concentration of chemical sensitivity of polyvinyl alcohol/carbon-black composite chemiresistors. In Chemical Sensors IV: Proceedings of the Symposium; Butter, M.A., Ed.; Electrochemical Society: Pennington, NJ, USA, 1999; Volume 4, p. 456. [Google Scholar]
  83. Fox, L.P. The Conductive Video Disc. RCA Rev. 1978, 39, 116–228. [Google Scholar]
  84. Skórczewska, K.; Lewandowski, K.; Wilczewski, S. Novel Composites of Poly(vinyl chloride) with Carbon Fibre/Carbon Nanotube Hybrid Filler. Materials 2022, 15, 5625. [Google Scholar] [CrossRef]
  85. Gao, T.; Woodka, M.D.; Brunschwig, B.S.; Lewis, N.S. Chemiresistors for Array-Based Vapor Sensing Using Composites of Carbon Black with Low Volatility Organic Molecules. Chem. Mater. 2006, 18, 5193–5202. [Google Scholar] [CrossRef]
  86. Lewis, N.; Electronic Nose: Nathan Lewis Research Group. Division of Chemistry and Chemical Engineering Caltech. California Institute of Technology. 2013. Available online: https://cce.caltech.edu/people/nathan-s-nate-lewis (accessed on 23 May 2021).
  87. Briglin, S.M.; Lewis, N.S. Characterization of the Temporal Response Profile of Carbon Black-Polymer Composite Detectors to Volatile Organic Vapors. J. Phys. Chem. 2003, 107, 11031–11042. [Google Scholar] [CrossRef]
  88. Lewis, N.; Maldonado, S.; García-Berríos, E.; Bruce, B.; Woodka, M. Detection of organic vapors and NH3(g) using thin-film carbon black–metallophthalocyanine composite chemiresistors. Sens. Actuators B Chem. 2008, 134, 521–531. [Google Scholar]
  89. Dafu, W.; Tiejun, Z.; Yi, X. Resistivity-volume resistivity expansion characteristics of carbon black-loaded polyethylene. J. Appl. Polym. Sci. 2000, 77, 53–58. [Google Scholar] [CrossRef]
  90. Alexander, G.M. Anomalous temperature dependence of the electrical conductivity of carbon-poly(methyl methacrylate) composites. Mater. Res. Bull. 1999, 34, 603–611. [Google Scholar] [CrossRef]
  91. Mallette, J.G.; Marques, A. Carbon black filled PET/PMMA blends: Electrical and morphological studies. Polym. Eng. Sci. 2000, 20, 2272–2278. [Google Scholar] [CrossRef]
  92. Lobova, T.; Shvetsova, G.; Kiparisov, S.; Smirnov, Y.; Terenin, E. An Ultrasonic Method of Mixing Powders of Refractory Metal Dichalcogenides with Galliumbase Low-Melting-Point Alloys; Plenum Publishing Corporation: New York, NY, USA, 1977; Volume 16, pp. 42–45. [Google Scholar]
  93. Wohltjen, H.; Barger, W.R.; Snow, A.W.; Jarvis, N.L. A vapor-sensitive chemiresistor fabricated with planar microelectrodes and a Langmuir-Blodgett organic semiconductor film. IEEE Trans. Electron Devices 1985, 32, 1170–1174. [Google Scholar] [CrossRef]
  94. Feng, Y.; Li, D.; Liu, J.; He, W. Carbon-based materials in microbial fuel cells. In Microbial Electrochemical Technology; Elsevier: Amsterdam, The Netherlands, 2019; pp. 49–74. [Google Scholar] [CrossRef]
  95. Doleman, B.; Severin, E.; Lewis, N. Trends in odor intensity for human and electronic noses: Relative roles of odorant vapor pressure vs. molecularly specific odorant binding. Proc. Natl. Acad. Sci. USA 1998, 95, 5442–5447. [Google Scholar] [CrossRef] [PubMed]
  96. Lewis, N.S. Comparisons between mammalian and artificial olfaction based on arrays of carbon black-polymer composite vapor detectors. Acc. Chem. Res. 2004, 37, 663–672. [Google Scholar] [CrossRef]
  97. Hopkins, A.R.; Lewis, N.S. Detection and Classification Characteristics of Arrays of Carbon Black/Organic Polymer Composite Chemiresistive Vapor Detectors for the Nerve Agent Simulants Dimethylmethylphosphonate and Diisopropylmethylphosponate. Chem. Biol. Sens. III 2002, 4722, 86–97. [Google Scholar] [CrossRef]
  98. Zhang, H.; Hackam, R. Electrical Surface Resistance, Hydrophobicity and Diffusion Phenomena in PVC. IEEE Trans. Dielectr. Electr. Insul. 1999, 6, 73–83. [Google Scholar] [CrossRef]
  99. Edwards, P.; Anker, L.; Jurs, P. Quantitative structure-property relationship studies of the odor threshold of odor active compounds. Chem. Senses 1991, 16, 447–465. [Google Scholar] [CrossRef]
  100. Edwards, P.; Jurs, P. Correlation of odor intensities with structural properties of odorants. Chem. Senses 1989, 14, 281–291. [Google Scholar] [CrossRef]
  101. BS ISO 3534-1:2006; Statistics. Vocabulary and Symbols: General Statistical Terms and Terms Used in Probability. British Standards Institute: London, UK, 2006.
Figure 1. Conducting polymer composite film preparation.
Chemosensors 13 00140 g001
Figure 2. Schematic illustration of sensor development and measurement with interdigitated electrode substrate. (A) Drop-casting of sensing material onto interdigitated electrode substrate. (B) Solvent evaporation and thin film formation at 40 °C for 5 min and 70 °C for 25 min. (C) Experimental setup for hydrocarbon vapor exposure and electrical response measurement. (D) Baseline sensor condition before exposure. (E) Vapor sorption mechanism on selective sensing layer. (F) Sensor response showing resistance change upon exposure and recovery after hydrocarbon removal.
Chemosensors 13 00140 g002
Figure 3. Presents the SEM images of the PMMA/PVC-CB composites at various magnifications. Image (a) shows the CB-PMMA composite at a particle size of 150 µm (CB-PMMA), while image (b) displays the CB-PMMA composite at a particle size of 500 nm, revealing significant agglomeration. Image (c) depicts the CB-PMMA composite at a particle size of 100 nm and image (d) illustrates the CB-PVC composite at a particle size of 100 nm. The magnifications used for these images are 30 k for image (a) and 40 k for images (bd), providing the detailed visualization of the composite structures.
Chemosensors 13 00140 g003
Figure 4. The sensor validation process. (a,b) The responses of CB-PMMA and CB-PVC sensors, respectively, to soil contaminated with water. (c,d) The responses of CB-PMMA and CB-PVC sensors, respectively, to eicosane at a concentration of 2158 ppmV.
Chemosensors 13 00140 g004
Figure 5. Responses of CB-PVC (a) and CB-PMMA (b) chemiresistors in terms of percentage changes of resistance (%ΔR/R0) to dodecane (99%) at different concentrations. The concentrations of dodecane were 5102 ppmV, 10,205 ppmV, 15,308 ppmV, 20,412 ppmV and 25,514 ppmV for CB-PVC and CB-PMMA in ppmV/air. The responses of CB-PVC (c) and CB-PMMA (d) chemiresistors when exposed to pulses of all the studied compounds in parts per million (ppmV). The concentrations were octane 92,623 ppmV, decane 49,189 ppmV, dodecane 10,205 ppmV, tetradecane 12,764 ppmV, hexadecane 6968 ppmV and eicosane 2158 ppmV.
Chemosensors 13 00140 g005
Figure 6. Multi-cycle (16 cycles) testing was conducted to assess the repeatability of (a) CB-PMMA and (b) CB-PVC sensors in response to eicosane at 431 ppmV and 2589 ppmV.
Chemosensors 13 00140 g006
Figure 7. The calculated concentrations at different volumes at 70 °C using the Antoine coefficient versus volumes of analyte injected into a 2500 mL bottle.
Chemosensors 13 00140 g007
Figure 8. Response of CB-PMMA (A) and CB-PVC (B) sensors to varying concentrations of hydrocarbon compounds (C8 to C20) with high correlation (R ≈ 0.99). The 95% confidence band is also plotted to illustrate the reliability of the regression fit.
Chemosensors 13 00140 g008
Figure 9. Limit of detection of the sensors to different hydrocarbons.
Chemosensors 13 00140 g009
Table 1. Table of Antoine constants used at minimum (tmin) and maximum (tmax) temperature.
HydrocarbonsABCtmintmax
Octane7.144621498.96225.878−56.77295.68
Decane7.217451693.93216.459−29.66345.83
Dodecane7.228831807.47199.3819.58385.05
Tetradecane7.261651914.86183.5195.86419.25
Hexadecane7.362352094.08180.40718.17447.45
Eicosane7.276832208.52158.61236.44494.89
Table 2. Table of compounds and the calculated vapor pressure at 70 °C.
Temperature (°C)Hydrocarbon CompoundsVapor Pressure (mmHg)
70Octane7.99
70Decane3.68
70Dodecane1.68
70Tetradecane0.75
70Hexadecane0.37
70Eicosane0.09
Disclaimer/Publisher’s Note: The statements, opinions and data contained in all publications are solely those of the individual author(s) and contributor(s) and not of MDPI and/or the editor(s). MDPI and/or the editor(s) disclaim responsibility for any injury to people or property resulting from any ideas, methods, instructions or products referred to in the content.

