Article

A Miniaturized Device Based on Cobalt Oxide Nanoparticles for the Quantification of Uric Acid in Artificial and Human Sweat

by
Carlos D. Ruiz-Guerrero
1,
Dulce V. Estrada-Osorio
2,
Alejandro Gutiérrez
2,
Fabiola I. Espinosa-Lagunes
2,
Gabriel Luna-Barcenas
3,
Ricardo A. Escalona-Villalpando
2,
Luis G. Arriaga
3,* and
Janet Ledesma-García
2,*
1
Centro de Investigación y Desarrollo Tecnológico en Electroquímica, Santiago de Querétaro 76703, Mexico
2
División de Investigación y Posgrado, Facultad de Ingeniería, Universidad Autónoma de Querétaro, Santiago de Querétaro 76010, Mexico
3
Tecnologico de Monterrey, Institute of Advanced Materials for Sustainable Manufacturing, Santiago de Querétaro 76130, Mexico
*
Authors to whom correspondence should be addressed.
Chemosensors 2025, 13(3), 114; https://doi.org/10.3390/chemosensors13030114
Submission received: 24 January 2025 / Revised: 9 March 2025 / Accepted: 18 March 2025 / Published: 20 March 2025

Abstract

:
Co3O4-based materials have multiple applications in the field of materials, especially in sensor technology. In this work, Co3O4 nanoparticles were synthesized using a chemical method. The crystalline phase and crystal size were investigated by XRD, the morphology by SEM and the oxidation states by XPS techniques. The Co3O4 material was used to immobilize the urate oxidase enzyme (UOx), which showed a higher current density (1.6 times higher) than the enzyme alone in cyclic voltammetry in phosphate buffer pH 5.6. GCE/Co3O4/UOx achieved a linear range of 3.7–500 µM and a higher sensitivity of 65 µA mM−1 cm−2 compared to 45 µA mM−1 cm−2 achieved by the enzyme alone in a uric acid sensor. The favorable activity of GCE/Co3O4/UOx enabled its use in a miniaturized device with low sample volume using artificial and real human sweat. The device was used to quantify uric acid levels in five samples and showed a relative error between the calculated and expected value of less than 10%. The implementation of GCE/Co3O4/UOx is attractive in a biosensor that can be used as a uric acid sensor in biological fluids.

1. Introduction

Uric acid (UA) is mainly formed by the enzyme xanthine oxidase via purine metabolism in the intestine, liver, kidneys, muscles and vascular endothelia. Around 350 mg of UA is formed daily through endogenous synthesis, while around 300 mg per day is ingested through food [1]. Abnormal UA concentrations can be associated with various diseases such as gout, hyperuricemia, Lesch–Nyhan disease, diabetes, high cholesterol, high cardiac pressure, renal abnormalities and others [1,2,3,4,5].
Conventionally, uric acid levels are analyzed by blood or urine samples. Blood samples are known to require a needle stick into a vein, which carries risks such as infection, bruising, pain and discomfort for the patient. The risks are even greater for samples from infants, where results can take 1 to 2 days [6], and blood samples must be altered to produce a denatured serum to avoid false results. Another alternative for monitoring uric acid is to measure it in sweat, as the analysis is non-intrusive and allows continuous monitoring. This alternative offers advantages such as continuous monitoring, real-time analysis, lower analysis costs and advances in flexible technology [7]. Table 1 shows the concentration of uric acid in various biological fluids and their pH values. The determination of uric acid in samples is carried out using conventional methods such as the photometric method (reduction of phosphotungstic acid by uric acid to obtain tungstic blue), liquid chromatography, UV absorption or mass spectrometry [8]. On the other hand, electrochemical techniques have demonstrated simplicity, high sensitivity and lower detection and quantification limits as well as their versatility in coupling with microfluidic and electronic devices [6].
In recent years, the development of electrochemical sensors modified with nanomaterials has been increasingly investigated. This feature offers several advantages: sensitivity, linear range and overall sensor performance. Enzymes immobilized in these materials exhibit higher sensor activity [17,18,19]. In situ analysis requires a solid substrate with high sensitivity through signal amplification to perform UA quantification. Materials such as carbon nanotubes, graphene, metallic nanoparticles, nanowires and organic polymers are commonly used as a matrix for electrode materials due to their high electrical conductivity and large surface area [20].
Cobalt nanoparticles have been used for various biosensors, showing excellent catalytic activity for the detection of various analytes, such as glucose [21], glutathione [22], dopamine [23], nitrites [24] and H2O2 [25], due to their catalytic activity, physicochemical properties and economic accessibility. In this case, Co-based materials were used for the co-immobilization of enzymes or directly for the oxidation of UA. Some of these biosensors are listed in Table 2. The uricase enzyme (UOx) carries out uric acid oxidation using oxygen as an oxidizing agent. The resulting products of this oxidation reaction are allantoin and CO2 and H2O2 as a product of the reduction reaction, which can be tested with electrochemical techniques.
Materials such as cobalt oxide have attracted attention due to their electrocatalytic properties, chemical stability and low cost. Cobalt oxide has shown reasonable electrocatalytic activity in the presence of various compounds in previous work.
In this work, Co3O4 nanoparticles were synthesized by a chemical method and their morphology, crystallographic structure, particle size and speciation were confirmed by X-ray diffraction (XRD), scanning electron microscopy (SEM) and X-ray photoelectron spectroscopy (XPS). Co3O4 NPs were immobilized together with the urate oxidase enzyme for the amperometric detection of UA. Their performance parameters such as stability, selectivity, linear range and reproducibility were measured in phosphate buffer solution at pH 5.6. Finally, to evaluate the functionality of the sensor in the presence of uric acid, some fluids such as artificial sweat and human sweat were compared in a microfluidic device.

2. Materials and Methods

2.1. Reagents, Solutions and Samples

All reagents used were of high purity and analytical grade. Tris (hidroximetil) aminomethane, cobalt chloride hexahydrate, Candida sp. urate oxidase enzyme, glutaraldehyde and Nafion® were purchased from Sigma-Aldrich (Darmstadt, Germany). Monobasic potassium phosphate (KH2PO4) was purchased from Macron (Austin, TX, USA), dibasic sodium phosphate dodecahydrate (Na2HPO4·12H2O) was purchased from J.T. Baker (Madrid, Spain), and distilled water and hydrochloric acid (HCl) were also used. Toray carbon paper (TCP) was purchased from FuelCellStore (Toray carbon paper 060).
Phosphate buffer solutions (PBSs) were prepared with KH2PO4 and Na2PO4·12H2O using distilled water and the pH was adjusted to 5.6 with HCl. PBS was used as simulated biological fluid (pH range) and simulated sweat was also used for the test: NaCl (20 g L−1), NH4OH (17.5 g L−1), urea (5.0 g L−1), acetic acid (2.5 g L−1) and lactic acid (14.2 g L−1) all diluted in distilled water and the pH adjusted to 5.6 with HCl. Finally, real sweat was collected by shaving the subject’s skin, cleaning the area with alcohol and collecting drops of sweat with a cleaned vase.

2.2. Ink Based on Co3O4 Nanoparticles and Uox Immobilization

A similar method was used by John et al. [33]. A solution of 1 M cobalt chloride (II) hexahydrate was prepared in distilled water with constant stirring, then a 2 M potassium hydroxide solution was added with constant stirring at room temperature (≈22 °C) for 3 h. After this time, the mixture was centrifuged at 1500 rpm for 30 min to obtain the cobalt hydroxide precipitate. This precipitate was rinsed with distilled water and ethanol and dried at 80 °C for 5 h. The preparation of Co3O4/UOx consisted of 1 mg of Co3O4 dispersed in 200 µL of deionized water and 50 µL of Nafion®, with sonication between additions. A solution containing 10 mg UOx, 70 µL Tris-HCl, 100 µL ethanol and 30 µL 5% glutaraldehyde was then added, mixed thoroughly and sonicated for 3 min. Electrochemical inks with and without enzyme were tested as controls. All experiments were performed in triplicate and the average and error bars are indicated.

2.3. Preparation of the Electrodes

Electrodes were prepared using 10 μL of Co3O4 and Co3O4/UOx inks in a glassy carbon electrode (GCE) and 20 μL of the same inks in a 3 × 3 mm area of a Toray paper electrode (TPE) for a miniaturized device and allowed to dry at 34 °C for 24 h.

2.4. Electrochemical Techniques

Tests were carried out using an Epsilon BASi potentiostat galvanostat with a three-electrode system: Ag/AgCl as reference (RE), graphite as counter electrode (CE) and as working electrode (WE) a GCE and a TPE, both with the catalyst ink, to evaluate the performance at different UA concentrations between 0 and 100 μM. The tests were performed in a half electrochemical cell (5 mL) and a miniaturized device (150 µL) using cyclic voltammetry at a sweep rate of 10 mV s−1 from −0.2 to 0.65 V and amperometric assays. Stability tests were performed at pH 5.6 and in 3 continuous applications. The stability of the electrodes was evaluated by chronoamperometry on the first, third and tenth day of preparation.

2.5. Interference Tests

Several interferents present in biological fluids were tested in the PBS pH 5.6 solution. These interfents were ascorbic acid (25 μM) [34], glucose (0.1 mM) [35], urea (8 mM) [36] and lactic acid (10 mM) [35] with uric acid additions (50 μM) [37] tested at the beginning and end of the experiment to obtain the performance of the sensor.

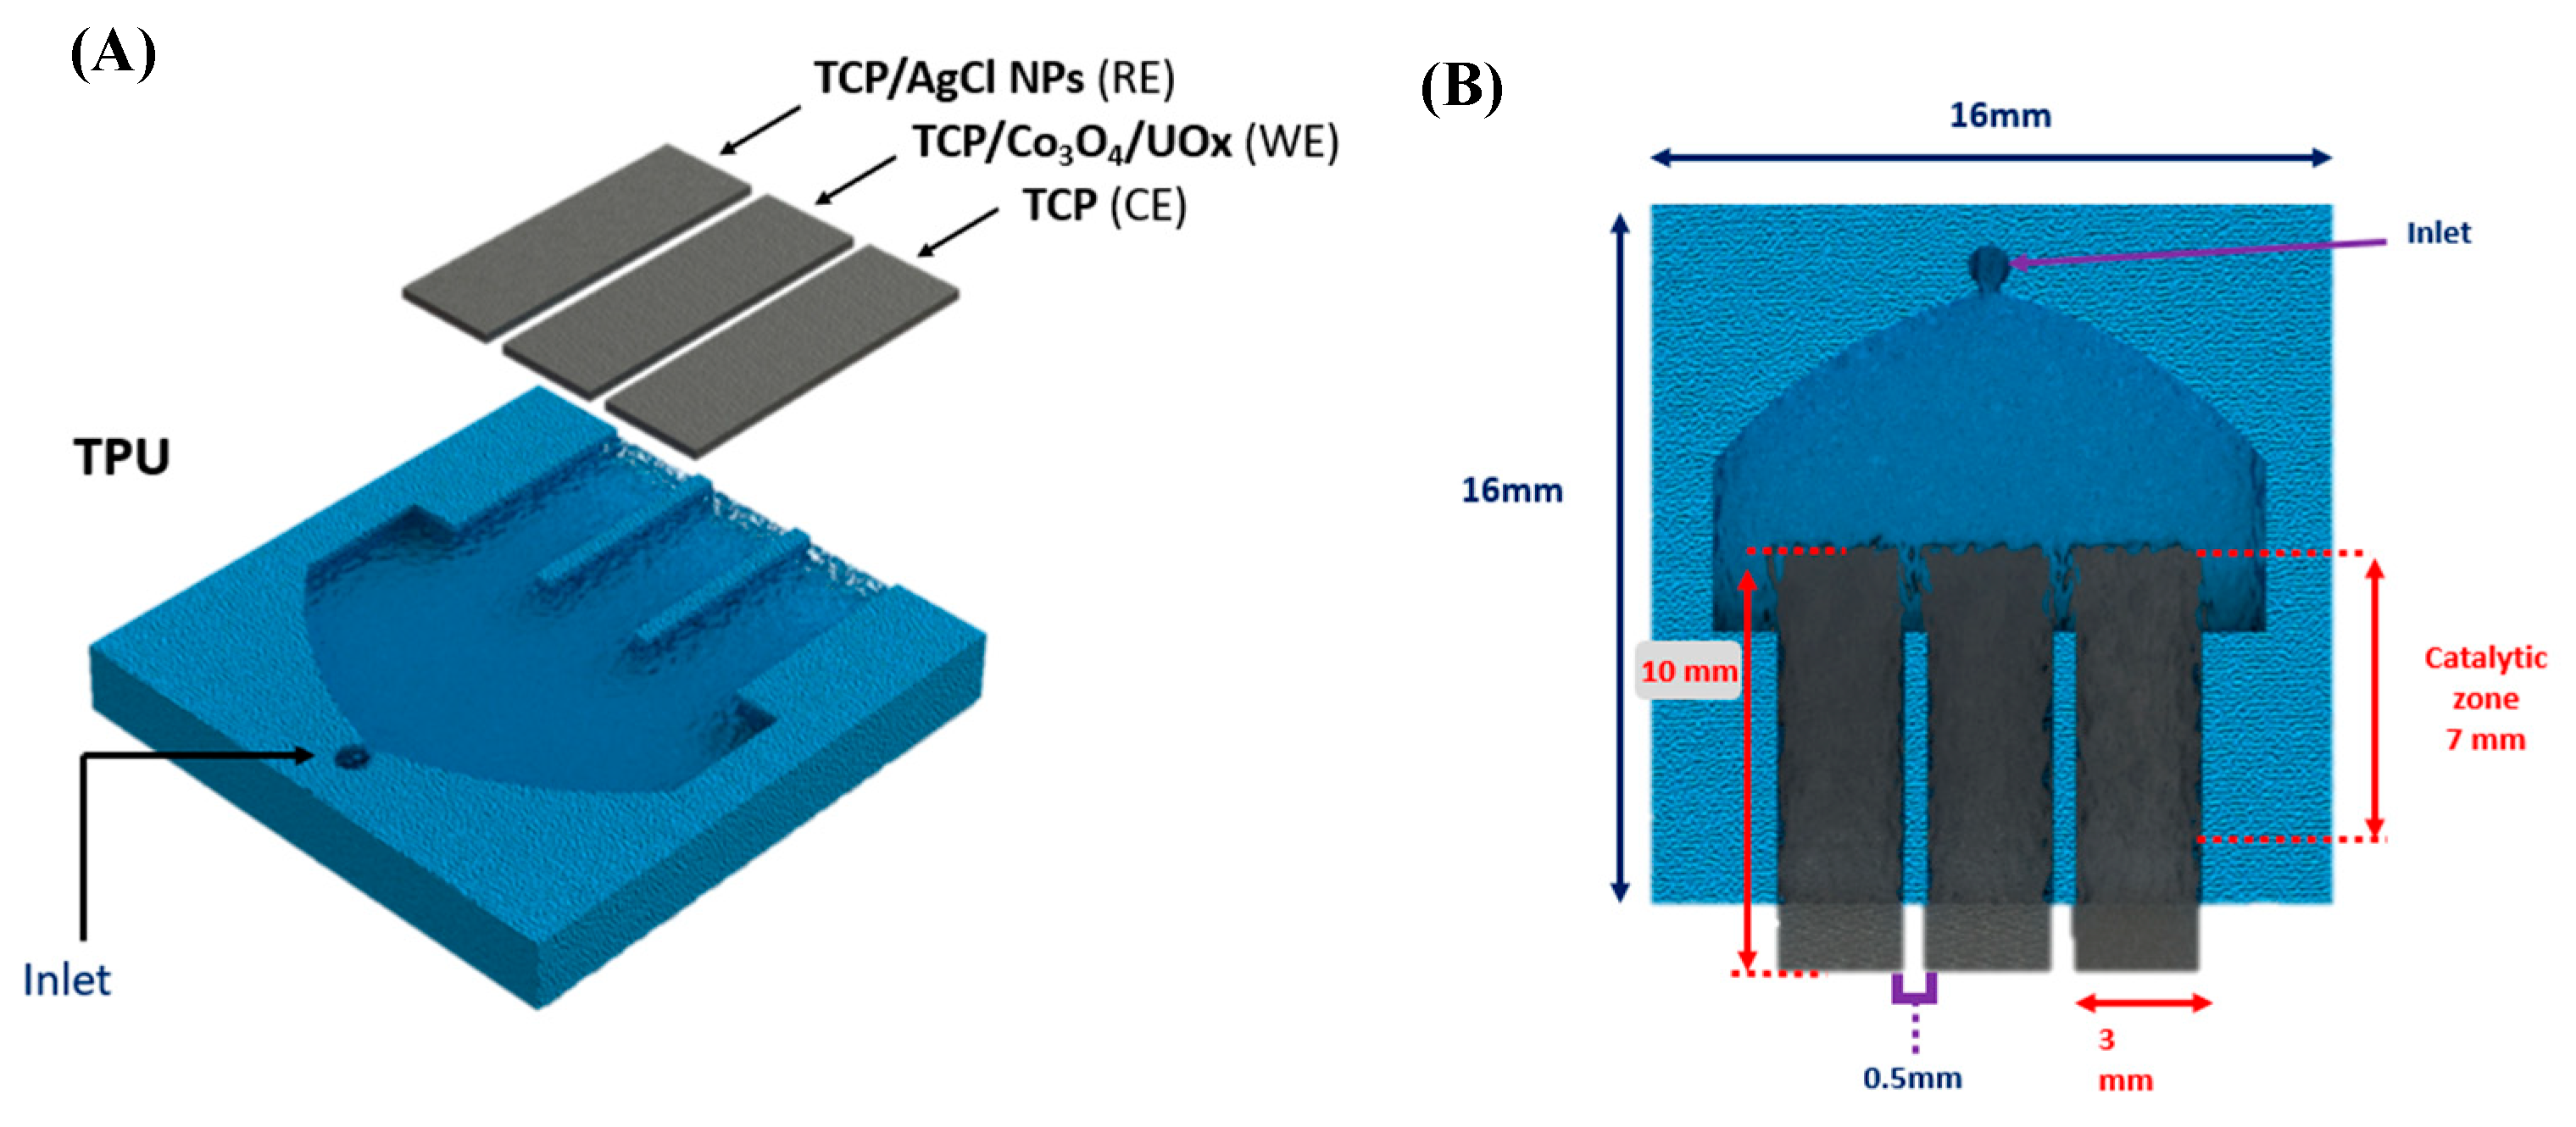
2.6. Construction of the Miniaturized Device

The device consists of two main parts (Scheme 1): one for the supporting electrolyte and one for the working, counter and reference electrodes. The design of the miniaturized device was injection molded from thermoplastic polyurethane (TPU) with dimensions of 16 mm × 16 mm. The reservoir for the carrier electrolyte has a capacity of 150 µL. The electrode surface has 3 gaps of 3 mm with a distance of 0.5 mm between the individual electrodes. The electrodes were made of 3 mm × 10 mm Toray carbon paper (TCP), with 7 mm coated with the catalytic ink, but only 3 mm open to the supporting electrolyte. The counter electrode was the same TCP, and the reference electrode was made with Ag nanoparticles (commercial) and modified with a saturated solution of FeCl3 to generate Ag/AgCl, while the working electrode was TCP/Co3O4/UOx, as shown in Section 2.2.

3. Results and Discussion

3.1. Physicochemical Characterization

3.1.1. X-Ray Diffraction (XRD)

X-ray diffraction of the powder was performed to evaluate the crystallographic properties of the Co3O4 nanostructures. Figure 1A shows the XRD pattern of the synthesized material. In this pattern, it can be seen that five diffraction peaks appear at the principal values of 2θ approximately at 36.5°, 44.4°, 59.1°, 64.9° and 77.2°. These peaks are assigned to the reflection planes of (311), (400), (511), (440) and (533) (JCPDS No. 65-3103) [38], respectively. The five planes obtained from the analysis correspond to the spinel structure of Co3O4, which has already been presented in other works [39].

3.1.2. Scanning Electron Microscopy (SEM)

The morphology of the Co3O4 nanostructures was characterized by SEM. The images obtained are shown in Figure 1B. The analysis was performed in different zones to adequately characterize the morphology of the Co structures. The samples show irregular laminar shaped structures, mainly square, surrounded by a three-dimensional porous mesh. This phenomenon could be due to the fact that the material has not yet completed its formation process, as is the case in other work on the particle synthesis of Co3O4 [40]. The size of the square flakes of Arista was more frequently between 154 and 250 nm, with a larger accumulation at a size of 249 nm.

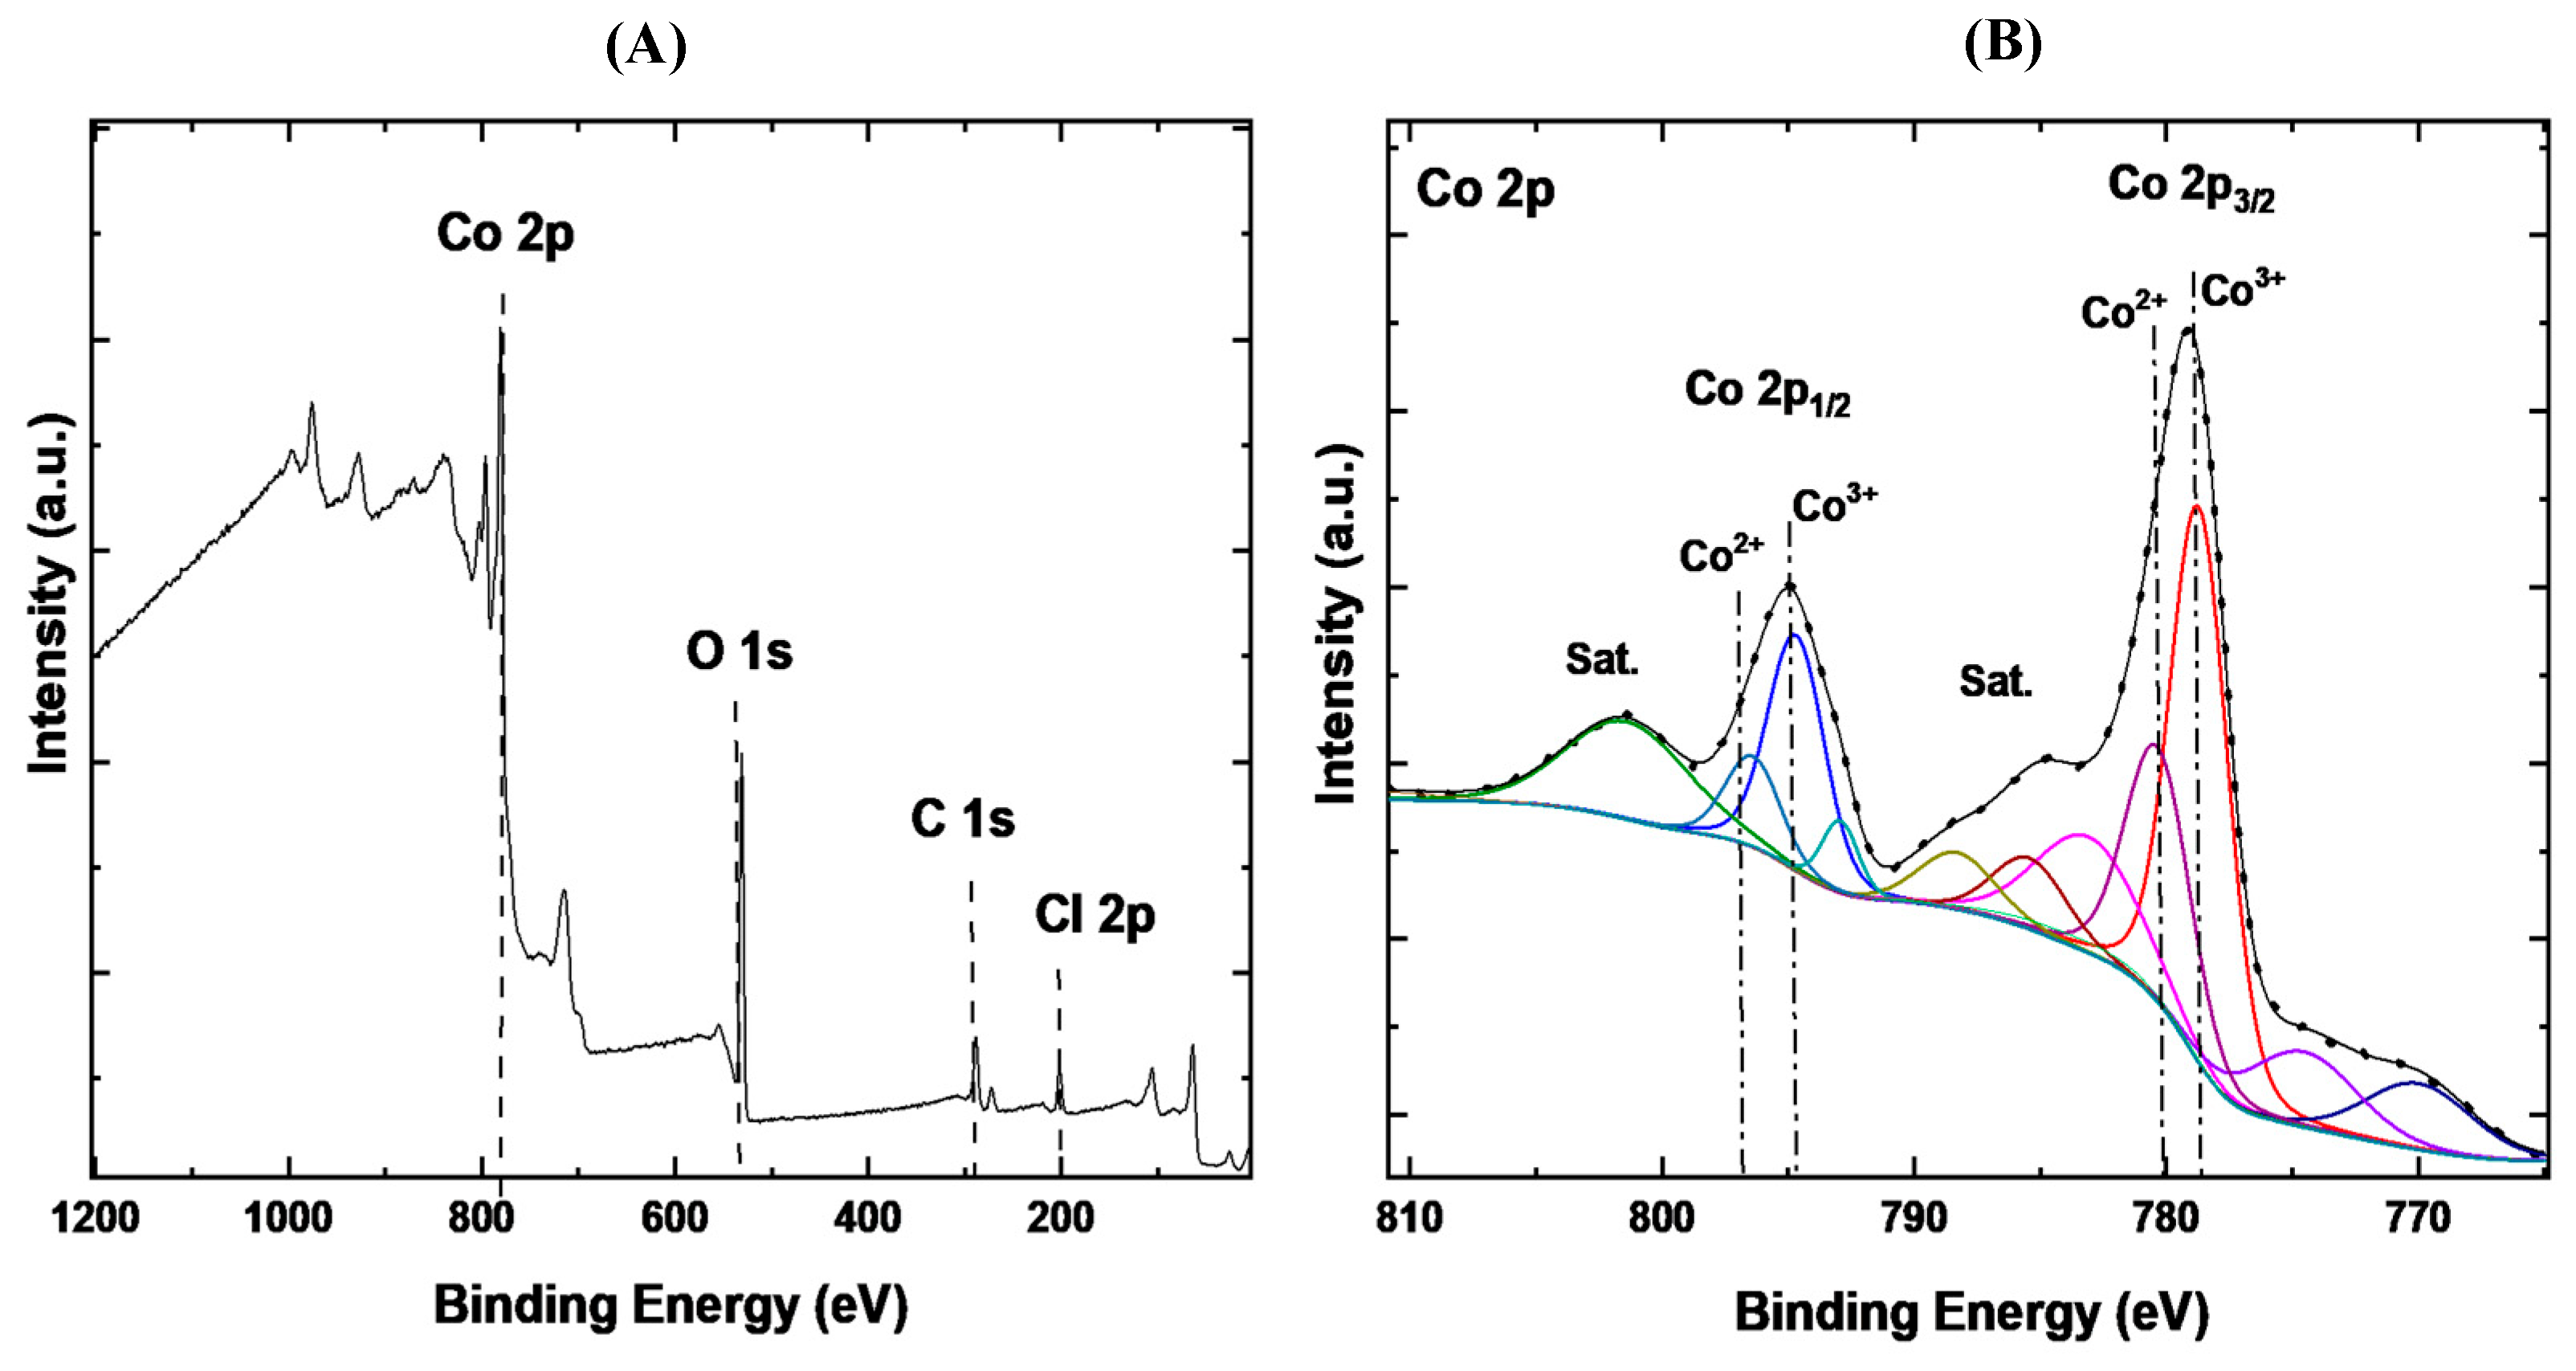
3.1.3. X-Ray Photoelectron Spectroscopy (XPS) Analysis

The chemical surface state of the catalyst was analyzed by the XPS spectrum. Figure 2A shows the results of this analysis. The main elements of the catalysts are C, O, Co and Cl, which are characteristic of the synthesis. Triple peaks are found in the spectra of Co 2p (high-resolution) in Figure 2B, located at 781.96 and 797.16 eV, the Co 2p3/2 and Co 2p1/2 peaks, respectively, which correspond to Co (III). In the case of Co (II), the Co 2p1/2 and Co 2p3/2 peaks are located at 801.31 and 785.52 eV, respectively. [41]. In addition, two further satellite peaks were found at 802.8 and 785.8 eV, confirming the presence of Co (II). The Co peaks deconvolute to decrease the binding energy, showing the electronic variation of Co and suggesting that Co has a lower activation energy for the chemical reaction. The Co (II)/Co (III) ratio was found to be 0.67:1. The difference between these two ratios confirms that the electronic distribution was rebalanced during the process of electron donation–acceptance.

3.2. Electrochemical Characterization

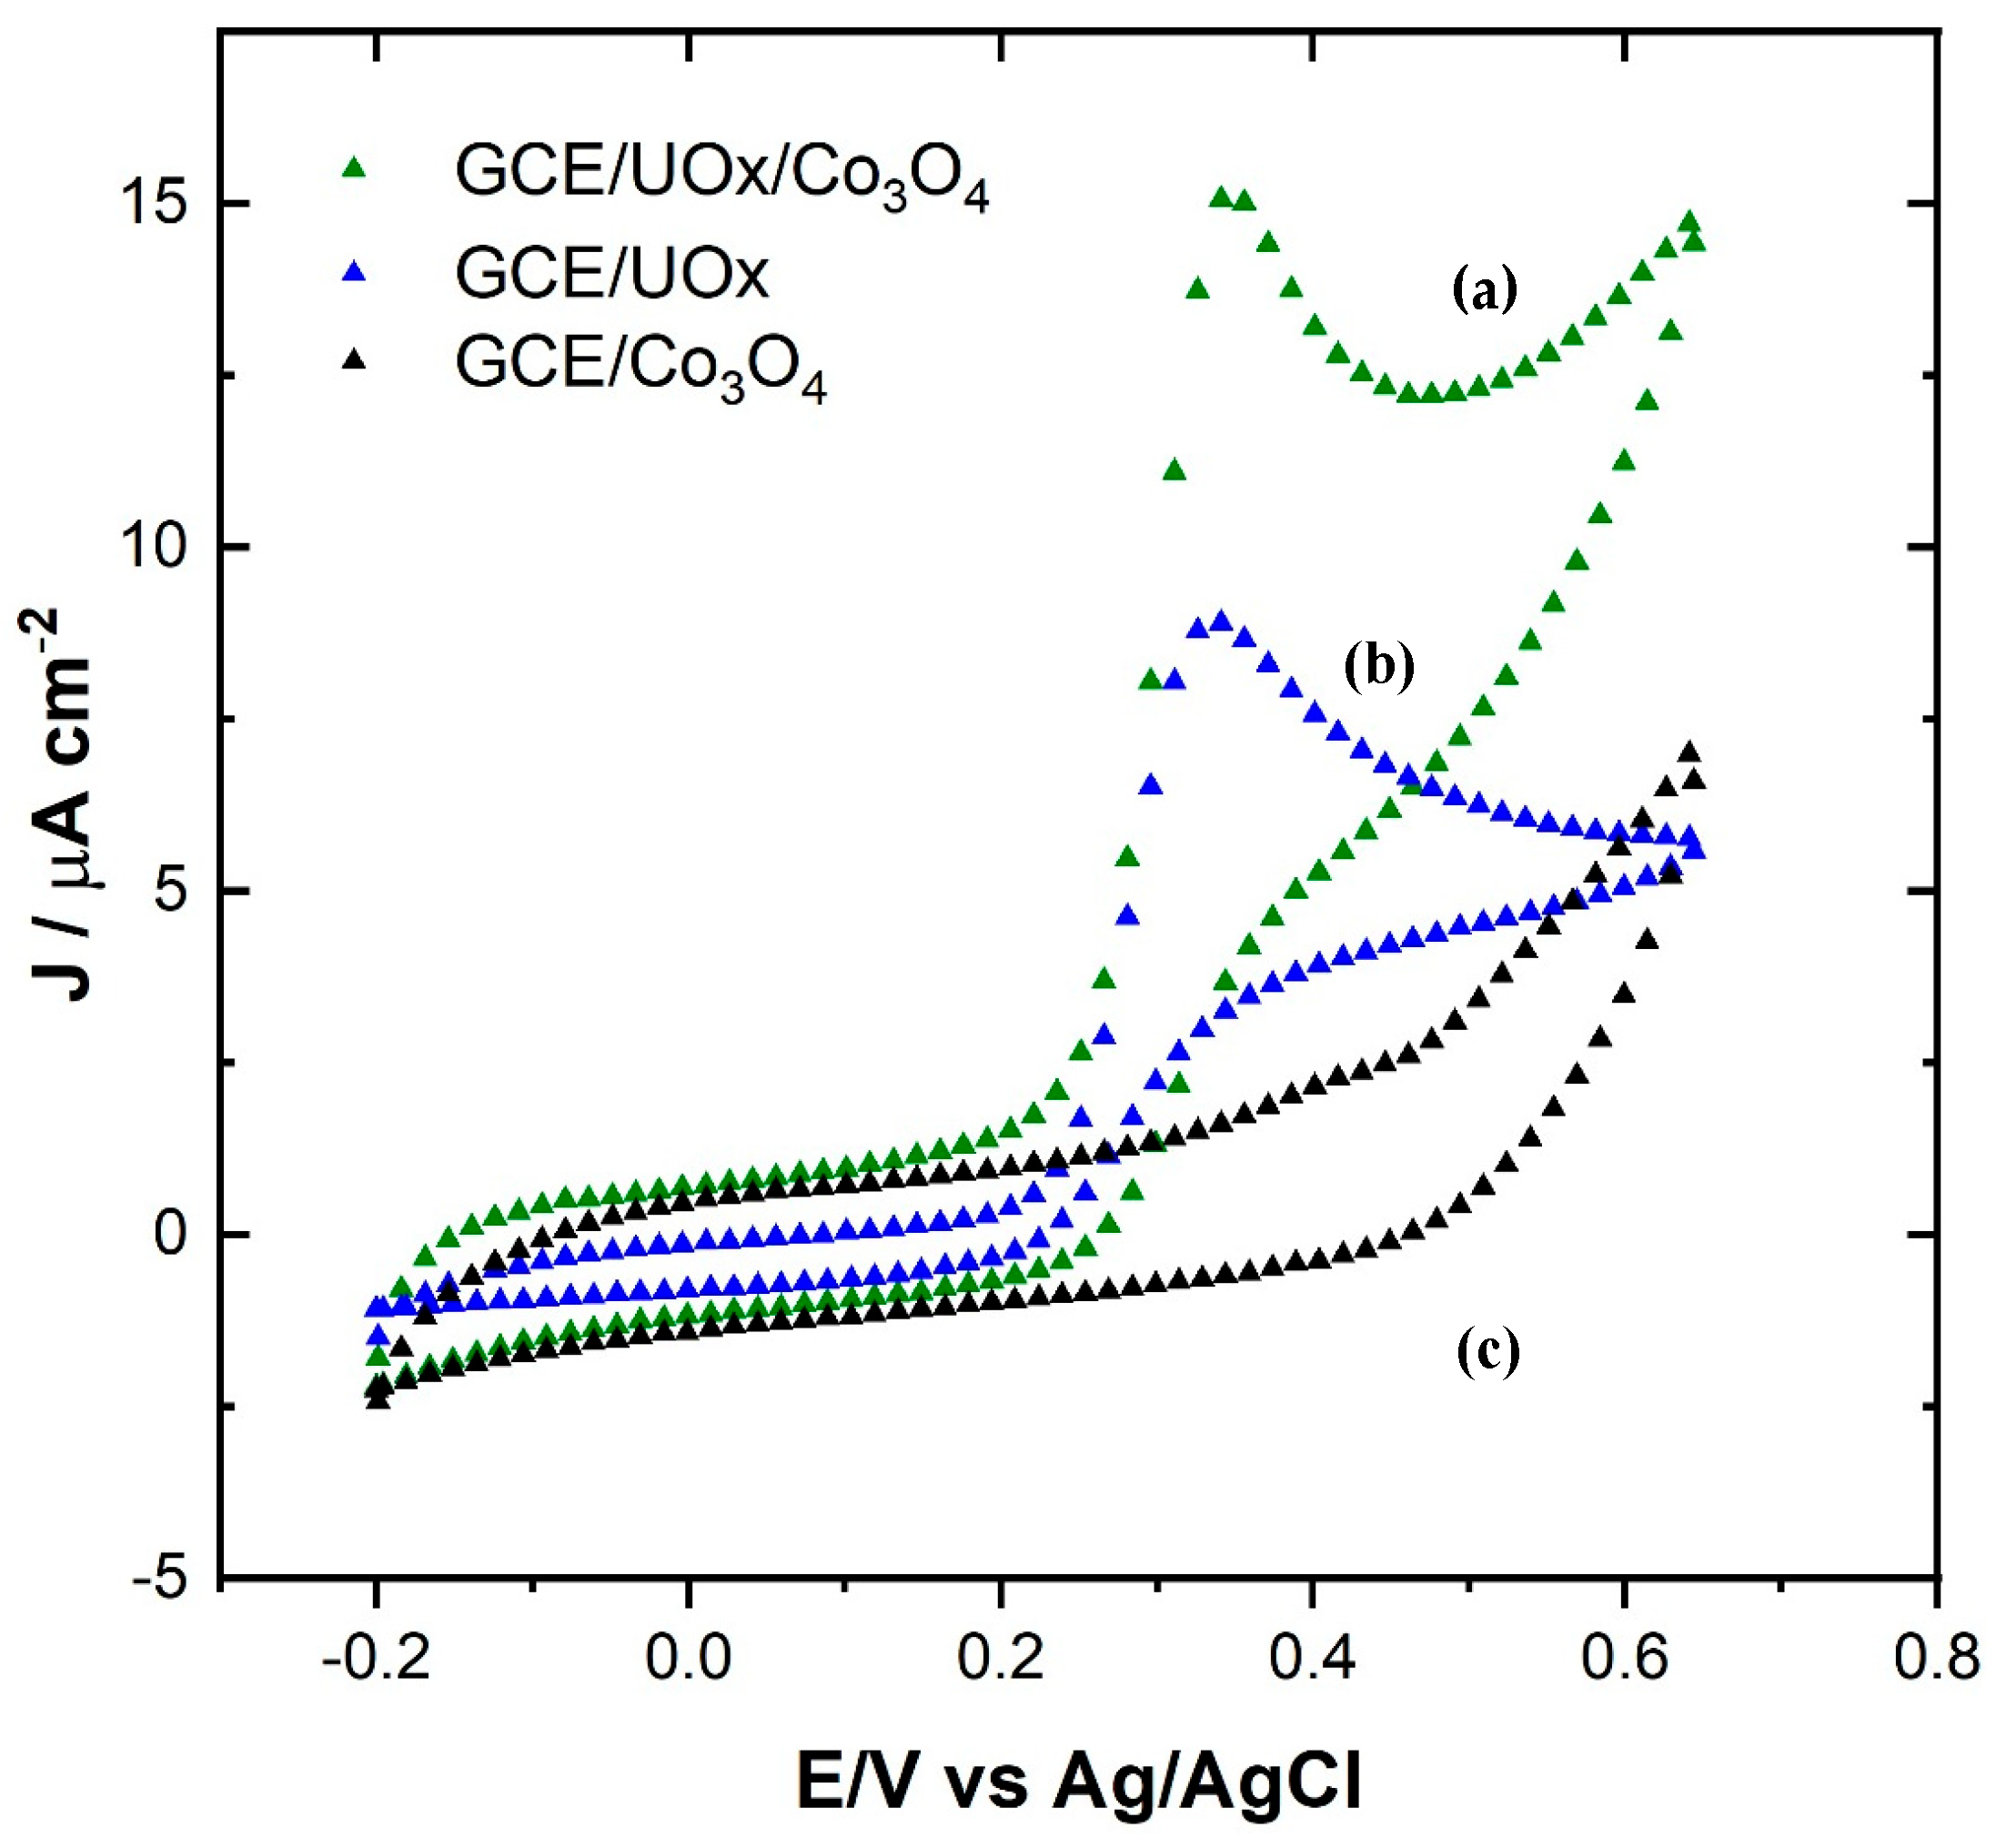
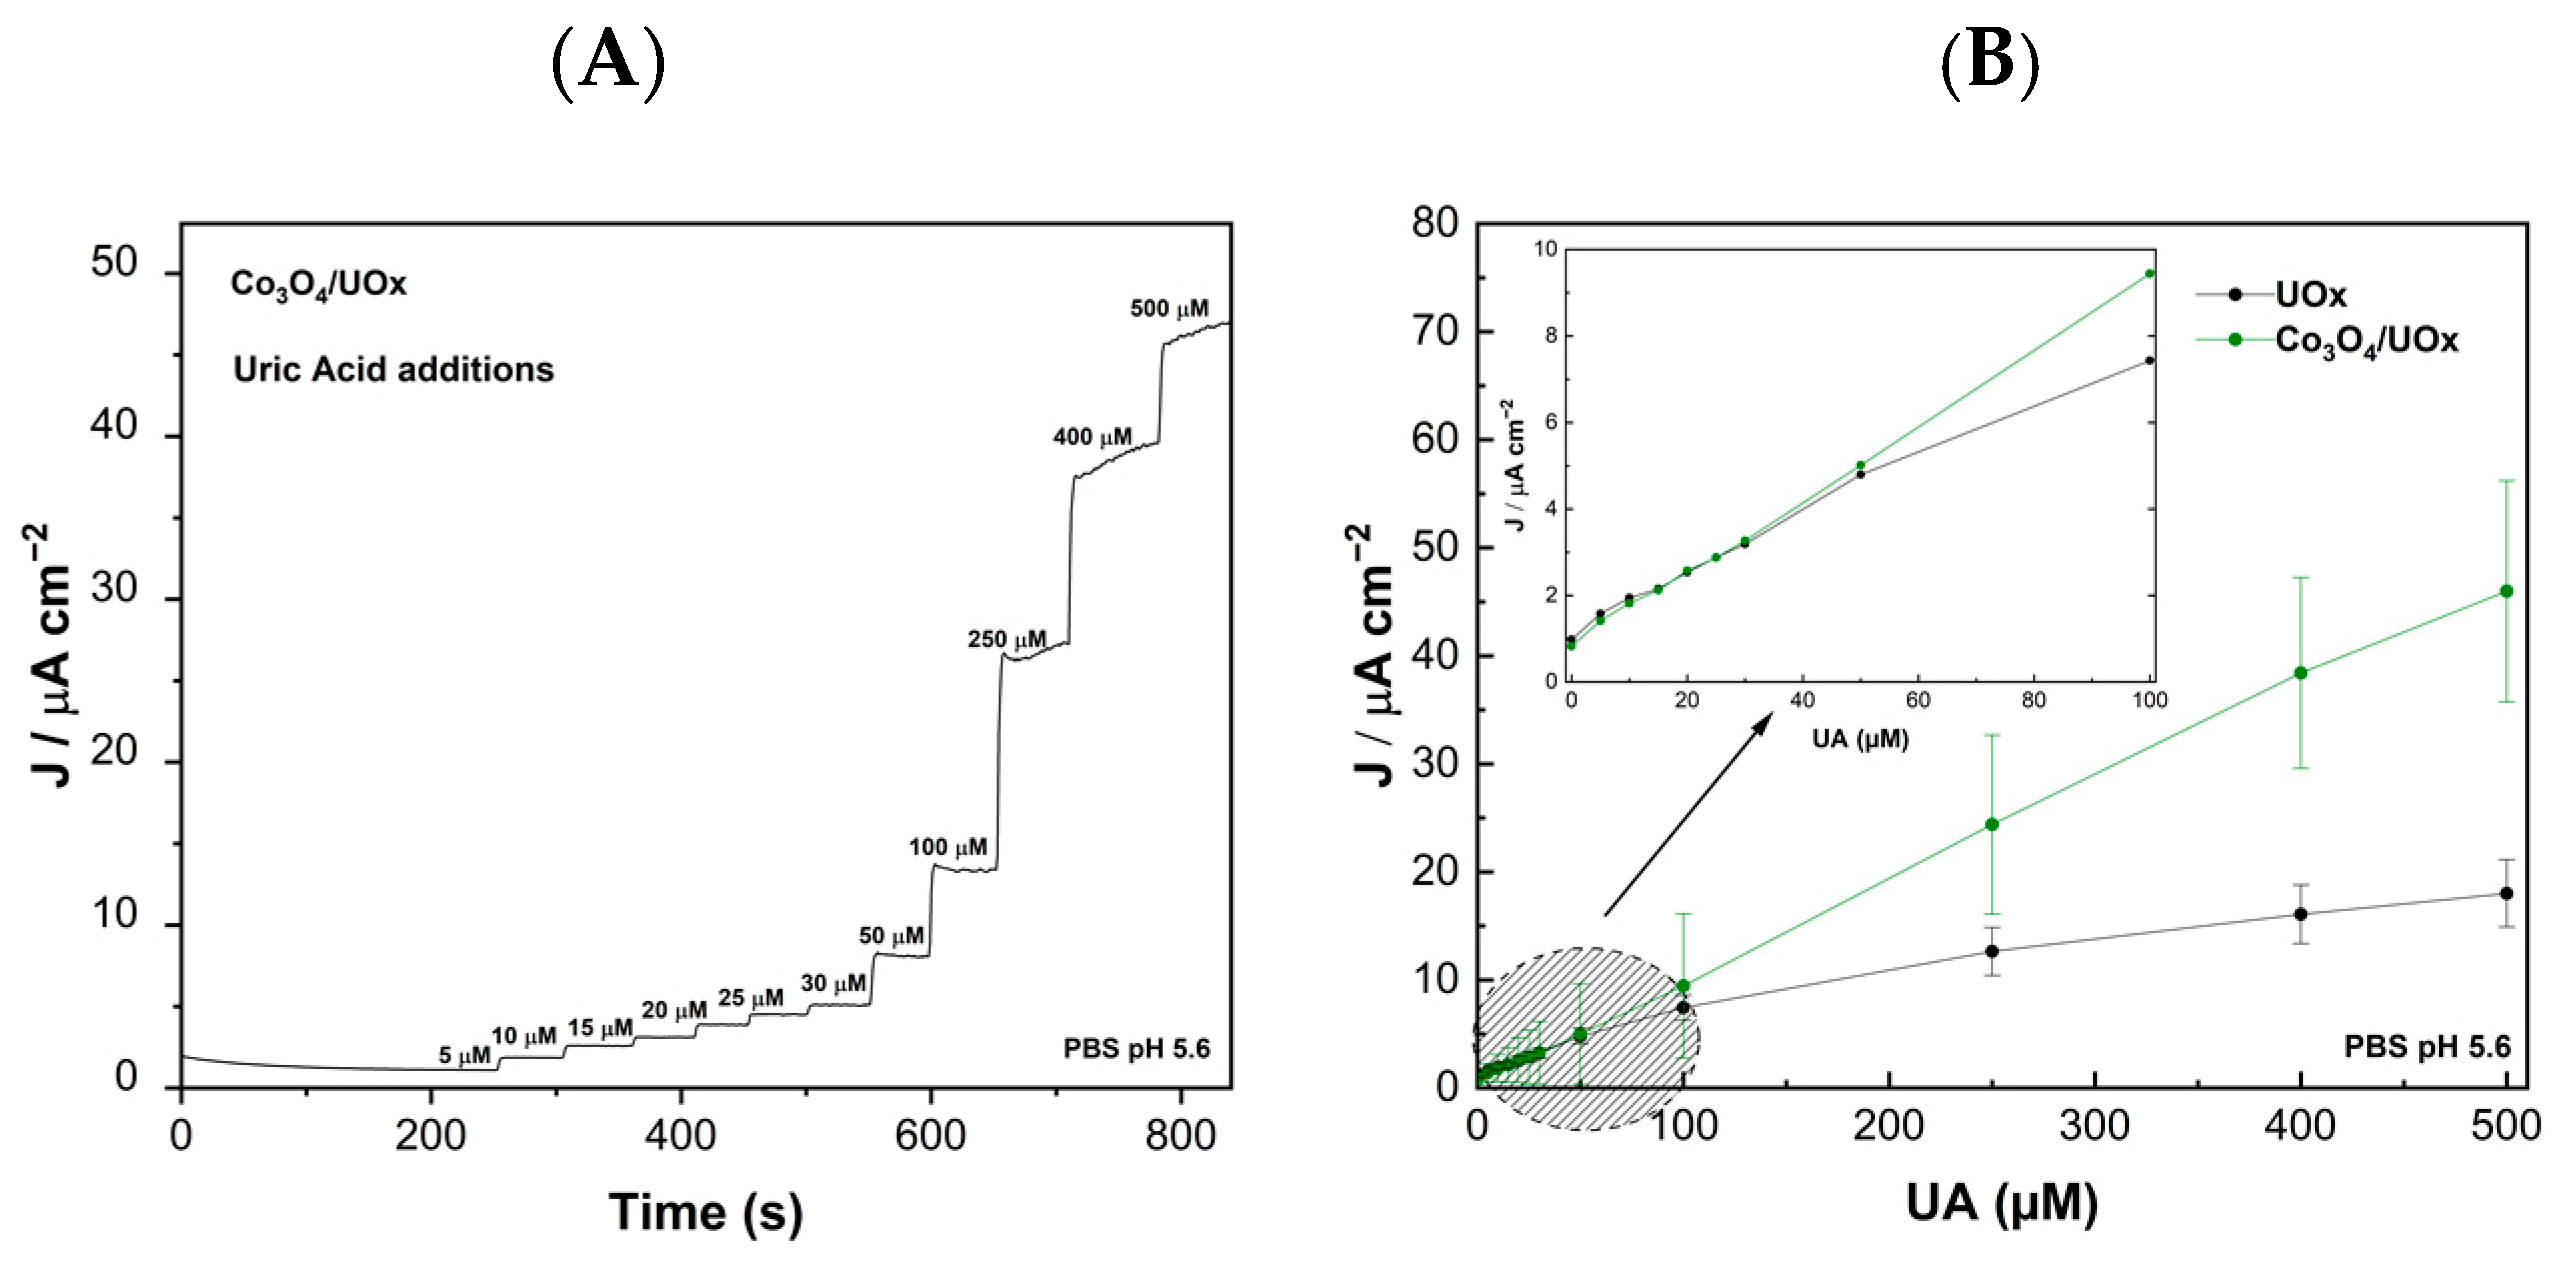
3.2.1. Electrocatalytic Activity in the Half-Cell Configuration

Figure 3 shows the cyclic voltammetry between −0.2 and 0.65 V (vs. Ag/AgCl) of GCE/Co3O4/UOx in the presence of 100 μM uric acid. An increase in the oxidation peak at 0.34 V (vs. Ag/AgCl) is observed in both cyclic voltammograms, which is consistent with previous work using similar materials. The current density of UOx immobilized with Co3O4 exhibited 15 µA cm−2 current density, 1.9 times higher than when UOx alone was used. The enhancement of the increase in current density by the presence of Co3O4 could be due to the efficient electron transfer between the enzyme and Co3O4, such that the cobalt nanostructures provide a suitable environment for the enzyme to increase the catalytic activity [42]. This result suggests that Co3O4 creates a favorable environment to enhance the catalytic activity together with the UOx enzyme. Figure 3 also compares the cyclic voltammetry of GCE/Co3O4 and GCE without enzyme in the presence of uric acid. In the case of GCE/Co3O4, the oxidation potential is 0.4 V and 0.55 V, respectively, and the current density increases by 6 µA cm−2 in the presence of uric acid. However, the catalytic activity is lower in both cases than in the presence of the enzyme.
The amperometric response of GCE/Co3O4/UOx is shown in Figure 4A. It shows an increase in current density upon addition of different concentrations of up to 500 µM uric acid at 0.3 V and constant stirring. The comparative calibration curve between GCE/UOx and GCE/Co3O4/UOx (Figure 4B) shows that a maximum current of 46.1 µA cm−2 is achieved with the latter, while a value of 18.1 µA cm−2 is obtained with the enzyme alone (2.5 times higher). Figure 4B shows the linear response of the bioelectrodes from 1–100 µM. The linear range for GCE/UOx and GCE/Co3O4/UOx was 5.3–500 µM and 3.7–500 µM, respectively. These values are within the uric acid concentrations found in sweat (24.5 µM), although a better correlation coefficient of 0.9992 and 0.9694 was achieved with the second, while the highest sensitivity calculated via the slope for GCE/Co3O4/UOx was 65 µA mM−1 cm−2, 44% higher than for GCE/UOx, highlighting the importance of using Co3O4 to improve the parameters of the uric acid sensor.
Statistical analyses were performed by determining calibration curves, shown in Figure 4B, obtained by triplicate experiments with the tested electrodes. Further kinetic and sensor parameters of uric acid are shown in Table 3. Our results are comparable to other biosensors used for the quantification of uric acid under controlled reaction conditions. The most recent review on uric acid reports measurement ranges of 0–500 µM or up to 1000 µM and sensitivities between 0.1 and 200 µM [6,43,44,45].

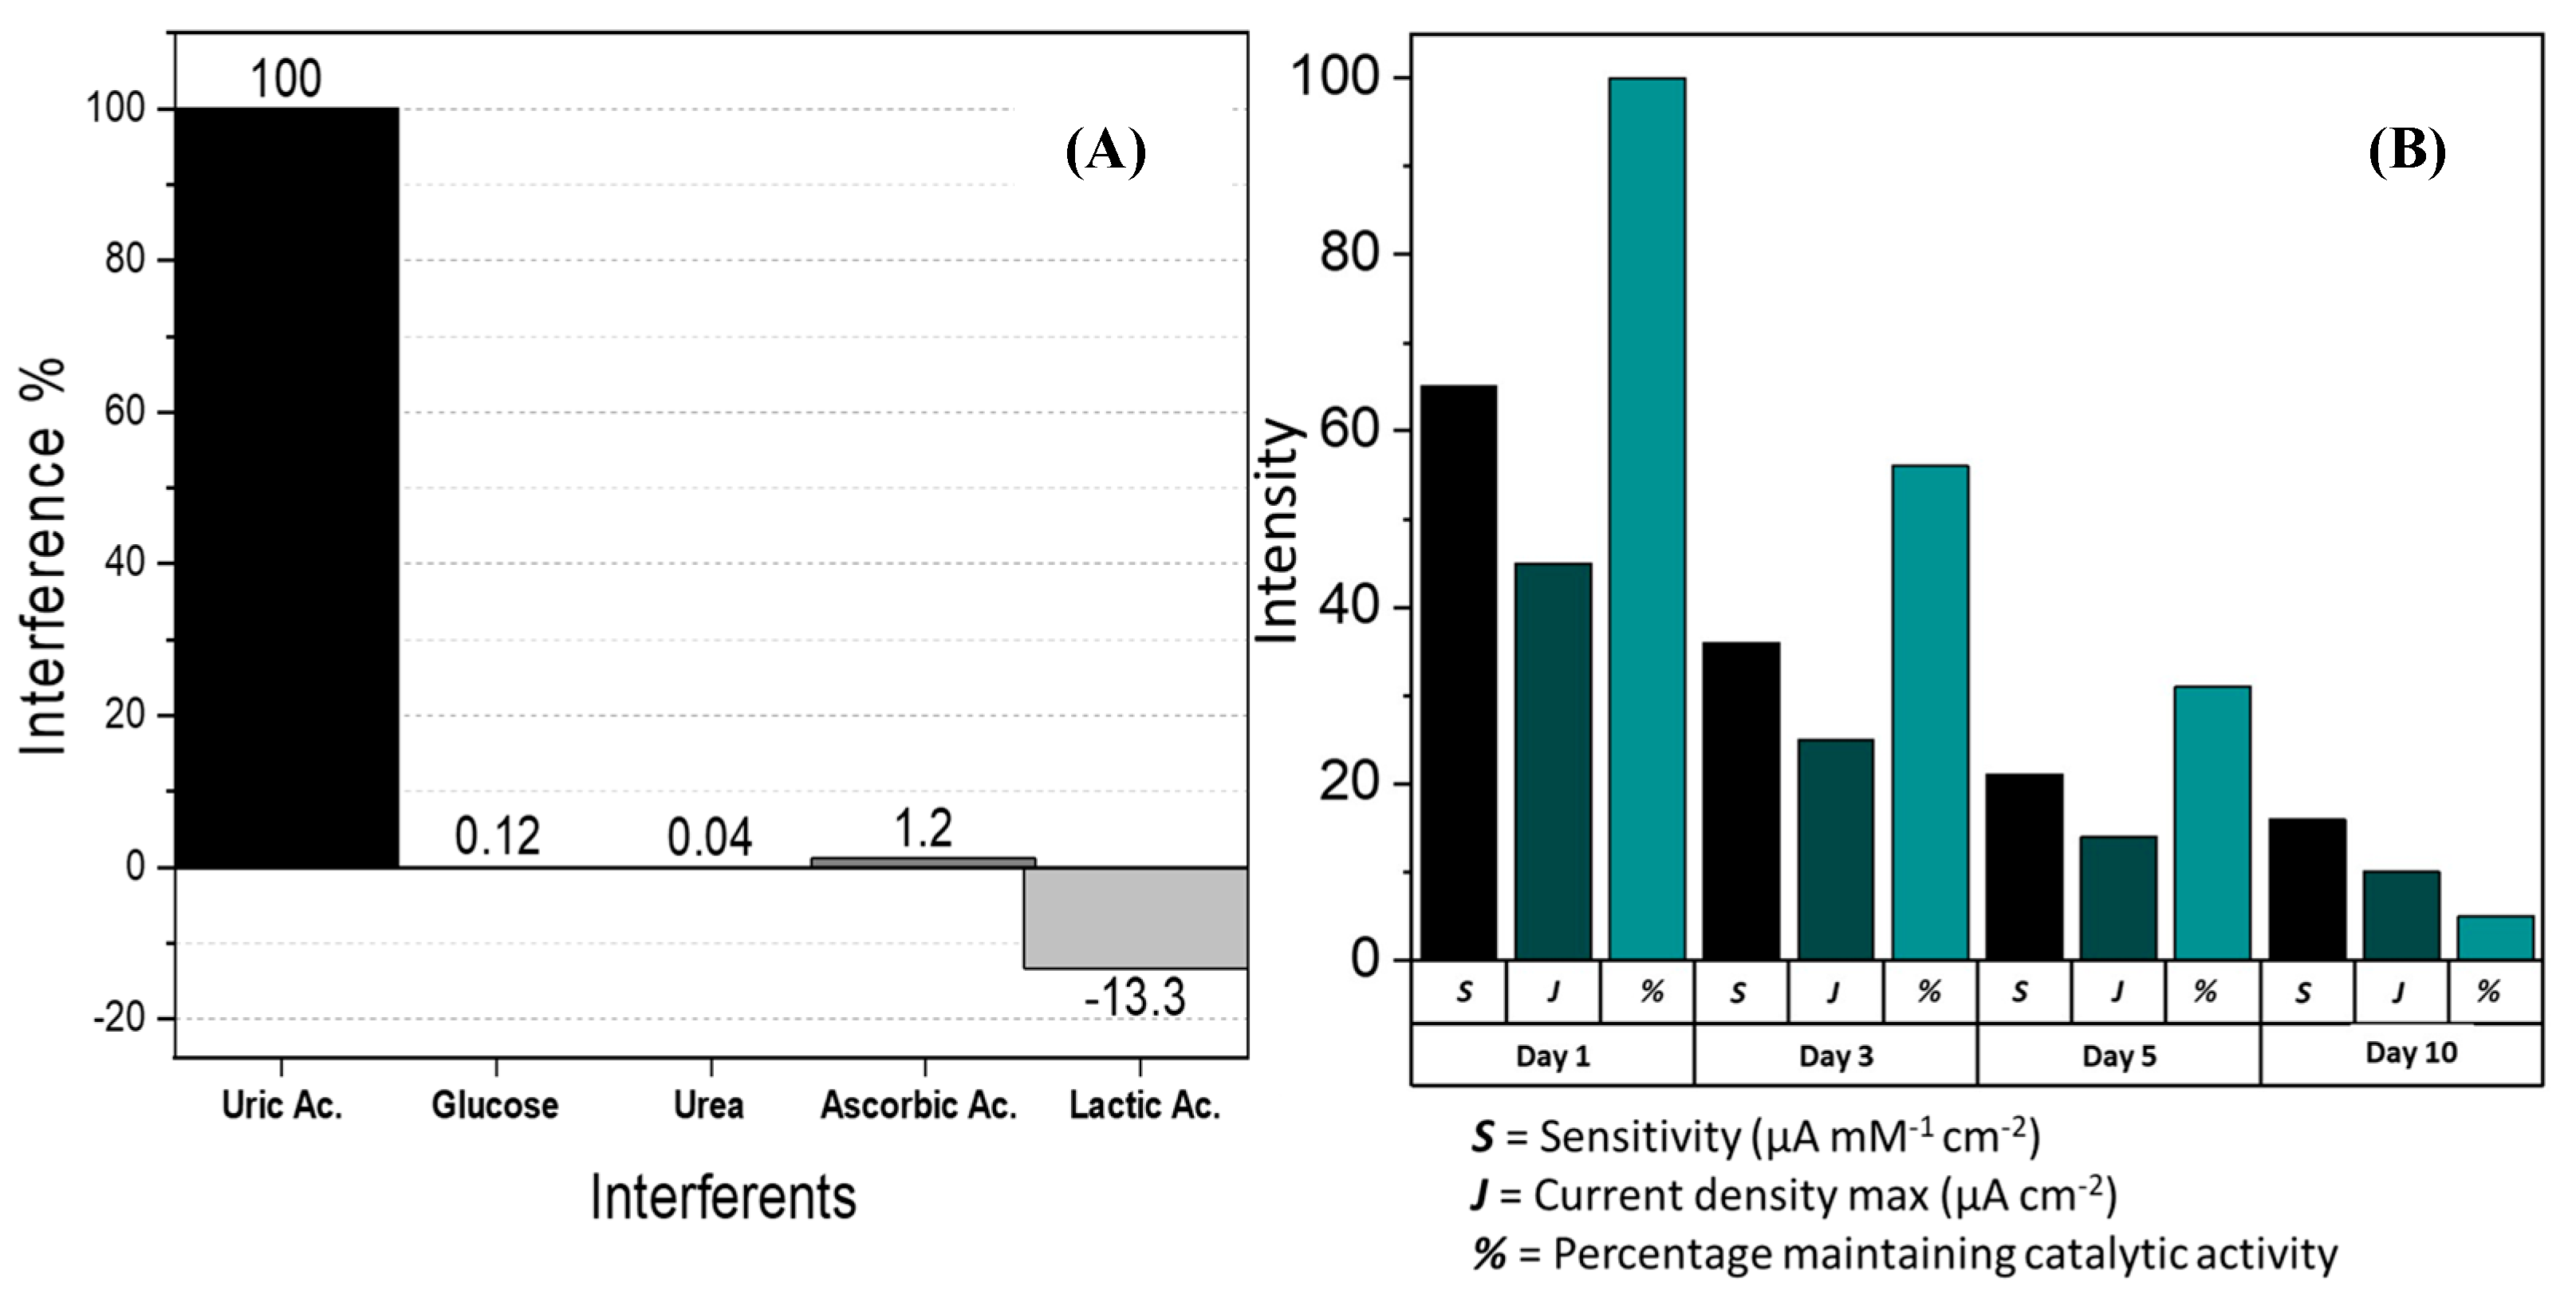
3.2.2. Interferents and Stability Tests of GCE/Co3O4/UOx

Figure 5A shows the stability of the sensor with most of the interferents: glucose (0.12%) and urea (0.04%) show an interference of less than 1%. Lactic acid showed a decrease in interference of −13.3% in the test, but none of these interferences affected the subsequent increase in current when uric acid was added to the electrolyte, therefore the percentage of interference is not significant compared to the response with uric acid.
Stability tests for sensor activity were performed over a 10-day period using the last day of electrode deposition. Figure 5B shows a comparison of sensitivity (S), maximum current density (J) at 500 µM and percentage retention of catalytic activity (%) between 1, 3, 5 and 10 days. Sensitivity was 45 µA mM−1 cm−2 on day 1 and decreased by 36 µA mM−1 cm−2, 21 µA mM−1 cm−2 and 16 µA mM−1 cm−2 on days 3, 5 and 10, respectively, indicating a 64% decrease in sensitivity between day 1 and day 10. While J was 45 µM cm−2 on day 1, activity remained at 57% on day 3, 32% on day 5 and 6% on day 10, indicating that the GCE/Co3O4/UOx bioelectrodes are stable between the first three days of assessment.

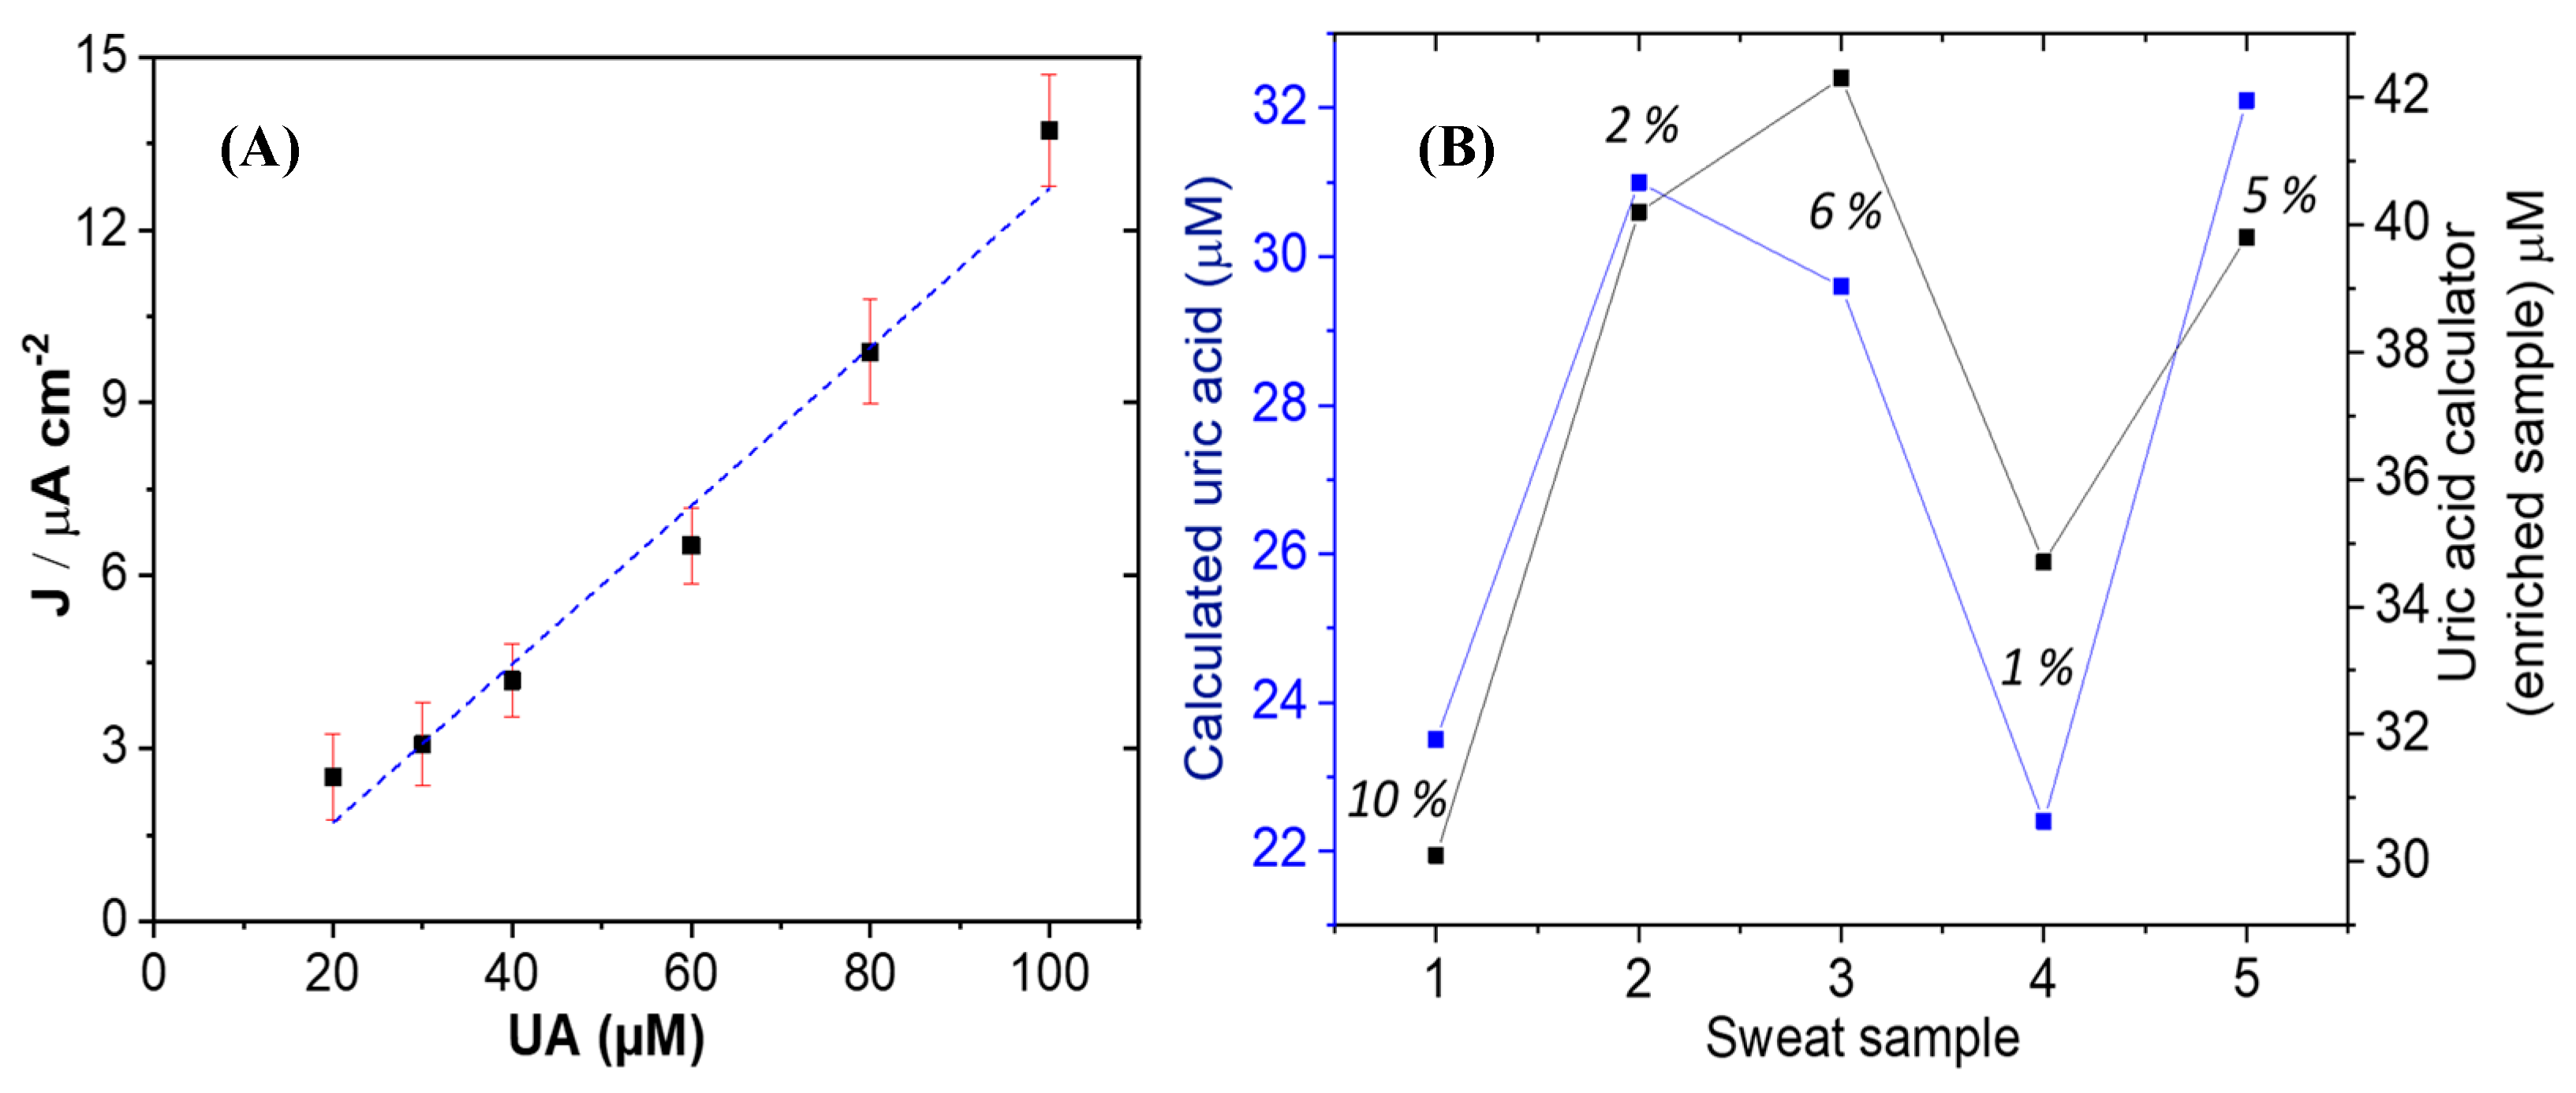
3.2.3. Electrocatalytic Reaction of GCE/Co3O4/UOx Using the Miniaturized Device in Artificial Sweat and Real Sweat

After the functionality of the GCE/Co3O4/UOx bioelectrode was demonstrated in PBS pH 5.6, it was further evaluated using the miniaturized device. According to the methodology, TCP/Co3O4/UOx was used as WE, TCP as CE and the commercial Ag NPs as RE. Using artificial sweat (150 µL) as the electrolyte, known uric acid concentrations between 0 and 100 µM were used and a constant potential of 0.35 V (against Ag/AgCl) was applied. It was found that the best linear response was from 20–100 µM (r = 0.9725) with a sensitivity of 141 µM mM−1 cm−2 and LOD and LOQ of 1.3 µM and 4.2 µM, respectively (Figure 6A). The improvement in overall performance when using artificial sweat could be due to the fact that it contains ions such as NaCl, which enable better conductivity of the electrolyte. Subsequently, five sweat samples from healthy volunteers were used. The sweat was directly used in the miniaturized device to measure the response current and calculate the sweat concentration using the straight line equation of artificial sweat (Figure 6B blue line), then the sample was enriched with 10 µM uric acid and the bioelectrode was measured again, where the calculated uric acid concentration was reported (Figure 6B black line), and finally the relative error is reported considering the calculated value and the actual value, which turned out to be less than 10%, indicating that the measurements have a small error and could be reliable.
There are several works that determine uric acid in sweat based on enzymes and using different materials such as Au@Cu metal organic frameworks [46], Ppy-Co-NNC/SPCE [47], inorganic alumina with MWCNTs [48], graphene [6,49] and silver nanowires@Prussian blue composite [50]. The results published so far compare the quantification of UA with conventional methods and in most cases report values of enzymatic activity of less than 10%. It should be noted that this work reports the use of Co3O4 and UOx enzymes that maintain their redox activity at pH 5.6. Other Co-based materials have been described for the non-enzymatic quantification of uric acid, but at non-biological pH values or electrolytes [33,51].

4. Conclusions

In this work, Co3O4 was synthesized by a simple method and combined with the UOx enzyme by cross-linking. This Co3O4/UOx combination exhibited higher current density, sensitivity, low limits of detection and quantification and maintenance of this catalytic activity in PBS at pH 5.6. These results were comparable and equivalent to those in several published articles. The performance of the catalytic activity of the Co3O4/UOx material in acidic medium was evaluated in a miniaturized device using small amounts of artificial and real human sweat to quantify UA. The combination of both catalysts, uricase enzyme and Co3O4, enabled a synergistic performance with potential applications of the microfluidic device sensor, which could be tested under several operating environments.

Author Contributions

Conceptualization, J.L.-G. and L.G.A.; methodology, C.D.R.-G. and D.V.E.-O.; formal analysis, F.I.E.-L., R.A.E.-V. and A.G.; investigation, C.D.R.-G.; resources, G.L.-B.; data curation, R.A.E.-V. and A.G.; writing—original draft preparation, C.D.R.-G. and D.V.E.-O.; writing—review and editing, J.L.-G. and L.G.A.; visualization, F.I.E.-L.; funding acquisition, J.L.-G., G.L.-B. and L.G.A. All authors have read and agreed to the published version of the manuscript.

Funding

This research was funded by Mexican Council for Humanities, Sciences and Technologies (CONAHCYT) for the financial support through the project Ciencia de Frontera 2023-Grant 416.

Institutional Review Board Statement

The study was conducted in accordance with the Declaration of Helsinki, and approved by the Ethics Committee of Facultad de Ingeniería, Universidad Autónoma de Querétaro (CEAIFI-100-2022-TL and 8 June 2022).

Informed Consent Statement

Informed consent was obtained from all subjects involved in the study.

Data Availability Statement

Data are contained within the article.

Conflicts of Interest

The authors declare no conflict of interest.

References

  1. Johnson, R.J.; Kang, D.-H.; Feig, D.; Kivlighn, S.; Kanellis, J.; Watanabe, S.; Tuttle, K.R.; Rodriguez-Iturbe, B.; Herrera-Acosta, J.; Mazzali, M. Is There a Pathogenetic Role for Uric Acid in Hypertension and Cardiovascular and Renal Disease? Hypertension 2003, 41, 1183–1190. [Google Scholar] [CrossRef] [PubMed]
  2. Dutt, V.E.; Mottola, H.A. Determination of Uric Acid at the Microgram Level by a Kinetic Procedure Based on a Pseudo-Induction Period. Anal. Chem. 1974, 46, 1777–1781. [Google Scholar] [CrossRef] [PubMed]
  3. Raj, C.R.; Ohsaka, T. Voltammetric Detection of Uric Acid in the Presence of Ascorbic Acid at a Gold Electrode Modified with a Self-Assembled Monolayer of Heteroaromatic Thiol. J. Electroanal. Chem. 2003, 540, 69–77. [Google Scholar] [CrossRef]
  4. Alderman, M.; Aiyer, K.J.V. Uric Acid: Role in Cardiovascular Disease and Effects of Losartan. Curr. Med. Res. Opin. 2004, 20, 369–379. [Google Scholar] [CrossRef]
  5. Huang, S.-H.; Shih, Y.-C.; Wu, C.-Y.; Yuan, C.-J.; Yang, Y.-S.; Li, Y.-K.; Wu, T.-K. Detection of Serum Uric Acid Using the Optical Polymeric Enzyme Biochip System. Biosens. Bioelectron. 2004, 19, 1627–1633. [Google Scholar] [CrossRef]
  6. Aafria, S.; Kumari, P.; Sharma, S.; Yadav, S.; Batra, B.; Rana, J.S.; Sharma, M. Electrochemical Biosensing of Uric Acid: A Review. Microchem. J. 2022, 182, 107945. [Google Scholar] [CrossRef]
  7. Ma, C.-B.; Shang, X.; Zhu, Z.; Zheng, L.; Sun, M.; Cao, M.; Bai, J.; Du, Y.; Zhou, M. Evolving Health Monitoring: Nanoscale Flexible Electronics for Noninvasive Uric Acid Analysis in Sweat. TrAC Trends Anal. Chem. 2024, 179, 117889. [Google Scholar] [CrossRef]
  8. Maiuolo, J.; Oppedisano, F.; Gratteri, S.; Muscoli, C.; Mollace, V. Regulation of Uric Acid Metabolism and Excretion. Int. J. Cardiol. 2016, 213, 8–14. [Google Scholar] [CrossRef]
  9. Erden, P.E.; Kılıç, E. A Review of Enzymatic Uric Acid Biosensors Based on Amperometric Detection. Talanta 2013, 107, 312–323. [Google Scholar] [CrossRef]
  10. Cook, J.D.; Strauss, K.A.; Caplan, Y.H.; LoDico, C.P.; Bush, D.M. Urine PH: The Effects of Time and Temperature after Collection. J. Anal. Toxicol. 2007, 31, 486–496. [Google Scholar] [CrossRef]
  11. Huang, C.T.; Chen, M.L.; Huang, L.L.; Mao, I.F. Uric Acid and Urea in Human Sweat. Chin. J. Physiol. 2002, 45, 109–116. [Google Scholar] [PubMed]
  12. Xu, Z.; Song, J.; Liu, B.; Lv, S.; Gao, F.; Luo, X.; Wang, P. A Conducting Polymer PEDOT:PSS Hydrogel Based Wearable Sensor for Accurate Uric Acid Detection in Human Sweat. Sens. Actuators B Chem. 2021, 348, 130674. [Google Scholar] [CrossRef]
  13. Promphet, N.; Rattanawaleedirojn, P.; Siralertmukul, K.; Soatthiyanon, N.; Potiyaraj, P.; Thanawattano, C.; Hinestroza, J.P.; Rodthongkum, N. Non-Invasive Textile Based Colorimetric Sensor for the Simultaneous Detection of Sweat PH and Lactate. Talanta 2019, 192, 424–430. [Google Scholar] [CrossRef] [PubMed]
  14. Shibasaki, K.; Kimura, M.; Ikarashi, R.; Yamaguchi, A.; Watanabe, T. Uric Acid Concentration in Saliva and Its Changes with the Patients Receiving Treatment for Hyperuricemia. Metabolomics 2012, 8, 484–491. [Google Scholar] [CrossRef]
  15. Georgakopoulos, C.D.; Lamari, F.N.; Karathanasopoulou, I.N.; Gartaganis, V.S.; Pharmakakis, N.M.; Karamanos, N.K. Tear Analysis of Ascorbic Acid, Uric Acid and Malondialdehyde with Capillary Electrophoresis. Biomed. Chromatogr. 2009, 24, 852–857. [Google Scholar] [CrossRef]
  16. Horwath-Winter, J.; Kirchengast, S.; Meinitzer, A.; Wachswender, C.; Faschinger, C.; Schmut, O. Determination of Uric Acid Concentrations in Human Tear Fluid, Aqueous Humour and Serum. Acta Ophthalmol. 2009, 87, 188–192. [Google Scholar] [CrossRef]
  17. Martinez-Pérez, D.; Ferrer, M.L.; Mateo, C.R. A Reagent Less Fluorescent Sol–Gel Biosensor for Uric Acid Detection in Biological Fluids. Anal. Biochem. 2003, 322, 238–242. [Google Scholar] [CrossRef]
  18. Ravariu, C.; Parvulescu, C.C.; Manea, E.; Tucureanu, V. Optimized Technologies for Cointegration of MOS Transistor and Glucose Oxidase Enzyme on a Si-Wafer. Biosensors 2021, 11, 497. [Google Scholar] [CrossRef]
  19. Robescu, M.S.; Bavaro, T. A Comprehensive Guide to Enzyme Immobilization: All You Need to Know. Molecules 2025, 30, 939. [Google Scholar] [CrossRef]
  20. Uchiyama, S.; Sakamoto, H. Immobilization of Uricase to Gas Diffusion Carbon Felt by Electropolymerization of Aniline and Its Application as an Enzyme Reactor for Uric Acid Sensor. Talanta 1997, 44, 1435–1439. [Google Scholar] [CrossRef]
  21. Kang, L.; He, D.; Bie, L.; Jiang, P. Nanoporous Cobalt Oxide Nanowires for Non-Enzymatic Electrochemical Glucose Detection. Sens. Actuators B Chem. 2015, 220, 888–894. [Google Scholar] [CrossRef]
  22. Hou, Y.; Ndamanisha, J.C.; Guo, L.; Peng, X.; Bai, J. Synthesis of Ordered Mesoporous Carbon/Cobalt Oxide Nanocomposite for Determination of Glutathione. Electrochim. Acta 2009, 54, 6166–6171. [Google Scholar] [CrossRef]
  23. Numan, A.; Shahid, M.M.; Omar, F.S.; Ramesh, K.; Ramesh, S. Facile Fabrication of Cobalt Oxide Nanograin-Decorated Reduced Graphene Oxide Composite as Ultrasensitive Platform for Dopamine Detection. Sens. Actuators B Chem. 2017, 238, 1043–1051. [Google Scholar] [CrossRef]
  24. Puspalak, A.; Chinnadurai, P.; Prathibha, R.; Kumar, M.P.; Manjushree, S.G.; UdayaKumar, V.; Adarakatti, P.S. Cobalt Oxide Nanoparticles Based Carbon Electrode for the Detection of Residual Nitrite in the Soil of Agricultural Fields. Mater. Res. Innov. 2023, 27, 100–109. [Google Scholar] [CrossRef]
  25. Li, S.-J.; Du, J.-M.; Zhang, J.-P.; Zhang, M.-J.; Chen, J. A Glassy Carbon Electrode Modified with a Film Composed of Cobalt Oxide Nanoparticles and Graphene for Electrochemical Sensing of H2O2. Microchim. Acta 2014, 181, 631–638. [Google Scholar] [CrossRef]
  26. Akyilmaz, E. A Biosensor Based on Urate Oxidase–Peroxidase Coupled Enzyme System for Uric Acid Determination in Urine. Talanta 2003, 61, 73–79. [Google Scholar] [CrossRef]
  27. Kuwabata, S.; Nakaminami, T.; Ito, S.; Yoneyama, H. Preparation and Properties of Amperometric Uric Acid Sensors. Sens. Actuators B Chem. 1998, 52, 72–77. [Google Scholar] [CrossRef]
  28. Arora, K.; Tomar, M.; Gupta, V. Highly Sensitive and Selective Uric Acid Biosensor Based on RF Sputtered NiO Thin Film. Biosens. Bioelectron. 2011, 30, 333–336. [Google Scholar] [CrossRef]
  29. Arora, K.; Sumana, G.; Saxena, V.; Gupta, R.K.; Gupta, S.K.; Yakhmi, J.V.; Pandey, M.K.; Chand, S.; Malhotra, B.D. Improved Performance of Polyaniline-Uricase Biosensor. Anal. Chim. Acta 2007, 594, 17–23. [Google Scholar] [CrossRef]
  30. Zhao, C.; Wan, L.; Wang, Q.; Liu, S.; Jiao, K. Highly Sensitive and Selective Uric Acid Biosensor Based on Direct Electron Transfer of Hemoglobin-Encapsulated Chitosan-Modified Glassy Carbon Electrode. Anal. Sci. 2009, 25, 1013–1017. [Google Scholar] [CrossRef]
  31. Kanyong, P.; Pemberton, R.M.; Jackson, S.K.; Hart, J.P. Development of a Sandwich Format, Amperometric Screen-Printed Uric Acid Biosensor for Urine Analysis. Anal. Biochem. 2012, 428, 39–43. [Google Scholar] [CrossRef] [PubMed]
  32. Wang, Y.; Yu, L.; Zhu, Z.; Zhang, J.; Zhu, J. Novel Uric Acid Sensor Based on Enzyme Electrode Modified by ZnO Nanoparticles and Multiwall Carbon Nanotubes. Anal. Lett. 2009, 42, 775–789. [Google Scholar] [CrossRef]
  33. John, J.F.; Dhinasekaran, D.; Subashchandran, S. Cobalt Doped NiFe2O4 on 3D Nickel Foam Substrate for Electrochemical Detection of Uric Acid. Surf. Interfaces 2024, 44, 103629. [Google Scholar] [CrossRef]
  34. Wang, L.; Pan, L.; Han, X.; Ha, M.N.; Li, K.; Yu, H.; Zhang, Q.; Li, Y.; Hou, C.; Wang, H. A Portable Ascorbic Acid in Sweat Analysis System Based on Highly Crystalline Conductive Nickel-Based Metal-Organic Framework (Ni-MOF). J. Colloid Interface Sci. 2022, 616, 326–337. [Google Scholar] [CrossRef]
  35. Baker, L.B.; Wolfe, A.S. Physiological Mechanisms Determining Eccrine Sweat Composition. Eur. J. Appl. Physiol. 2020, 120, 719–752. [Google Scholar] [CrossRef]
  36. Eggenstein, C.; Borchardt, M.; Diekmann, C.; Gründig, B.; Dumschat, C.; Cammann, K.; Knoll, M.; Spener, F. A Disposable Biosensor for Urea Determination in Blood Based on an Ammonium-Sensitive Transducer. Biosens. Bioelectron. 1999, 14, 33–41. [Google Scholar] [CrossRef]
  37. Al-Tamer, Y.Y.; Hadi, E.A.; Al-Badrani, I. Sweat Urea, Uric Acid and Creatinine Concentrations in Uraemic Patients. Urol. Res. 1997, 25, 337–340. [Google Scholar] [CrossRef]
  38. Su, D.; Dou, S.; Wang, G. Single Crystalline Co3O4 Nanocrystals Exposed with Different Crystal Planes for Li-O2 Batteries. Sci. Rep. 2014, 4, 5767. [Google Scholar] [CrossRef]
  39. Cardenas-Flechas, L.J.; Barba-Ortega, J.J.; Joya, M.R. Analysis and Evaluation of Structural Properties of Co3O4 Microparticles Obtained at Low Temperature. Cerâmica 2022, 68, 52–59. [Google Scholar] [CrossRef]
  40. Karuppiah, C.; Thirumalraj, B.; Alagar, S.; Piraman, S.; Li, Y.-J.J.; Yang, C.-C. Solid-State Ball-Milling of Co3O4 Nano/Microspheres and Carbon Black Endorsed LaMnO3 Perovskite Catalyst for Bifunctional Oxygen Electrocatalysis. Catalysts 2021, 11, 76. [Google Scholar] [CrossRef]
  41. Wu, W.-T.; Huang, Z.; Liu, Y.; Hong, J.; Zhang, Q. Novel Co-MOF/GO Triggered Peroxymonosulfate Activation: Insight into Singlet Oxygen Generation Mechanism from Peroxymonosulfate Self-Decomposition and Secondary Radical Conversion. Chem. Eng. J. 2023, 476, 146365. [Google Scholar] [CrossRef]
  42. Ruiz-Guerrero, C.D.; Estrada-Osorio, D.V.; Gutiérrez, A.; Espinosa-Lagunes, F.I.; Escalona-Villalpando, R.A.; Luna-Bárcenas, G.; Molina, A.; Arenillas, A.; Arriaga, L.G.; Ledesma-García, J. Novel Cobalt-Based Aerogels for Uric Acid Detection in Fluids at Physiological PH. Biosens. Bioelectron. 2025, 267, 116850. [Google Scholar] [CrossRef]
  43. Chelmea, L.; Badea, M.; Scarneciu, I.; Moga, M.A.; Dima, L.; Restani, P.; Murdaca, C.; Ciurescu, D.; Gaman, L.E. New Trends in Uric Acid Electroanalysis. Chemosensors 2023, 11, 341. [Google Scholar] [CrossRef]
  44. Moutcine, A.; Laghlimi, C.; Ziat, Y.; El Bahraoui, S.; Belkhanchi, H.; Jouaiti, A. Advanced Design of Chemically Modified Electrodes for the Electrochemical Analysis of Uric Acid and Xanthine. J. Pharm. Biomed. Anal. 2025, 253, 116536. [Google Scholar] [CrossRef]
  45. Cheng, J.; Wu, Y.; Zhu, L.; Lin, S.; Liu, Y.; Huang, K.; Xu, W. Uric Acid Biosensors Based on Molecular Recognition: Classifications, Advances, and Prospects. TrAC Trends Anal. Chem. 2024, 179, 117887. [Google Scholar] [CrossRef]
  46. Zhou, F.; Lim, H.N.; Ibrahim, I.; Endot, N.A.; Malek, E.A.; Gowthaman, N.S.K. Simultaneous Electrochemical Detection of Dopamine and Uric Acid via Au@Cu-Metal Organic Framework. Chempluschem 2024, 89, e202300686. [Google Scholar] [CrossRef]
  47. Liu, Y.; Zhang, Y.; Wang, C.; Zeng, X.; Lei, J.; Hou, J.; Huo, D.; Hou, C. Co Single-Atom Nanozymes for the Simultaneous Electrochemical Detection of Uric Acid and Dopamine in Biofluids. ACS Appl. Nano. Mater. 2024, 7, 6273–6283. [Google Scholar] [CrossRef]
  48. Wang, L.; Gao, N.; Cai, Z.; Grushevskaya, H.; He, H.; He, Y.; Chang, G. Alumina Inorganic Molecularly Imprinted Polymer Modified Multi-Walled Carbon Nanotubes for Uric Acid Detection in Sweat. Microchim. Acta 2024, 191, 247. [Google Scholar] [CrossRef]
  49. Fang, B.; Zhao, Z.; Ma, J.; Li, H.; Yan, F.; Tao, X. In Vitro Detection of Lactate and Uric Acid Based on Adaptive Graphene Oxide Membranes. Small Sci. 2024, 4, 2300264. [Google Scholar] [CrossRef]
  50. Jiang, D.; Zhu, Y.; Sun, Z.; Zhu, Z.; He, Q.; Huang, X.; Yang, Y.; Ge, Y.; Zhang, Q.; Wang, Y. A Silver Nanowires@Prussian Blue Composite Aerogel-Based Wearable Sensor for Noninvasive and Dynamic Monitoring of Sweat Uric Acid. Chem. Eng. J. 2024, 486, 150220. [Google Scholar] [CrossRef]
  51. Albaqami, M.D.; Medany, S.S.; Nafady, A.; Ibupoto, M.H.; Willander, M.; Tahira, A.; Aftab, U.; Vigolo, B.; Ibupoto, Z.H. The Fast Nucleation/Growth of Co 3 O 4 Nanowires on Cotton Silk: The Facile Development of a Potentiometric Uric Acid Biosensor. RSC Adv. 2022, 12, 18321–18332. [Google Scholar] [CrossRef]
Scheme 1. Configuration of the miniaturized device made of TPU (A) with the electrodes used and (B) with the dimensions and areas of the support electrolyte reservoir and the catalytic area.
Chemosensors 13 00114 sch001
Figure 1. Physico-chemical analysis, (A) XRD of Co3O4 powders, (B) SEM images of Co3O4.
Chemosensors 13 00114 g001
Figure 2. XPS analysis: (A) general of Co3O4, (B) elemental of Co 2p of Co3O4. The color lines represent the deconvolution of real analysis.
Chemosensors 13 00114 g002
Figure 3. Cyclic voltammetry at 100 μM UA on (a) GCE/Co3O4/UOx, (b) GCE/UOx and (c) GCE/Co3O4 at 10 mV s−1 in PBS pH 5.6.
Chemosensors 13 00114 g003
Figure 4. (A) DCPA at 0.3 V on GCE/Co3O4/UOx vs. Ag/AgCl, under stirring. (B) Calibration curves of GCE/Co3O4/UOx and GCE/UOx in PBS pH 5.6; the linear response of the bioelectrodes from 1–100 µM is shown in the inset.
Chemosensors 13 00114 g004
Figure 5. Interference tests by concentration (A) UA: uric acid, GLU: glucose, UR: urea, AL: lactic acid, AA: ascorbic acid and (B) stability tests for 1, 3, 5 and 10 days.
Chemosensors 13 00114 g005
Figure 6. (A) Calibration curve of the uric acid sensing system in the presence of artificial sweat. (B) The UA concentration in human sweat calculated from the calibration curve of UA in artificial sweat (A). The blue line shows the UA concentration calculated with the addition of 10 µM UA in sweat, the percentages show the relative errors.
Chemosensors 13 00114 g006
Table 1. Reported uric acid concentrations in different biological fluids.
FluidConcentration (µM)pHReference
Blood90–4207.4[8]
Urine1400–44004.5–8.0 (5–6)[9,10]
Sweat24.54.0–6.8[11,12,13]
Saliva201.1 ± 2.56.7–7.5[14]
Tears107.2–118.97.0–7.7[15,16]
Table 2. Detection of UA by various reported biosensors.
FluidRESupportLODSLRReference
SweatUOx/PSSPEDOT
hydrogel
1.2 μM0.875 μA mM−1 cm−22–250 μM[12]
UrineUOxTeflon membrane0.1 μM-0.1–0.5 μM[26]
Biological fluidsUOxSol–gel matrix20 nM-20 nM–1 μM[17]
UrineUOxPorous carbon4 μM2.5 μA mM−1 cm−210.0–400 μM[20]
BloodUOxAu electrode-143.0 nA μM−1 cm−26 μM[27]
BloodUOxPt/Ti/NiO cover on glass0.11 mM1278.48
μA mM−1 cm−2
0.05–1 mM[28]
BloodUOxPolyaniline screen0.01 mM47.2 mA mM−1
10.66 mA mM−1
0.01–0.05 mM
0.1–0.6 mM
[29]
UrineUOxChitosan0.85 μM29.5 μA mM−1 cm−22.0–30 μM[30]
UrineUOxCarbon electrode0.015 mM2.10 μA mM−1 cm−20.015–0.25 mM[31]
UrineUOxZNO/MWCNT modified electrode2.0 mM393.0 mA M−1 cm−25.0–1000 μM[32]
RE: Recognizing element; LOD: Limit of detection; S: sensitivity; LR: Linear range.
Table 3. Kinetics and sensor parameters of cobalt-oxide-based materials in the presence of uric acid.
ElectrodeKm (µM)S
(µA mM−1 cm−2)
LOD (µM)LOQ (µM)
GCE/Co3O4/UOx30.9653.7 ± 0.512.3
GCE/UOx10.8455.3 ± 0.117.7
Km: Michaelis–Menten constant, S: Sensitivity, LOD: Limit of detection, LOQ: Limit of quantification, LR: Linear range.
Disclaimer/Publisher’s Note: The statements, opinions and data contained in all publications are solely those of the individual author(s) and contributor(s) and not of MDPI and/or the editor(s). MDPI and/or the editor(s) disclaim responsibility for any injury to people or property resulting from any ideas, methods, instructions or products referred to in the content.

