Portable 3D-Printed Paper Microfluidic System with a Smartphone Reader for Fast and Reliable Copper Ion Monitoring


 , and
, and 
Abstract
1. Introduction
2. Experimental Section
2.1. Chemicals
2.2. Instruments
2.3. Synthesis of 1-(N,N-dichlormethine) Amino-4-rhodamine B Hydrazine-Benzamide (RBCl)
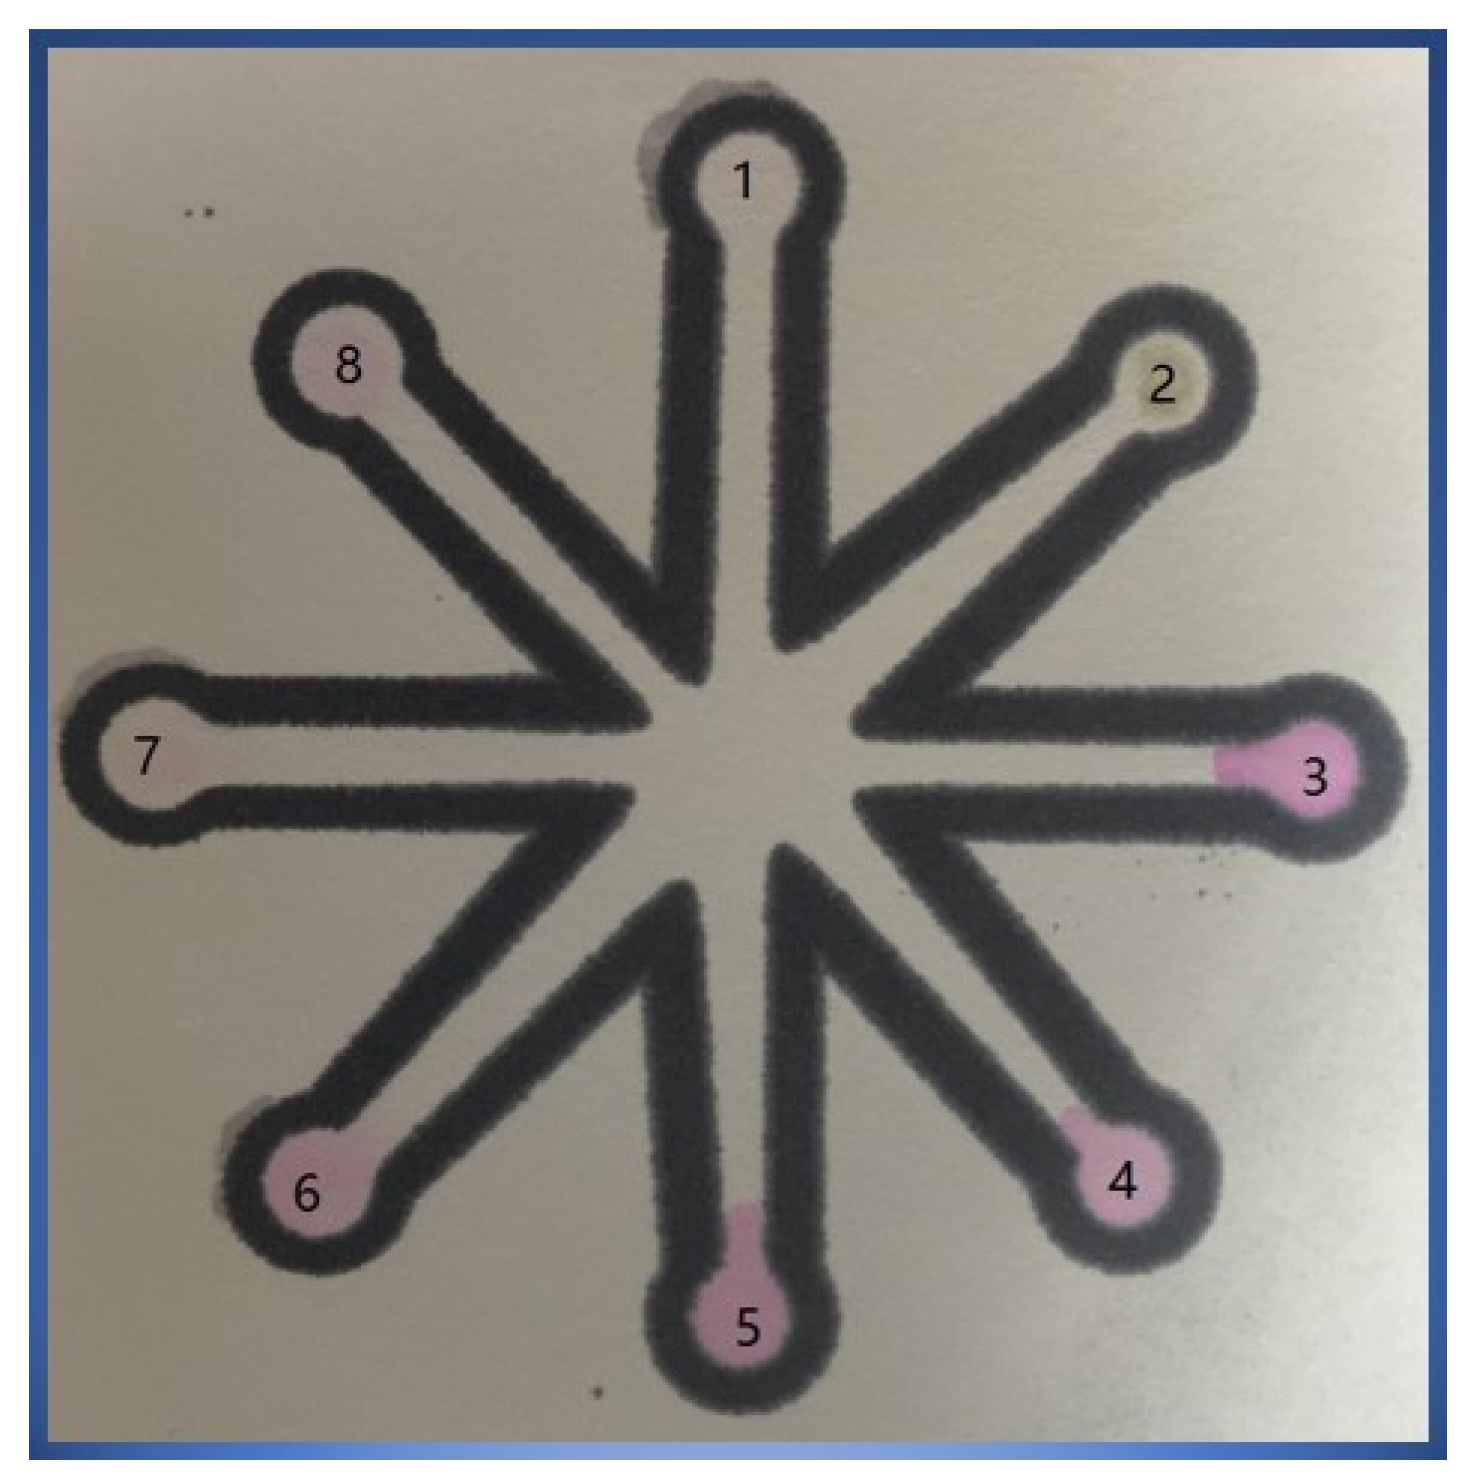
2.4. Fabrication of Paper Microfluidic
2.5. Detection of Cu2+ Ions
2.6. Detection of Cu2+ Ions in Real Samples
3. Results and Discussion
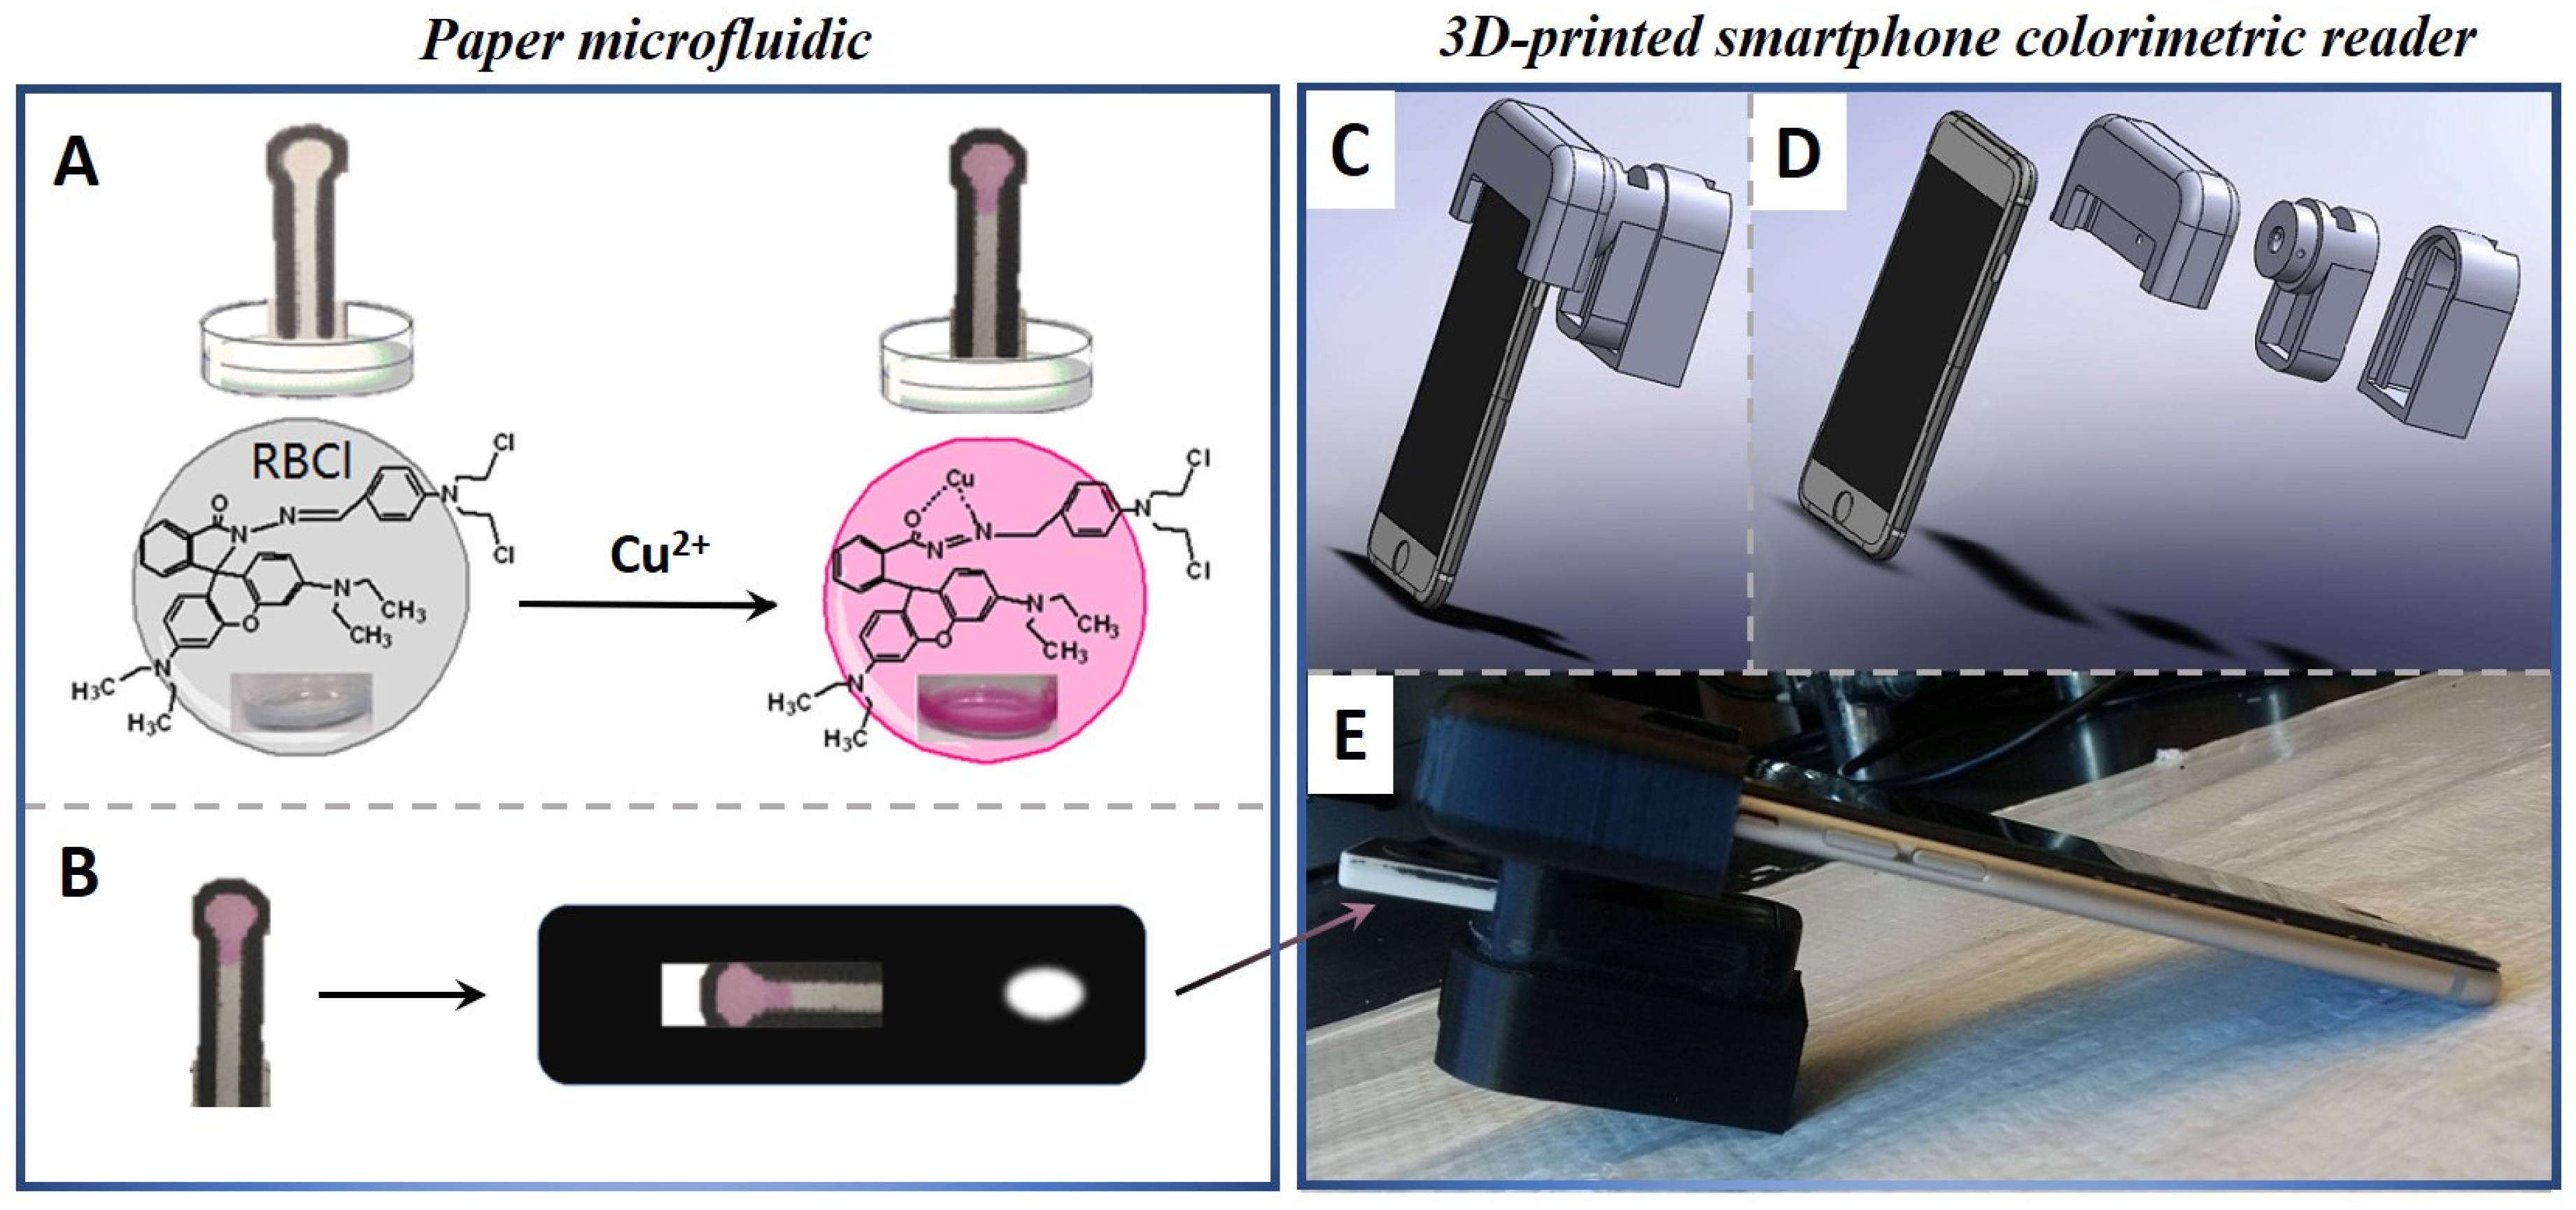
3.1. Interaction Mechanism of RBCI-Cu2+
3.2. Principle of Integration Design
3.3. Effect of pH
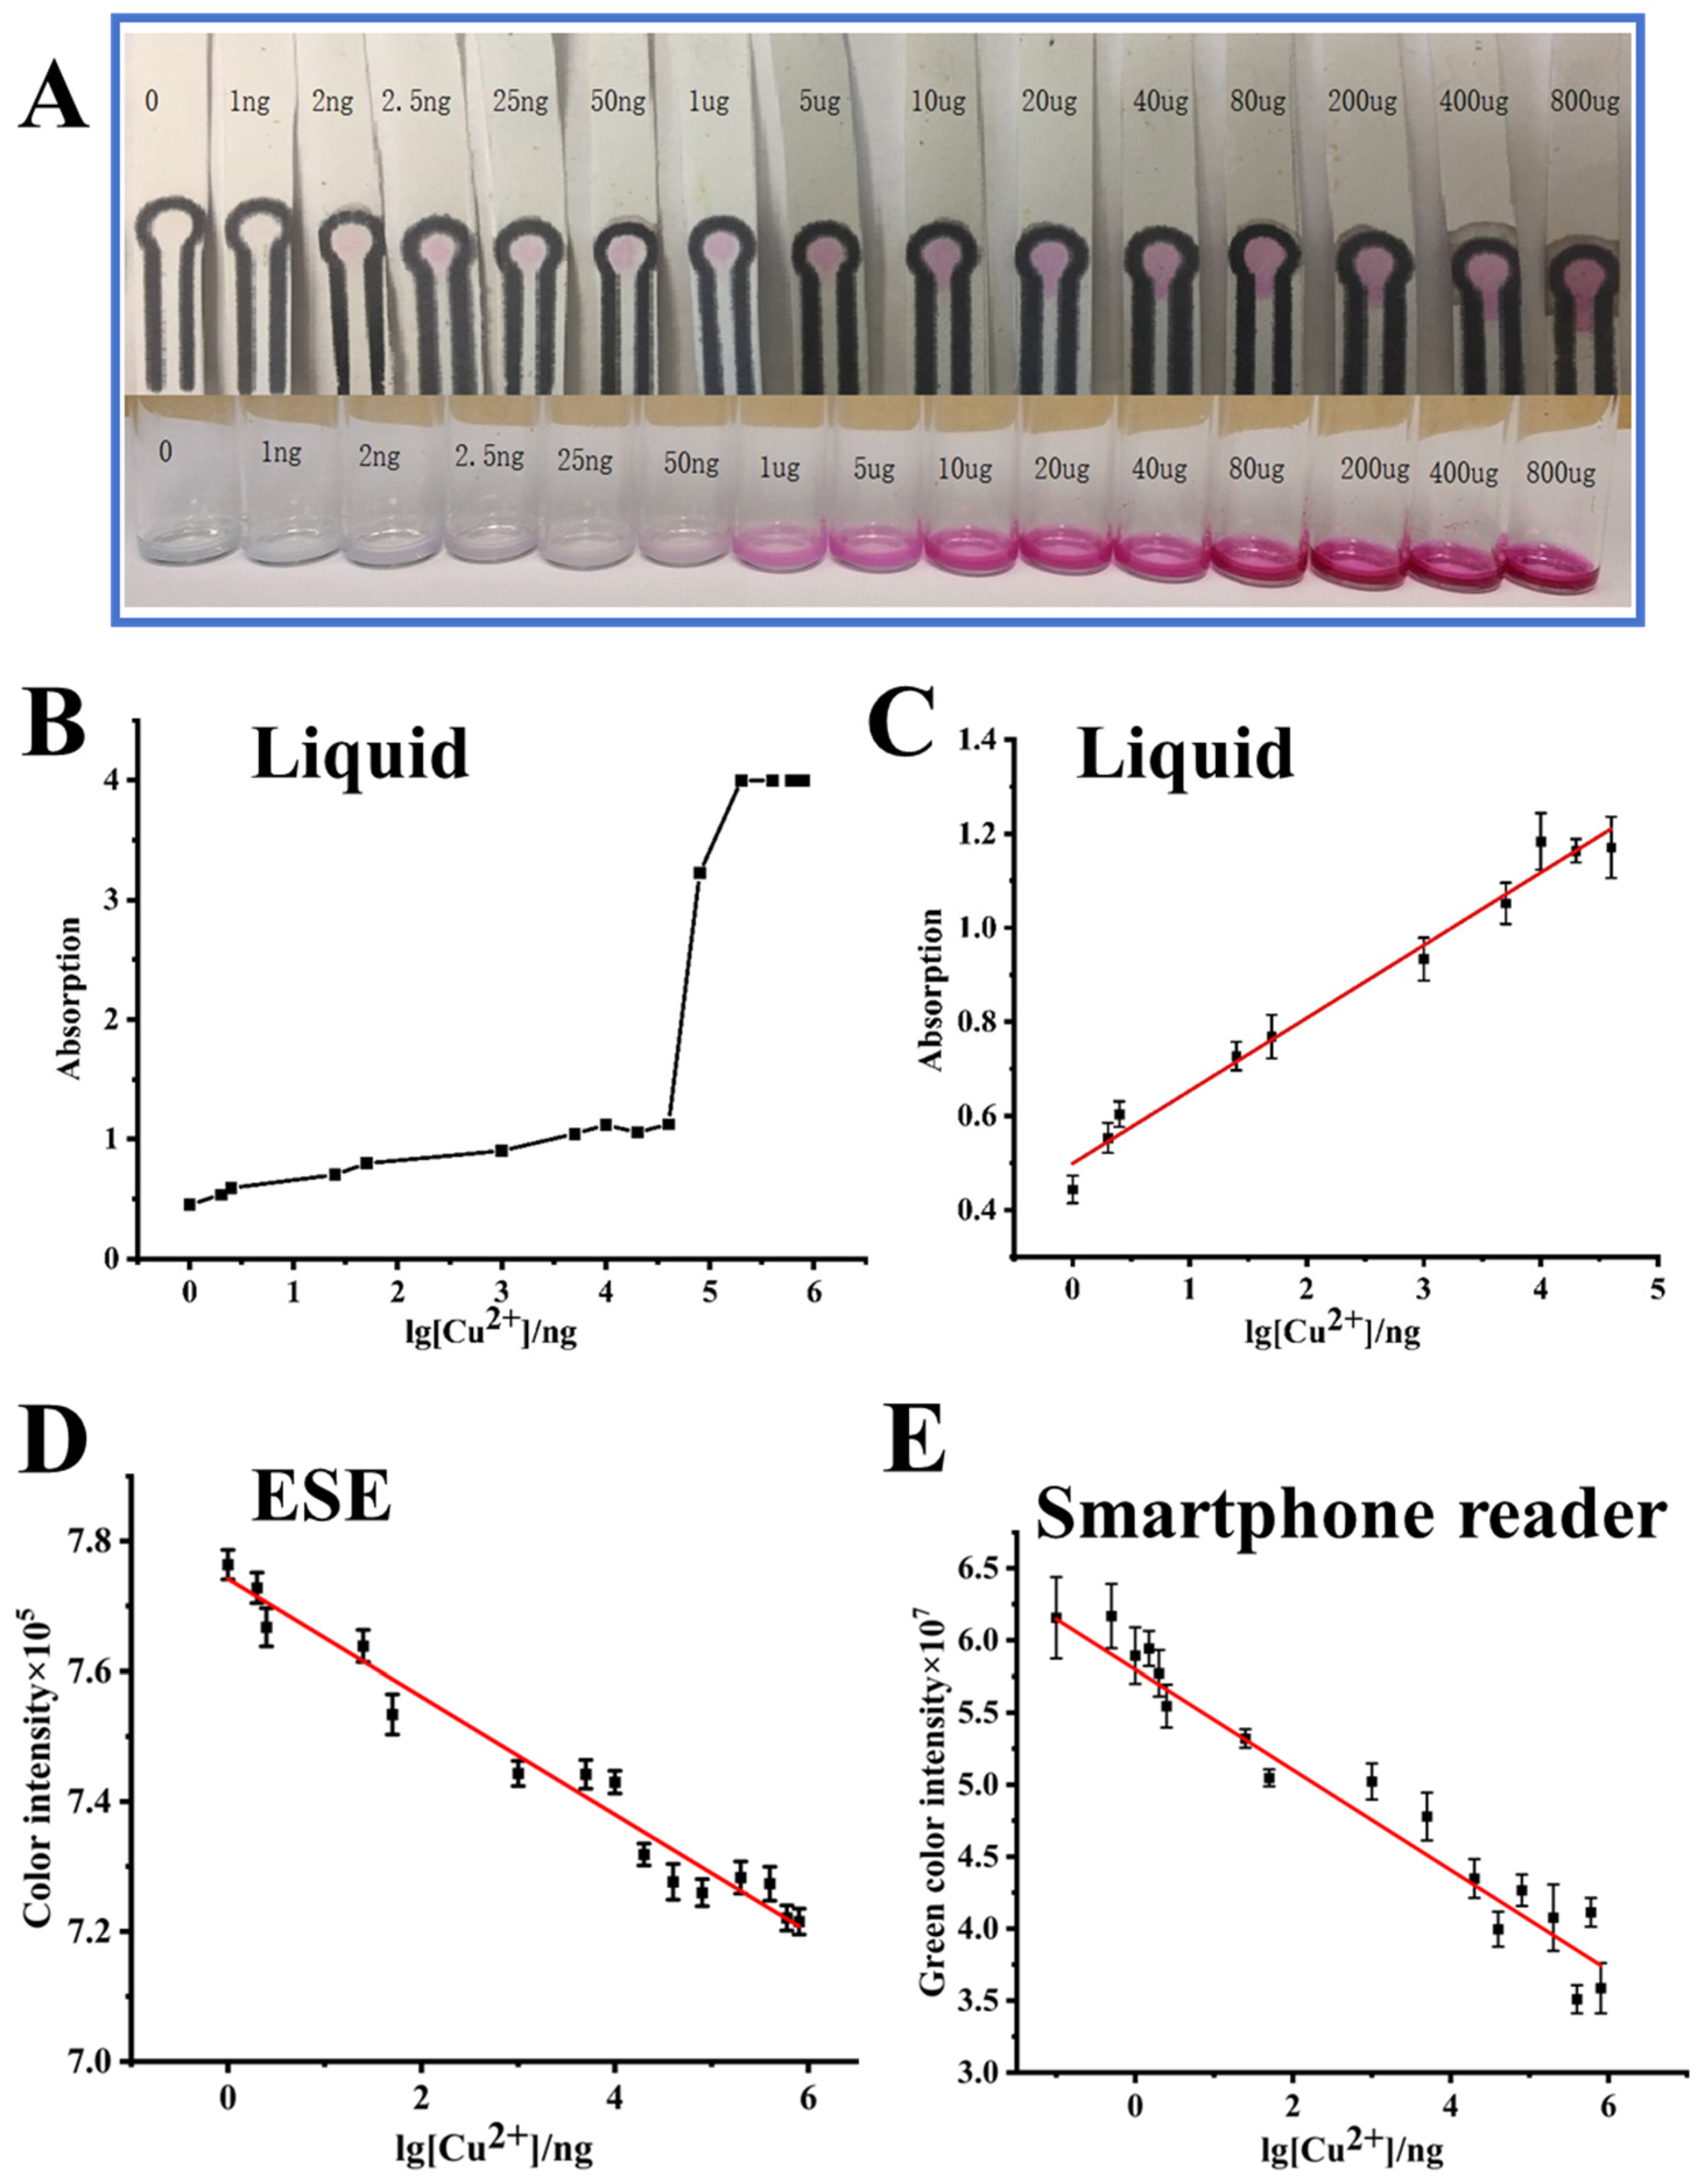
3.4. Sensitivity
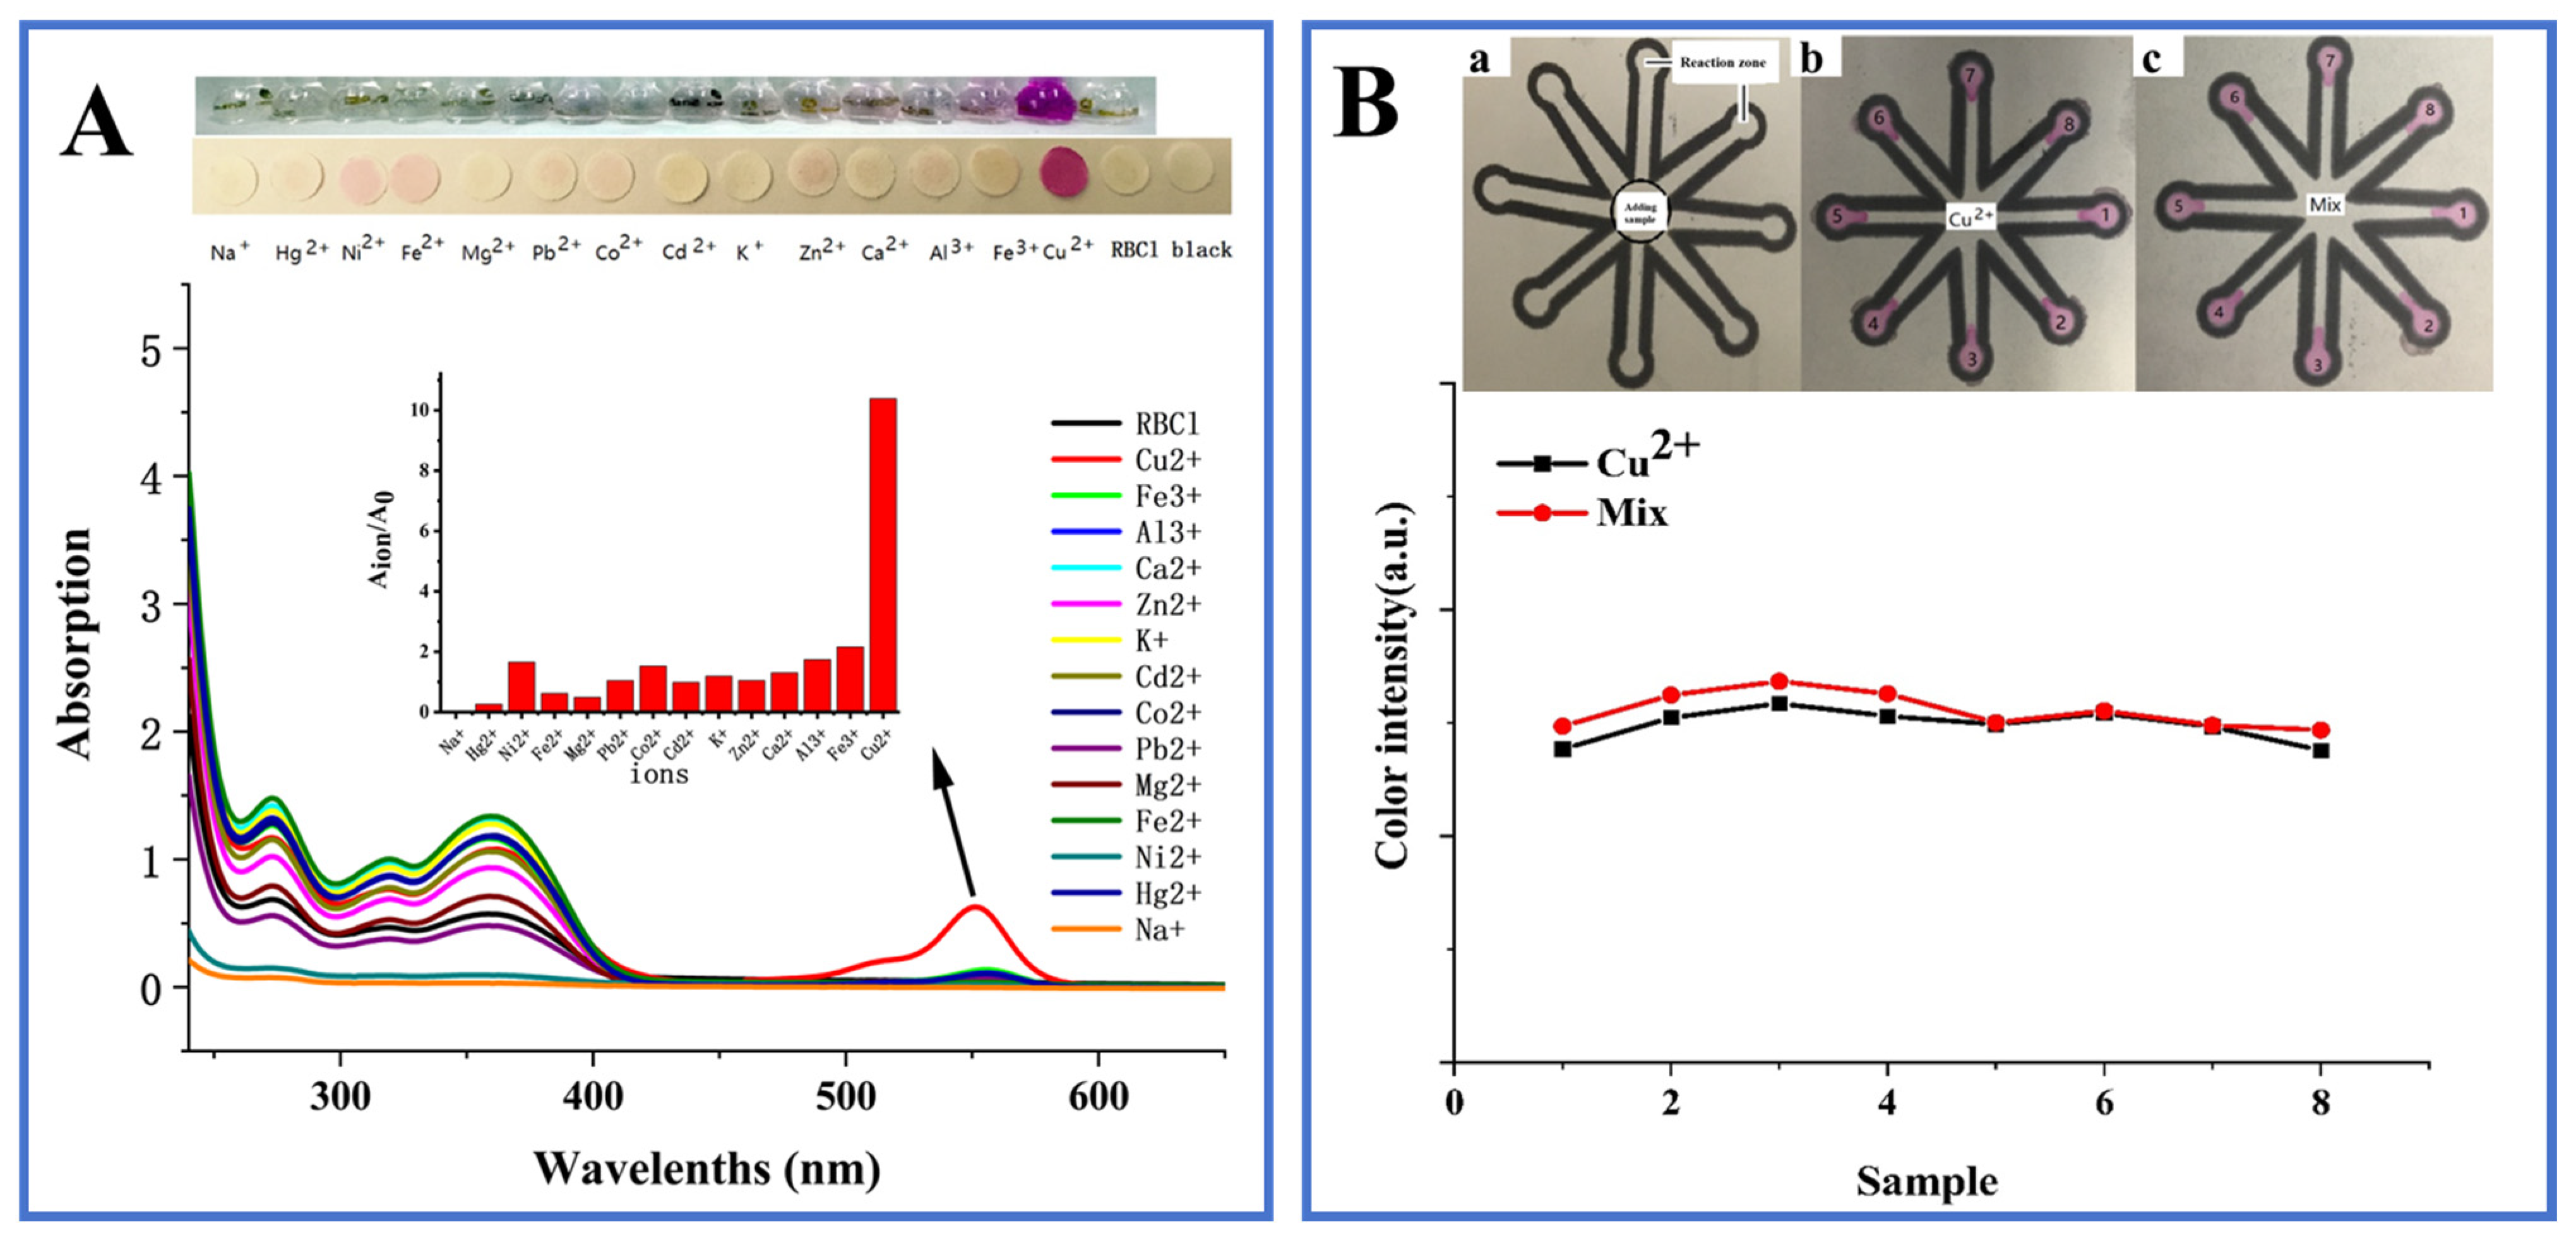
3.5. Specificity and Anti-Interference Performance
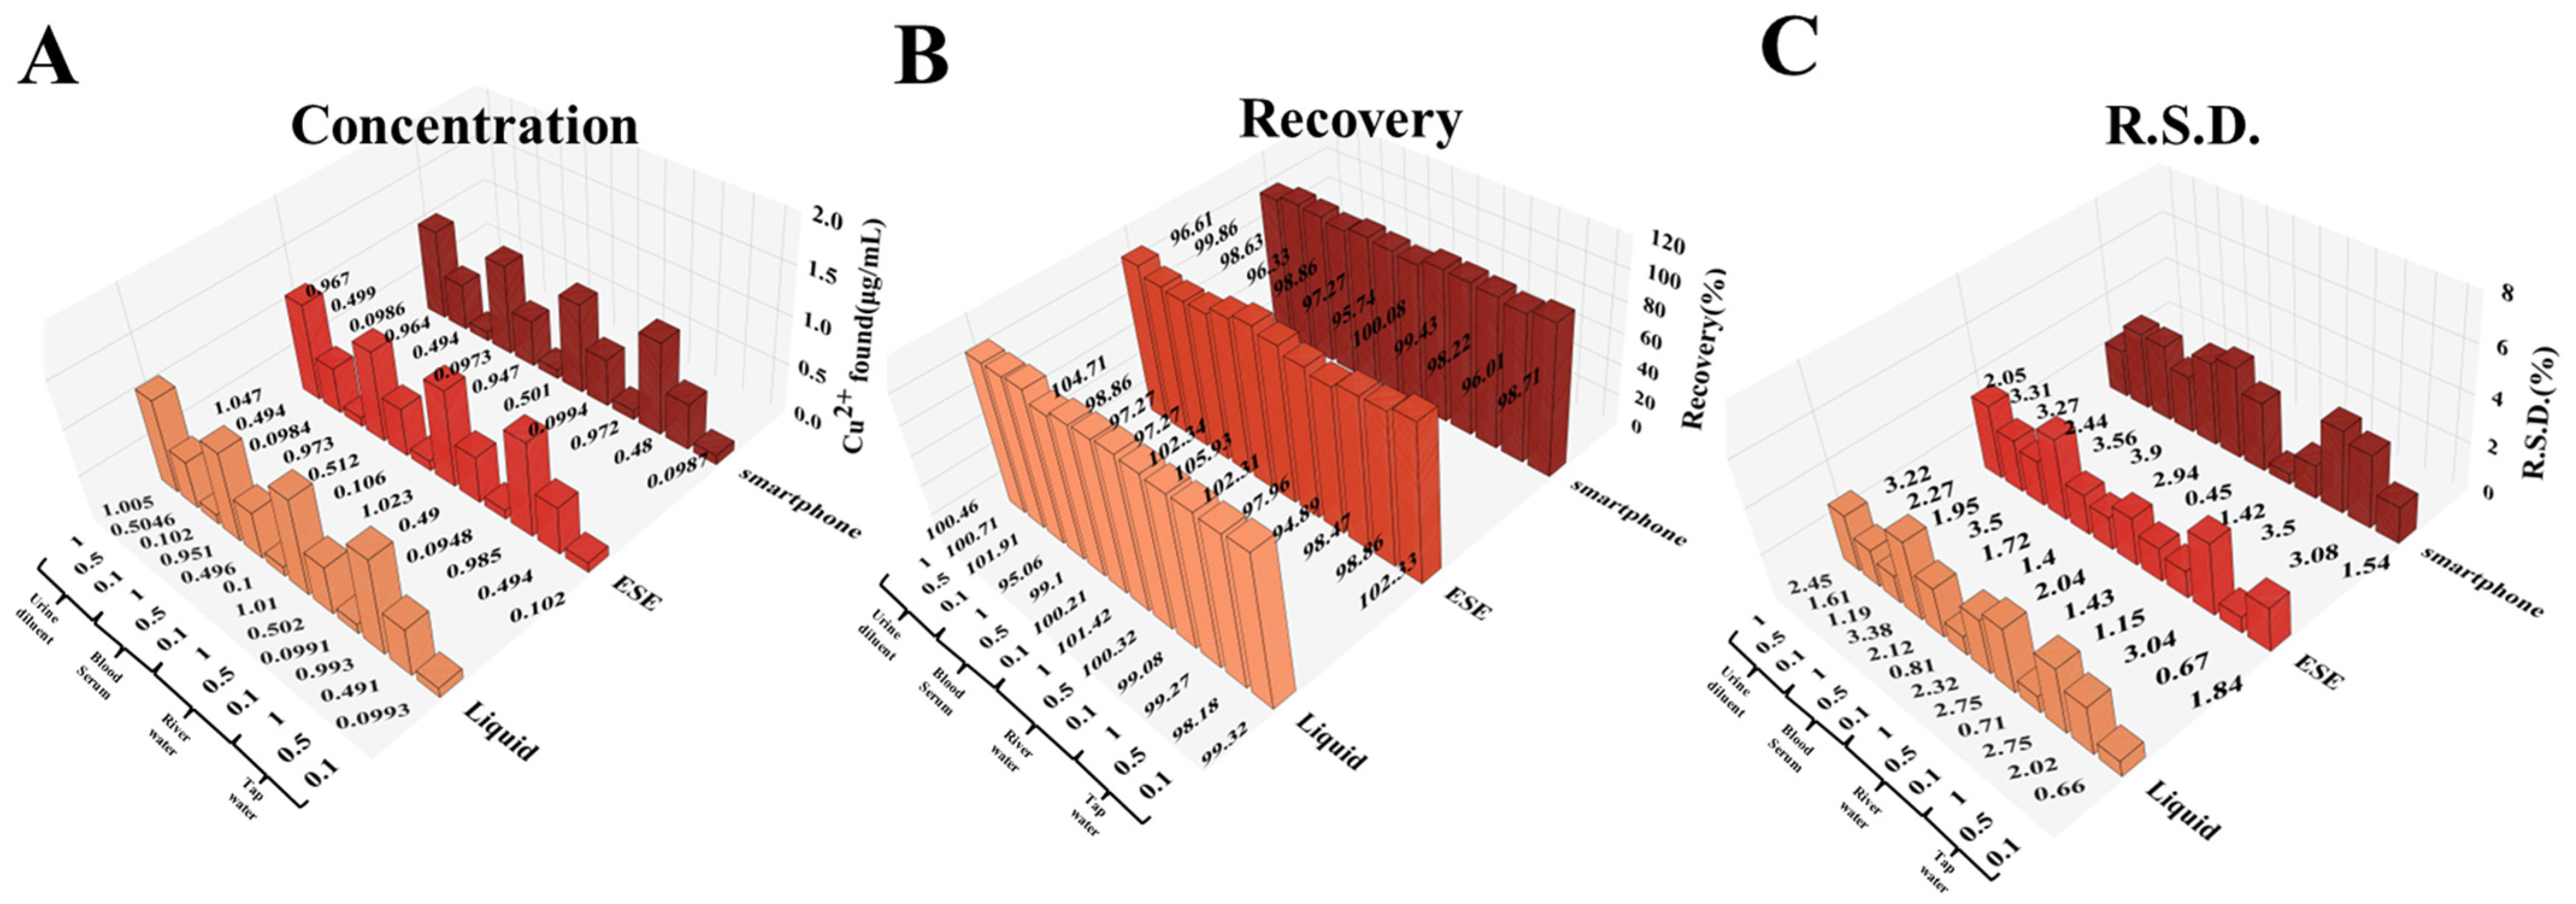
3.6. Detection of Real Samples
4. Conclusions
Author Contributions
Funding
Institutional Review Board Statement
Informed Consent Statement
Data Availability Statement
Acknowledgments
Conflicts of Interest
References
- Dong, C.H.; Feng, W.; Xu, W.W.; Yu, L.D.; Xiang, H.J.; Chen, Y.; Zhou, J.Q. The Coppery Age: Copper (Cu)-Involved Nanotheranostics. Adv. Sci. 2020, 7, 2001549. [Google Scholar] [CrossRef] [PubMed]
- Hui, X.; Sharifuzzaman, M.; Sharma, S.; Xuan, X.; Zhang, S.; Ko, S.G.; Yoon, S.H.; Park, J.Y. High-Performance Flexible Electrochemical Heavy Metal Sensor Based on Layer-by-Layer Assembly of Ti3C2Tx/MWNTs Nanocomposites for Noninvasive Detection of Copper and Zinc Ions in Human Biofluids. ACS Appl. Mater. Interfaces 2020, 12, 48928–48937. [Google Scholar] [CrossRef] [PubMed]
- Liu, Y.; Tang, R.Y.; Xu, Q.D.; Xu, S.L.; Zuo, S.J.; Qiu, J.X.; Zhong, X.S.; Tan, R.S.; Liu, Y. High Blood Cu/Zn Ratio is Associated with Nutritional Risk in Patients Undergoing Maintenance Hemodialysis. Biol. Trace Elem. Res. 2022, 200, 4977–4987. [Google Scholar] [CrossRef] [PubMed]
- Bocca, B.; Madeddu, R.; Asara, Y.; Tolu, P.; Marchal, J.A.; Forte, G. Assessment of reference ranges for blood Cu, Mn, Se and Zn in a selected Italian population. J. Trace Elem. Med. Biol. 2011, 25, 19–26. [Google Scholar] [CrossRef]
- Liang, Y.; Noh, H.M.; Park, S.H.; Choi, B.C.; Jeong, J.H. Colloidal GdVO4: Eu3+@SiO2 nanocrystals for highly selective and sensitive detection of Cu2+ ions. Appl. Surf. Sci. 2018, 433, 381–387. [Google Scholar] [CrossRef]
- Gao, Y.; Ma, W. Study on a colorimetric sensor with color switching: Naked-eye detection for Cu(II) ion. Opt. Mater. 2012, 35, 211–216. [Google Scholar] [CrossRef]
- Aguilar, F.; Dusemund, B.; Galtier, P.; Gilbert, J.; Gott, D.M.; Grilli, S.; Guertler, R.; Kass, G.E.N.; Koenig, J.; Lambré, C.; et al. Copper(II) oxide as a source of copper added for nutritional purposes to food supplements. EFSA J. 2009, 7, 1089. [Google Scholar] [CrossRef]
- Trindade, J.S.; Lemos, V.A.; Mata Cerqueira, U.M.F.; Novaes, C.G.; Araujo, S.A.; Bezerra, M.A. Multivariate optimization of a dispersive liquid-liquid microextraction method for determination of copper and manganese in coconut water by FAAS. Food Chem. 2021, 365, 130473. [Google Scholar] [CrossRef]
- Song, O.Y.; Islam, M.A.; Son, J.H.; Jeong, J.Y.; Kim, H.E.; Yeon, L.S.; Khan, N.; Jamila, N.; Kim, K.S. Elemental composition of pork meat from conventional and animal welfare farms by inductively coupled plasma-optical emission spectrometry (ICP-OES) and ICP-mass spectrometry (ICP-MS) and their authentication via multivariate chemometric analysis. Meat Sci. 2021, 172, 108344. [Google Scholar] [CrossRef]
- Kalogiouri, N.; Manousi, N.; Zachariadis, G. Determination of the Toxic and Nutrient Element Content of Almonds, Walnuts, Hazelnuts and Pistachios by ICP-AES. Separations 2021, 8, 28. [Google Scholar] [CrossRef]
- Li, G.F.; Feng, S.B.; Yan, L.l.; Yang, L.J.; Huo, B.; Wang, L.L.; Luo, S.; Yang, D.X. Direct electrochemical detection of Cu(II) ions in juice and tea beverage samples using MWCNTs-BMIMPF6-Nafion modified GCE electrodes. Food Chem. 2023, 404, 134609. [Google Scholar] [CrossRef] [PubMed]
- Guo, X.C.; Guo, C.X.; Xing, Y.J.; Liu, Y.Y.; Wei, K.H.; Kang, M.Y.; Yang, X.F.; Pei, M.S.; Zhang, G.Y. A novel Schiff base sensor through “off-on-off” fluorescence behavior for sequentially monitoring Al3+ and Cu2+. J. Photochem. Photobiol. A Chem. 2022, 430, 113990. [Google Scholar] [CrossRef]
- Nishat, S.; Jafry, A.T.; Martinez, A.W.; Awan, F.R. Paper-based microfluidics: Simplified fabrication and assay methods. Sens. Actuators B Chem. 2021, 336, 129681. [Google Scholar] [CrossRef]
- Ming, T.; Luo, J.P.; Liu, J.T.; Sun, S.; Xing, Y.; Wang, H.; Xiao, G.H.; Deng, Y.; Cheng, Y.; Yang, Z.G.; et al. Paper-based microfluidic aptasensors. Biosens. Bioelectron. 2020, 170, 112649. [Google Scholar] [CrossRef]
- Wang, L.Q.; Zhou, Z.M.; Niu, J.G.; Peng, J.Y.; Wang, T.; Hou, X.h. Emerging innovations in portable chemical sensing devices: Advancements from microneedles to hydrogel, microfluidic, and paper-based platforms. Talanta 2024, 278, 126412. [Google Scholar] [CrossRef]
- Qin, X.X.; Liu, J.J.; Zhang, Z.; Li, J.H.; Yuan, L.; Zhang, Z.Y.; Chen, L.X. Microfluidic paper-based chips in rapid detection: Current status, challenges, and perspectives. TrAC Trends Anal. Chem. 2021, 143, 116371. [Google Scholar] [CrossRef]
- Ruiz, R.A.; Gonzalez, J.L.; Vazquez-Alvarado, M.; Martinez, N.W.; Martinez, A.W. Beyond Wax Printing: Fabrication of Paper-Based Microfluidic Devices Using a Thermal Transfer Printer. Anal. Chem. 2022, 94, 8833–8837. [Google Scholar] [CrossRef]
- Deng, Y.F.; Li, Q.Z.; Zhou, Y.H.; Qian, J. Fully Inkjet Printing Preparation of a Carbon Dots Multichannel Microfluidic Paper-Based Sensor and Its Application in Food Additive Detection. ACS Appl. Mater. Interfaces 2021, 13, 57084–57091. [Google Scholar] [CrossRef]
- Tseng, H.Y.; Lizama, J.H.; Shen, Y.W.; Chen, C.J. The pursuit of further miniaturization of screen printed micro paper-based analytical devices utilizing controlled penetration towards optimized channel patterning. Sci. Rep. 2021, 11, 21496. [Google Scholar] [CrossRef]
- Bui, T.H.; Thangavel, B.; Sharipov, M.; Chen, K.; Shin, J.H. Smartphone-Based Portable Bio-Chemical Sensors: Exploring Recent Advancements. Chemosensors 2023, 11, 468. [Google Scholar] [CrossRef]
- Liu, X.Y.; Chen, Z.; Gao, R.S.; Kan, C.Y.; Xu, J.H. A paper-based fluorescent and colorimetric portable device with smartphone application for Fe3+ sensing. J. Environ. Chem. Eng. 2022, 10, 107650. [Google Scholar] [CrossRef]
- Dong, C.; Ma, X.H.; Qiu, N.X.; Zhang, Y.J.; Wu, A.G. An ultra-sensitive colorimetric sensor based on smartphone for pyrophosphate determination. Sens. Actuators B Chem. 2021, 329, 129066. [Google Scholar] [CrossRef]
- Karakuş, S.; Baytemir, G.; Özeroğlu, C.; Taşaltın, N. An ultra-sensitive smartphone-integrated digital colorimetric and electrochemical Camellia sinensis polyphenols encapsulated CuO nanoparticles-based ammonia biosensor. Inorg. Chem. Commun. 2022, 143, 109733. [Google Scholar] [CrossRef]
- Wang, Z.K.; Hu, Y.Q.; Zhou, X.X.; Lv, Y.G. Construction of mercury ion fluorescence system in water samples and art materials and fluorescence detection method for rhodamine B derivatives. Green Process. Synth. 2022, 11, 987–995. [Google Scholar] [CrossRef]
- Munisamy, M.; Rathinam, B.; Shanmugasundaram, E.; Ganesan, V.; Narayanan, V.; Balakrishnan, S.B.; Kaliyamoorthy, S.; Thambusamy, S. β-Cyclodextrin-Encapsulated Rhodamine Derivatives Core–Shell Microspheres—Based Fluorescent Sensor for Au3+ and Template for Generating Microplates of Gold. Micromachines 2023, 14, 1443. [Google Scholar] [CrossRef]
- Hu, J.P.; Lin, Q.; Yao, H.; Zhang, Y.M.; Wei, T.B. Fluorescence and colorimetric-based sensing of Hg2+ and Cu2+ using rhodamine derivative. Appl. Organomet. Chem. 2022, 37, e6038. [Google Scholar] [CrossRef]
- Huang, J.; Liu, K.Y.; Tian, J.X.; Wei, H.Y.; Kan, C. A rhodamine NIR probe for naked eye detection of mercury ions and its application. Spectrochim. Acta Part A Mol. Biomol. Spectrosc. 2024, 306, 123553. [Google Scholar] [CrossRef]
- Chai, X.Y.; Zhu, W.W.; Meng, Q.G.; Wang, T. Si-rhodamine based water-soluble fluorescent probe for bioimaging of Cu+. Chin. Chem. Lett. 2021, 32, 210–213. [Google Scholar] [CrossRef]
- Mo, S.Y.; Liu, M.Y.; Zhang, H.S.; Wang, P.; Lin, Y.F.; Hu, L.M. A rhodamine derivative probe for highly selective detection of Cu(II). Front. Biosci.-Landmark 2022, 27, 28. [Google Scholar] [CrossRef]
- Lei, M.M.; Zhou, Q.H.; Yang, L.; Xu, Z.H.; Yang, F.L. A Highly Sensitive and Selective “Off-On” Fluorescent Probe for Cu2+ Based on Rhodamine B Hydrazone. Chin. J. Org. Chem. 2020, 40, 2798. [Google Scholar] [CrossRef]
- Wang, X.C.; Li, T.C. A novel “off-on” rhodamine-based colorimetric and fluorescent chemosensor based on hydrolysis driven by aqueous medium for the detection of Fe3+. Spectrochim. Acta Part A Mol. Biomol. Spectrosc. 2020, 229, 117951. [Google Scholar] [CrossRef] [PubMed]
- Jia, J.; Wang, K.; Shi, W.; Chen, S.M.; Li, X.H.; Ma, H.M. Rhodamine B Piperazinoacetohydrazine: A Water-Soluble Spectroscopic Reagent for Pyruvic Acid Labeling. Chem.—A Eur. J. 2010, 16, 6638–6643. [Google Scholar] [CrossRef]
- Gao, C.; Liu, S.Y.; Zhang, X.; Liu, Y.K.; Qiao, C.D.; Liu, Z.E. Two-photon fluorescence and fluorescence imaging of two styryl heterocyclic dyes combined with DNA. Spectrochim. Acta Part A Mol. Biomol. Spectrosc. 2016, 156, 1–8. [Google Scholar] [CrossRef] [PubMed]
- Zhao, Y.T.; Yang, M.M.; Fu, Q.Q.; Ouyang, H.; Wen, W.; Song, Y.; Zhu, C.Z.; Lin, Y.H.; Du, D. A Nanozyme- and Ambient Light-Based Smartphone Platform for Simultaneous Detection of Dual Biomarkers from Exposure to Organophosphorus Pesticides. Anal. Chem. 2018, 90, 7391–7398. [Google Scholar] [CrossRef] [PubMed]
- Wang, L.J.; Chang, Y.C.; Ge, X.X.; Osmanson, A.T.; Du, D.; Lin, Y.H.; Li, L. Smartphone Optosensing Platform Using a DVD Grating to Detect Neurotoxins. ACS Sens. 2016, 1, 366–373. [Google Scholar] [CrossRef]
- Wang, Y.J.; Zeinhom, M.M.A.; Yang, M.M.; Sun, R.R.; Wang, S.F.; Smith, J.N.; Timchalk, C.; Li, L.; Lin, Y.H.; Du, D. A 3D-Printed, Portable, Optical-Sensing Platform for Smartphones Capable of Detecting the Herbicide 2,4-Dichlorophenoxyacetic Acid. Anal. Chem. 2017, 89, 9339–9346. [Google Scholar] [CrossRef]
- Chang, Y.C.; Ge, X.X.; Wang, L.J.; Lee, S.S.; Paulsen, M.H.; Khan, Q.M.; Khalid, Z.M.; Bhalli, J.A.; Waheed, U.; Simpson, C.D.; et al. An ultra low-cost smartphone device for in-situ monitoring of acute organophosphorus poisoning for agricultural workers. Sens. Actuators B Chem. 2018, 275, 300–305. [Google Scholar] [CrossRef]
- Meng, X.L.; Zhang, X.; Yao, J.S.; Zhang, J.J.; Ding, B.Y. Fluorescence and fluorescence imaging of two Schiff derivatives sensitive to Fe3+ induced by single- and two-photon excitation. Sens. Actuators B Chem. 2013, 176, 488–496. [Google Scholar] [CrossRef]
- Bawa, R.; Negi, S.; Singh, B.; Pani, B.; Kumar, R. A pyridine dicarboxylate based hydrazone Schiff base for reversible colorimetric recognition of Ni2+ and PPi. RSC Adv. 2023, 13, 15391–15400. [Google Scholar] [CrossRef]
- Lere, I.L.; Beyene, M.G.; Chekol, M.; Upadhyay, R.K. Spectrophotometric Study of Stability Constants of Cr(III), Ni(II) and Cu(II) Complexes with a Schiff Base in Different Solvents. Orient. J. Chem. 2013, 29, 1111–1114. [Google Scholar] [CrossRef]
- Zhang, Y.Q.; Wang, W.; Li, R.; Zhang, E.S.; Li, Z.H.; Tang, L.; Han, B.; Hou, X.F.; Wang, J.J. A novel rhodamine-based colorimetric and fluorometric probe for simultaneous detection of multi-metal ions. Spectrochim. Acta Part A Mol. Biomol. Spectrosc. 2020, 230, 118050. [Google Scholar] [CrossRef] [PubMed]
- Zhao, Y.; Zhang, X.B.; Han, Z.Y.; Qiao, L.; Li, C.Y.; Jian, L.X.; Shen, G.L.; Yu, R.Q. Highly Sensitive and Selective Colorimetric and Off-On Fluorescent Chemosensor for Cu2+ in Aqueous Solution and Living Cells. Anal. Chem. 2009, 81, 7022–7030. [Google Scholar] [CrossRef] [PubMed]
- Li, Y.J.; Dong, H.R.; Xiao, J.Y.; Li, L.; Dong, J.; Huang, D.F.; Deng, J.M. Ascorbic Acid-Enhanced CuO/Percarbonate Oxidation: Insights Into the pH-Dependent Mechanism. ACS EST Eng. 2023, 3, 798–810. [Google Scholar] [CrossRef]

Disclaimer/Publisher’s Note: The statements, opinions and data contained in all publications are solely those of the individual author(s) and contributor(s) and not of MDPI and/or the editor(s). MDPI and/or the editor(s) disclaim responsibility for any injury to people or property resulting from any ideas, methods, instructions or products referred to in the content. |
© 2025 by the authors. Licensee MDPI, Basel, Switzerland. This article is an open access article distributed under the terms and conditions of the Creative Commons Attribution (CC BY) license (https://creativecommons.org/licenses/by/4.0/).
Share and Cite
Cao, J.; Cheng, N.; Liu, Z.; Lu, Q.; Li, L.; Lin, Y.; Zhang, X.; Du, D. Portable 3D-Printed Paper Microfluidic System with a Smartphone Reader for Fast and Reliable Copper Ion Monitoring. Chemosensors 2025, 13, 51. https://doi.org/10.3390/chemosensors13020051
Cao J, Cheng N, Liu Z, Lu Q, Li L, Lin Y, Zhang X, Du D. Portable 3D-Printed Paper Microfluidic System with a Smartphone Reader for Fast and Reliable Copper Ion Monitoring. Chemosensors. 2025; 13(2):51. https://doi.org/10.3390/chemosensors13020051
Chicago/Turabian StyleCao, Jingzhen, Nan Cheng, Zhengyang Liu, Qian Lu, Lei Li, Yuehe Lin, Xian Zhang, and Dan Du. 2025. "Portable 3D-Printed Paper Microfluidic System with a Smartphone Reader for Fast and Reliable Copper Ion Monitoring" Chemosensors 13, no. 2: 51. https://doi.org/10.3390/chemosensors13020051
APA StyleCao, J., Cheng, N., Liu, Z., Lu, Q., Li, L., Lin, Y., Zhang, X., & Du, D. (2025). Portable 3D-Printed Paper Microfluidic System with a Smartphone Reader for Fast and Reliable Copper Ion Monitoring. Chemosensors, 13(2), 51. https://doi.org/10.3390/chemosensors13020051