Abstract
New cosmetic formulations are continuously requested by the market and the ingredients are constantly evolving. Recently the use of antioxidants has gained success and, in this context, analytical methods able to quickly and easily assess the antioxidant activity of cosmetics would make it possible to carry out analyses on new formulations even within the manufacturing process without the need for specialized laboratories and personnel, thus evaluating directly on-site the effectiveness and the shelf life of products. In this work, a chemiluminescent inhibition assay was developed for determining the total antioxidant activity in cosmetic products. The method was based on the luminol/enhancers/hydrogen peroxide/horseradish peroxidase chemiluminescent system, which generates light signals measurable through simple and compact instrumentation. The formation of the chemiluminescent signal is inhibited by the presence of antioxidant substances while it is restored once all the antioxidant molecules have been oxidized. The time of appearance of the light signal is related to the total antioxidant activity. The assay was carried out exploiting an integrated device comprising a microwell plate coupled with an array of amorphous silicon hydrogenated photosensors enclosed in a mini-dark box. The method was optimized in terms of concentrations and volumes of the required reagents and sample pre-treatment. A calibration curve was generated taking as a reference the antioxidant activity of ascorbic acid obtaining a detection limit of 10 µM. The developed method was applied to cosmetic products currently on the market as well as on spiked samples in order to evaluate the performance of the methods in terms of sensitivity, accuracy, and reproducibility.
1. Introduction
Cosmetics analysis represents a rapidly expanding field of analytical chemistry, as new cosmetic formulations are increasingly in demand on the market and the ingredients required for their production are constantly evolving. In particular, the addition of antioxidants, which are well established in food, beverages, and pharmaceuticals, is becoming increasingly popular in cosmetic preparations, where they can serve as active ingredients, supplements, and stabilizers [1,2,3,4,5,6]. Indeed, their ability to scavenge free radicals provides anti-aging, photoprotective, antimicrobial, and anti-inflammatory action, along with protection against oxidative degradation of product components, such as lipid rancidity [1].
There is growing interest and consumer demand towards the use of natural sources for antioxidants cosmetics, such as extracts derived from a wide range of plants, grains, and fruits, owing to their ability to reduce oxidative stress on the skin and to exert anti-aging effects [4,7,8]. Indeed, reactive oxygen species (ROS) can alter skin components, such as lipids, DNA, and proteins, [9,10], contributing to the development of early aging, along with external factors, including air pollution, UV radiation, and pathogenic microorganisms [11,12,13,14,15].
Antioxidants also effectively contribute to product preservation, especially against preventing lipids oxidation that leads to rancidity. Indeed, they can inhibit lipid oxidation by reacting with lipid and peroxy radicals and converting them to more stable, non-radical products [16,17,18,19]. Additionally, they can deplete molecular oxygen, inactivate singlet oxygen, eliminate peroxidative metal ions, convert hydrogen into other antioxidants, and dissipate UV light [20].
Despite their numerous advantages, the selection of the proper antioxidants must be carefully considered, focusing on their hydrophilic or lipophilic nature, their stability in the formulation, and their ability to not react with other ingredients. Indeed, antioxidants are unstable and susceptible to hydrolysis and photodegradation in the presence of oxygen [21], so that formulating antioxidant-added cosmetic products that are able to maintain activity and aesthetic acceptability over time is very difficult [22,23]. In addition, the optimal antioxidant concentration must be evaluated to maximize their activity and bioavailability.
A valid analytical method to determine the capacity of the antioxidant and to evaluate its activity and stability over time is therefore necessary. In this context, this research focuses on the development of innovative techniques that allow a rapid, economical, and sensitive measurement of the antioxidant activity in complex cosmetic matrices using simple instruments that do not require specialized laboratories and personnel, thus constituting a valid approach for monitoring supply chains.
The determination of the specific antioxidant activity is difficult and often not possible due to the presence of synergistic effects. However, a wide variety of methods have been proposed to evaluate the total antioxidant capacity (TAC), which considers all compounds with antioxidant activity present in the sample for their application on complex matrices, such as food, beverages, and biological fluids. There is no consensus on a reference assay for measuring TAC, as well as on the expression of the assay results, which can be reported in terms of equivalent content of standard antioxidants, such as trolox, ascorbic acid, or gallic acid. For these reasons, very different results can be obtained, depending on the method used and the antioxidant selected for assay calibration [24].
The tests, which are generally based on the ability of antioxidants to neutralize free radicals, fall into two main groups: tests based on electron transfer reactions (ET) and reactions involving the transfer of hydrogen atoms (HAT) [25]. Most of these methods rely on spectrophotometric measurements. Other optical detection principles are exploited, such as fluorescence (e.g., oxygen radical absorbance capacity, ORAC), or chemiluminescence (CL) (e.g., the total radical-trapping antioxidant parameter, TRAP, and enhanced chemiluminescence, ECL) [26].
The above reported methods are mainly used to assess the antioxidant properties of natural extracts to be used as active ingredients, rather than their activity within the formulation [27,28]. Nevertheless, given the complexity of the composition of cosmetics, it is very important to evaluate the TAC of the final product, as this can vary significantly compared to the activity of the ingredients analyzed individually. Moreover, a method applicable to finished products is required to evaluate their conservation of TAC over time. A commercial kit based on the ABTS reaction was exploited for assessing the antioxidant capacity in a typical cosmetic formulation containing a blend of emulsifiers with a mixture of antioxidants [29]. The assay involved the use of peroxidase (HRP) and hydrogen peroxide (H2O2) which convert ATBS into a radical cation. In this state, ATBS forms a chromogen that can be measured spectrophotometrically at 600 nm, but in the presence of antioxidants, this color formation is inhibited. Using this commercial assay, they were able to assess the antioxidant potential of the final cosmetic formulation. The same approach was exploited by Mapoung et al. [30] for the evaluation of antioxidant activities of functional creams available on the Thai market, while the FRAP test was used to determine the antioxidant activity of some cosmetic creams available on the Syrian market [31]. Nevertheless, traditional methods for TAC evaluation require an equipped laboratory and trained personnel, thus increasing the cost of the analysis. Therefore, there has been an increasing demand for the development of easy-to-use, cheap, fast, and portable sensors for point-of-need measurement of TAC in cosmetic samples. For this aim, portable sensors based on electrochemical measurements have been proposed. Beissenhirtz et al., [32] reported about a sensor based on a gold wire electrode functionalized with cytochrome c. Antioxidant capacity was measured as a function of the decrease in the superoxide concentration present in the system. The same research group also developed a system for the simultaneous detection of superoxide and H2O2 and their possible scavengers [33]. Othman et al. [34] proposed a sensor based on selective redox reaction. They developed a colorimetric sensor suitable for naked-eye detection for assessing the total antioxidant activity and traceability of active ingredients in cosmetic products. The device comprises a surface functionalized with ceria nanoparticles that reacts specifically with antioxidants and generates distinct colors representative of their antioxidant activity. The platform is based on the interaction between cerium oxide nanoparticles and antioxidants, involving a combined surface oxidation and chemical binding process leading to the formation of highly colored charge transfer complexes [35,36]. As an alternative, chemiluminescence (CL) detection has been proposed as an ideal method for miniaturization and point-of-need biosensor development thanks to its inherent sensitivity, specificity, and rapidity [37,38,39,40,41], and it has been successfully applied to TAC measurements in food and biological samples [24,42]. In particular, the enhanced horseradish peroxidase (HRP)-catalyzed luminol reaction has been exploited in order to obtain assays characterized by detectability, amenability to miniaturization, and short assay times. The reaction involves the oxidation of luminol (L) by H2O2 [43], usually taking advantage of the presence of enhancers, such as 4-iodophenol, which is an aromatic hydrogen (AH) donor and is able to stabilize and amplify the CL signal. H2O2 oxidizes AH, which works as substrate for HRP. The produced radical (A •) is able to subtract electrons from luminol (L), which is the compound responsible for the light generation, forming the radical L •. Upon this reaction, a diazachinone (AQ) is formed thanks to the transfer of electrons between two L • and this species is oxidized by H2O2. The produced aminophthalate is an excited state (AP*) and the return to the fundamental state is characterized by the emission of blue light. Since antioxidants (AO) have a reduction potential lower than that of luminol, their presence leads to an electron transfer between L • and AO •. This means that AO competes with luminol in donating electrons and protons to neutralize L •. This means that the formation of AQ and consequently of the CL signal is blocked. Therefore, the luminescence will be extinguished as long as the AOs are present in the mixture and will be recovered as soon as all the AOs are oxidized. To quantify the TAC of the sample, the delay (recovery time) in the light emission is used. The antioxidative capacity can be calibrated and expressed in terms of the concentration of a reference pure antioxidant substance.
CL assays are particularly suited for the development of miniaturized and portable analytical devices, as the instrumentation required for the readout of the CL signal is very simple, mainly requiring a photon detection device and a dark chamber to avoid interference from ambient light. Indeed, light imaging systems based on a charge-coupled device (CCD) camera [44,45,46] or even a smartphone’s complementary metal-oxide semiconductor (CMOS) sensor [47,48,49,50,51] were employed and integrated into a compact and portable device for photon detection [39].
As an alternative, thin-film photodiodes can be implemented into microfluidic systems and they make it possible to reach ultrasensitive detection, reducing the cost of diagnostic platforms. Hydrogenated amorphous silicon (a-Si:H) photodiode arrays [52] and organic photodiodes (OPDs) [53] have been used to develop microfluidic analytical devices for detecting UV absorbance [54], fluorescence [55,56], and CL signals [57,58,59,60,61,62,63,64].
In this work, a CL inhibition assay was developed to determine the TAC in cosmetic products. This method is based on the luminol–H2O2–HRP–enhancer CL system, in which the presence of antioxidants involves the quenching of the CL reaction for a time that depends on antioxidant concentration.
The method developed involved the use of an integrated lab-on-a-chip platform in which the assay was carried out exploiting a device composed by a microwell plate coupled to a matrix of a-Si:H photosensors, which convert the incident light signal into electric current signals. This system was used to measure the light emission resulting from CL reactions and follow their kinetics in real time.
The method was optimized in terms of concentration and volumes of the required reagents. A calibration curve was then generated using ascorbic acid as the reference antioxidant substance. Procedures for the pretreatment of the sample were also evaluated taking into consideration the great variability of the cosmetic matrices and the need for developing a protocol that could be performed by unqualified personnel and outside specialized laboratories. To this end, several formulations were prepared and tested exploiting different pre-treatment protocols in order to find the most rapid and easy-to-use method for the TAC measurements. The developed method was finally applied by determining the TAC of cosmetic products currently on the market, declared to exhibit antioxidant properties expressed in terms of ascorbic acid equivalents.
2. Materials and Methods
2.1. Reagents
The horseradish peroxidase (HRP) enzyme in freeze-dried powder, antioxidant L-(+)-Ascorbic acid powder, Triton X, isopropyl alcohol, glycerol, and Xanthan gum were purchased from Sigma-Aldrich (St. Louis, MO, USA). The CL substrate (Super Signal ELISA Femto) was purchased from Thermo Fisher Scientific (Rockford, IL, USA). The black 384 microplates with a transparent bottom (Greiner Multiwell Plates-384) were purchased from Incofar (Modena, Italy). For all dilutions, 0.1 M phosphate saline buffer (PBS) was used, at a pH = 8 and was prepared from pure reagents for analysis. Cosmetic samples were purchased from local dealers.
2.2. Analytical Device
The analytical device used for antioxidant activity measurements is based on the use of an integrated platform consisting of a disposable 30-well black microplate with a transparent bottom (maximum volume 25 µL) aligned to a grid of photosensors that monitor the CL signal from each well (Figure 1). The photosensor array comprises a 5 × 6 matrix of a-Si:H diodes, with each photosensor being a p-type/intrinsic/n-type structure cultivated on a glass substrate through a three-chamber high-vacuum plasma-enhanced chemical vapor deposition (PECVD) process. The manufacturing process involves the following steps: a. Cleansing a 5 × 5 cm2 glass substrate with a piranha solution. b. Applying and shaping a 200 nm thick layer of Indium Tin Oxide (ITO) through magnetron sputtering and photolithographic techniques, serving as the front electrode for the a-Si:H photosensor. c. Depositing the a-Si:H layers. d. Employing vacuum evaporation to create a 30/150/30 nm thick stack of Al/Cr/Al as the back contact. e. Defining the geometries of the photosensors by patterning the metal stack and a-Si:H layers. d. Applying and shaping a 5 µm thick layer of SU-8 3005 as an insulation layer. e. Utilizing vacuum evaporation and patterning to establish a 30/150/30 nm thick stack of Al/Cr/Al, defining the electrical connections to the metal pad of the back contact. In this device setup, light penetrates the a-Si:H photosensor through the glass and ITO layer. The 30 a-Si:H photosensors are depicted as light grey squares in the center of the image. The C-shaped line represents the shared metal back contact for all photosensors, while the ITO transparent front contacts (one for each diode) terminate with brief metal contacts visible at the lower edge of the glass substrate. These metal contacts aid in aligning the photosensor array with the card edge connector (SAMTEC MB1–150–01–L–S–02–SL, SAMTEC, New Albany, IN, USA)), which links to the read-out electronic through a straightforward interface board. The input stage of the read-out circuit employs an 8-channel, 20 bit analog-to-digital converter (DDC118 from Texas Instruments, Dallas, TX, USA). It captures currents generated by the photodiodes, converts them into voltage using a charge sensing amplifier, and digitizes the data through an internal sigma–delta modulator. The outcomes are displayed at the output of a synchronous serial interface driven by a clock signal. The master of the read-out circuit is a PIC18F4550 microcontroller (from Microchip, Chandler, AZ, USA) with dual functions: (1) providing timing and control signals to the DDC; and (2) ensuring communication with a PC. Software running on the computer configures measurement parameters via a USB port, stores, and visualizes the measurement data.
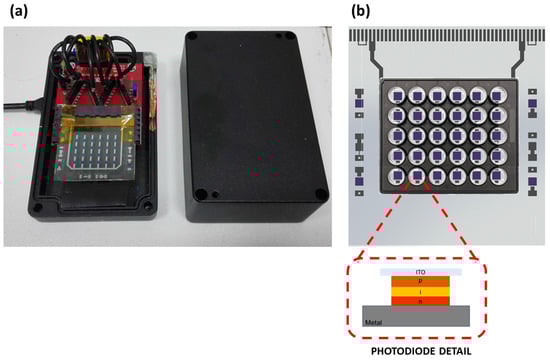
Figure 1.
Scheme of the portable device. (a) Photodiode array enclosed in the dark box; (b) Photodiode array coupled with the dark microplate well with a transparent bottom. Each photosensor is aligned with a microwell plate.
2.3. Assay Procedure
2.3.1. Sample Pretreatment
Given the complexity of the cosmetic matrices and the high variability of the physical form in which they can be found, different solvents were tested for sample pretreatment of the sample. In particular, three approaches were compared by applying them on cosmetic formulations prepared in laboratory comprising different ingredients. The three pretreatment procedures were applied as follows:
- A total of 0.1 g of sample was dispersed in 1 mL of PBS, vortexed for 1 min and filtrated. The obtained mixture was suitably diluted with PBS at the time of analysis in order to obtain the appearance of the CL signal within the linearity range of the calibration curve.
- A total of 0.1 g of sample was dispersed in 1 mL of Tris buffer solution (0.1 M, pH 8.6) containing 1 mM Triton X-100 (Sigma-Aldrich, St. Louis, MO, USA) and 2 mM CaCl2 (TriCaT) and vortexed for 1 min. The obtained mixture was suitably diluted with the TriCaT buffer at the time of analysis in order to obtain the appearance of the CL signal within the linearity range of the calibration curve.
- A total of 0.1 g of sample was dispersed in 1 mL of a solution composed by Isopropyl alchol (60%) and PBS (40%) (IA-PBS) and vortexed for 1 min. The obtained mixture was suitably diluted with PBS at the time of analysis in order to obtain the appearance of the CL signal within the linearity range of the calibration curve.
2.3.2. Analytical Procedure and Data Elaboration
To carry out the analysis, 12 µL of standard or suitably pre-treated and diluted sample, 4 µL of CL cocktail substrate (consisting of 2 µL of luminol/enhancers and 2 µL of H2O2), 4 µL containing the enzyme HRP 5 pg were added to the wells aligned on the photosensors array so that the CL reaction of each microwell is monitored by a precise photosensor. The measurement of the CL signal was started after the mini-dark box was closed, to ensure that the signal measured by the photosensors is not affected by exposure to ambient light. For all the measurements carried out, the CL signal was monitored through consecutive acquisitions lasting 200 ms for a total duration of maximum 15 min.
Since the photosensor chip makes it possible to simultaneously acquire the signal coming from the different photosensors, for each analysis of standard and sample, the following parameters were evaluated simultaneously:
- -
- The instrumental background signal by measuring the signal relative to an empty well;
- -
- The background signal due to the CL substrate in the absence of sample and HRP (4 µL of CL substrate and 16 µL of PBS);
- -
- The blank signal obtained in the absence of antioxidants which serves as a control to verify the correct kinetics of the CL luminol–H2O2–HRP–enhancers system. In this case, 12 µL of PBS, 4 µL of CL substrate, and 4 µL containing the HRP 5 pg/mL enzyme were added to the well.
In order to obtain quantitative information, a calibration curve was generated using ascorbic acid as a standard solution in a concentration range between 5 and 100 µM. The kinetics related to the appearance of the CL signal in the presence of an antioxidant show a peculiar sigmoidal trend. Applying the first derivative on this kinetic curve, a graph in which the maximum point represents the inflection point of the sigmoid was obtained. This point was used as a parameter for the construction of the calibration curve at the different standard concentrations. Through the equation of the curve, it was possible to calculate by interpolation the TAC of the analyzed samples. The limit of detection was estimated as the minimum concentration of ascorbic acid that made it possible to delay the CL signal for a sufficient time to start the measurement. Indeed, the time required for injecting the reagents did not make it possible to record very short inhibition times corresponding to low concentrations of antioxidant. The limit of quantification was estimated considering the minimum time required for starting the measurement after mixing the reagents plus 10 times the standard deviation and interpolating the obtained value on the calibration curve.
2.4. Formulations Tested and Samples
The formulations used for optimizing the sample pre-treatment were prepared by mixing the ingredients in the following proportion:
A1. Water 97.5%, Xantam gum 0.5%, Ascorbic Acid 2%;
A2. Water 91.5%, Xantam gum 0.5%, Ascorbic Acid 8%;
Blank A. Water 99.5%, Xantam gum 0.5%;
B1. Water 95.5%, Xantam gum 0.5%, Glycerol 2%, Ascorbic Acid 2%;
B2. Water 89.5%, Xantam gum 0.5%, Glycerol 2%, Ascorbic Acid 8%;
Blank B. Water 97.5%, Xantam gum 0.5%, Glycerol 2%;
C1. Water 85.5%, Xantam gum 0.5%, Glycerol 2%, sunflower oil 10%, Ascorbic Acid 2%;
C2. Water 79.5%, Xantam gum 0.5%, Glycerol 2%, sunflower oil 10%, Ascorbic Acid 8%;
Blank C. Water 87.5%, Xantam gum 0.5%, Glycerol 2%, sunflower oil 10%.
The ingredients were mixed and gently shaken for a few minutes and stored at room temperature. The samples purchased from local dealers were selected in order to test matrices with different physical properties (micellar water, toner, and face cream).
3. Results
The developed method is based on the quenching of the CL reaction of the luminol–H2O2–HRP–enhancers system in the presence of antioxidant compounds (Figure 2).
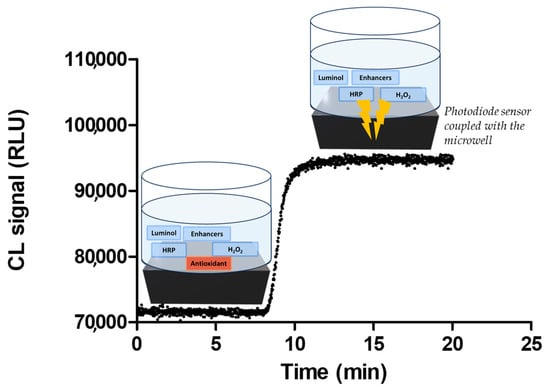
Figure 2.
Scheme of the working principle of the proposed method based on the luminol–H2O2–HRP–enhancers CL system, in which the presence of antioxidants involves the quenching of the CL reaction for a time that depends on antioxidant concentration.
The assay was optimized taking into account that the method should be used outside an equipped laboratory at room temperature with benchtop instrumentation that requires specialized personnel for its operation. The procedures for the pre-treatment of the sample, for analysis, and for data processing must therefore be very simple and rapid. In the case of cosmetics, it is important to consider the high complexity of the matrix which can contain a large number of ingredients in a variety of different formulations, thus generally requiring considerable preanalytical treatments (i.e., solubilization, extraction, preconcentration, or purification). Moreover, in recent years, the trends has been to develop simple, sustainable, and environmentally friendly methodologies by applying liquid-based and ultrasound-assisted extraction technologies making it possible to pretreat the sample, exploiting procedures suitable for performing the analysis on-site with easy-to-use instrumentation [65].
Starting from the need to meet these requirements, different parameters were optimized such as reagent concentrations and volumes, reaction times, and sample pre-treatment. A calibration curve was generated taking as a reference the antioxidant activity of ascorbic acid and real samples of cosmetic products currently available on the market were analyzed.
3.1. Assay Optimization
There is a great variety of antioxidant substances that are currently added to cosmetic formulations and the total antioxidant activity in these samples can vary significantly depending on the selected antioxidant, its concentration, the other ingredients, and the physical form of the product itself. One of the fundamental requirements for an analytical method for TAC measurement is to cover a wide dynamic range to enable the analysis of samples with very different antioxidant activities. On the other hand, particularly low detection limits are not necessary as, generally, the TAC reported for cosmetic products are of the order of magnitude ranging from µM to M, expressed in terms of equivalent content of standard antioxidants, such as Trolox, ascorbic acid, or gallic acid [29,34].
Starting from these assumptions, the method was optimized using ascorbic acid as a standard in a range of concentrations between 5 and 100 µM. The parameters evaluated for optimizing the assay were the concentration of HRP enzyme, the volumes of the reagents (luminol/enhancers/H2O2), and the sample to be used during the analysis. In this context, in order to find the best conditions for the analysis, some aspects must be considered. In particular, if the concentration of reactants (luminol/enhancers/H2O2) is too high, the CL reaction will occur even in the presence of antioxidant species. Indeed, since the luminol radicals are very numerous, the probability that radicals are sequestered from the antioxidant instead of reacting with each other becomes very low. Therefore, even at relatively high antioxidant concentrations, the recovery time of the CL signal would be very short. At the same time, by excessively decreasing the concentrations of the reagents, the CL signal would become too weak and the recovery time, estimated through the inflection point of the curve that reports the CL signal with respect to time, would be not vary appreciably and would be difficult to identify. It is, therefore, necessary to reach a compromise between these factors by testing different concentrations of HRP enzyme in the presence of different volumes of substrate and antioxidant.
Solutions containing ascorbic acid in a concentration of 50 µM were therefore tested in the presence of HRP at different concentrations (Figure 3a). The following volumes were used: 10 µL of ascorbic acid standard, 5 µL of substrate and 5 µL of HRP at concentrations of 2.5 pg mL−1 (dark grey curve), 5 pg mL−1 (green curve), 10 pg mL−1 (black curve), and 20 pg mL−1 (light grey curve). The results showed that, at high concentrations of enzyme, the recovery time were too low, while at the concentration 2.5 pg mL−1 the CL signal was weak and the inflection point less detectable.
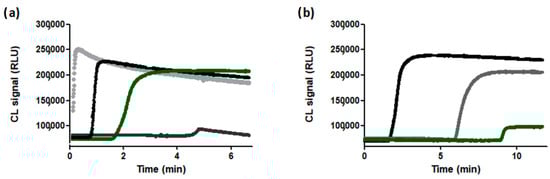
Figure 3.
(a) Selection of the optimal concentration of HRP: 2.5 pg mL−1 (dark grey curve), 5 pg mL−1 (green curve), 10 pg mL−1 (black curve), 20 pg mL−1 (light grey curve). (b) Selection of the optimal reagent volumes: 10 µL of standard, 5 µL of HRP, and 5 µL of substrate (black curve); 12 µL of standard, 4 µL of HRP, and 4 µL of substrate (grey curve); 16 µL of standard, 2 µL of HRP, and 2 µL of substrate (green curve).
Using the HRP 5 pg mL−1 concentration, different reaction volumes were tested in the presence of 50 µM of ascorbic acid (Figure 3b): (a) 10 µL of standard, 5 µL of HRP, and 5 µL of substrate (black curve); (b) 12 µL of standard, 4 µL of HRP, and 4 µL of substrate (grey curve); (c) 16 µL of standard, 2 µL of HRP, and 2 µL of substrate (green curve). The optimal condition was represented by case (b) as the CL signal was sufficiently high and the recovery time for the 50 µM ascorbic acid concentration was acceptable. Indeed, considering this as an intermediate concentration of the range of interest, the recovery time must be high enough to allow the detection of lower concentrations, but not too long, in order to measure higher concentrations in a reasonable time for a rapid analytical method.
3.2. Calibration Curve
Using the previously optimized conditions and following the protocol described in Section 2.3, three calibration curves were generated by adding concentrations of ascorbic acid comprised in a range between 5 and 100 µM in the different solvents tested for the pre-treatment of the sample. Ascorbic acid was selected as standard since vitamin C is one of the antioxidants most added to cosmetic products.
The curves shown in Figure 4c were obtained by taking into consideration, for each standard concentration, the time corresponding to the inflection of the sigmoid curve relating to the appearance of the CL signal (Figure 4a,b).
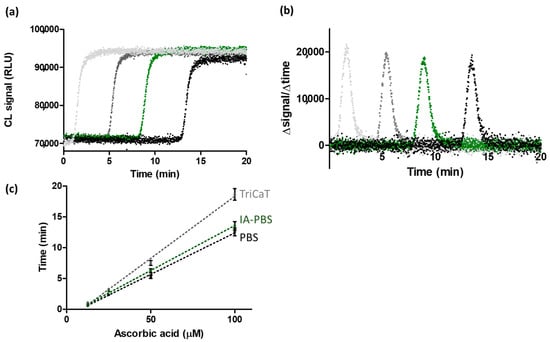
Figure 4.
(a) CL signal measured for the different concentrations of ascorbic acid: 10 (light grey), 25 (dark grey), 50 (green), 100 µM (black). (b) Graph of the first derivative applied to kinetic curves relative to the different concentrations of ascorbic acid (10 (light grey), 25 (dark grey), 50 (green), 100 µM (black)) in which the maximum point represents the inflection point of the kinetic sigmoidal curve. (c) Calibration curves generated in different solvents: PBS (black curve): y = 0.1348x − 1.087 (R2 = 0.9972); IA-PBS (green curve): y = 0.1460x − 1.015 (R2 = 0.9983); TriCaT buffer (grey curve): y = 0.2016x − 1.825 (R2 = 0.9957).
The calibration curves obtained in PBS and IA-PBS (the black and green curves, respectively) were comparable, while a significative difference was observed in the case of TriCaT buffer (grey curve), which showed a higher curve slope. However, the limit of detection (LOD) for the measurement of ascorbic acid is 10 µM for each calibration curve. The 5 µM concentration was not detected as the recovery time was less than the time required to start the measurement through the photosensors. In this case, indeed, the LOD was not determined by a signal difference between the blank and the standard, but by the difference in the emission times of the CL signal. In the absence of the antioxidant, the signal appeared immediately following the addition of the reagents, while, in the presence of an antioxidant, this was delayed. The delay decreased with the decrease in the concentration of the antioxidants in the sample and, therefore, low concentrations were difficult to detect. The factor that limited the LOD, therefore, was the time taken by the operator to inject the sample into the well and start measuring the signal [66]. The limit of quantification (LOQ) was estimated as 20 µM. The curves were obtained using the least squares approximation method and the parameters, R2 = 0.9983 for PBS, R2 = 0.9972 for IA-PBS, and R2 = 0.9957 for TriCaT buffer, showed an excellent correlation between the points of the curves.
Also, the linear ranges were the same for all the solvents and they comprised between 10 and 100 µM. At higher concentrations, linearity was not maintained and there was also an increase in the standard deviation, which made measurements less reliable. Good reproducibility was achieved by repeating the calibration curves, with percentage standard deviations associated with each point on the curve ranging from 0.5 to 20%.
3.3. Pretreatment of the Sample
The pretreatment of the sample represents a critical step since the aim of the work is to develop a rapid analytical method, which can be used by non-specialized personnel outside of centralized laboratories, thus requiring a suitable pretreatment protocol. Furthermore, the complexity of cosmetic products is very high both from the point of view of the chemical composition and the variety of physical forms in which they can be found. Indeed, antioxidants are generally added to facial treatment products that include micellar water, toners, and creams that are very different from each other from a chemical–physical point of view.
In light of these aspects, different pre-treatments reported in the literature [29,32,43] were tested on formulations prepared as reported in Section 2.4, which were characterized by different compositions and complexities to verify that the proposed protocols can be suitable for a wide range of cosmetic products.
The prepared formulations were obtained by adding 2% and 8% of ascorbic acid (corresponding to 0.1 M and 0.4 M, respectively) with different ingredients. For each formulation a blank control without ascorbic acid was prepared and tested to verify that the other ingredients had no antioxidant activity.
In the case of samples containing 2% of ascorbic acid a dilution of 1:2000 was required for obtaining a signal into the dynamic range of the calibration curve (corresponding to 55 µM) while a dilution of 1:8000 (corresponding to 57 µM) was necessary for the formulations containing ascorbic acid at 8%. By interpolating the recovery time obtained on the calibration curves related to the different solvents used for the pre-treatment, the concentrations of ascorbic acid were calculated. The obtained results were compared, and the recovery was calculated for each sample as shown in Table 1. For all the blank control samples, the CL signal started from the beginning of the acquisition even when they were not diluted. Therefore, there was no antioxidant activity from the other components of the formulations or, at least, it was below the LOD.

Table 1.
Results obtained by analyzing several formulations employing different sample pretreatment procedures.
Pretreatment with PBS showed low efficacy, with recovery values from 76 to 131%. Furthermore, the use of PBS did not allow the complete solubilization of formulations B and C, which were characterized by the presence of different ingredients and required an additional step of filtration before analysis.
The IA-PBS solvent improved the performance with respect to the use of PBS, but the recoveries were still not in the range reported by the AOAC manual for the peer-verified methods program [67], which are from 80 to 110%. The TriCaT buffer showed the best recoveries in a range between 87 and 103% and it did not show a worsening of its effectiveness with the increasing complexity of the formulations.
Paired t-tests were also performed to evaluate the difference between the real concentration and the obtained values, finding that for all the pre-treatment protocols there were no significative differences for all the analyzed samples (n = 3 and p = 0.01). The assay also showed a satisfactory precision, providing a mean coefficient of variation (CV%) below 10%.
3.4. Evaluation of Accuracy and Precision
Quality control (QC) samples were tested in order assess the validity of the analytical method. The QCs were obtained by spiking ascorbic acid in two different formulations that contain no antioxidants. Then, they were pre-treated with the TriCaT buffer. Five concentration levels were tested within the calibration curve range: the concentration corresponding to the LOD (10 µM), within three times of the LOD (30 µM), at the medium point of the calibration curve (45 µM), at 75% of the calibration curve (67.5 µM), and at the upper limit of the calibration curve (100 µM). Accuracy and precision were determined by analyzing three replicates per run at each QC concentration level over 2 days (Table 2). Since the accuracy at each concentration level should be within ±20% of the nominal values, except for the LOD and the upper limit, which should be within ±25% of the nominal value as reported by the ICH guideline on bioanalytical method validation [68], the obtained results showed good accordance with these requirements. In the same way, the precision parameter was also compliant with the guidelines since the precision of the QC concentrations determined at each level did not exceed 20%. Furthermore, recoveries were between 83 and 116%, confirming the good performance of the pretreatment procedure.
Table 2.
Results obtained by analyzing quality controls obtained by spiking ascorbic acid into two formulations that contain no antioxidant.
3.5. Analysis on Real Samples
To verify the applicability of the method to cosmetic products, four commercial samples containing antioxidants were tested. In particular, different matrices (micellar water, toner, and facial cream) were selected in order to assess the suitability of the proposed method towards different physical forms of the sample (Table 3).
Table 3.
Results obtained by analyzing commercial samples containing antioxidants. Different matrices (micellar water, toner, and facial cream) were selected in order to assess the suitability of the proposed method towards different physical forms of the sample.
The first sample was from a commercial micellar water containing natural extracts of green coffee. Micellar water is a very simple cosmetic product based on colloidal suspension of micelles composed of surfactants in water, used generally as a cleanser. This sample usually has a viscosity close to that of water, so it was considered to be the simplest cosmetic matrix. Following pretreatment with the TriCat buffer, a final dilution of 1:10 was enough to obtain a signal in the range of the calibration curve. An equivalent of antioxidant activity of ascorbic acid of 0.4 mM was measured.
Another sample of micellar water containing antioxidant components from olive leaves was analyzed. The antioxidant activity of this sample was comparable to the previous one, since it corresponded to 0.2 mM of ascorbic acid equivalent.
Then, the method was applied on a skin toner, which is a lotion designed to cleanse, protect, and refresh the skin, and shrink the appearance of pores, usually applied on the face. It is mainly made up of water but, compared to micellar water, this also contains humectants (such as glycerine) and alcohols. The sample analyzed with the proposed method contained antioxidant molecules extracted from the Kakadu prune. The dilution required to obtain a recovery time comparable with the linear range of the calibration curve was 1:150 and the concentration of 2.2 mM of ascorbic acid equivalent was found.
Finally, a sample of facial cream was analyzed. This matrix is very complex since it contains, in addition to water, also oil, emulsifier, and thickening agents. This cream declares on the label a concentration of vitamin C equal to 30%. Following the pretreatment with the TriCat buffer, a final dilution of 1:30,000 was necessary to obtain a signal in the range of the calibration curve. A concentration of 1.4 M was found, which corresponds to a percentage of 25%, thus obtaining a recovery of 83%.
4. Conclusions
Considering the need for user-friendly, rapid, and affordable assays for on-site total antioxidant activity measurements, we proposed a chemiluminescent inhibition assay for evaluating the TAC in cosmetic products. Exploiting a portable detector based on a-Si:H photodiode array, an easy-to-use platform has been developed to be used by non-skilled personnel for real-time and on-site analysis. Since the cosmetic matrices are very complex and they can vary from each other in physical form, depending on the ingredients present, a pre-treatment protocol was evaluated in order to make all of the analytical steps suitable for performing the method in a non-laboratory environment. The assay was optimized for analyzing cosmetic products containing different concentrations of antioxidant substances and it was applied on several commercial products available on the market.
This assay can thus represent a reliable and cost-effective monitoring tool for antioxidant activity in cosmetic products that could be employed in manufacturing processes for simultaneously evaluating several formulations characterized by the use of different antioxidant species and/or different concentrations as well as for assessing their shelf life. Indeed, among the possible uses of the developed assay, there is the possibility of categorizing samples based on their antioxidant capacity, verifying the claimed performance of a cosmetic product, and assessing the possible degradation of active ingredients over time. Furthermore, it paves the way for a new generation of portable and easy-to-use devices for the analysis of cosmetic products and for detecting the presence of counterfeit ingredients or harmful substances that can be present in raw materials or finished products.
Author Contributions
Conceptualization, M.Z. and M.M.; methodology, M.G., A.N., G.D.C., and D.C. (Domenico Caputo); software, A.N., G.D.C., and D.C. (Domenico Caputo); validation, S.R.S.P., D.C. (Donato Calabria), D.C. (Domenico Caputo), and A.N.; formal analysis, S.R.S.P. and D.C. (Donato Calabria); writing—original draft preparation, S.R.S.P. and D.C. (Donato Calabria); writing—review and editing, M.Z., M.M., M.G., and G.D.C.; supervision, M.Z. and M.M. All authors have read and agreed to the published version of the manuscript.
Funding
This research received no external funding.
Institutional Review Board Statement
Not applicable.
Informed Consent Statement
Not applicable.
Data Availability Statement
Data are contained within the article.
Conflicts of Interest
The authors declare no conflicts of interest.
References
- De Lima Cherubim, D.J.; Buzanello Martins, C.V.; Oliveira Fariña, L.; da Silva de Lucca, R.A. Polyphenols as natural antioxidants in cosmetics applications. J. Cosmet. Dermatol. 2020, 19, 33–37. [Google Scholar] [CrossRef] [PubMed]
- Silva, S.; Ferreira, M.; Oliveira, A.S.; Magalhaes, C.; Sousa, M.E.; Pinto, M.; Sousa Lobo, J.M.; Almeida, I.F. Evolution of the use of anti-oxidants in anti-ageing cosmetics. Int. J. Cosmet. Sci. 2019, 41, 378–386. [Google Scholar] [CrossRef] [PubMed]
- Hamid, A.A.; Aiyelaagbe, O.O.; Usman, L.A.; Ameen, O.M.; Lawal, A. Antioxidants: Its medicinal and pharmacological applications. AJPAC 2010, 4, 142–151. [Google Scholar]
- Hoang, H.T.; Moon, J.Y.; Lee, Y.C. Natural Antioxidants from Plant Extracts in Skincare Cosmetics: Recent Applications, Challenges and Perspectives. Cosmetics 2021, 8, 106. [Google Scholar] [CrossRef]
- Li, W.; Maris, A.; Melandri, S.; Lesarri, A.; Evangelisti, L. Molecular structure and internal dynamics of the antioxidant 2,6-di-tert-butylphenol. J. Mol. Struc. 2024, 1296, 136910. [Google Scholar] [CrossRef]
- Li, W.; Maris, A.; Melandri, S.; Lesarri, A.; Evangelisti, L. The Structure of 2,6-Di-tert-butylphenol–Argon by Rotational Spectroscopy. Molecules 2023, 28, 8111. [Google Scholar] [CrossRef]
- Palmieri, M.G.S.; Cruz, L.T.; Bertges, F.S.; Húngaro, H.M.; Batista, L.R.; da Silva, S.S.; do Amaral, M.D.P.H. Enhancement of antioxidant properties from green coffee as promising ingredient for food and cosmetic industries. Biocatal. Agric. Biotechnol. 2018, 16, 43–48. [Google Scholar] [CrossRef]
- He, H.; Li, A.; Li, S.; Tang, J.; Li, L.; Xiong, L. Natural components in sunscreens: Topical formulations with sun protection factor (SPF). Biomed. Pharmacother. 2020, 134, 111161. [Google Scholar] [CrossRef]
- Morais, M.L.; Silva, A.C.; Araújo, C.R.; Esteves, E.A.; Dessimoni-Pinto, N.A. Determinação do potencial antioxidante in vitro de frutos do cerrado brasileiro. Rev. Bras. Frutic. 2013, 35, 355–360. [Google Scholar] [CrossRef]
- Zhang, S.; Duan, E. Fighting against skin aging: The way from bench to bedside. Cell Transplant. 2018, 27, 729–738. [Google Scholar] [CrossRef]
- Farage, M.A.; Miller, K.W.; Elsner, P.; Maibach, H.I. Intrinsic and extrinsic factors in skin ageing: A review. Int. J. Cosmet. Sci. 2008, 30, 87–95. [Google Scholar] [CrossRef]
- Rees, J.L. The Genetics of Sun Sensitivity in Humans. Am. J. Hum. Genet. 2004, 75, 739–751. [Google Scholar] [CrossRef]
- Krutmann, J.; Schikowski, T.; Morita, A.; Berneburg, M. Environmentally-Induced (Extrinsic) Skin Aging: Exposomal Factors and Underlying Mechanisms. J. Investig. Dermatol. 2021, 141, 1096–1103. [Google Scholar] [CrossRef] [PubMed]
- Coppé, J.P.; Desprez, P.Y.; Krtolica, A.; Campisi, J. The senescence-associated secretory phenotype: The dark side of tumor suppression. Annu. Rev. Pathol. Mech. Dis. 2010, 5, 99–118. [Google Scholar] [CrossRef] [PubMed]
- Flament, F.; Bazin, R.; Qiu, H.; Ye, C.; Laquieze, S.; Rubert, V.; Decroux, A.; Simonpietri, E.; Piot, B. Solar exposure(s) and facial clinical signs of aging in Chinese women: Impacts upon age perception. Clin. Cosmet. Investig. Dermatol. 2015, 8, 75–84. [Google Scholar] [CrossRef] [PubMed]
- Lin, T.-K.; Zhong, L.; Santiago, J.L. Anti-Inflammatory and Skin Barrier Repair Effects of Topical Application of Some Plant Oils. Int. J. Mol. Sci. 2017, 19, 70. [Google Scholar] [CrossRef] [PubMed]
- Rajaram, S.; Jones, J.; Lee, G.J. Plant-based dietary patterns, plant foods, and age-related cognitive decline. Adv. Nutr. 2019, 10 (Suppl. S4), S422–S436. [Google Scholar] [CrossRef] [PubMed]
- Cavinato, M.; Waltenberger, B.; Baraldo, G.; Grade, C.V.; Stuppner, H.; Jansen-Dürr, P. Plant extracts and natural compounds used against UVB-induced photoaging. Biogerontology 2017, 18, 499–516. [Google Scholar] [CrossRef]
- Petruk, G.; Del Giudice, R.; Rigano, M.M.; Monti, D.M. Antioxidants from Plants Protect against Skin Photoaging. Oxid. Med. Cell. Longev. 2018, 2018, 1454936. [Google Scholar] [CrossRef]
- Pisoschi, A.M.; Pop, A. The Role of Antioxidants in the Chemistry of Oxidative Stress: A review. Eur. J. Med. Chem. 2015, 97, 55–74. [Google Scholar] [CrossRef]
- Kusumawati, I.; Indrayanto, G. Natural antioxidants in cosmetics. In Studies in Natural Products Chemistry; Elsevier: Amsterdam, The Netherlands, 2013; Volume 40, pp. 485–505. [Google Scholar]
- Darvin, M.E.; Sterry, W.; Lademann, J.; Vergou, T. The role of carotenoids in human skin. Molecule 2011, 16, 10491–10506. [Google Scholar] [CrossRef]
- Pinnell, S.R. Cutaneous photodamage, oxidative stress, and topical antioxidant protection. J. Am. Acad. Dermatol. 2003, 48, 1–19. [Google Scholar] [CrossRef] [PubMed]
- Calabria, D.; Guardigli, M.; Severi, P.; Trozzi, I.; Pace, A.; Cinti, S.; Mirasoli, M. A smartphone-based chemosensor to evaluate antioxidants in agri-food matrices by in situ AuNP formation. Sensor 2021, 21, 5432. [Google Scholar] [CrossRef] [PubMed]
- Ratz-Lyko, A.; Arct, J.; Pytkowska, K. Methods for evaluation of cosmetic antioxidant capacity. Ski. Res. Technol. 2012, 18, 421–430. [Google Scholar] [CrossRef] [PubMed]
- Munteanu, I.G.; Apetrei, C. Analytical methods used in determining antioxidant activity: A review. Int. J. Mol. Sci. 2021, 22, 3380. [Google Scholar] [CrossRef]
- Almeida, M.G.; Chiari, B.G.; Correa, M.A.; Chung, M.C.; Isaac, V.L. Validation of an alternative analytical method for the quantification of antioxidant activity in plant extracts. Lat. Am. J. Pharm. 2013, 32, 90–95. [Google Scholar]
- Wahab, N.A.; Rahman, R.A.; Ismail, A.; Mustafa, S.; Hashim, P. Assessment of antioxidant capacity, anti-collagenase and anti-elastase assays of Malaysian unfermented cocoa bean for cosmetic application. Nat. Prod. Chem. Res. 2014, 2, 1–6. [Google Scholar]
- Pelle, E.; Mammone, T.; Marenus, K.; Dicanio, D.; Maes, D. A test for antioxidant activity in cosmetic formulations. J. Cosm. Sci. 2002, 53, 237–240. [Google Scholar]
- Mapoung, S.; Semmarath, W.; Arjsri, P.; Umsumarng, S.; Srisawad, K.; Thippraphan, P.; Limtrakul, P. Determination of phenolic content, antioxidant activity, and tyrosinase inhibitory effects of functional cosmetic creams available on the Thailand market. Plant 2021, 10, 1383. [Google Scholar] [CrossRef]
- Abbood, A. Determination of phenolic content and antioxidant activity of some cosmetic creams available in Syrian market. J. Chem. Pharm. Sci. 2018, 11, 280–283. [Google Scholar] [CrossRef]
- Beissenhirtz, M.; Scheller, F.; Lisdat, F. Immobilized cytochrome c sensor in organic/aqueous media for the characterization of hydrophilic and hydrophobic antioxidants. Electroanalysis 2003, 15, 1425–1435. [Google Scholar] [CrossRef]
- Krylov, A.V.; Sczech, R.; Lisdat, F. Characterization of antioxidants using a fluidic chip in aqueous/organic media. Analyst 2007, 132, 135–141. [Google Scholar] [CrossRef] [PubMed]
- Othman, A.; Norton, L.; Finny, A.S.; Andreescu, S. Easy-to-use and inexpensive sensors for assessing the quality and traceability of cosmetic antioxidants. Talanta 2020, 208, 120473. [Google Scholar] [CrossRef] [PubMed]
- Sharpe, E.; Frasco, T.; Andreescu, D.; Andreescu, S. Portable ceria nanoparticle-based assay for rapid detection of food antioxidants (NanoCerac). Analyst 2013, 138, 249–262. [Google Scholar] [CrossRef] [PubMed]
- Ornatska, M.; Sharpe, E.; Andreescu, D.; Andreescu, S. Paper bioassay based on ceria nanoparticles as colorimetric probes. Anal. Chem. 2011, 83, 4273–4280. [Google Scholar] [CrossRef] [PubMed]
- Roda, A.; Arduini, F.; Mirasoli, M.; Zangheri, M.; Fabiani, L.; Colozza, N.; Moscone, D. A challenge in biosensors: Is it better to measure a photon or an electron for ultrasensitive detection? Biosens. Bioelectron. 2020, 155, 112093. [Google Scholar] [CrossRef] [PubMed]
- Calabretta, M.M.; Zangheri, M.; Calabria, D.; Lopreside, A.; Montali, L.; Marchegiani, E.; Michelini, E. Based Immunosensors with Bio-Chemiluminescence Detection. Sensor 2021, 21, 4309. [Google Scholar] [CrossRef] [PubMed]
- Calabretta, M.M.; Lopreside, A.; Montali, L.; Zangheri, M.; Evangelisti, L.; D’Elia, M.; Michelini, E. Portable light detectors for bioluminescence biosensing applications: A comprehensive review from the analytical chemist’s perspective. Anal. Chim. Acta 2022, 1200, 339583. [Google Scholar] [CrossRef] [PubMed]
- Lazzarini, E.; Pace, A.; Trozzi, I.; Zangheri, M.; Guardigli, M.; Calabria, D.; Mirasoli, M. An origami paper-based biosensor for allergen detection by chemiluminescence immunoassay on magnetic microbeads. Biosensor 2022, 12, 825. [Google Scholar] [CrossRef]
- Zangheri, M.; Calabretta, M.M.; Calabria, D.; Fiori, J.; Guardigli, M.; Michelini, E.; Evangelisti, L. Immunological analytical techniques for cosmetics quality control and process monitoring. Processes 2021, 9, 1982. [Google Scholar] [CrossRef]
- Said, T.M.; Kattal, N.; Sharma, R.K.; Sikka, S.C.; Thomas, A.J., Jr.; Mascha, E.; Agarwal, A. Enhanced chemiluminescence assay vs colorimetric assay for measurement of the total antioxidant capacity of human seminal plasma. J. Androl. 2003, 24, 676–680. [Google Scholar] [CrossRef]
- Saleh, L.; Plieth, C. Total low-molecular-weight antioxidants as a summary parameter, quantified in biological samples by a chemiluminescence inhibition assay. Nat. Prot. 2010, 5, 1627–1634. [Google Scholar] [CrossRef]
- Yang, M.; Kostov, Y.; Bruck, H.A.; Rasooly, A. Carbon nanotubes with enhanced chemiluminescence immunoassay for CCD-based detection of Staphylococcal enterotoxin B in food. Anal. Chem. 2008, 80, 8532–8537. [Google Scholar] [CrossRef]
- Zhao, L.Z.; Fu, Y.Z.; Ren, S.W.; Cao, J.T.; Liu, Y.M. A novel chemiluminescence imaging immunosensor for prostate specific antigen detection based on a multiple signal amplification strategy. Biosens. Bioelectron. 2021, 171, 112729. [Google Scholar] [CrossRef]
- Liu, F.; Zhang, C. A novel paper-based microfluidic enhanced chemiluminescence biosensor for facile, reliable and highly-sensitive gene detection of Listeria monocytogenes. Sens. Actuat. B Chem. 2015, 209, 399–406. [Google Scholar] [CrossRef]
- Calabria, D.; Zangheri, M.; Trozzi, I.; Lazzarini, E.; Pace, A.; Mirasoli, M.; Guardigli, M. Smartphone-Based Chemiluminescent Origami µPAD for the Rapid Assessment of Glucose Blood Levels. Biosensors 2021, 11, 381. [Google Scholar] [CrossRef]
- Chen, H.; Feng, Y.; Liu, F.; Tan, C.; Xu, N.; Jiang, Y.; Tan, Y. Universal smartphone-assisted label-free CRISPR/Cas12a-DNAzyme chemiluminescence biosensing platform for on-site detection of nucleic acid and non-nucleic acid targets. Biosens. Bioelectron. 2023, 274, 115929. [Google Scholar] [CrossRef]
- Ghosh, S.; Aggarwal, K.; Vinitha, T.U.; Nguyen, T.; Han, J.; Ahn, C.H. A new microchannel capillary flow assay (MCFA) platform with lyophilized chemiluminescence reagents for a smartphone-based POCT detecting malaria. Microsyst. Nanoeng. 2020, 6, 5. [Google Scholar] [CrossRef]
- Calabria, D.; Pace, A.; Lazzarini, E.; Trozzi, I.; Zangheri, M.; Guardigli, M.; Mirasoli, M. Smartphone-Based Chemiluminescence Glucose Biosensor Employing a Peroxidase-Mimicking, Guanosine-Based Self-Assembled Hydrogel. Biosensors 2023, 13, 650. [Google Scholar] [CrossRef]
- Xing, Y.; Zhu, Q.; Zhou, X.; Qi, P. A dual-functional smartphone-based sensor for colorimetric and chemiluminescent detection: A case study for fluoride concentration mapping. Sens. Actuat. B Chem. 2020, 319, 128254. [Google Scholar] [CrossRef]
- Santos, D.R.; Soares, R.R.; Chu, V.; Conde, J.P. Performance of hydrogenated amorphous silicon thin film photosensors at ultra-low light levels: Towards attomole sensitivities in lab-on-chip biosensing applications. IEEE Sens. J. 2017, 17, 6895–6903. [Google Scholar] [CrossRef]
- Pires, N.M.M.; Dong, T. Measurement of salivary cortisol by a chemiluminescent organic-based immunosensor. Biomed. Mater. Eng. 2014, 24, 15–20. [Google Scholar] [CrossRef]
- Chen, C.W.; Huang, C.C.; Lin, Y.Y.; Chen, L.C.; Chen, K.H.; Su, W.F. Optical properties and photoconductivity of amorphous silicon carbon nitride thin film and its application for UV detection. Diam. Relat. Mater. 2005, 14, 1010–1013. [Google Scholar] [CrossRef]
- Kamei, T.; Paegel, B.M.; Scherer, J.R.; Skelley, A.M.; Street, R.A.; Mathies, R.A. Integrated hydrogenated amorphous Si photodiode detector for microfluidic bioanalytical devices. Anal. Chem. 2003, 75, 5300–5305. [Google Scholar] [CrossRef]
- Touahir, L.; Moraillon, A.; Allongue, P.; Chazalviel, J.N.; de Villeneuve, C.H.; Ozanam, F.; Gouget-Laemmel, A.C. Highly sensitive and reusable fluorescence microarrays based on hydrogenated amorphous silicon–carbon alloys. Biosens. Bioelectron. 2009, 25, 952–955. [Google Scholar] [CrossRef]
- Novo, P.; Prazeres, D.M.F.; Chu, V.; Conde, J.P. Microspot-based ELISA in microfluidics: Chemiluminescence and colorimetry detection using integrated thin-film hydrogenated amorphous silicon photodiodes. Lab Chip 2011, 11, 4063–4071. [Google Scholar] [CrossRef]
- Novo, P.; Moulas, G.; Prazeres, D.M.F.; Chu, V.; Conde, J.P. Detection of ochratoxin A in wine and beer by chemiluminescence-based ELISA in microfluidics with integrated photodiodes. Sens. Actuat. B Chem. 2013, 176, 232–240. [Google Scholar] [CrossRef]
- Conde, J.P.; Pimentel, A.C.; Pereira, A.T.; Gouvêa, A.; Prazeres, D.M.F.; Chu, V. Detection of molecular tags with an integrated amorphous silicon photodetector for biological applications. J. Non Cryst. Solids 2008, 354, 2594–2597. [Google Scholar] [CrossRef]
- Pereira, A.T.; Pimentel, A.C.; Chu, V.; Prazeres, D.M.F.; Conde, J.P. Chemiluminescent detection of horseradish peroxidase using an integrated amorphous silicon thin-film photosensor. IEEE Sens. J. 2009, 9, 1282–1290. [Google Scholar] [CrossRef]
- Zangheri, M.; Mirasoli, M.; Nascetti, A.; Caputo, D.; Bonvicini, F.; Gallinella, G.; de Cesare, G.; Roda, A. Microfluidic cartridge with integrated array of amorphous silicon photosensors for chemiluminescence detection of viral DNA. Sens. Biosens. Res. 2016, 7, 127–132. [Google Scholar] [CrossRef][Green Version]
- Pinto, I.F.; Santos, D.R.; Caneira, C.R.; Soares, R.R.; Azevedo, A.M.; Chu, V.; Conde, J.P. Optical biosensing in microfluidics using nanoporous microbeads and amorphous silicon thin-film photodiodes: Quantitative analysis of molecular recognition and signal transduction. J. Micromech. Microeng. 2018, 28, 094004. [Google Scholar] [CrossRef]
- Zhang, Z.; Cang, H.; Xie, Y.; Li, H.; Li, H. A miniaturized photodiode-based chemiluminescence sensor for measurement of fractional exhaled nitric oxide. Sens, Actuat. B Chem. 2023, 394, 134402. [Google Scholar] [CrossRef]
- Calabria, D.; Trozzi, I.; Lazzarini, E.; Pace, A.; Zangheri, M.; Iannascoli, L.; Mirasoli, M. AstroBio-CubeSat: A lab-in-space for chemiluminescence-based astrobiology experiments. Biosens. Bioelectron. 2023, 226, 115110. [Google Scholar] [CrossRef] [PubMed]
- Celeiro, M.; Garcia-Jares, C.; Llompart, M.; Lores, M. Recent Advances in Sample Preparation for Cosmetics and Personal Care Products Analysis. Molecules 2021, 26, 4900. [Google Scholar] [CrossRef]
- Girotti, S.; Ferri, E.; Fini, F.; Bolelli, L.; Sabatini, A.G.; Budini, R.; Sichertova, D. Automated and manual luminescent assay of antioxidant capacity: Analytical features by comparison. Talanta 2004, 64, 665–670. [Google Scholar] [CrossRef]
- Latimer, G.W., Jr. Appendix F: Guidelines for Standard Method Performance Requirements: Official Methods of Analysis; AOAC International: Rockville, MD, USA, 2016; pp. 1–18. [Google Scholar]
- Guideline, I.H. Biooanalytical Method Validation M10; European Medicines Agency: Amsterdam, The Netherlands, 2019.


Disclaimer/Publisher’s Note: The statements, opinions and data contained in all publications are solely those of the individual author(s) and contributor(s) and not of MDPI and/or the editor(s). MDPI and/or the editor(s) disclaim responsibility for any injury to people or property resulting from any ideas, methods, instructions or products referred to in the content. |
© 2024 by the authors. Licensee MDPI, Basel, Switzerland. This article is an open access article distributed under the terms and conditions of the Creative Commons Attribution (CC BY) license (https://creativecommons.org/licenses/by/4.0/).