Article

Coffee Biomass-Based Carbon Material for the Electrochemical Determination of Antidepressant in Synthetic Urine

by
Francisco Contini Barreto
1,
Naelle Kita Mounienguet
1,
Erika Yukie Ito
1,
Quan He
2 and
Ivana Cesarino
1,*
1
School of Agriculture, São Paulo State University (UNESP), Botucatu 18610-034, SP, Brazil
2
Faculty of Agriculture, Dalhousie University, Truro, NS B2N 5E3, Canada
*
Author to whom correspondence should be addressed.
Chemosensors 2024, 12(10), 205; https://doi.org/10.3390/chemosensors12100205
Submission received: 23 August 2024 / Revised: 22 September 2024 / Accepted: 30 September 2024 / Published: 3 October 2024

Abstract

:
Escitalopram (ESC) is commonly prescribed as an antidepressant to enhance serotonin levels in the brain, effectively addressing conditions such as depression and anxiety. The COVID-19 pandemic, along with ongoing mental health crises, has exacerbated the prevalence of these disorders, largely due to factors such as social isolation, fear of the virus, and financial difficulties. This study presents the enhancement of a glassy carbon electrode (GC) through the incorporation of hydrochar (HDC) derived from spent coffee grounds and copper nanoparticles (CuNPs) for the detection of ESC in synthetic urine. Characterization of the nanocomposite was conducted using scanning electron microscopy (SEM), energy-dispersive spectroscopy (EDS), and cyclic voltammetry (CV). The analytical parameters were systematically optimized, and a sensing platform was utilized for the quantification of ESC via square-wave voltammetry (SWV). The established linear range was found to be between 1.0 µmol L−1 and 50.0 µmol L−1, with a limit of detection (LOD) of 0.23 µmol L−1. Finally, an electrochemical sensor was employed to measure ESC levels in synthetic urine, yielding recovery rates ranging from 91.7% to 94.3%. Consequently, the HDC-CuNPs composite emerged as a promising, sustainable, and cost-effective alternative for electroanalytical applications.

1. Introduction

The relentless pace of contemporary life and its inherent pressures have consistently served as significant stressors for numerous individuals. Nevertheless, the emergence of the COVID-19 pandemic exacerbated instances of depression and anxiety on a global scale [1]. The implementation of restrictive measures aimed at curbing the virus’s transmission—such as social distancing, economic uncertainties, apprehension regarding infection, and mourning for deceased loved ones—was a pivotal factor influencing the mental health of the worldwide population [1]. Furthermore, individuals already grappling with mental health disorders faced the dual challenge of COVID-19 infection, and others experienced the onset of psychiatric symptoms as a consequence of antiviral treatments [2,3]. This confluence of factors led to a substantial rise in the consumption of antidepressants, as individuals sought to navigate the heightened stress and emotional turmoil brought about by the pandemic [1,2,3].
Escitalopram, also known as escitalopram oxalate, is a pharmacologically active compound found in numerous antidepressant formulations [4]. It is characterized as the S-enantiomer of citalopram, specifically, (1S)-1-[3-(dimethylamino) propyl]-1-(4-fluorophenyl)-1,3-dihydro-2-benzofuran-5-carbonitrile, and is classified within the group of selective serotonin reuptake inhibitors (SSRIs) [5]. This compound plays a crucial role in the majority of antidepressant therapies by modulating the serotoninergic system in the brain, thereby enhancing serotonin levels to alleviate symptoms of depression and anxiety [5]. From an environmental perspective, it is noteworthy that approximately 8% of escitalopram, along with various other substances, is eliminated from the human body and subsequently enters aquatic ecosystems via urine and inadequately processed waste in wastewater treatment plants (WWTPs) [5,6,7].
Research has shown that existing water treatment facilities are inadequately equipped to effectively eliminate pharmaceutical residues, leading to the infiltration of these substances into aquatic environments [8]. While a considerable amount of escitalopram can be removed during the treatment process, the residual quantities present a significant threat to aquatic organisms and, by extension, to humans who consume affected marine life [8,9]. The presence of escitalopram in contaminated waters can induce negative behavioral changes in fish and influence mRNA gene expression directly [8,9]. These observations suggest that escitalopram should be recognized as an emerging contaminant, necessitating enhanced strategies for the management and disposal of pharmaceutical waste to safeguard both aquatic ecosystems and human health [8,9].
Over the past ten years, various methodologies have emerged for the detection of escitalopram and its metabolites, addressing several associated challenges. These methodologies include chromatography, fluorimetry, spectrophotometry, chemiluminescence, and capillary electrophoresis [10,11]. Among these, chromatographic techniques have seen significant advancements [12,13,14,15,16,17], particularly high-performance liquid chromatography (HPLC) [10,12,13,14], which is frequently paired with UV detection [10,12,13], as well as high-performance thin layer chromatography (HPTLC) [10,15]. Additionally, mass spectrometry techniques, such as liquid chromatography tandem-mass spectrometry (LC-MS/MS) and gas chromatography-mass spectrometry (GC-MS), are extensively utilized, particularly for the analysis of biological samples, owing to their high efficiency and precise detection capabilities [16,17]. Nevertheless, many traditional methods can be costly, labor-intensive, and necessitate specialized training for personnel [12,13,17,18,19]. In contrast, electroanalytical methods present a more advantageous alternative for analysis, characterized by their heightened sensitivity and selectivity, reduced solvent and sample consumption, rapid processing times, capability to detect low concentrations, affordability of equipment, and potential for miniaturization and portability [13,17,19]. Moreover, the chemical modification of sensor surfaces can enhance signal amplification, thereby improving sensitivity [19].
Coffee ranks as the second-largest global market, following oil, and is a widely traded beverage enjoyed across the globe [20]. The International Coffee Organization reported that in 2020, coffee production reached over 169 million 60 kg bags [21,22]. As both the production and consumption of coffee are anticipated to rise in the coming years, the volume of byproducts generated by the coffee industry is also expected to increase [21,22]. The processing of coffee yields several byproducts before the final roasted beans are produced, including husk, pulp, mucilage, and spent coffee grounds [21]. Among these, spent coffee grounds represent the final byproduct and constitute the largest portion of coffee-related biowaste, with over 6 million tons generated annually worldwide [21,22]. Historically, the disposal of spent coffee grounds has involved landfilling, a method fraught with issues such as spontaneous combustion and the release of methane and carbon dioxide [22]. Consequently, there is a growing impetus to repurpose spent coffee grounds, leading to their successful application in various domains, including animal feed, biofuels, agricultural fertilizers, and the process of producing hydrochar allows for its implementation in electroanalytical applications as well [19,20,21,22].
Hydrochar is a carbonaceous product derived from the hydrothermal conversion of various biomass sources, including agricultural residues, sewage sludge, and industrial byproducts [23,24,25]. This transformation occurs under conditions of high pressure and temperature, typically between 100 and 375 degrees Celsius, often in the presence of water [23,24,25]. The resultant hydrochar possesses a porous architecture and is primarily made up of carbon, which imparts specific physical and chemical properties [25]. Its applications are wide-ranging, including roles in water purification, the removal of pollutants, the improvement of soil quality, and as a renewable energy source [26]. The versatility and sustainable potential of hydrochar have led to increased interest in its research and development within environmental technologies [19,20,21,22,23,24]. Nonetheless, one limitation of hydrochar is its insufficient surface area. To enhance this characteristic, the incorporation of copper nanoparticles is suggested, aiming to exploit the synergistic benefits of both materials to improve surface area, stability, and conductivity [19,25].
Metal nanoparticles (MNPs) can be synthesized from a variety of metals, including silver, copper, gold, and platinum, and they offer unique benefits for electrode modification compared to other materials [27,28]. In particular, sensors that utilize copper nanoparticles are distinguished by their cost-effectiveness relative to those using silver or gold [29]. Moreover, these sensors possess excellent conductivity, an enlarged surface area that promotes enhanced mass transport, and consistent chemical stability [27,28]. These features make the application of copper nanoparticles particularly appealing, and they have been successfully employed in the analysis of substances such as chloroquine, bisphenol-A, fluoxetine and uric acid [19,27,28].
In this study, a nanocomposite composed of hydrochar and copper nanoparticles was developed for the detection of escitalopram. This research presents an environmentally friendly approach to investigating an emerging contaminant by utilizing spent coffee grounds as a carbon source in the fabrication of sensors. The modified electrode demonstrated efficacy in measuring the concentration of antidepressant in synthetic urine samples.

2. Materials and Methods

2.1. Instrumentation

Square-wave voltammetry (SWV) experiments were performed utilizing an experimental configuration that comprised a potentiostat (Autolab PGSTAT-128N Electrochemical System, Utrecht, The Netherlands) in conjunction with NOVA 2.1 software (Metrohm, Utrecht, The Netherlands). The study incorporated three distinct types of working electrodes: glassy carbon (GC) (diameter = 2 mm ± 0.1 mm), glassy carbon modified with hydrochar (HDC), and glassy carbon modified with hydrochar and copper nanoparticles (HDC-CuNPs), each featuring unique surface modifications. A platinum auxiliary electrode was employed, while the reference electrode utilized was Ag/AgCl/KCl (3.0 mol L−1).

2.2. Solutions and Reagents

The solutions utilized in this study were prepared using ultrapure water sourced from the Millipore Milli-Q system (resistivity ≥ 18.2 MΩ cm). All reagents employed were of analytical grade and did not undergo any purification prior to their application in the experiments. The chemicals, including CuCl2 (≥99.0%), escitalopram oxalate (≥ 98.0%), sodium dodecyl sulfate (≥99.0%), sodium borohydride (≥98.0%), ethanol (≥99.5%), calcium chloride dihydrate (≥99.0%), sodium chloride (≥99.0%), sodium sulfate (≥99.0%), potassium chloride (≥99.0%) ammonium chloride (≥99.99%), potassium phosphate monobasic (≥99.0%), sodium phosphate dibasic (≥99.0%), urea (≥99.0%) and alumina (0.3 μm) (≥99.0%) were procured from Sigma-Aldrich, located in São Paulo, Brazil.

2.3. Synthesis of HDC

This procedure was executed in accordance with the methodology established by Barreto et al. [19]. Initially, wet spent coffee grounds were sourced from Tim Hortons in Truro, Canada and subsequently subjected to oven drying at a temperature of 105 °C for a duration of 24 h. Following this drying process, the spent coffee grounds were combined with distilled water in a ratio of 1:8 and introduced into a 100 mL high-temperature and high-pressure reactor (Parr 4580, Moline, IL, USA). The reactor was securely sealed and purged with pure nitrogen for 2 to 3 min to eliminate any residual air. After sealing, nitrogen was introduced to establish an initial pressure of 20 bar. The reactor was then heated to 300 °C and maintained at this temperature for 60 min. Upon completion of the reaction, the reactor was allowed to cool to room temperature, and the gaseous byproducts were vented into a fume hood. The solid–liquid mixture was subsequently transferred to a beaker, where the solid component was isolated through vacuum separation and dried in an oven at 105 °C overnight. The final dried solid product was referred to as HDC.

2.4. Synthesis of HDC-CuNPs

The preparation of HDC-CuNPs was conducted following a methodology outlined in our earlier research [19]. Initially, 20 mg of HDC was combined with 20 mL of pure ethanol in a beaker and sodium dodecyl sulfate in a 10:4 ratio, and this mixture was subjected to ultrasonic treatment in a benchtop ultrasonic bath for a duration of 30 min. Subsequently, 16 mg of sodium borohydride was added, and the suspension underwent further ultrasonic treatment for an additional 30 min. Following this, copper chloride (CuCl2) was introduced at a concentration of 30% (m/m) relative to the mass of HDC and was subsequently diluted with ethanol. The incorporation of copper nanoparticles into the HDC matrix was achieved by gradually adding the copper chloride solution while stirring continuously at a rate of one drop per second. Upon completion of this step, the solution was sonicated for another 30 min and then centrifuged for 5 min to facilitate the separation of suspended particles. The resulting material was then subjected to a purification process using ethanol. Before utilizing this composite for electrode modification, the suspension was processed in a tip sonicator for 10 min to ensure a uniform solution.

2.5. Electrode Preparation

The process begins with the polishing of the glassy carbon (GC) electrodes’ surface to eliminate any impurities and ensure a smooth, uniform finish. This is achieved by employing silicon carbide sandpaper along with polystyrene in a 0.5 μmol L−1 aqueous alumina suspension until a mirror-like surface is produced. Subsequently, it is essential to clean the electrodes thoroughly to remove any polishing residues. This involves placing the electrodes in ethanol and subjecting them to an ultrasonic bath for five minutes. This cleaning step should be followed by a rinse with ultrapure water to ensure that all impurities are completely removed. The cleaned GC electrodes will then be modified for specific experimental purposes by applying 10 μL of a composite suspension (HDC-CuNPs or HDC) onto the surfaces of the electrodes through dripping. This modification is crucial for achieving the desired sensitivity and selectivity in the analyses. Finally, the electrodes must be dried with care before their use in experiments. This is carried out by placing them in an oven at 60 °C until they are fully dry, which is essential to prevent any moisture from interfering with the results.

2.6. Sample Preparation and Analysis of ESC in Synthetic Urine

Synthetic urine was synthesized using a procedure similar to that reported by Laube et al. [30]. The components of the solution include 1.10 g of CaCl2 ∙ 2 H2O, 2.92 g of NaCl, 2.25 g of Na2SO4, 1.40 g of KH2PO4, 1.60 g of KCl, 1.00 g of NH4Cl, and 25.00 g of urea, with the final mixture achieving a pH of 7.0 in one liter of ultrapure water. In order to quantify ESC in synthetic urine, a volume of 100 µL of the urine solution was contaminated with known concentrations of ESC, achieving a final concentration of 3.00 µmol L−1 following dilution in a buffer for measurements in the electrochemical cell. The analyses were carried out using SWV, with the standard addition technique applied for quantification.

3. Results and Discussion

3.1. Morphological and Electrochemical Characterization of the Nanocomposites

The structural properties of HDC and HDC-CuNPs were thoroughly analyzed using scanning electron microscopy (SEM). As illustrated in Figure 1A, HDC displays a unique porous structure characterized by a honeycomb configuration and significant fragmentation [31]. The irregular nature of the structure limits the crystallization of HDC [32]. The specific characteristics of the pores are influenced by the thermal conditions and synthesis duration, which are critical for pollutant filtration applications [31]. Figure 1B presents the HDC-CuNPs nanocomposite, which is distinguished by the presence of copper nanoparticles, with their dimensions outlined in Figure 1C, indicating a significant alteration of the HDC substrate. Furthermore, energy-dispersive spectroscopy (EDS) analysis confirmed the incorporation of copper into the HDC, demonstrating a notable compositional change in the material.
The electrochemical characteristics of the GC/HDC-CuNPs electrode were systematically investigated using cyclic voltammetry in a phosphate buffer solution (PBS), specifically at a concentration of 0.2 mol L−1 and a pH of 7.0. The experimental procedure involved a scan rate of 50 mV s−1, with the potential ranging from 0.5 V to −0.8 V, as illustrated in Figure 2. The voltammogram exhibited distinct peaks, signifying the oxidation (Cu0 to Cu2+) and reduction (Cu2+ to Cu0) processes of copper. This finding corroborates previous research and validates the incorporation of copper nanoparticles into the electrode’s structure [18].

3.2. Evaluation of Different Working Electrodes in Presence of a Redox Probe

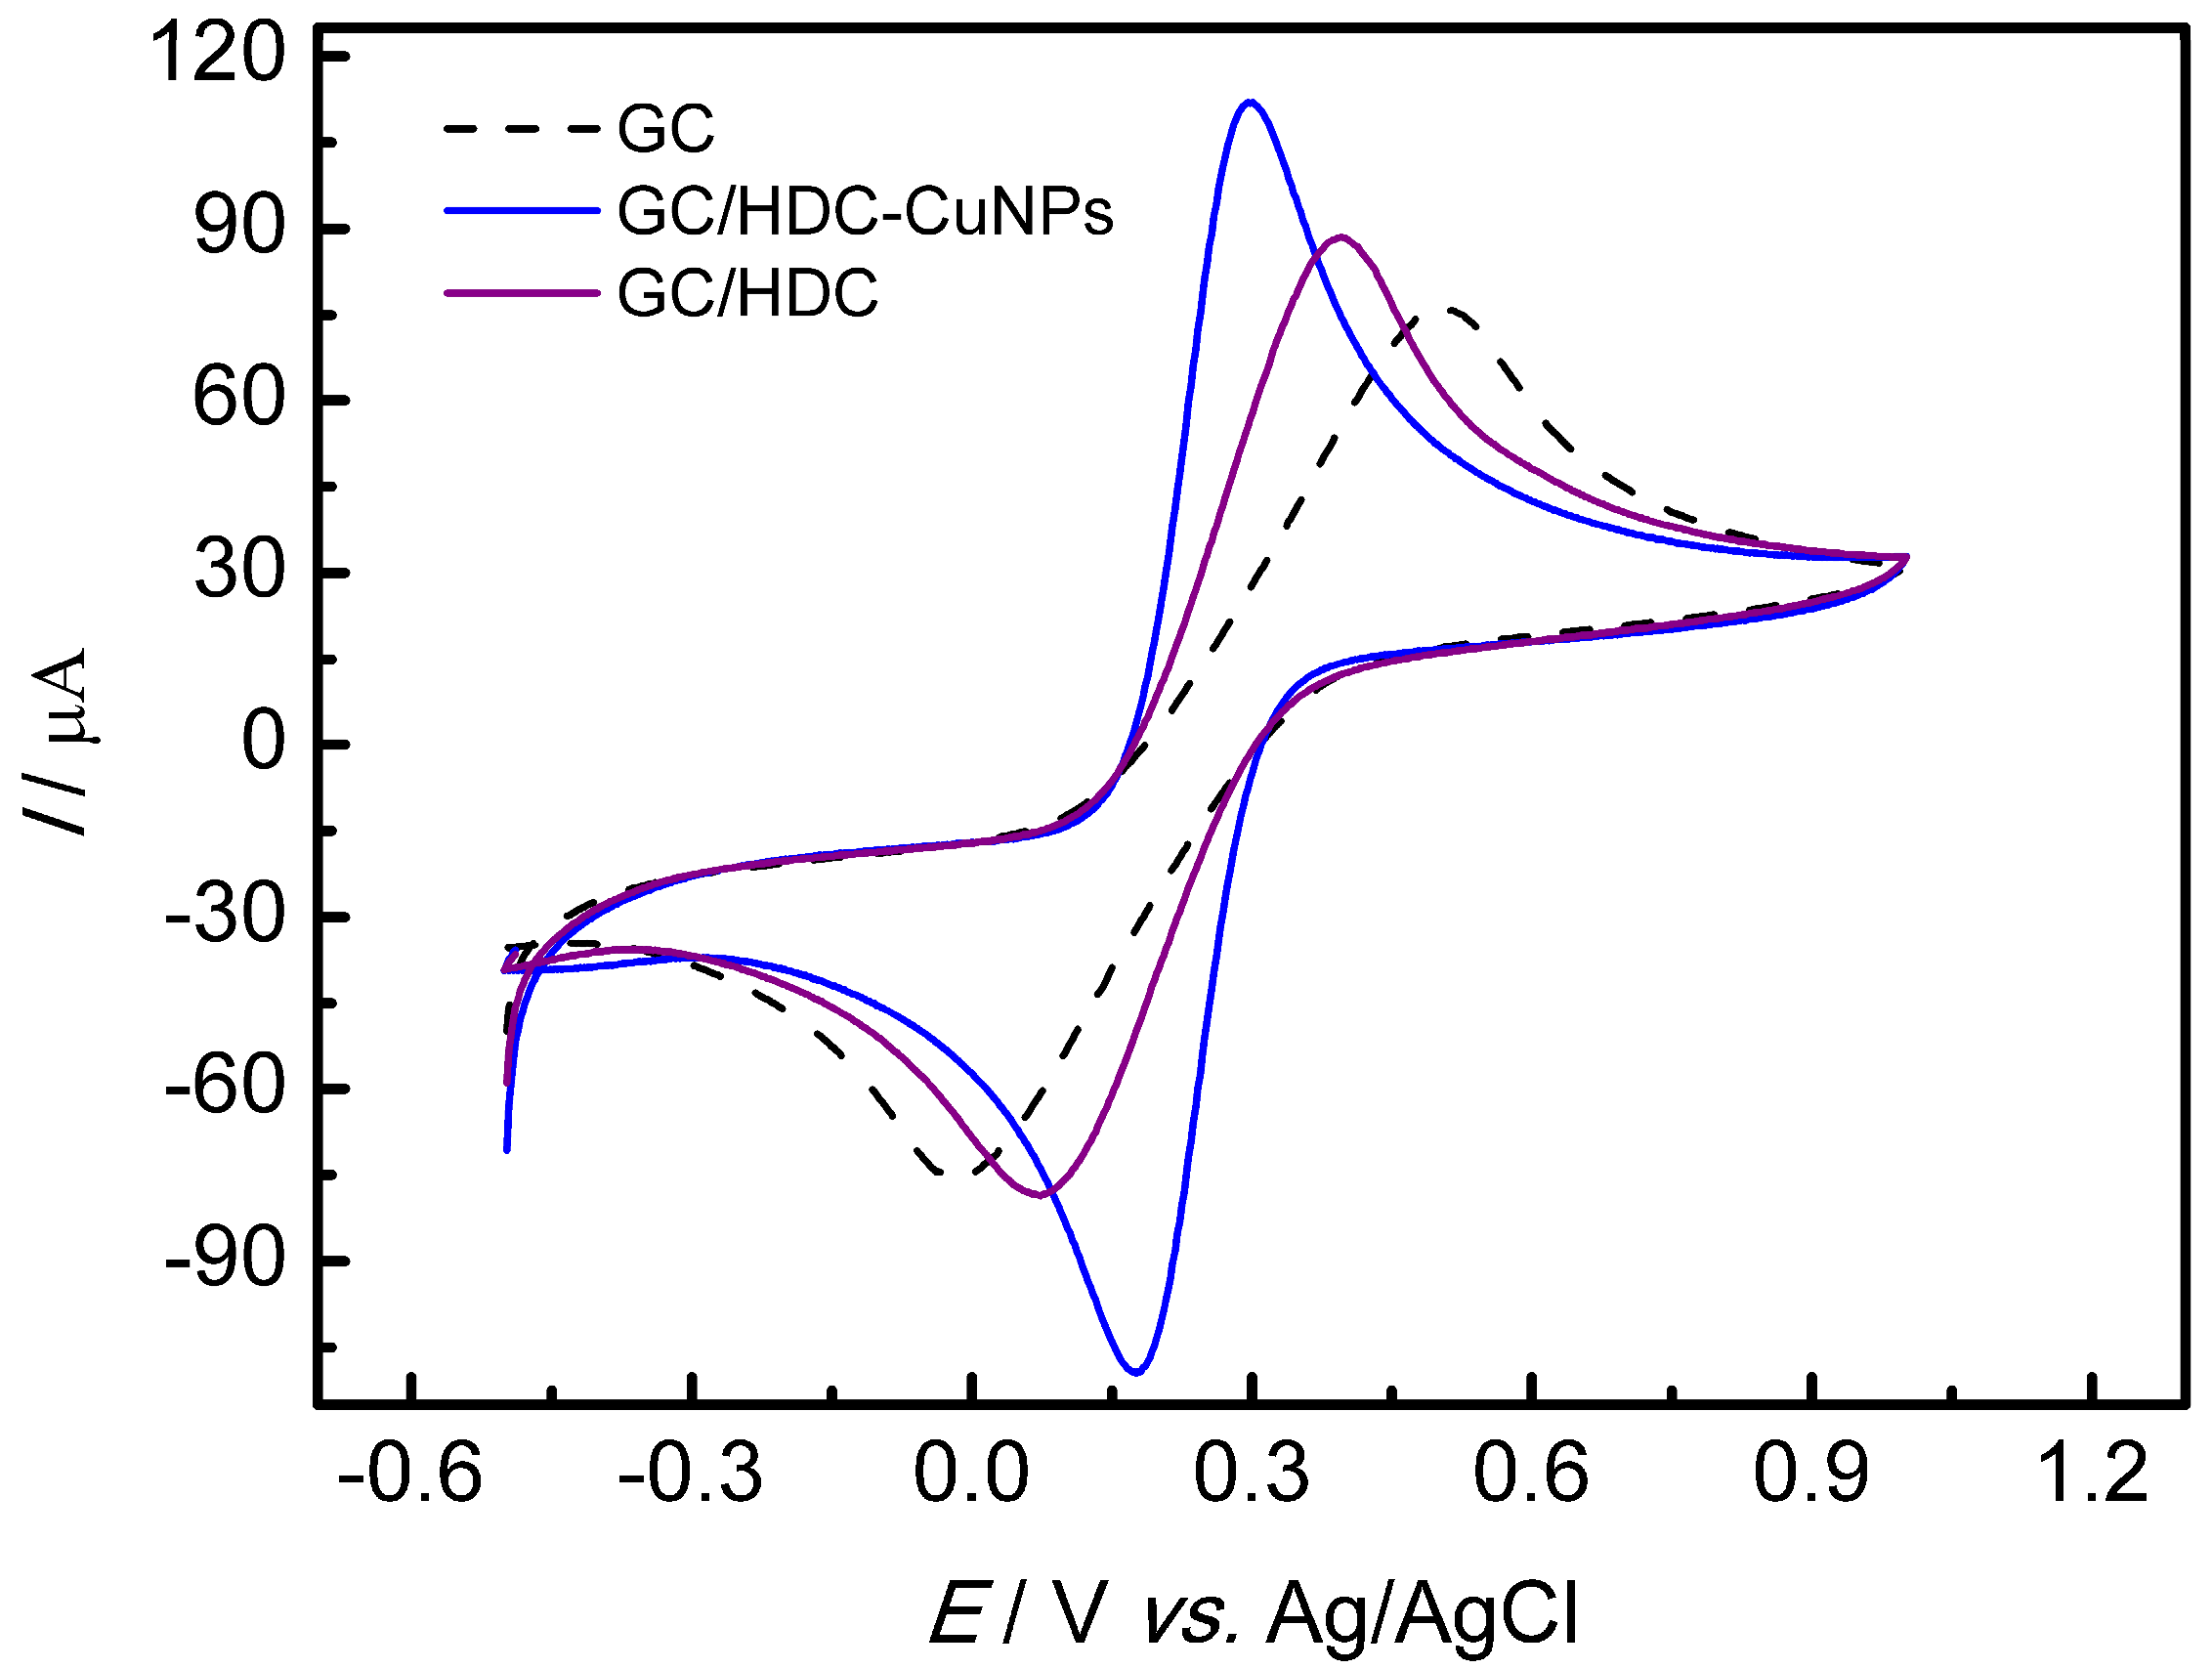
In order to evaluate the synergistic effects of the GC/HDC-CuNPs electrode relative to the GC/HDC and unmodified GC electrodes, CV was performed at a scan rate of 50 mV s−1. This was conducted in a solution containing 5.0 × 10⁻³ mol L−1 ferricyanide/ferrocyanide as the redox probe and 0.2 mol L−1 PBS at a pH of 7.4. The conductivity of the composite was analyzed, revealing that the GC/HDC-CuNPs electrode achieved the highest peak currents and exhibited enhanced reversibility, as shown in Figure 3, when compared to the GC/HDC and GC electrodes. Additionally, the current and peak potential values listed in Table 1 demonstrate that the integration of copper nanoparticles into the HDC framework resulted in an improved electrochemical response, leading to their application in subsequent experiments.
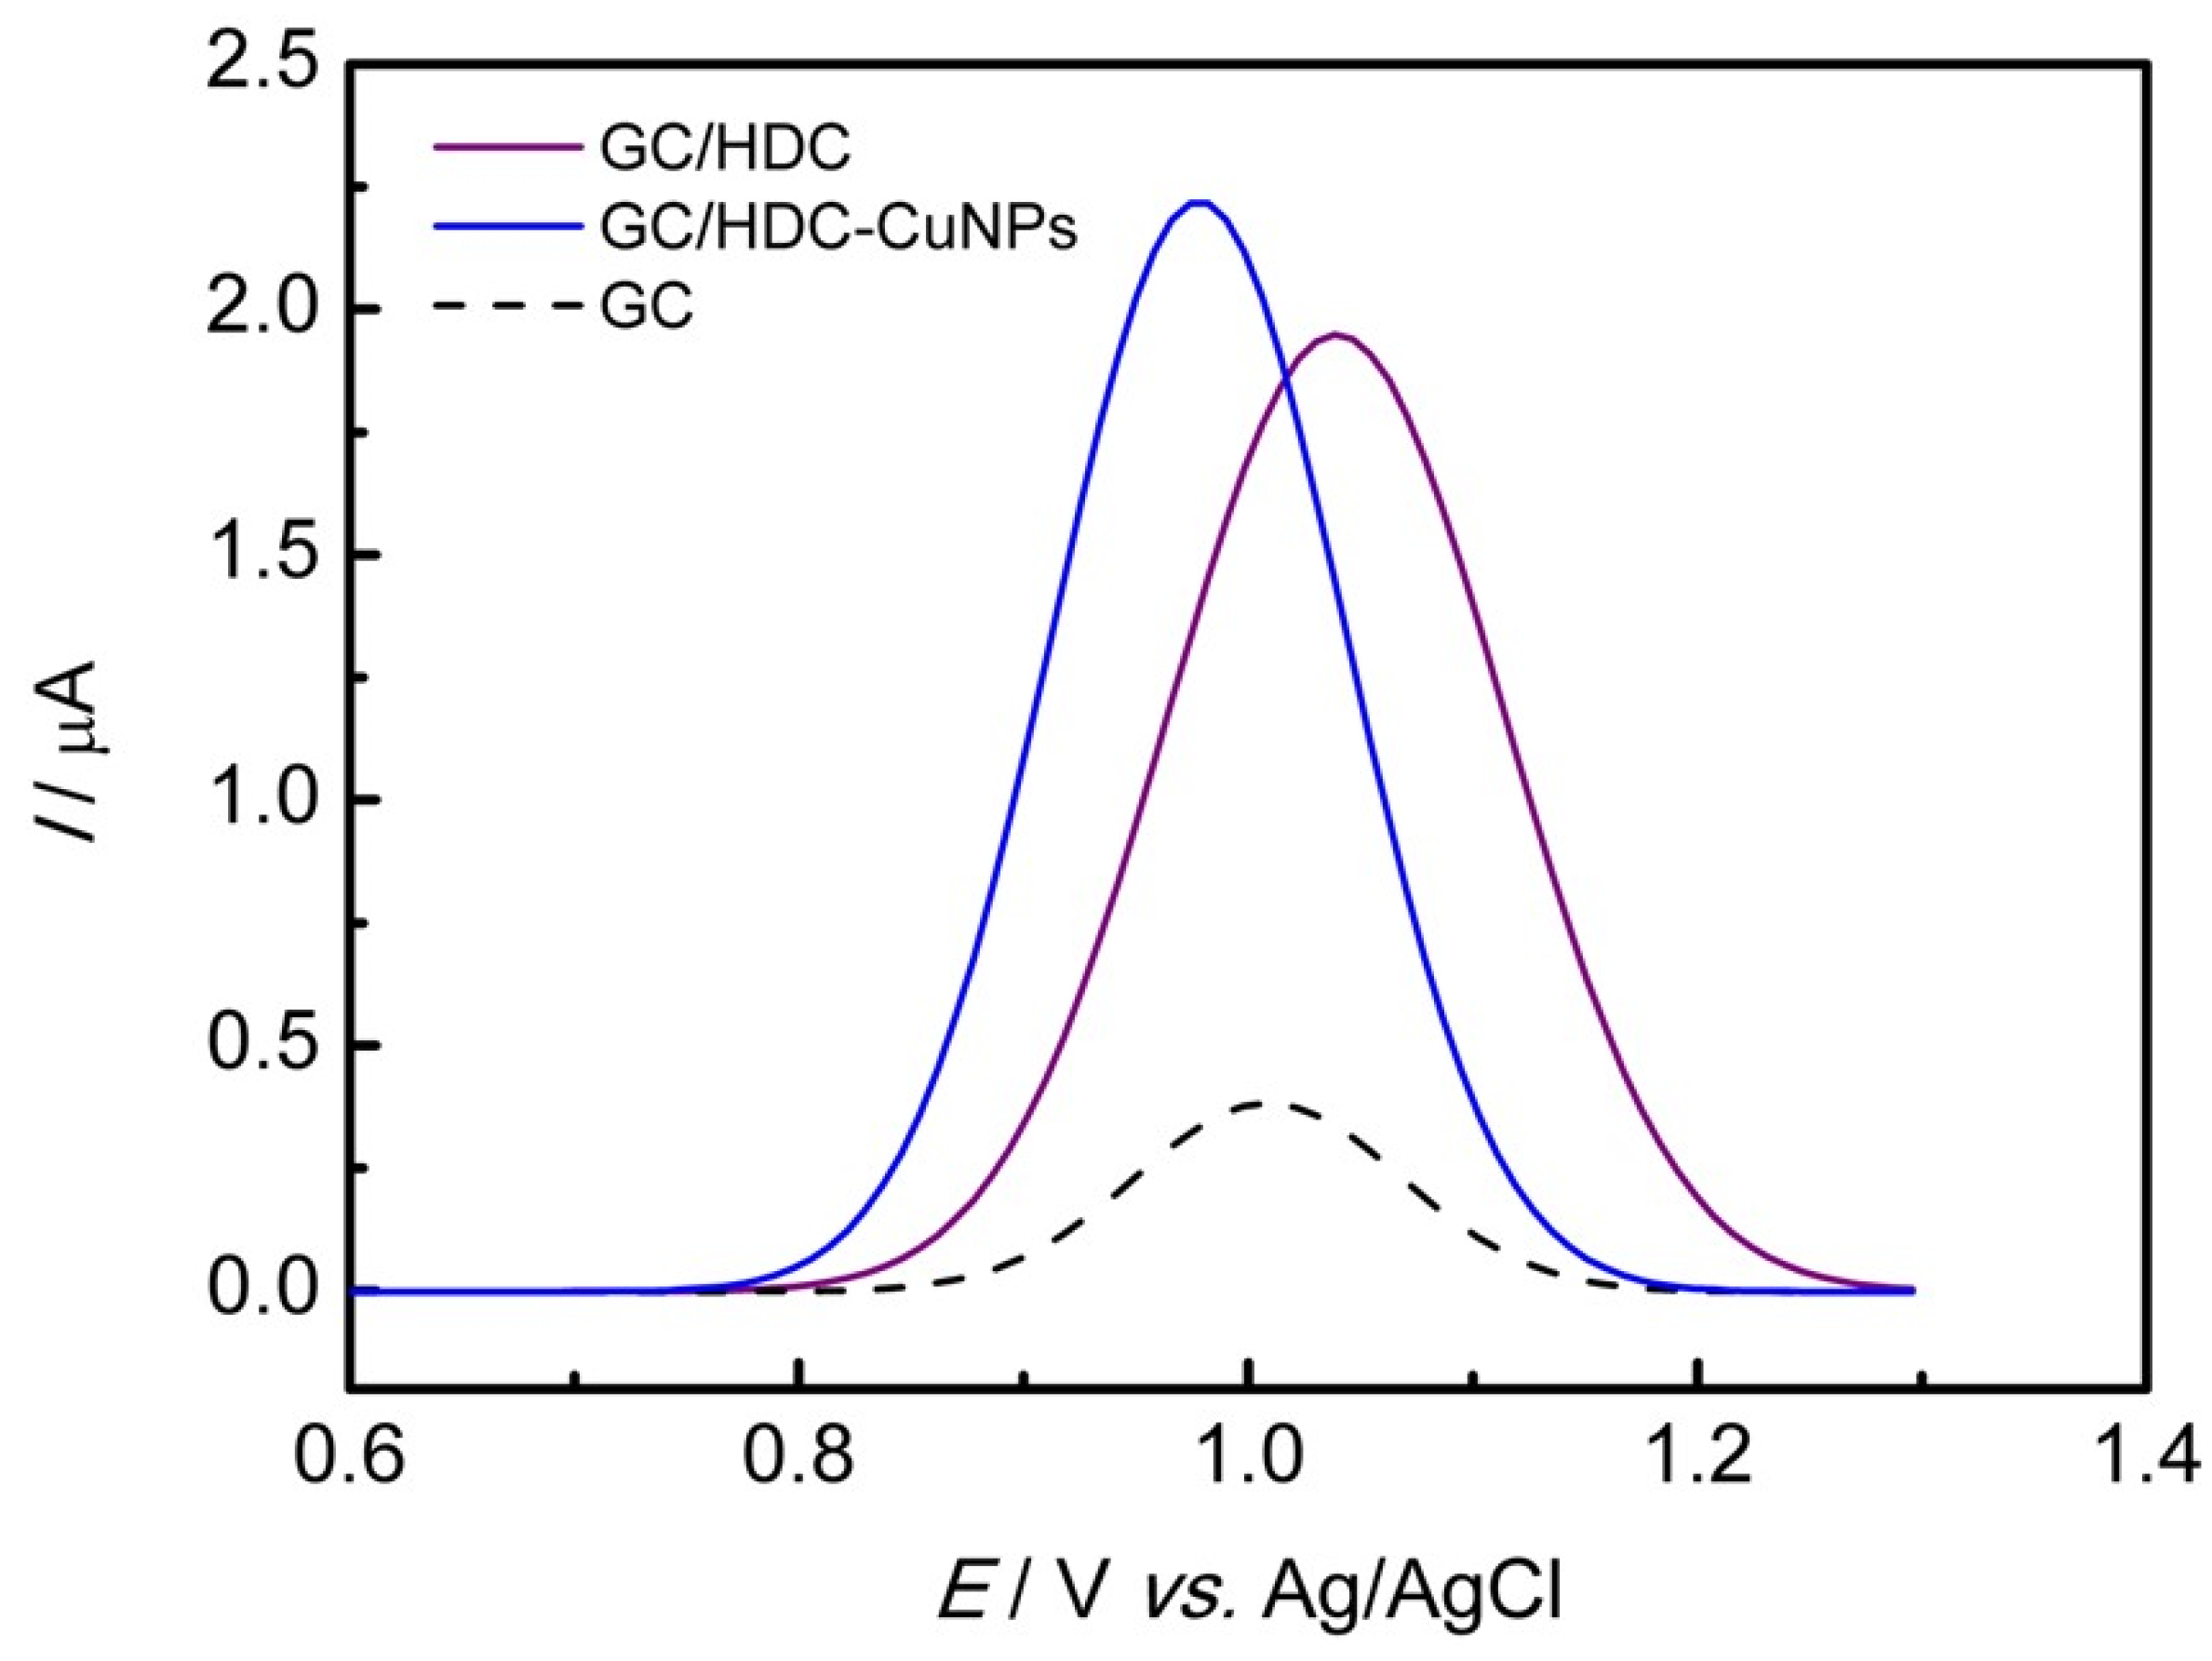
The electrochemical performance of the electrodes, specifically GC (black line), GC/HDC (purple line), and GC/HDC-CuNPs (blue line), was evaluated through SWV in the oxidation of ESC. The experiments were conducted in PBS at a concentration of 0.2 mol L−1 and a pH of 7.0, utilizing a modulation amplitude of 0.02 V, a step potential of 0.005 V, and an ESC concentration of 50.0 μmol L−1. The findings are illustrated in Figure 4. Analysis of the curves reveals a notable shift in the oxidation potential when the electrodes incorporating HDC-CuNPs are employed. This shift is attributed to the enhanced electrocatalytic activity provided by the composite, which reduces the energy required for the oxidation of ESC. Testing revealed that the GC/HDC-CuNPs had the most prominent anodic peak for the oxidation of ESC among the electrodes analyzed. The electrode modified only with HDC also exhibited a notably higher potential for oxidizing the target molecule relative to the GC electrode. This enhancement in the anodic peak is linked to increased interaction between the analyte and the active sites of the HDC and HDC-CuNPs composite. Consequently, the synergistic effect of CuNPs and hydrochar is clearly demonstrated by the increased anodic peak and the observed shift in oxidation potential towards lower values.

3.3. Electrochemical Oxidation of ESC

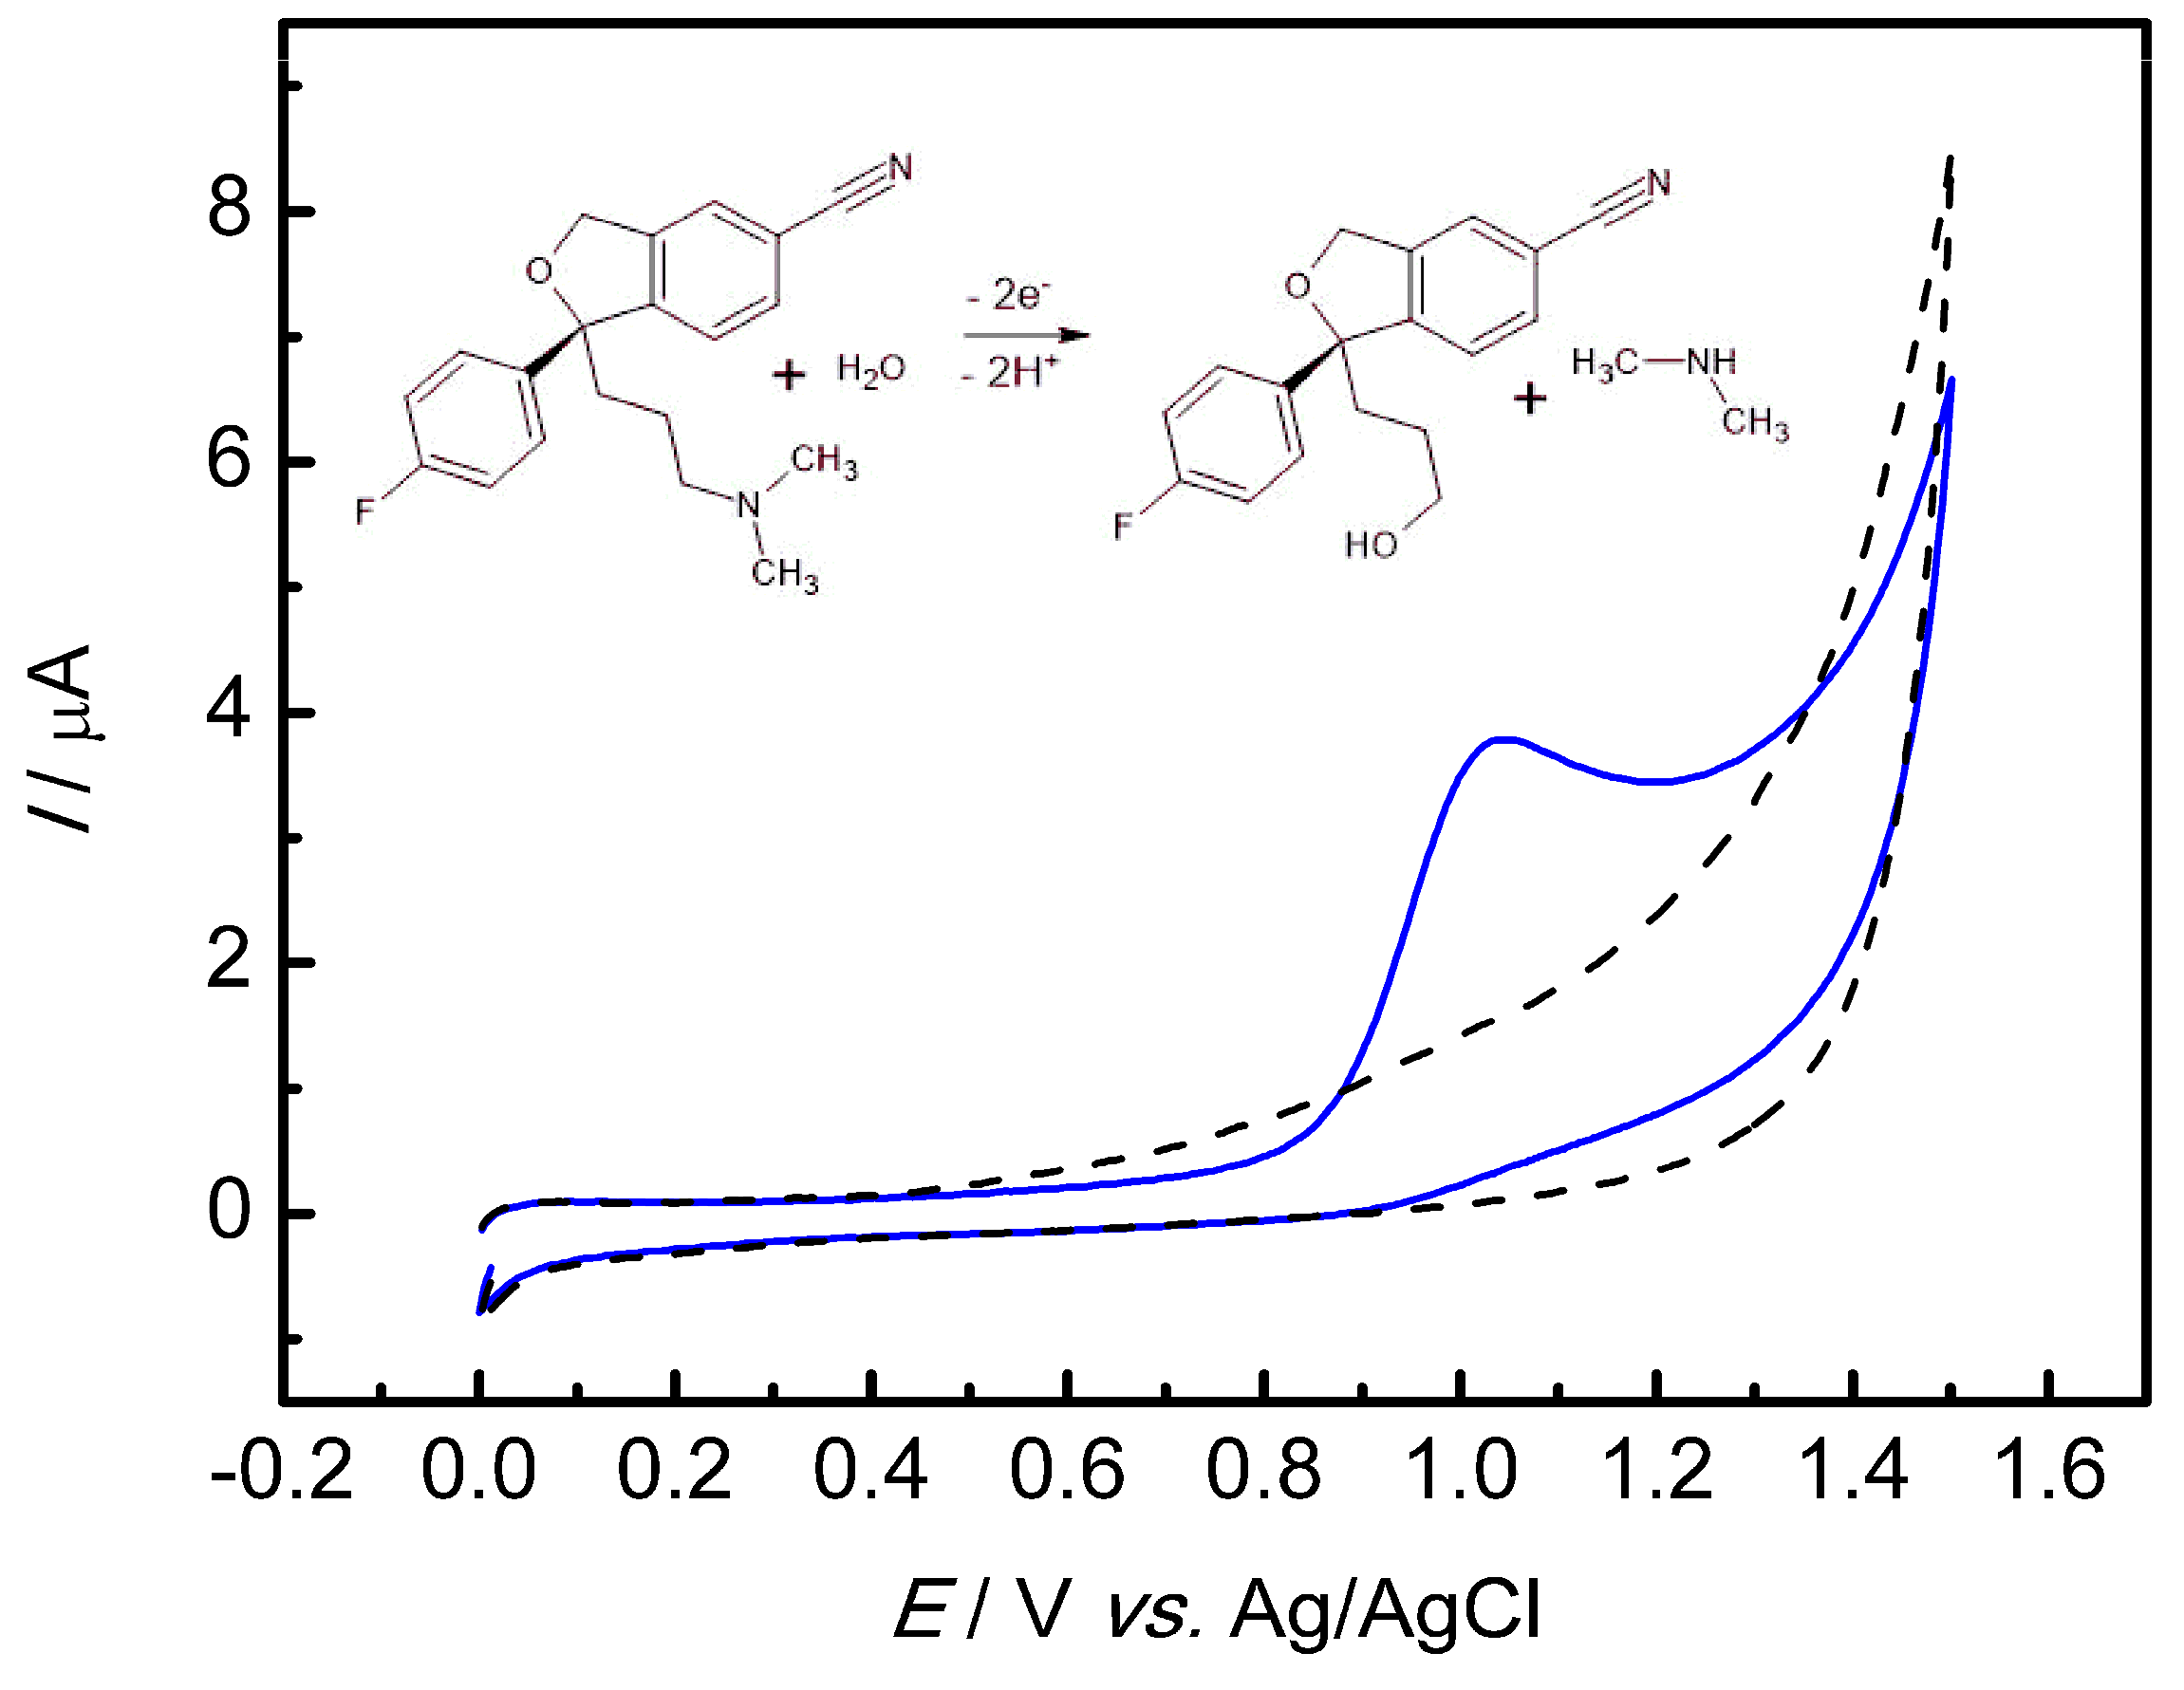
The electrochemical oxidation of ESC was investigated on the GC/HDC-CuNPs electrode within a 0.2 mol L−1 PBS at a pH of 7.0, utilizing cyclic voltammetry (CV) at a scan rate of 50 mV s−1. As illustrated in Figure 5, the absence of ESC resulted in no observable oxidation process (dotted line). Conversely, the introduction of 100.0 μmol L−1 ESC (blue line) produced a distinct oxidation peak at +1.02 V relative to Ag/AgCl. This oxidation mechanism is attributed to the transfer of two electrons from the terminal tertiary amine group [33]. The lack of reduction peaks during the reverse potential scan indicates that the oxidation of ESC is an irreversible process, consistent with findings from previous studies [11].

3.4. Optimization of Parameters

Table 2 and Figure 6 outline the modifications made to the electrochemical parameters in order to optimize the voltametric analysis of ESC. An investigation was conducted into the copper proportion relative to the mass of hydrochar to identify the ratio that would produce the maximum peak current in the oxidation of the ESC. SWV was carried out in a 0.2 mol L−1 PBS solution at pH 7.0 containing 50.0 µmol L−1 of ESC, utilizing a frequency of 25 Hz, modulation amplitude of 0.02 V and step potential of 0.005 V. The copper content was evaluated from 20% to 40%, presenting the highest anodic peak current when 25% of the salt was used in the synthesis.
A further important aspect that contributes to the enhancement of the analytical signal of the molecule is the pH. Throughout this investigation, the pH was varied within a range from 5.0 to 9.0, with a pH of 7.0 yielding the best analytical outcome. The same configuration of SWV of the previous study was carried out in this experiment.
Finally, parameters related to SWV were also examined. Frequency, modulation amplitude, and step potential were investigated in accordance with the optimization range provided in Table 2. These studies were conducted in a 0.2 mol L−1 PBS solution at pH 7.0 with 10 µmol L−1 of ESC. The optimized values can also be found in Table 2 and Figure 6.

3.5. Calibration Curve

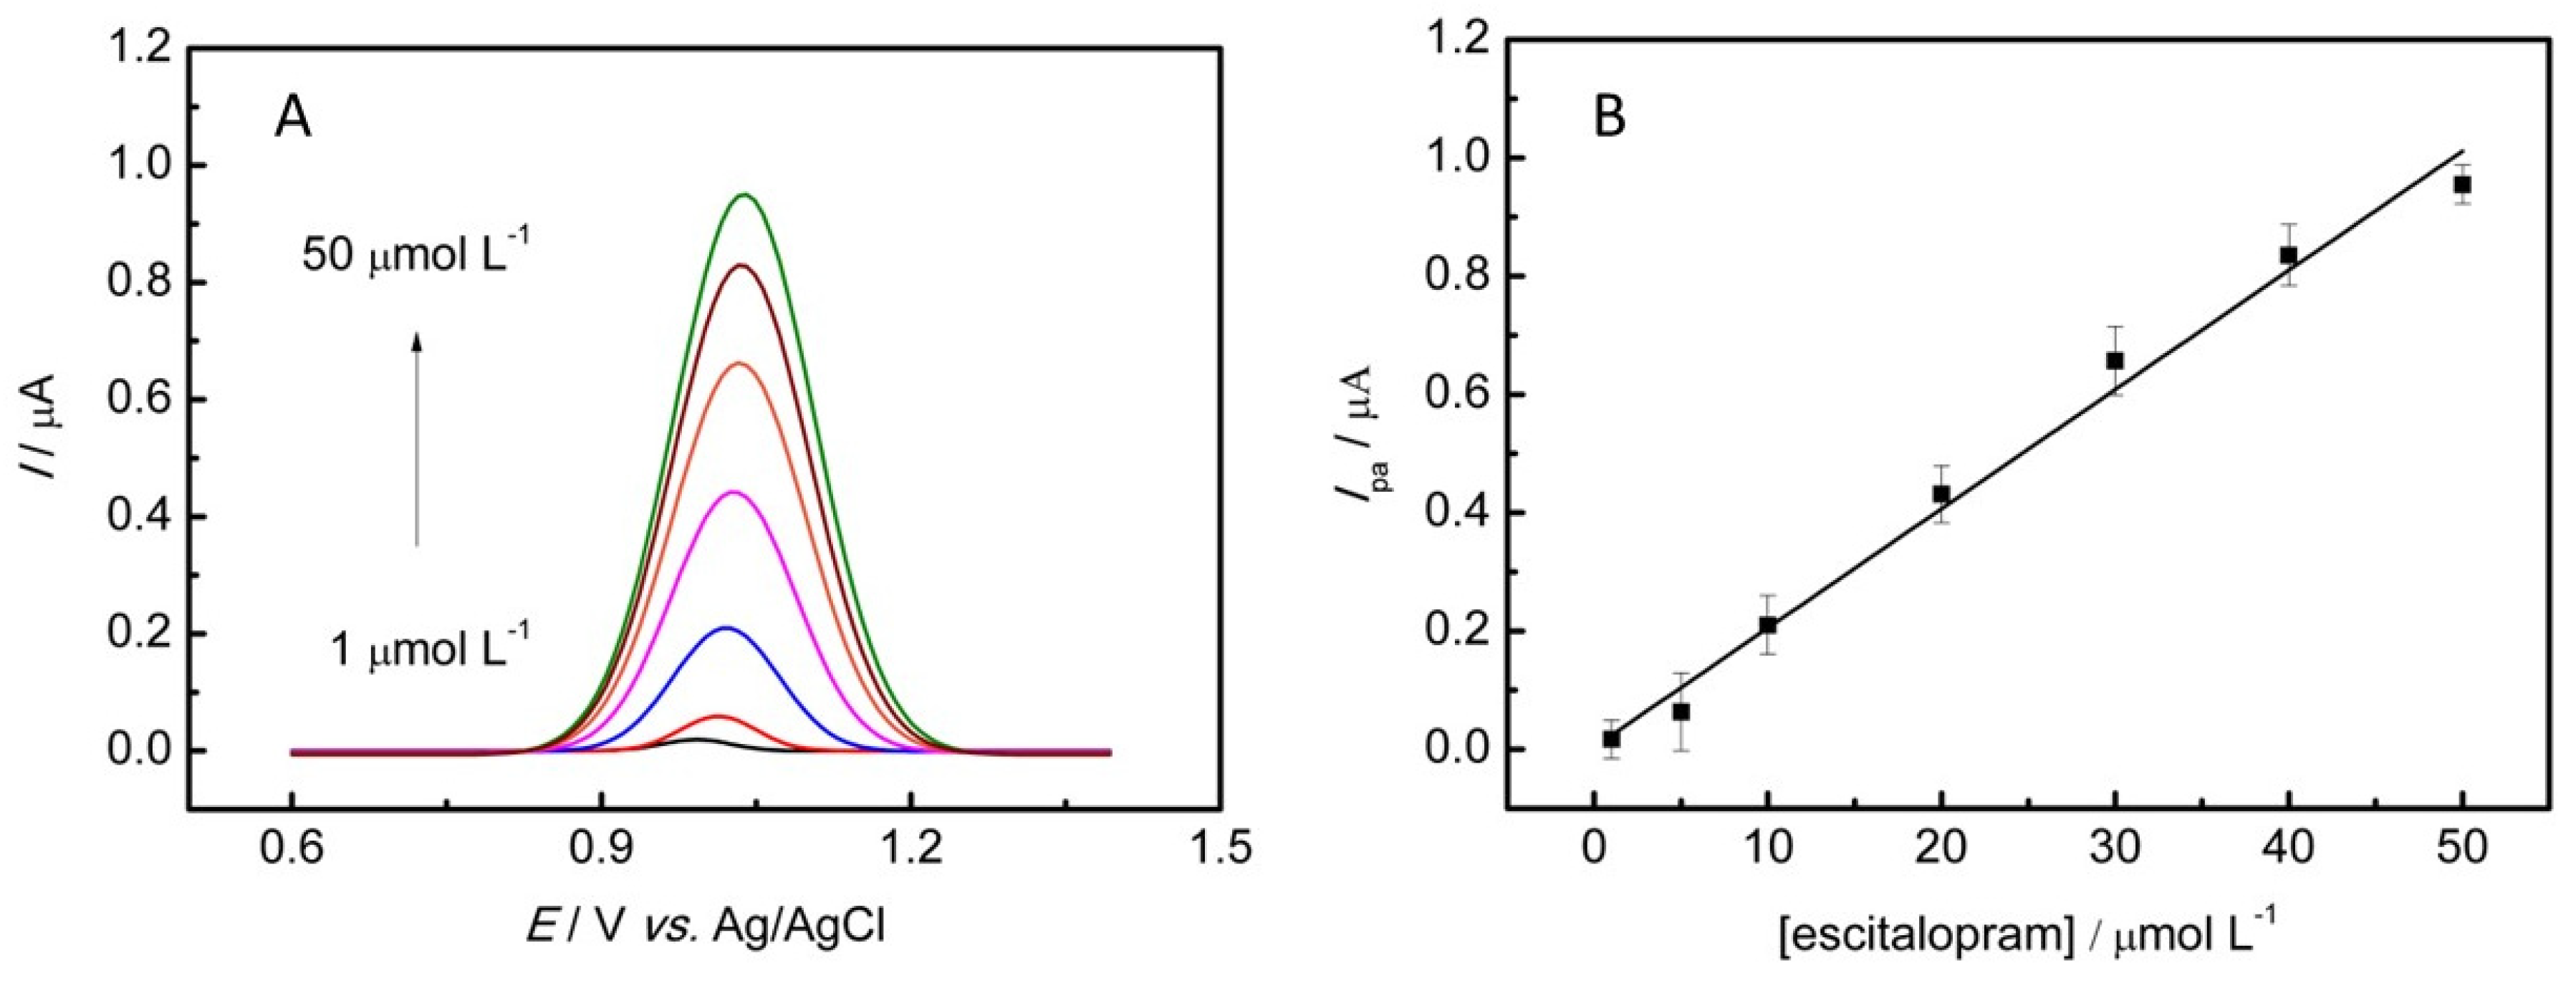
To determine the linearity intervals and the limit of detection, a calibration curve was constructed. The SWV technique, employing the optimized parameters outlined in Table 2 was applied. Subsequently, the anodic peak current was plotted in relation to the corresponding concentrations of ESC. As illustrated in Figure 7, the graph reveals a linear range for ESC concentrations spanning from 1.0 to 50.0 μmol L−1, accompanied by the following equation:
Ipa (µA) = 0.004 (µA) + 0.020 (µA/µmol L−1) × Cescitalopram (µmol L−1)
The result illustrated in Equation (1) reveals a coefficient of determination (R2) of 0.987. A detection limit of 0.23 µmol L−1 for ESC was determined. The calculations were performed in accordance with IUPAC recommendations, utilizing a 3σ/slope ratio to establish the detection limit, where σ denotes the standard deviation of the mean from 10 blank voltammograms. For the repeatability assessment, electrochemical measurements of ESC were executed through 10 measurements using square-wave voltammetry (SWV) at a concentration of 10.0 μmol L−1, resulting in a repeatability value of 2.2%. Furthermore, a reproducibility test was conducted, which involved three distinct modified electrodes measured in triplicate, yielding a reproducibility value of 6.1%. The composite suspended in water was stored in a refrigerator for a duration of 40 days and was utilized nearly every day throughout this period. At the conclusion of this time frame, it was able to retain 68% of its initial measurement compared to when the composite was freshly synthesized.
The application of electrochemical sensors for the determination of ESC has been documented in only a few studies. Baccarin et al. [33] created a modified electrode composed of graphite-polyurethane integrated with carbon nanotube graphene for this analysis. The linearity and detection limits for the graphene and carbon nanotube-modified electrodes were recorded at between 1.5 µmol L−1 and 12 µmol L−1 (for both) and 0.25 µmol L−1 and 0.45 µmol L−1, respectively [33]. As a result, the HDC-CuNPs demonstrated a wider linearity range and lower detection limits compared to electrodes made from more costly materials. Furthermore, the sustainability of the sensors developed using HDC is an important aspect. When compared to the research conducted by Trindade et al. [34], who also utilized renewable carbon sources (bamboo biochar) for sensor fabrication, the HDC electrode again showed advantages in terms of linearity and limit of detection, with Trindade’s findings indicating values from 0.02 µmol L−1 to 5 µmol L−1 and 0.25 µmol L−1, respectively. In comparison to other analytical methods, the GC/HDC-CuNPs demonstrated a lower LOD when evaluated against a chromatographic method studied by Salome et al. (228.0 µmol L−1) [35]. Although the detection limit of the proposed method is higher than that of the capillary electrophoresis examined by Johannesson et al. [36], the GC/HDC-CuNPs method proves to be simpler, more cost-effective, and more sustainable, aligning more closely with current sustainability policies.

3.6. Determination of ESC in Synthetic Urine

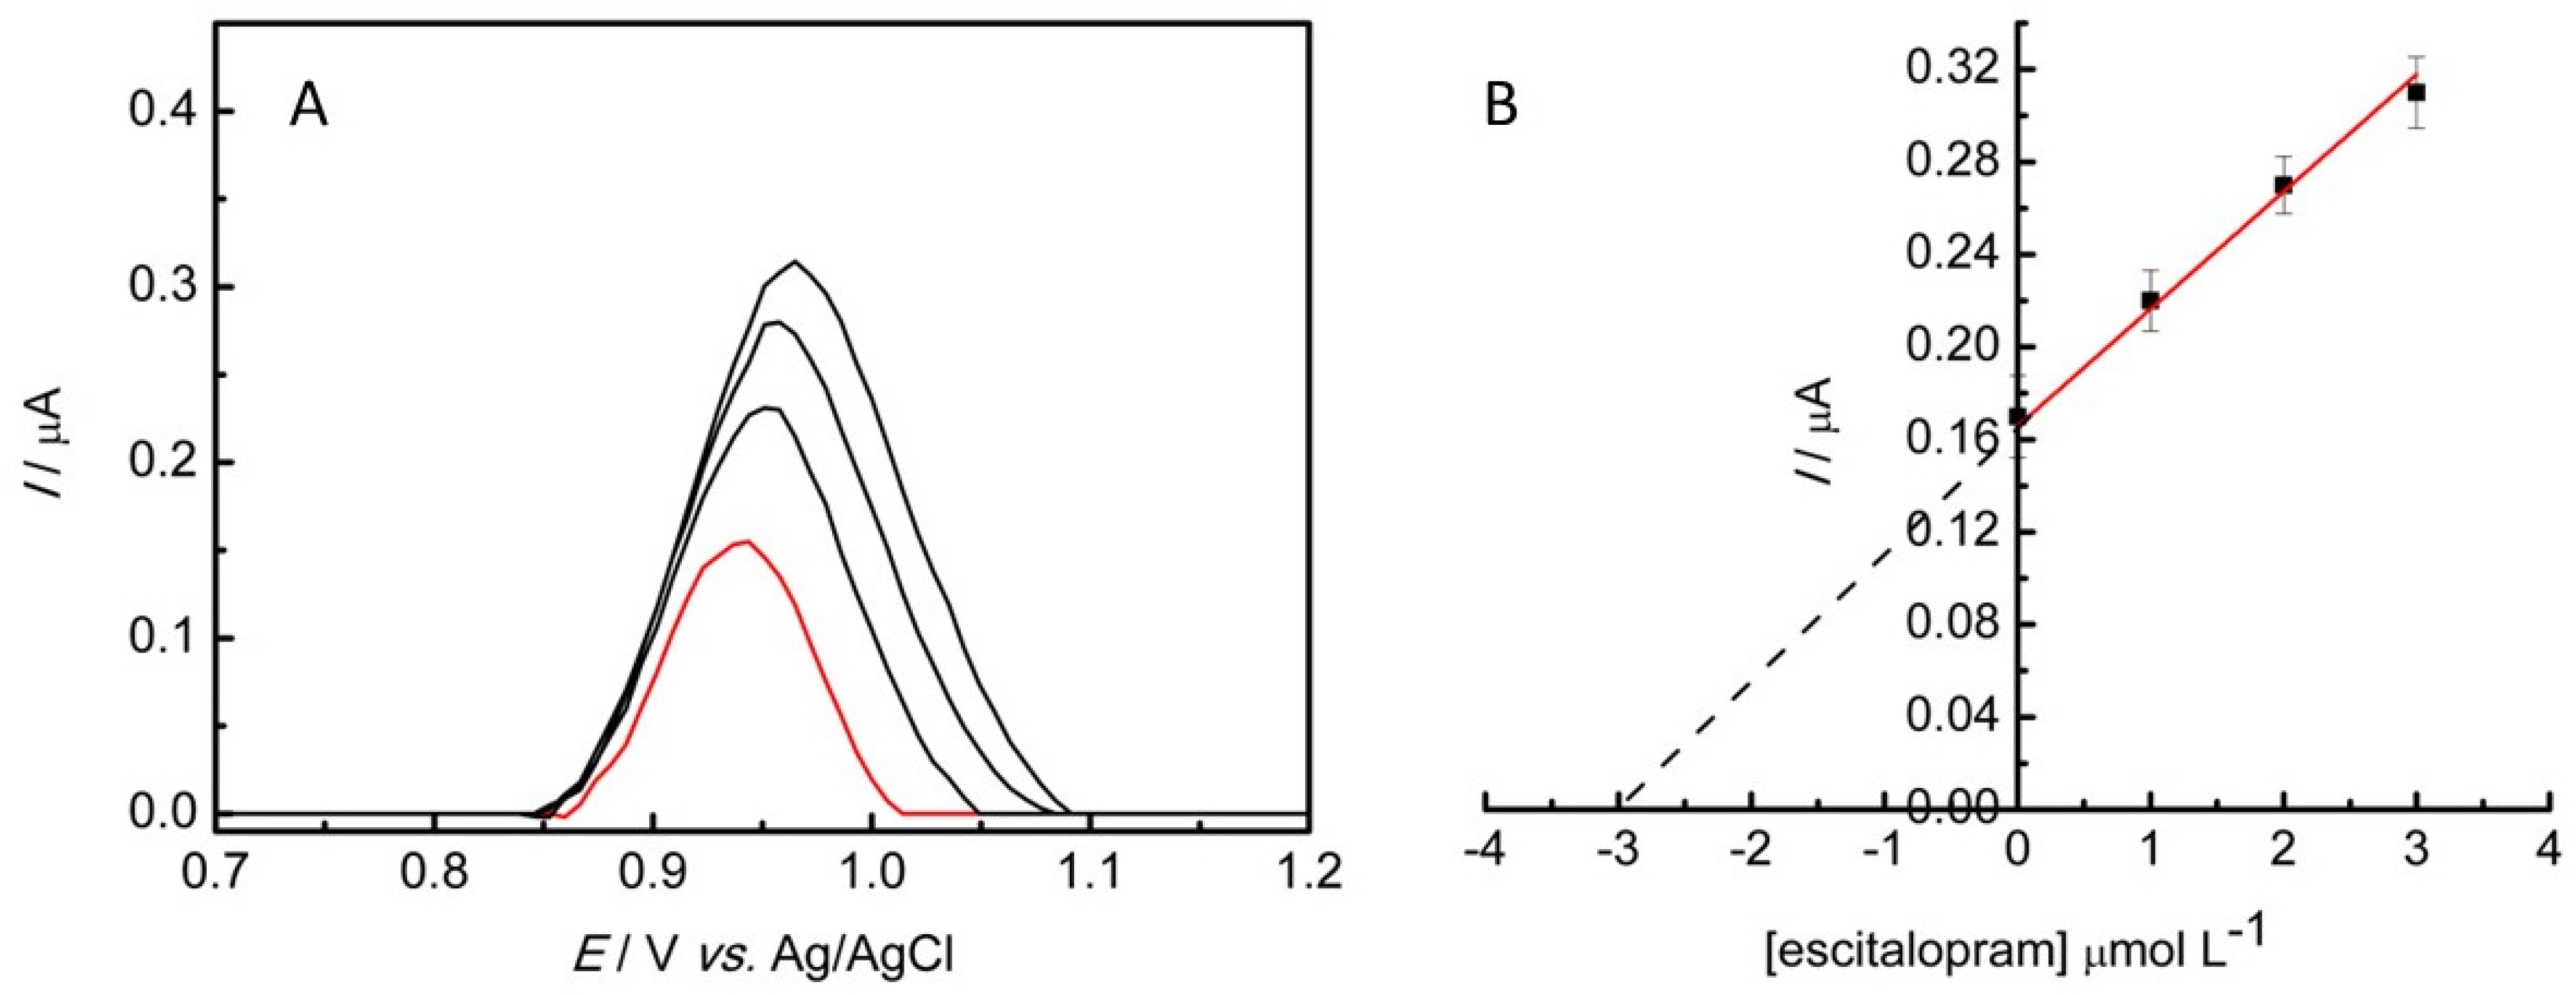
The GC/HDC-CuNPs electrode was employed for the determination of ESC levels in synthetic urine samples. This quantification was performed in triplicate through the standard addition technique. In this procedure, 100 µL of synthetic urine was enriched with a specific quantity of ESC, which, upon dilution in PBS, yielded a final concentration of 3.00 µmol L−1. Three successive additions of 1.00 µmol L−1 were made to the sample to implement the methodology. The voltammograms obtained from square-wave voltammetry are illustrated in Figure 8, and the quantification results for ESC are detailed in Table 3. The average concentration of ESC was found to be 2.78 ± 0.03 µmol L−1, with recovery percentages between 91.7% and 94.3%. The results suggest that the electrode examined could represent a highly sustainable, economical, and efficient material for detecting ESC in urine. Consequently, it may function as an effective instrument for assessing the presence of unmetabolized drugs in aquatic environments.

3.7. Study with Interferents

To evaluate the selectivity of the GC/HDC-CuNPs in determining ESC, additional molecules were analyzed. Dopamine, a vital neurotransmitter that is part of the catecholamine family, is essential for the normal operation of the renal, metabolic, hormonal, cardiovascular, and central nervous systems [37]. Increased levels of this molecule in human fluids have been associated with several neurological disorders [37]. Estriol, a steroid estrogenic hormone, plays a significant role in sexual and reproductive functions, as well as in the health of certain organs and bone structure [38]. It is produced in mammals during pregnancy and is particularly significant for women, as it relates to menstruation and the reproductive cycle [39]. Estriol is also found in medications for menopausal urogenital conditions and in contraceptive pills, with urine being the primary excretion pathway [39]. The influence of these molecules on the quantification of ESC in synthetic urine was assessed. During this assessment, the anodic peak of ESC at a concentration of 5.0 μmol L−1 in 100 µL of synthetic urine and 19.9 mL of 0.2 mol L−1 PBS pH 7.0 was observed. Following this, the electrochemical cell was subjected to concentrations of 2.5, 5, and 10.0 μmol L−1 of the interfering substances, and the anodic peak of ESC was analyzed. The findings are presented in Table 4. All examined contaminants exhibited interference with the ESC signal; however, this interference did not exceed 15% of the original ESC signal.

4. Conclusions

A glassy carbon electrode was enhanced through the application of hydrochar obtained from spent coffee grounds and copper nanoparticles for the purpose of detecting escitalopram. The characterization of this nanocomposite involved scanning electron microscopy, energy-dispersive spectroscopy, and cyclic voltammetry, which elucidated the morphological characteristics and the modifications associated with the hydrochar.
Optimization of the parameters was conducted to yield improved responses in the identification of analytes, which subsequently enhanced the sensitivity of the analysis. The limit of detection recorded was 0.23 μmol L−1 for the ESC, with a linear range spanning from 1.0 to 50.0 μmol L−1.
The application of the GC/HDC-CuNPs sensor for the assessment of ESC in synthetic urine resulted in recovery percentages between 91.7% and 94.3%. Finally, a study with interferents was carried out, and signal recoveries between 86.2% and 109% were obtained. This finding underscores the viability of employing a hydrochar-based sensor as a promising alternative for monitoring emerging contaminants, utilizing a sustainable and economical material.

Author Contributions

Conceptualization, F.C.B., Q.H. and I.C.; methodology, F.C.B., N.K.M., E.Y.I. and Q.H.; validation, F.C.B., N.K.M. and E.Y.I.; formal analysis, F.C.B., N.K.M. and E.Y.I.; investigation, F.C.B., N.K.M. and E.Y.I.; resources, Q.H. and I.C.; data curation, F.C.B.; writing—original draft preparation, F.C.B., N.K.M. and E.Y.I.; writing—review and editing, F.C.B., Q.H. and I.C; supervision, F.C.B. and I.C.; project administration, Q.H. and I.C.; funding acquisition, Q.H. and I.C. All authors have read and agreed to the published version of the manuscript.

Funding

This research received funding from the National Sciences and Engineering Research Council Discovery, Canada (grant number NSERC ALLRP 571708-21) and from FAPESP (2022/03762-8 and 2022/03334-6).

Institutional Review Board Statement

Not applicable.

Informed Consent Statement

Not applicable.

Data Availability Statement

Data are available from the authors on reasonable request.

Conflicts of Interest

The authors declare no conflicts of interest.

References

  1. Castillo-Zacarías, C.; Barocio, M.E.; Hidalgo-Vázquez, E.; Sosa-Hernández, J.E.; Parra-Arroyo, L.; López-Pacheco, I.Y.; Barceló, D.; Iqbal, H.N.M.; Parra-Saldívar, R. Antidepressant Drugs as Emerging Contaminants: Occurrence in Urban and Non-Urban Waters and Analytical Methods for Their Detection. Sci. Total Environ. 2021, 757, 143722. [Google Scholar] [CrossRef]
  2. Zhang, K.; Zhou, X.; Liu, H.; Hashimoto, K. Treatment Concerns for Psychiatric Symptoms in Patients with COVID-19 with or without Psychiatric Disorders. Br. J. Psychiatry 2020, 217, 351. [Google Scholar] [CrossRef] [PubMed]
  3. Khan, S.; Siddique, R.; Li, H.; Ali, A.; Shereen, M.A.; Bashir, N.; Xue, M. Impact of Coronavirus Outbreak on Psychological Health. J. Glob. Health 2020, 10, 010331. [Google Scholar] [CrossRef] [PubMed]
  4. Burke, W.J. Escitalopram. Expert Opin. Investig. Drugs 2002, 11, 1477–1486. [Google Scholar] [CrossRef] [PubMed]
  5. Akay, S.; Yang, Y.; Kayan, B. Investigation on the Solubility of the Antidepressant Drug Escitalopram in Subcritical Water. J. Chem. Eng. Data 2021, 66, 2550–2560. [Google Scholar] [CrossRef]
  6. Bareggi, S.R.; Mundo, E.; Dell’Osso, B.; Altamura, A.C. The Use of Escitalopram beyond Major Depression: Pharmacological Aspects, Efficacy and Tolerability in Anxiety Disorders. Expert. Opin. Drug Metab. Toxicol. 2007, 3, 741–753. [Google Scholar] [CrossRef]
  7. Badulla, W.F.; Özcan, S.; Atkoşar, Z.; Arli, G. Study of Electrochemical Behavior of Escitalopram Oxalate Using Hanging Mercury Drop Electrode and Its Determination in Human Urine and Pharmaceuticals. J. Iran. Chem. Soc. 2021, 18, 739–750. [Google Scholar] [CrossRef]
  8. Kumari, M.; Kumar, A. Can Pharmaceutical Drugs Used to Treat COVID-19 Infection Leads to Human Health Risk? A Hypothetical Study to Identify Potential Risk. Sci. Total Environ. 2021, 778, 146303. [Google Scholar] [CrossRef]
  9. Thompson, W.A.; Vijayan, M.M. Antidepressants as Endocrine Disrupting Compounds in Fish. Front. Endocrinol. 2022, 13, 895064. [Google Scholar] [CrossRef]
  10. Al-Amri, F.M.G.; Alarfaj, N.A.; Aly, F.A. Development of New Sensors for Determination of Escitalopram Oxalate in Dosage Forms and Biological Fluids. Int. J. Electrochem. Sci. 2013, 8, 10044–10058. [Google Scholar] [CrossRef]
  11. Attia, A.K.; Mohamed, M.A.; Fekry, A.M. Electroanalytical Determination of Escitalopram Oxalate Using Nickel Nanoparticles Modified Carbon Paste Sensor. Acta Chim. Slov. 2017, 64, 415–421. [Google Scholar] [CrossRef] [PubMed]
  12. Ravi, P.V.; Maharajan, A.; Pattabiraman, A.; Pichumani, M. Straightforward Paper Sensors for the Detection of SSRI Drugs Using Tyrosine Functionalized GQDs: Fluorescence ‘Turn-off’ Turns on the Crucial Dosage Monitoring. Diam. Relat. Mater. 2023, 139, 110407. [Google Scholar] [CrossRef]
  13. Barry, S.C.L.; Franke, C.; Mulaudzi, T.; Pokpas, K.; Ajayi, R.F. Review on Surface-Modified Electrodes for the Enhanced Electrochemical Detection of Selective Serotonin Reuptake Inhibitors (SSRIs). Micromachines 2023, 14, 1334. [Google Scholar] [CrossRef] [PubMed]
  14. Solanki, D.K.; Patel, S.P.; Surati, J.; Akabari, A.; Shah, K.; Sahu, D.; Patel, S. Simultaneous Determiantion of Aripiprazole and Escitalopram Oxalate by HPLC. J. Chem. Metrol. 2023, 17, 128–138. [Google Scholar] [CrossRef]
  15. Perumal, D.; Krishnan, M.; Lakshmi, K.S. Eco-Friendly Based Stability-Indicating HPTLC Technique for the Determination of Escitalopram and Etizolam by Employing Quality by Design Approach. Acta Chromatogr. 2023, 1, 156–167. [Google Scholar] [CrossRef]
  16. Canbolat, F.; Tasdemir Erinç, D.M.; Evrensel, A.; Aydın, A.; Tarhan, K.N. Quantitation of Escitalopram and Its Metabolites by Liquid Chromatography-Tandem Mass Spectrometry in Psychiatric Patients: New Metabolic Ratio Establishment. Basic Clin. Pharmacol. Toxicol. 2019, 124, 285–297. [Google Scholar] [CrossRef]
  17. Hu, Z.; Li, J.; Xiao, A.; Zheng, J.; Guan, S.; Guo, J.; Huang, M. Development and Validation of UHPLC-MS/MS Method for Simultaneous Quantification of Escitalopram and Its Major Metabolites in Human Plasma and Its Application in Depressed Patients. J. Pharm. Biomed. Anal. 2022, 217, 114810. [Google Scholar] [CrossRef]
  18. Das, S.; Chakravorty, A.; Raj, A.; Luktuke, S.; Appu Mini, A.; Awasthi, S.; Sankar Sana, S.; Kumar Pandey, S.; Raghavan, V. Graphene/MWCNT/Copper-Nanoparticle Fabricated Printed Electrode for Diclofenac Detection in Milk and Drinking Water: Electrochemical and in-Silico Analysis. J. Mol. Liq. 2024, 411, 125750. [Google Scholar] [CrossRef]
  19. Barreto, F.C.; Ito, E.Y.; Mounienguet, N.K.; Dal’ Evedove Soares, L.; Yang, J.; He, Q.; Cesarino, I. Electrochemical Sensor Based on Spent Coffee Grounds Hydrochar and Metal Nanoparticles for Simultaneous Detection of Emerging Contaminants in Natural Water. Chemosensors 2023, 11, 562. [Google Scholar] [CrossRef]
  20. Moussa, T.; Maalouf, C.; Bliard, C.; Abbes, B.; Badouard, C.; Lachi, M.; do Socorro Veloso Sodré, S.; Bufalino, L.; Bogard, F.; Beaumont, F.; et al. Spent Coffee Grounds as Building Material for Non-Load-Bearing Structures. Materials 2022, 15, 1689. [Google Scholar] [CrossRef]
  21. Andrade, C.; Perestrelo, R.; Câmara, J.S. Bioactive Compounds and Antioxidant Activity from Spent Coffee Grounds as a Powerful Approach for Its Valorization. Molecules 2022, 27, 7504. [Google Scholar] [CrossRef] [PubMed]
  22. Mutalib, A.A.A.; Jaafar, N.F.; Miskam, M.; Ratvijitvech, T.; Holilah, H.; Torlaema, T.A.M. Utilizing Phytochemical-Rich Spent Coffee Ground Extract for Eco-Friendly ZnO Electrochemical Synthesis: Assessing Photocatalytic Efficacy in 2,4-Dichlorophenol Degradation. Sep. Purif. Technol. 2025, 354, 129208. [Google Scholar] [CrossRef]
  23. Mahmood Al-Nuaimy, M.N.; Azizi, N.; Nural, Y.; Yabalak, E. Recent Advances in Environmental and Agricultural Applications of Hydrochars: A Review. Environ. Res. 2024, 250, 117923. [Google Scholar] [CrossRef] [PubMed]
  24. Jalilian, M.; Bissessur, R.; Ahmed, M.; Hsiao, A.; He, Q.S.; Hu, Y. A Review: Hydrochar as Potential Adsorbents for Wastewater Treatment and CO2 Adsorption. Sci. Total Environ. 2024, 914, 169823. [Google Scholar] [CrossRef]
  25. Santos Santana, M.; Pereira Alves, R.; da Silva Borges, W.M.; Francisquini, E.; Guerreiro, M.C. Hydrochar Production from Defective Coffee Beans by Hydrothermal Carbonization. Bioresour. Technol. 2020, 300, 122653. [Google Scholar] [CrossRef] [PubMed]
  26. Masoumi, S.; Borugadda, V.B.; Nanda, S.; Dalai, A.K. Hydrochar: A Review on Its Production Technologies and Applications. Catalysts 2021, 11, 939. [Google Scholar] [CrossRef]
  27. Welch, C.M.; Compton, R.G. The Use of Nanoparticles in Electroanalysis: A Review. Anal. Bioanal. Chem. 2006, 384, 601–619. [Google Scholar] [CrossRef]
  28. Feng, S.; Xing, X.; Hou, W. Copper Oxide Nanoparticles Modified Electrodes for High-Sensitivity Detection of Uric Acid in Athletes. Alex. Eng. J. 2024, 101, 1–7. [Google Scholar] [CrossRef]
  29. Zohaa; Arif, D.; Hassan, M.; Abdullah, M.; Miran, W.; Nasir, M.A.; Batool, S.; Baig, M.A.; Liaqat, U. An Electrochemical Sensor Based on Copper Oxide Nanoparticles Loaded on a Mesoporous MCM-41 for Non-Enzymatic Detection of Glucose. Ceram. Int. 2024, 50, 12614–12620. [Google Scholar] [CrossRef]
  30. Laube, N.; Mohr, B.; Hesse, A. Laser-Probe-Based Investigation of the Evolution of Particle Size Distributions of Calcium Oxalate Particles Formed in Artificial Urines. J. Cryst. Growth 2001, 233, 367–374. [Google Scholar] [CrossRef]
  31. Afolabi, O.O.D.; Sohail, M.; Cheng, Y.-L. Optimisation and Characterisation of Hydrochar Production from Spent Coffee Grounds by Hydrothermal Carbonisation. Renew. Energy 2020, 147, 1380–1391. [Google Scholar] [CrossRef]
  32. Çalışkan, M.; Akay, S.; Kayan, B.; Baran, T.; Kalderis, D. Preparation and Application of a Hydrochar-Based Palladium Nanocatalyst for the Reduction of Nitroarenes. Molecules 2021, 26, 6859. [Google Scholar] [CrossRef] [PubMed]
  33. Baccarin, M.; Cervini, P.; Cavalheiro, E.T.G. Comparative Performances of a Bare Graphite-Polyurethane Composite Electrode Unmodified and Modified with Graphene and Carbon Nanotubes in the Electrochemical Determination of Escitalopram. Talanta 2018, 178, 1024–1032. [Google Scholar] [CrossRef]
  34. Trindade, C.M.B.; Silva, M.K.L.; Cesarino, I. Copper Nanostructures Anchored on Renewable Carbon as Electrochemical Platform for the Detection of Dopamine, Fluoxetine and Escitalopram. Sens. Actuators Rep. 2022, 4, 100107. [Google Scholar] [CrossRef]
  35. Salomone, A.; Di Corcia, D.; Gerace, E.; Vincenti, M. A Fatal Case of Simultaneous Ingestion of Mirtazapine, Escitalopram, and Valproic Acid. J. Anal. Toxicol. 2011, 35, 519–523. [Google Scholar] [CrossRef]
  36. Johannesson, N.; Bergquist, J. Rapid On-Line Extraction and Quantification of Escitalopram from Urine Using Sol–Gel Columns and Mass Spectrometric Detection. J. Pharm. Biomed. Anal. 2007, 43, 1045–1048. [Google Scholar] [CrossRef]
  37. Kanyong, P.; Rawlinson, S.; Davis, J. A Voltammetric Sensor Based on Chemically Reduced Graphene Oxide-Modified Screen-Printed Carbon Electrode for the Simultaneous Analysis of Uric Acid, Ascorbic Acid and Dopamine. Chemosensors 2016, 4, 25. [Google Scholar] [CrossRef]
  38. Manjunatha, J.G. Electroanalysis of Estriol Hormone Using Electrochemical Sensor. Sens. Bio-Sens. Res. 2017, 16, 79–84. [Google Scholar] [CrossRef]
  39. Barreto, F.C.; Silva, M.K.L.; Cesarino, I. An Electrochemical Sensor Based on Reduced Graphene Oxide and Copper Nanoparticles for Monitoring Estriol Levels in Water Samples after Bioremediation. Chemosensors 2022, 10, 395. [Google Scholar] [CrossRef]
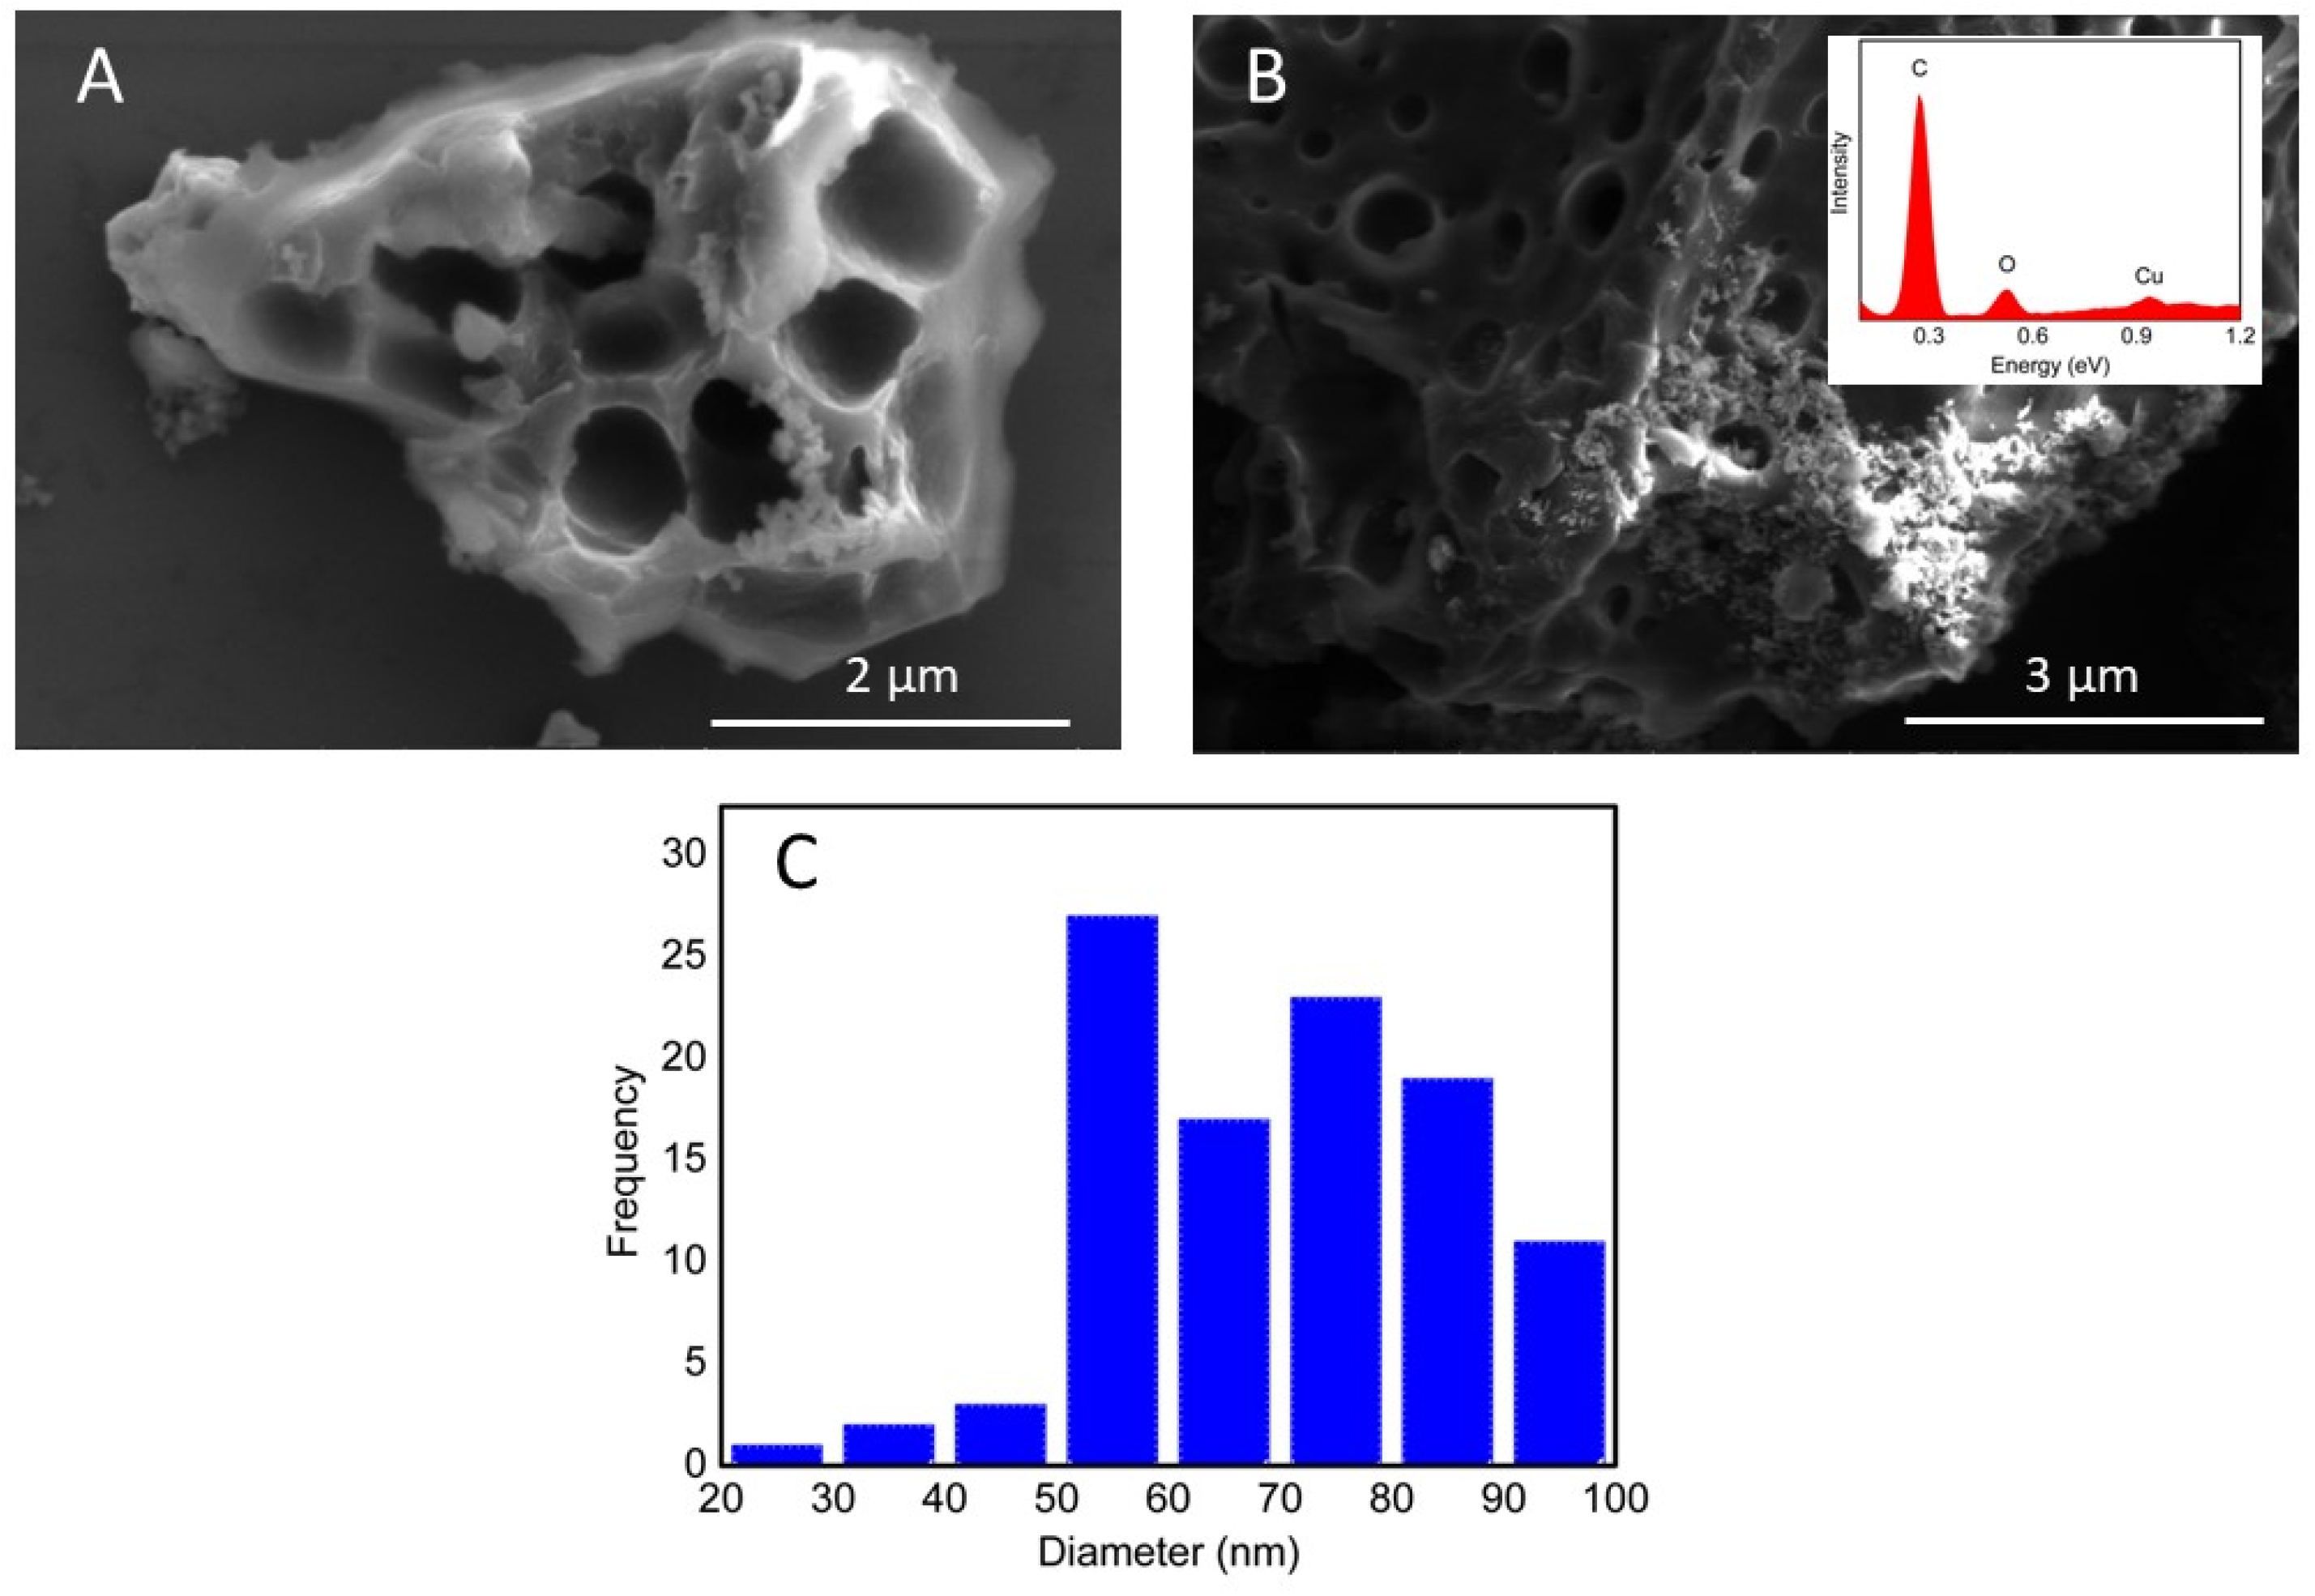
Figure 1. Scanning electron microscopy (SEM) images depict (A) HDC; (B) HDC enhanced with CuNPs (HDC-CuNPs), accompanied by an inset showing the energy-dispersive spectroscopy (EDS) spectrum; and (C) the measurements of the diameters of the copper nanoparticles.
Chemosensors 12 00205 g001
Figure 2. The electrochemical characterization was conducted using CV at a scan rate of 50 mV s−1 for the GC, GC/HDC, and GC/HDC-CuNPs electrodes in a PBS solution with a concentration of 0.2 mol L−1 and a pH of 7.0.
Chemosensors 12 00205 g002
Figure 3. Different working electrodes were evaluated using cyclic voltammetry (CV) at a scan rate of 50 mV s−1 in a phosphate-buffered saline (PBS) solution with a concentration of 0.2 mol L−1 and a pH of 7.4, which contained 5.0 × 10⁻³ mol L−1 of potassium ferricyanide/ferrocyanide.
Chemosensors 12 00205 g003
Figure 4. Comparison among the SWV voltammograms of GC, GC/HDC and GC/HDC-CuNPs in 0.2 μmol L−1 PBS pH 7.0 in the oxidation of 50 μmol L−1 of ESC.
Chemosensors 12 00205 g004
Figure 5. The cyclic voltammograms obtained with 100.0 μmol L−1 of ESC (indicated by the blue line) is compared to the voltammogram recorded without ESC (represented by the dotted line) in a 0.2 mol L−1 PBS at a pH of 7.0, utilizing a scan rate of 50 mV s−1 (inset: illustrates the oxidation mechanism of the molecule).
Chemosensors 12 00205 g005
Figure 6. Optimization experiments conducted to enhance the analytical signal for the oxidation of ESC. The following parameters were studied: (A) the optimization of the copper proportion relative to the mass of HDC; (B) the optimization of frequency; (C) the optimization of amplitude modulation; (D) the optimization of step potential; and (E) the optimal pH for the study of ESC utilizing the GC/HDC-CuNPs electrode.
Chemosensors 12 00205 g006
Figure 7. (A) Depicts the results of square-wave voltammetry (SWV) performed in a 0.2 mol L−1 PBS solution at a pH of 7.0, with ESC concentrations ranging from 1.0 to 50.0 μmol L−1. (B) Demonstrates the linear relationship observed between anodic peak currents and ESC concentration.
Chemosensors 12 00205 g007
Figure 8. (A) SWV was executed in PBS at a concentration of 0.2 mol L−1 and a pH of 7.0, incorporating a sample of synthetic urine with a final concentration of 3.00 μmol L−1 of ESC (depicted by the red line) alongside three additions of a known concentration of the standard analyte (1.00 μmol L−1 for each addition). (B) The graph illustrates the linear correlation between the anodic peak currents and the concentrations of ESC.
Chemosensors 12 00205 g008
Table 1. The electrochemical parameters derived from cyclic voltammetry (CV) measurements were recorded utilizing different working electrodes. The experimental setup included a PBS solution at a concentration of 0.2 mol L−1, adjusted to a pH of 7.4, and a potassium ferricyanide/ferrocyanide concentration of 5.0 × 10⁻³ mol L−1.
Modified ElectrodeEpa (mV)Epc (mV)Ep (mV)Ipa (µA)Ipc (µA)Ipa/Ipc
GC510550567.32−66.641.01
GC/HDC4008231888.01−70.191.25
GC/HDC-CuNPs295181114115.51−109.471.06
Table 2. The voltammetric analysis of ESC has been enhanced through the optimization of parameters associated with the HDC-CuNPs electrode and the SWV technique.
ParametersTested RangeOptimized Values
Cu/HDC proportion in the synthesis (%)20–4025%
Frequency (Hz)20–4530
Modulation amplitude (V)0.01–0.070.05
Step potential (V)0.001–0.0100.007
pH5–97
Table 3. The quantification results for 3.00 μmol L−1 of ESC in synthetic urine were obtained using a 0.2 mol L−1 PBS solution at a pH of 7.0.
RepetitionESC (µmol L−1)Relative Errors (%)
12.83−5.7%
22.75−8.3%
32.77−7.7%
Mean ± SD2.78 ± 0.03-
Table 4. Influence of dopamine and estriol on the anodic peak of ESC by SWV in 0.2 mol L−1 PBS pH 7.0.
InterferentsConcentration (µmol L−1)% ESC Signal
Dopamine2.595.8
592.0
1086.2
Estriol2.5103.1
5107.5
10109.5
Disclaimer/Publisher’s Note: The statements, opinions and data contained in all publications are solely those of the individual author(s) and contributor(s) and not of MDPI and/or the editor(s). MDPI and/or the editor(s) disclaim responsibility for any injury to people or property resulting from any ideas, methods, instructions or products referred to in the content.